
Snip7r
2.2k Posts

Snip7r
Report
Block User
Cutting through the noise with sharp crypto insights. long-term strategies, actionable analysis, educating the next wave of smart traders

#BinanceTurns7 task 2

#BinanceTurns7
Open Trade
Frequent Trader
8.6 Years
11 Following
5.0K+ Followers
6.4K+ Liked
2 Badges
Posts
Portfolio
All
Quotes
Videos
PINNED
·
--
Verified
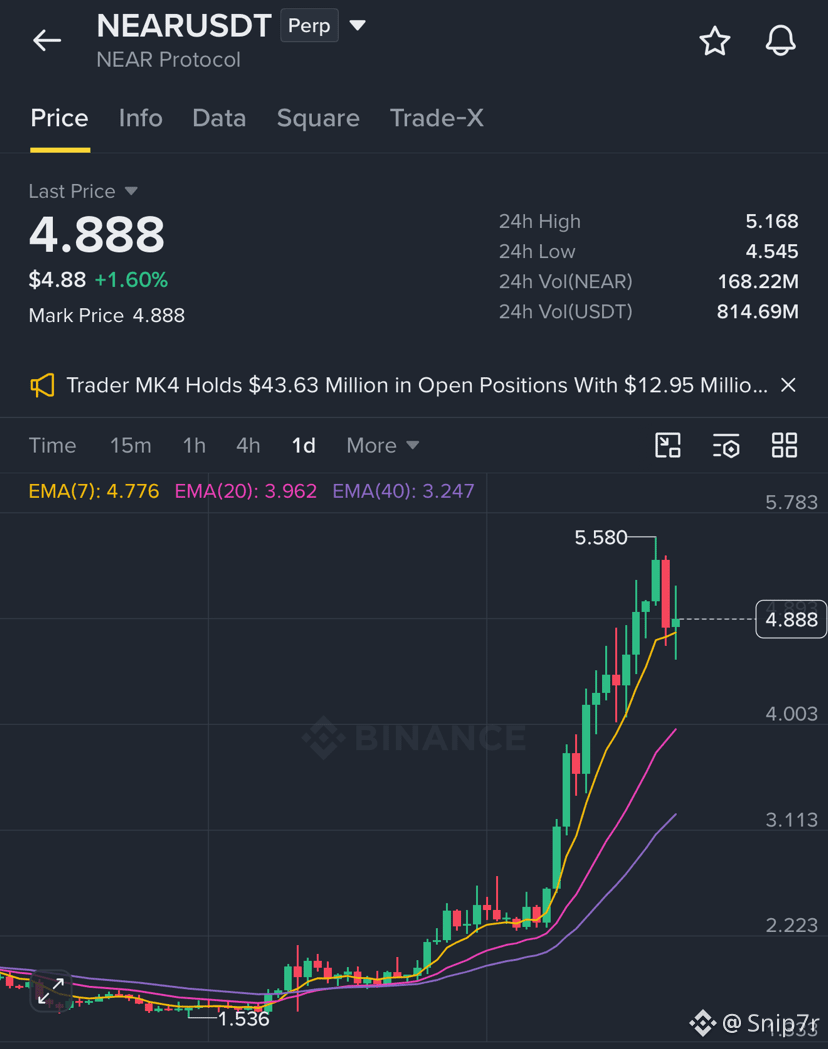
NEAR’s $20 discussion has a fresh catalyst: Bitwise launched its NEAR ETF, ticker NRR, on NYSE Arca on September 29, 2026, bringing spot exposure to U.S. brokerage investors.
The historical high sits around $20.42. From roughly $4.96, reaching $20 requires another 303% gain, making this an ambitious longer-term target.
First, buyers need to reclaim $5.17 and clear $5.58. A daily close above $5.58 followed by a successful retest would strengthen the case for $6.
Support sits near $4.55, then $4.00. Daily RSI above 70 signals stretched momentum. Losing $4.55 raises the risk of a deeper pullback.
ETF access strengthens the growth story. Sustained inflows and buying demand will determine whether price follows.
#BitwiseLaunchesFirstSpotNEARETF
NEAR’s $20 discussion has a fresh catalyst: Bitwise launched its NEAR ETF, ticker NRR, on NYSE Arca on September 29, 2026, bringing spot exposure to U.S. brokerage investors.
The historical high sits around $20.42. From roughly $4.96, reaching $20 requires another 303% gain, making this an ambitious longer-term target.
First, buyers need to reclaim $5.17 and clear $5.58. A daily close above $5.58 followed by a successful retest would strengthen the case for $6.
Support sits near $4.55, then $4.00. Daily RSI above 70 signals stretched momentum. Losing $4.55 raises the risk of a deeper pullback.
ETF access strengthens the growth story. Sustained inflows and buying demand will determine whether price follows.
#BitwiseLaunchesFirstSpotNEARETF
The historical high sits around $20.42. From roughly $4.96, reaching $20 requires another 303% gain, making this an ambitious longer-term target.
First, buyers need to reclaim $5.17 and clear $5.58. A daily close above $5.58 followed by a successful retest would strengthen the case for $6.
Support sits near $4.55, then $4.00. Daily RSI above 70 signals stretched momentum. Losing $4.55 raises the risk of a deeper pullback.
ETF access strengthens the growth story. Sustained inflows and buying demand will determine whether price follows.
#BitwiseLaunchesFirstSpotNEARETF
16
1
34
39.5k
·
--
$PEPE
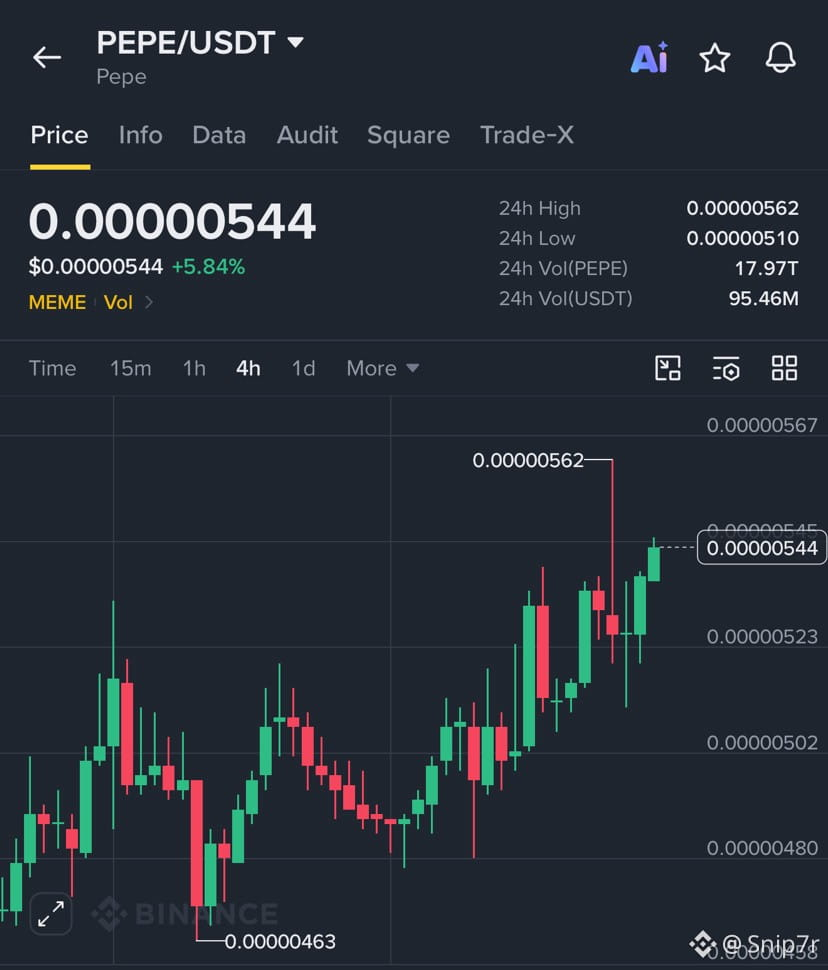
While BTC remains under pressure from CPI data and market uncertainty, PEPE seems to be moving in the opposite direction.
PEPE is up over 5%, trading around $0.00000544, and its 4-hour chart is showing something interesting: higher lows, higher highs, and steady buying momentum.
Instead of breaking down with BTC, PEPE keeps building upward, suggesting buyers are gradually gaining control.
Key levels to watch:
Resistance: $0.00000562. A breakout could open the door toward $0.00000580–$0.00000600.
Immediate support: $0.00000523.
Stronger support: $0.00000502.
The interesting part is PEPE’s relative strength. If BTC stabilizes, PEPE could have room for another upward move.
However, a strong 4-hour close above resistance with increasing volume would provide better confirmation. This is still an early bullish setup, not a confirmed major reversal.
#HotCPIDecemberHikePriced
$PEPE
While BTC remains under pressure from CPI data and market uncertainty, PEPE seems to be moving in the opposite direction.
PEPE is up over 5%, trading around $0.00000544, and its 4-hour chart is showing something interesting: higher lows, higher highs, and steady buying momentum.
Instead of breaking down with BTC, PEPE keeps building upward, suggesting buyers are gradually gaining control.
Key levels to watch:
Resistance: $0.00000562. A breakout could open the door toward $0.00000580–$0.00000600.
Immediate support: $0.00000523.
Stronger support: $0.00000502.
The interesting part is PEPE’s relative strength. If BTC stabilizes, PEPE could have room for another upward move.
However, a strong 4-hour close above resistance with increasing volume would provide better confirmation. This is still an early bullish setup, not a confirmed major reversal.
#HotCPIDecemberHikePriced
While BTC remains under pressure from CPI data and market uncertainty, PEPE seems to be moving in the opposite direction.
PEPE is up over 5%, trading around $0.00000544, and its 4-hour chart is showing something interesting: higher lows, higher highs, and steady buying momentum.
Instead of breaking down with BTC, PEPE keeps building upward, suggesting buyers are gradually gaining control.
Key levels to watch:
Resistance: $0.00000562. A breakout could open the door toward $0.00000580–$0.00000600.
Immediate support: $0.00000523.
Stronger support: $0.00000502.
The interesting part is PEPE’s relative strength. If BTC stabilizes, PEPE could have room for another upward move.
However, a strong 4-hour close above resistance with increasing volume would provide better confirmation. This is still an early bullish setup, not a confirmed major reversal.
#HotCPIDecemberHikePriced
1
138
·
--
SOL Near $80: A Buying Opportunity or More Pain Ahead?$SOL is now trading around $83, after recently
touching $81.34. Just a few days ago, SOL was approaching $100. This is a painful correction, but it could also create opportunities for patient investors.
The biggest problem isn’t necessarily Solana itself. It’s the overall market environment.
Three major factors are putting pressure on SOL:
BTC weakness: SOL continues to follow BTC’s direction, often falling harder when BTC drops. With BTC struggling around $73K, altcoins remain vulnerable.Higher-than-expected CPI: US inflation rose 0.4% in October, above the 0.3% forecast. This increases concerns about higher interest rates and puts additional pressure on risk assets.War and geopolitical uncertainty: Ongoing tensions, energy prices, and uncertainty surrounding global markets are making investors more cautious.
Where could SOL go next?
$80–$82: Immediate support and an area worth watching for gradual accumulation.$75–$78: Potential next accumulation zone if $80 breaks.$70: A deeper downside scenario if BTC continues falling.$85–$88: First resistance area SOL needs to reclaim.$90–$98: Possible recovery targets if market sentiment improves.
At these prices, I see an opportunity to build a long-term SOL position, but I wouldn’t rush to deploy all my capital.
Start with small spot positions, keep cash available, and add gradually if the market offers better prices. There is no need to catch the exact bottom.
Most importantly, keep watching BTC. If BTC loses $73K and moves toward $70K, SOL could face another wave of selling.
The market may remain uncertain for some time. However, for investors who believe in Solana’s long-term ecosystem, lower prices can offer opportunities to accumulate at a better average cost.
Patience matters more than timing. Accumulate gradually, manage your risk, and never go all-in on the first dip.
What’s your SOL accumulation zone: $80, $75, or $70?
{spot}(SOLUSDT)
#BinancePick #HotCPIDecemberHikePriced
SOL Near $80: A Buying Opportunity or More Pain Ahead?
$SOL is now trading around $83, after recently
touching $81.34. Just a few days ago, SOL was approaching $100. This is a painful correction, but it could also create opportunities for patient investors.
The biggest problem isn’t necessarily Solana itself. It’s the overall market environment.
Three major factors are putting pressure on SOL:
BTC weakness: SOL continues to follow BTC’s direction, often falling harder when BTC drops. With BTC struggling around $73K, altcoins remain vulnerable.Higher-than-expected CPI: US inflation rose 0.4% in October, above the 0.3% forecast. This increases concerns about higher interest rates and puts additional pressure on risk assets.War and geopolitical uncertainty: Ongoing tensions, energy prices, and uncertainty surrounding global markets are making investors more cautious.
Where could SOL go next?
$80–$82: Immediate support and an area worth watching for gradual accumulation.$75–$78: Potential next accumulation zone if $80 breaks.$70: A deeper downside scenario if BTC continues falling.$85–$88: First resistance area SOL needs to reclaim.$90–$98: Possible recovery targets if market sentiment improves.
At these prices, I see an opportunity to build a long-term SOL position, but I wouldn’t rush to deploy all my capital.
Start with small spot positions, keep cash available, and add gradually if the market offers better prices. There is no need to catch the exact bottom.
Most importantly, keep watching BTC. If BTC loses $73K and moves toward $70K, SOL could face another wave of selling.
The market may remain uncertain for some time. However, for investors who believe in Solana’s long-term ecosystem, lower prices can offer opportunities to accumulate at a better average cost.
Patience matters more than timing. Accumulate gradually, manage your risk, and never go all-in on the first dip.
What’s your SOL accumulation zone: $80, $75, or $70?
#BinancePick #HotCPIDecemberHikePriced
touching $81.34. Just a few days ago, SOL was approaching $100. This is a painful correction, but it could also create opportunities for patient investors.
The biggest problem isn’t necessarily Solana itself. It’s the overall market environment.
Three major factors are putting pressure on SOL:
BTC weakness: SOL continues to follow BTC’s direction, often falling harder when BTC drops. With BTC struggling around $73K, altcoins remain vulnerable.Higher-than-expected CPI: US inflation rose 0.4% in October, above the 0.3% forecast. This increases concerns about higher interest rates and puts additional pressure on risk assets.War and geopolitical uncertainty: Ongoing tensions, energy prices, and uncertainty surrounding global markets are making investors more cautious.
Where could SOL go next?
$80–$82: Immediate support and an area worth watching for gradual accumulation.$75–$78: Potential next accumulation zone if $80 breaks.$70: A deeper downside scenario if BTC continues falling.$85–$88: First resistance area SOL needs to reclaim.$90–$98: Possible recovery targets if market sentiment improves.
At these prices, I see an opportunity to build a long-term SOL position, but I wouldn’t rush to deploy all my capital.
Start with small spot positions, keep cash available, and add gradually if the market offers better prices. There is no need to catch the exact bottom.
Most importantly, keep watching BTC. If BTC loses $73K and moves toward $70K, SOL could face another wave of selling.
The market may remain uncertain for some time. However, for investors who believe in Solana’s long-term ecosystem, lower prices can offer opportunities to accumulate at a better average cost.
Patience matters more than timing. Accumulate gradually, manage your risk, and never go all-in on the first dip.
What’s your SOL accumulation zone: $80, $75, or $70?
#BinancePick #HotCPIDecemberHikePriced
159
·
--
$BTC is under pressure again after US inflation came in hotter than expected. The price briefly dropped to $72,727 before recovering to around $73,592.
Looking at the 4-hour chart, BTC is still struggling. Since reaching $81,196, the price has continued making lower highs and lower lows, showing that sellers remain in control.
The higher CPI reading isn’t helping either. It could make the Fed more cautious about cutting interest rates, putting additional pressure on BTC and the broader crypto market.
For now, $72,700–$73,000 is the key support zone. If BTC fails to hold this area, we could see another move toward $70K.
On the upside, BTC needs to recover above $74,200 first, followed by $75,500–$76,000, before we can expect a stronger recovery.
The small bounce from $72,727 is a positive sign, but it’s not enough to confirm a reversal. Buying volume remains relatively weak, and the overall trend is still bearish.
The next move around $73K matters. If buyers defend it, BTC could see a short-term recovery. But if this level breaks with strong selling volume, $70K becomes a serious possibility. DYOR.
#HotCPIDecemberHikePriced
$BTC is under pressure again after US inflation came in hotter than expected. The price briefly dropped to $72,727 before recovering to around $73,592.
Looking at the 4-hour chart, BTC is still struggling. Since reaching $81,196, the price has continued making lower highs and lower lows, showing that sellers remain in control.
The higher CPI reading isn’t helping either. It could make the Fed more cautious about cutting interest rates, putting additional pressure on BTC and the broader crypto market.
For now, $72,700–$73,000 is the key support zone. If BTC fails to hold this area, we could see another move toward $70K.
On the upside, BTC needs to recover above $74,200 first, followed by $75,500–$76,000, before we can expect a stronger recovery.
The small bounce from $72,727 is a positive sign, but it’s not enough to confirm a reversal. Buying volume remains relatively weak, and the overall trend is still bearish.
The next move around $73K matters. If buyers defend it, BTC could see a short-term recovery. But if this level breaks with strong selling volume, $70K becomes a serious possibility. DYOR.
#HotCPIDecemberHikePriced
Looking at the 4-hour chart, BTC is still struggling. Since reaching $81,196, the price has continued making lower highs and lower lows, showing that sellers remain in control.
The higher CPI reading isn’t helping either. It could make the Fed more cautious about cutting interest rates, putting additional pressure on BTC and the broader crypto market.
For now, $72,700–$73,000 is the key support zone. If BTC fails to hold this area, we could see another move toward $70K.
On the upside, BTC needs to recover above $74,200 first, followed by $75,500–$76,000, before we can expect a stronger recovery.
The small bounce from $72,727 is a positive sign, but it’s not enough to confirm a reversal. Buying volume remains relatively weak, and the overall trend is still bearish.
The next move around $73K matters. If buyers defend it, BTC could see a short-term recovery. But if this level breaks with strong selling volume, $70K becomes a serious possibility. DYOR.
#HotCPIDecemberHikePriced
2
271
·
--
US CPI Release at 8:30 AM ET — Potential Impact on BTC, ETH and SOL
The market is closely watching today’s US CPI report, with annual inflation expected at 3.9%, up from the previous 3.7%.
Here are three possible market scenarios:
🟢 CPI below 3.9%: A positive surprise could support a crypto market rebound, potentially pushing BTC, ETH and SOL higher.
🟡 CPI at 3.9%: Inflation meets expectations. BTC, ETH and SOL may experience sharp swings in both directions as traders assess the data.
🔴 CPI above 3.9%: Higher-than-expected inflation could trigger selling pressure, potentially pushing BTC, ETH and SOL lower.
Key takeaway: BTC will be the main indicator to watch, while ETH and SOL could experience larger percentage movements.
Expect increased volatility around the release. Market reactions will also depend on core inflation and broader investor sentiment.
#CPITestsDecemberRateOutlook
US CPI Release at 8:30 AM ET — Potential Impact on BTC, ETH and SOL
The market is closely watching today’s US CPI report, with annual inflation expected at 3.9%, up from the previous 3.7%.
Here are three possible market scenarios:
🟢 CPI below 3.9%: A positive surprise could support a crypto market rebound, potentially pushing BTC, ETH and SOL higher.
🟡 CPI at 3.9%: Inflation meets expectations. BTC, ETH and SOL may experience sharp swings in both directions as traders assess the data.
🔴 CPI above 3.9%: Higher-than-expected inflation could trigger selling pressure, potentially pushing BTC, ETH and SOL lower.
Key takeaway: BTC will be the main indicator to watch, while ETH and SOL could experience larger percentage movements.
Expect increased volatility around the release. Market reactions will also depend on core inflation and broader investor sentiment.
#CPITestsDecemberRateOutlook
The market is closely watching today’s US CPI report, with annual inflation expected at 3.9%, up from the previous 3.7%.
Here are three possible market scenarios:
🟢 CPI below 3.9%: A positive surprise could support a crypto market rebound, potentially pushing BTC, ETH and SOL higher.
🟡 CPI at 3.9%: Inflation meets expectations. BTC, ETH and SOL may experience sharp swings in both directions as traders assess the data.
🔴 CPI above 3.9%: Higher-than-expected inflation could trigger selling pressure, potentially pushing BTC, ETH and SOL lower.
Key takeaway: BTC will be the main indicator to watch, while ETH and SOL could experience larger percentage movements.
Expect increased volatility around the release. Market reactions will also depend on core inflation and broader investor sentiment.
#CPITestsDecemberRateOutlook
2
3
2.1k
·
--
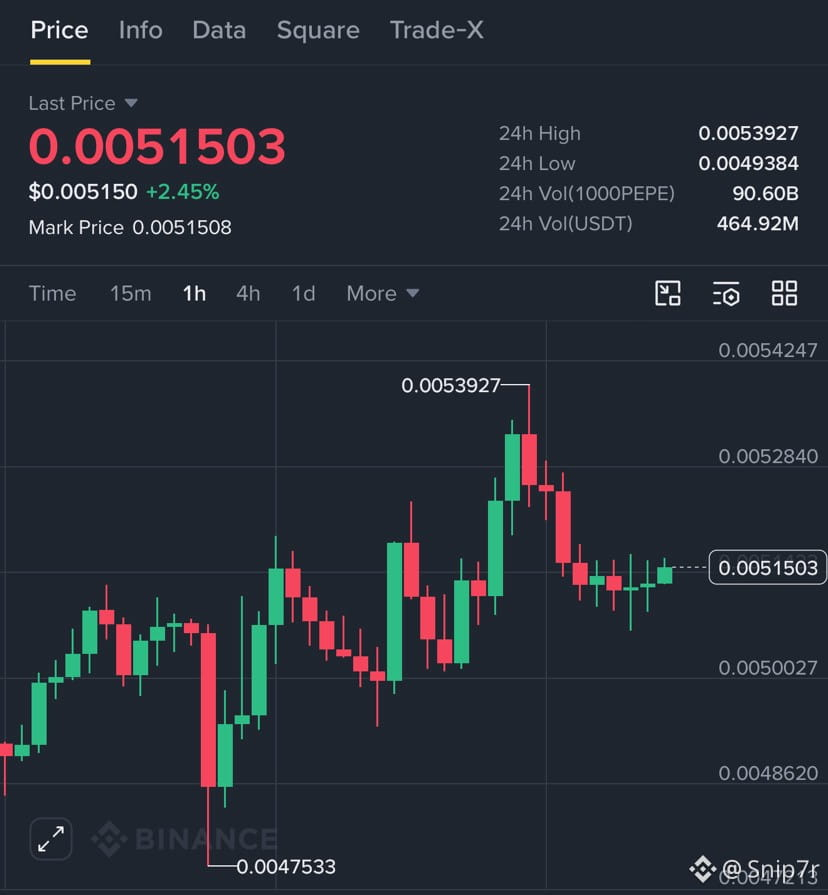
$1000PEPE is currently trading around $0.00515 (1000PEPE), up 2.45%. It recently climbed to $0.00539 before pulling back, and now the price seems to be stabilizing.
I wouldn’t rush into a long position just yet. Trading volume is slowing down, which tells us buyers are still cautious.
I’m watching the $0.00505–$0.00510 zone for a possible entry if support holds. If PEPE bounces from there, the next targets could be $0.00525 and $0.00539.
However, if it drops below $0.00500, we could see another decline toward $0.00485.
For now, patience is better than chasing the price. Also, keep an eye on BTC because any sudden move could easily affect PEPE.
Entry: $0.00505–$0.00510
Take Profit: $0.00525 / $0.00539
Stop Loss: $0.00494
DYOR. NFA
#BinancePick
$1000PEPE is currently trading around $0.00515 (1000PEPE), up 2.45%. It recently climbed to $0.00539 before pulling back, and now the price seems to be stabilizing.
I wouldn’t rush into a long position just yet. Trading volume is slowing down, which tells us buyers are still cautious.
I’m watching the $0.00505–$0.00510 zone for a possible entry if support holds. If PEPE bounces from there, the next targets could be $0.00525 and $0.00539.
However, if it drops below $0.00500, we could see another decline toward $0.00485.
For now, patience is better than chasing the price. Also, keep an eye on BTC because any sudden move could easily affect PEPE.
Entry: $0.00505–$0.00510
Take Profit: $0.00525 / $0.00539
Stop Loss: $0.00494
DYOR. NFA
#BinancePick
I wouldn’t rush into a long position just yet. Trading volume is slowing down, which tells us buyers are still cautious.
I’m watching the $0.00505–$0.00510 zone for a possible entry if support holds. If PEPE bounces from there, the next targets could be $0.00525 and $0.00539.
However, if it drops below $0.00500, we could see another decline toward $0.00485.
For now, patience is better than chasing the price. Also, keep an eye on BTC because any sudden move could easily affect PEPE.
Entry: $0.00505–$0.00510
Take Profit: $0.00525 / $0.00539
Stop Loss: $0.00494
DYOR. NFA
#BinancePick
520
·
--
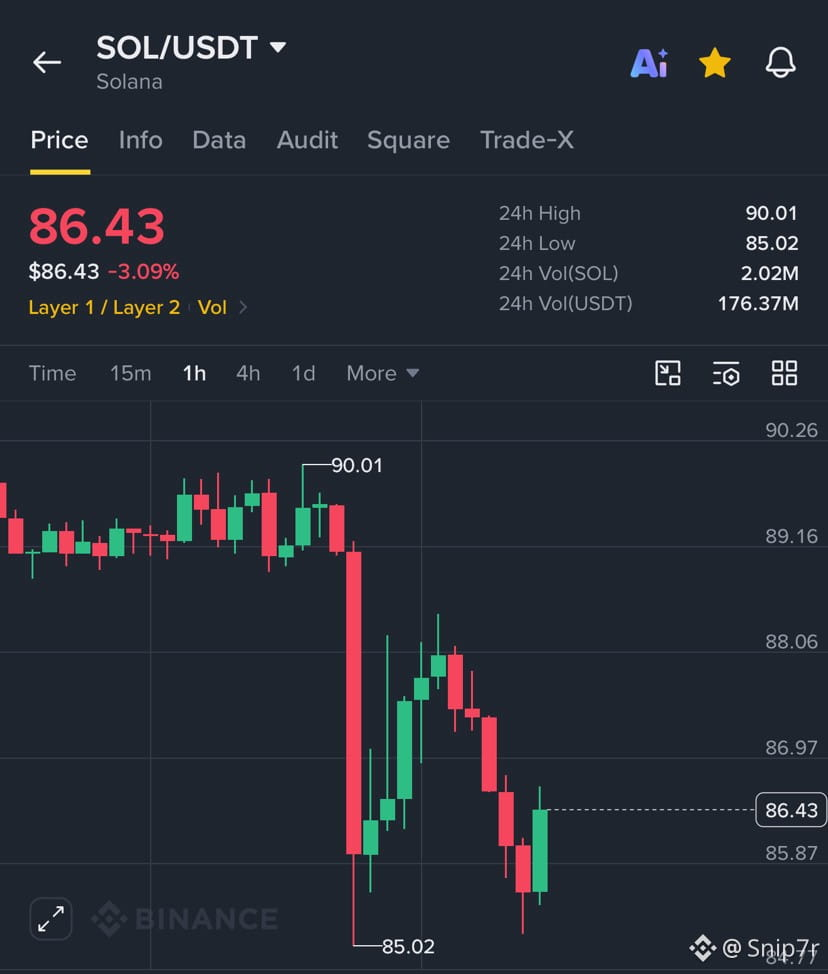
$SOL Drops to $85 — But BTC Is the Bigger Concern Now!
SOL has fallen sharply from $90 to $85.02 before recovering slightly to $86.43. The 1-hour chart shows heavy selling pressure, and the recovery is still weak.
The bigger concern isn’t just SOL. It’s whether BTC can hold its key support levels.
SOL is showing signs of weakness:
* $85: Critical short-term support. A breakdown could trigger another wave of selling.
* $82–83: Next potential downside zone if $85 fails.
* $88–90: Key resistance. SOL needs to reclaim this area to improve its short-term structure.
Why BTC matters more:
When BTC loses support, altcoins like SOL often fall harder as traders reduce risk. Even if SOL holds $85 temporarily, another BTC sell-off could push it lower.
For now, I would watch BTC’s direction before trusting any SOL rebound. A green candle doesn’t necessarily mean the correction is over.
#BitcoinFiveWeeklyLosses
$SOL Drops to $85 — But BTC Is the Bigger Concern Now!
SOL has fallen sharply from $90 to $85.02 before recovering slightly to $86.43. The 1-hour chart shows heavy selling pressure, and the recovery is still weak.
The bigger concern isn’t just SOL. It’s whether BTC can hold its key support levels.
SOL is showing signs of weakness:
* $85: Critical short-term support. A breakdown could trigger another wave of selling.
* $82–83: Next potential downside zone if $85 fails.
* $88–90: Key resistance. SOL needs to reclaim this area to improve its short-term structure.
Why BTC matters more:
When BTC loses support, altcoins like SOL often fall harder as traders reduce risk. Even if SOL holds $85 temporarily, another BTC sell-off could push it lower.
For now, I would watch BTC’s direction before trusting any SOL rebound. A green candle doesn’t necessarily mean the correction is over.
#BitcoinFiveWeeklyLosses
SOL has fallen sharply from $90 to $85.02 before recovering slightly to $86.43. The 1-hour chart shows heavy selling pressure, and the recovery is still weak.
The bigger concern isn’t just SOL. It’s whether BTC can hold its key support levels.
SOL is showing signs of weakness:
* $85: Critical short-term support. A breakdown could trigger another wave of selling.
* $82–83: Next potential downside zone if $85 fails.
* $88–90: Key resistance. SOL needs to reclaim this area to improve its short-term structure.
Why BTC matters more:
When BTC loses support, altcoins like SOL often fall harder as traders reduce risk. Even if SOL holds $85 temporarily, another BTC sell-off could push it lower.
For now, I would watch BTC’s direction before trusting any SOL rebound. A green candle doesn’t necessarily mean the correction is over.
#BitcoinFiveWeeklyLosses
72
·
--
Bearish
😂 Midterms hit AI stocks and crypto so hard, even AI decided Trump needed a warm pillow and teddy bear pajamas instead of another market prediction.
BTC is falling, ETH is bleeding, AI stocks are shaking, and Trump looks ready to sleep through the entire market crash. 🧸💤
Forget the charts tonig
#BitcoinFiveWeeklyLosses
😂 Midterms hit AI stocks and crypto so hard, even AI decided Trump needed a warm pillow and teddy bear pajamas instead of another market prediction.
BTC is falling, ETH is bleeding, AI stocks are shaking, and Trump looks ready to sleep through the entire market crash. 🧸💤
Forget the charts tonig
#BitcoinFiveWeeklyLosses
BTC is falling, ETH is bleeding, AI stocks are shaking, and Trump looks ready to sleep through the entire market crash. 🧸💤
Forget the charts tonig
#BitcoinFiveWeeklyLosses

125
·
--
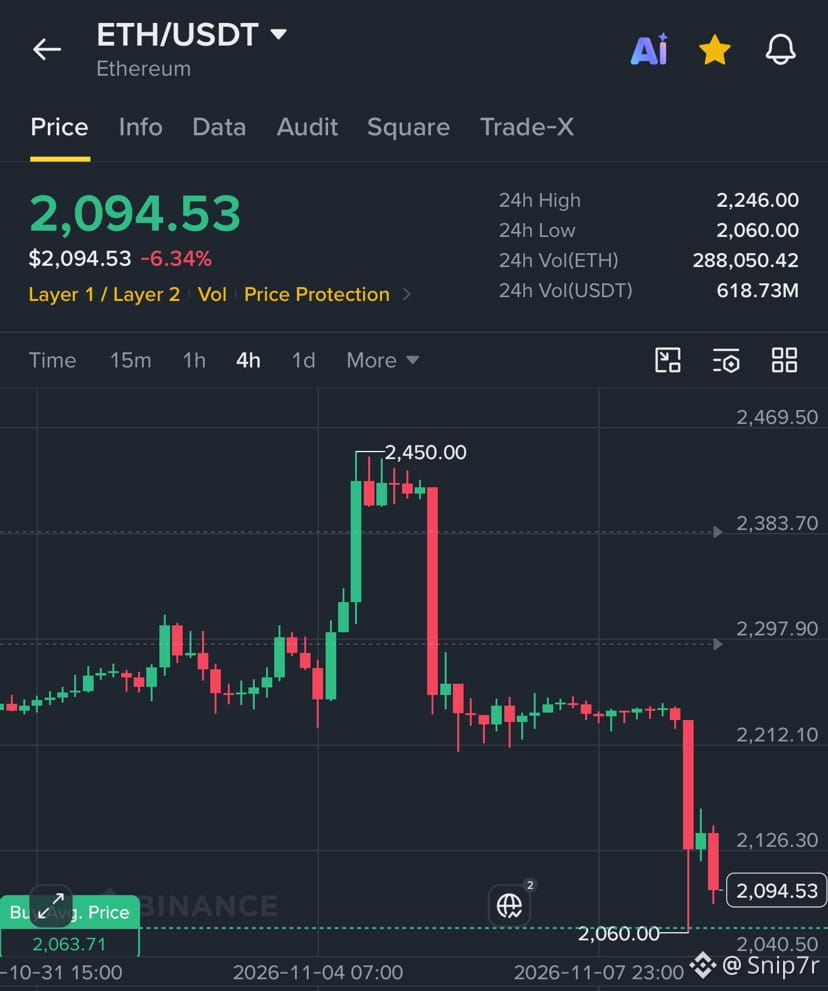
$ETH Could Drop to $1,950 Next!
ETH is struggling to hold $2,100 after dropping more than 6% in 24 hours. Selling pressure remains strong, and the 4H chart continues to show bearish momentum.
ETH recently dropped from $2,450 to $2,060, with heavy selling volume and little sign of a strong recovery.
The next important support is around $2,040–$2,060. If ETH breaks below this zone, $2,000 could be tested quickly, followed by $1,950.
On the upside, ETH needs to recover above $2,125 and eventually $2,212 to regain some bullish momentum.
With BTC also under pressure and investors remaining cautious, ETH could face further downside.
I think $1,950 is a realistic next target if $2,000 fails to hold. But a strong bounce from current support could delay that move.
Will ETH defend $2,000, or are we heading toward $1,950?
#EthereumSpotETFsPost$365MWeeklyOutflow
$ETH Could Drop to $1,950 Next!
ETH is struggling to hold $2,100 after dropping more than 6% in 24 hours. Selling pressure remains strong, and the 4H chart continues to show bearish momentum.
ETH recently dropped from $2,450 to $2,060, with heavy selling volume and little sign of a strong recovery.
The next important support is around $2,040–$2,060. If ETH breaks below this zone, $2,000 could be tested quickly, followed by $1,950.
On the upside, ETH needs to recover above $2,125 and eventually $2,212 to regain some bullish momentum.
With BTC also under pressure and investors remaining cautious, ETH could face further downside.
I think $1,950 is a realistic next target if $2,000 fails to hold. But a strong bounce from current support could delay that move.
Will ETH defend $2,000, or are we heading toward $1,950?
#EthereumSpotETFsPost$365MWeeklyOutflow
ETH is struggling to hold $2,100 after dropping more than 6% in 24 hours. Selling pressure remains strong, and the 4H chart continues to show bearish momentum.
ETH recently dropped from $2,450 to $2,060, with heavy selling volume and little sign of a strong recovery.
The next important support is around $2,040–$2,060. If ETH breaks below this zone, $2,000 could be tested quickly, followed by $1,950.
On the upside, ETH needs to recover above $2,125 and eventually $2,212 to regain some bullish momentum.
With BTC also under pressure and investors remaining cautious, ETH could face further downside.
I think $1,950 is a realistic next target if $2,000 fails to hold. But a strong bounce from current support could delay that move.
Will ETH defend $2,000, or are we heading toward $1,950?
#EthereumSpotETFsPost$365MWeeklyOutflow
97
·
--
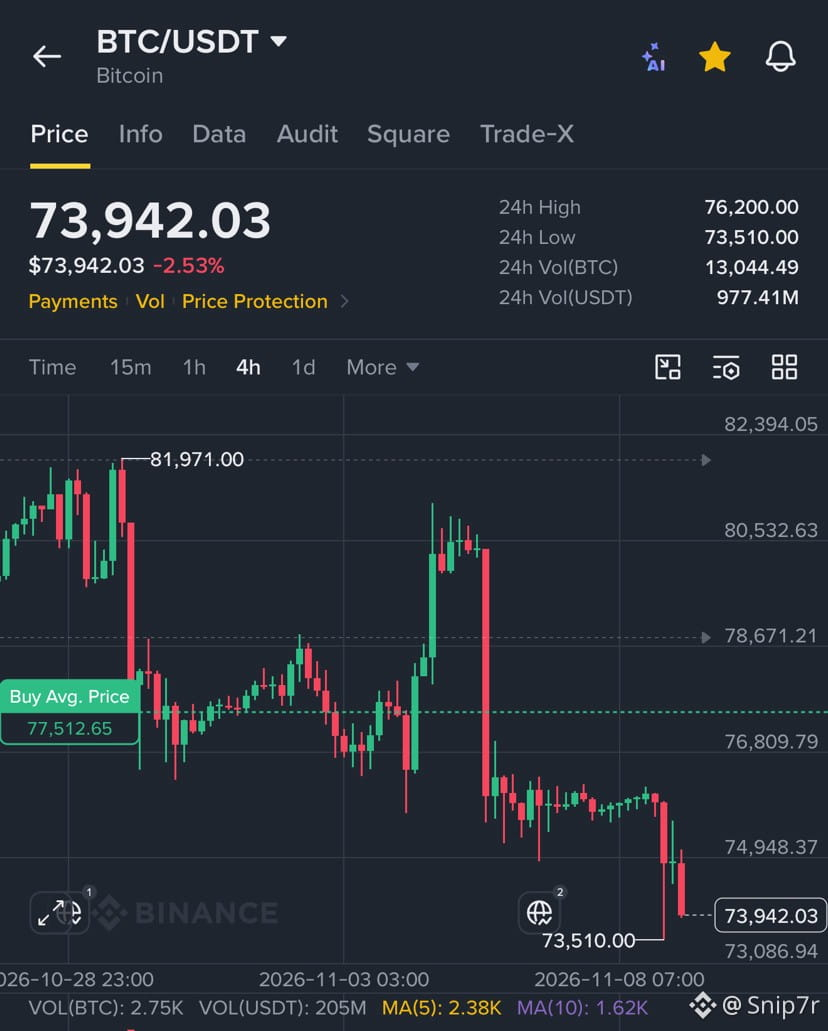
BTC at $74K — Is $70K Coming Next?
BTC is struggling to hold $74,000, and I think we could see another move toward $70,000 if selling pressure continues.
Looking at the 4-hour chart, BTC keeps making lower highs and lower lows. The recent drop to $73,510 shows that buyers are still struggling to defend support.
It’s not just technical weakness. The broader market is under pressure too.
Recent reports show that Bitcoin ETFs have experienced heavy outflows, while uncertainty following the US midterm elections, weakness in AI stocks, and growing expectations of a Fed rate hike are making investors more cautious.
The key level I’m watching is $73,000–$73,500. If Bitcoin breaks below this area and fails to recover, $72,000 could be next, followed by $70,000.
On the upside, BTC needs to reclaim $75,000–$76,800 to improve short-term momentum.
I don’t think $70K is guaranteed, but the current market conditions make it a realistic target. With US inflation data approaching, volatility could increase further.
#BitcoinFiveWeeklyLosses
BTC at $74K — Is $70K Coming Next?
BTC is struggling to hold $74,000, and I think we could see another move toward $70,000 if selling pressure continues.
Looking at the 4-hour chart, BTC keeps making lower highs and lower lows. The recent drop to $73,510 shows that buyers are still struggling to defend support.
It’s not just technical weakness. The broader market is under pressure too.
Recent reports show that Bitcoin ETFs have experienced heavy outflows, while uncertainty following the US midterm elections, weakness in AI stocks, and growing expectations of a Fed rate hike are making investors more cautious.
The key level I’m watching is $73,000–$73,500. If Bitcoin breaks below this area and fails to recover, $72,000 could be next, followed by $70,000.
On the upside, BTC needs to reclaim $75,000–$76,800 to improve short-term momentum.
I don’t think $70K is guaranteed, but the current market conditions make it a realistic target. With US inflation data approaching, volatility could increase further.
#BitcoinFiveWeeklyLosses
BTC is struggling to hold $74,000, and I think we could see another move toward $70,000 if selling pressure continues.
Looking at the 4-hour chart, BTC keeps making lower highs and lower lows. The recent drop to $73,510 shows that buyers are still struggling to defend support.
It’s not just technical weakness. The broader market is under pressure too.
Recent reports show that Bitcoin ETFs have experienced heavy outflows, while uncertainty following the US midterm elections, weakness in AI stocks, and growing expectations of a Fed rate hike are making investors more cautious.
The key level I’m watching is $73,000–$73,500. If Bitcoin breaks below this area and fails to recover, $72,000 could be next, followed by $70,000.
On the upside, BTC needs to reclaim $75,000–$76,800 to improve short-term momentum.
I don’t think $70K is guaranteed, but the current market conditions make it a realistic target. With US inflation data approaching, volatility could increase further.
#BitcoinFiveWeeklyLosses
468
·
--
NVIDIA CEO Jensen Huang faces serious allegations involving a suspected Chinese intelligence operative, raising questions about the company’s reputation, leadership and national security.
If the allegations lead to confirmed security breaches or regulatory action, NVIDIA could face significant consequences.
What could happen next?
* NVIDIA (NVDA): Potential stock volatility and pressure on investor confidence.
* AI sector: A major NVIDIA sell-off could weaken sentiment across AI stocks.
* Crypto market: BTC, ETH and AI tokens such as NEAR, FET, RENDER and TAO could face selling pressure.
NVIDIA’s fate will depend on the investigation’s findings and whether any corporate or national security violations are established.
Could NVIDIA’s troubles trigger a broader AI and crypto market correction?
#NVIDIA
NVIDIA CEO Jensen Huang faces serious allegations involving a suspected Chinese intelligence operative, raising questions about the company’s reputation, leadership and national security.
If the allegations lead to confirmed security breaches or regulatory action, NVIDIA could face significant consequences.
What could happen next?
* NVIDIA (NVDA): Potential stock volatility and pressure on investor confidence.
* AI sector: A major NVIDIA sell-off could weaken sentiment across AI stocks.
* Crypto market: BTC, ETH and AI tokens such as NEAR, FET, RENDER and TAO could face selling pressure.
NVIDIA’s fate will depend on the investigation’s findings and whether any corporate or national security violations are established.
Could NVIDIA’s troubles trigger a broader AI and crypto market correction?
#NVIDIA
If the allegations lead to confirmed security breaches or regulatory action, NVIDIA could face significant consequences.
What could happen next?
* NVIDIA (NVDA): Potential stock volatility and pressure on investor confidence.
* AI sector: A major NVIDIA sell-off could weaken sentiment across AI stocks.
* Crypto market: BTC, ETH and AI tokens such as NEAR, FET, RENDER and TAO could face selling pressure.
NVIDIA’s fate will depend on the investigation’s findings and whether any corporate or national security violations are established.
Could NVIDIA’s troubles trigger a broader AI and crypto market correction?
#NVIDIA


1
126
·
--
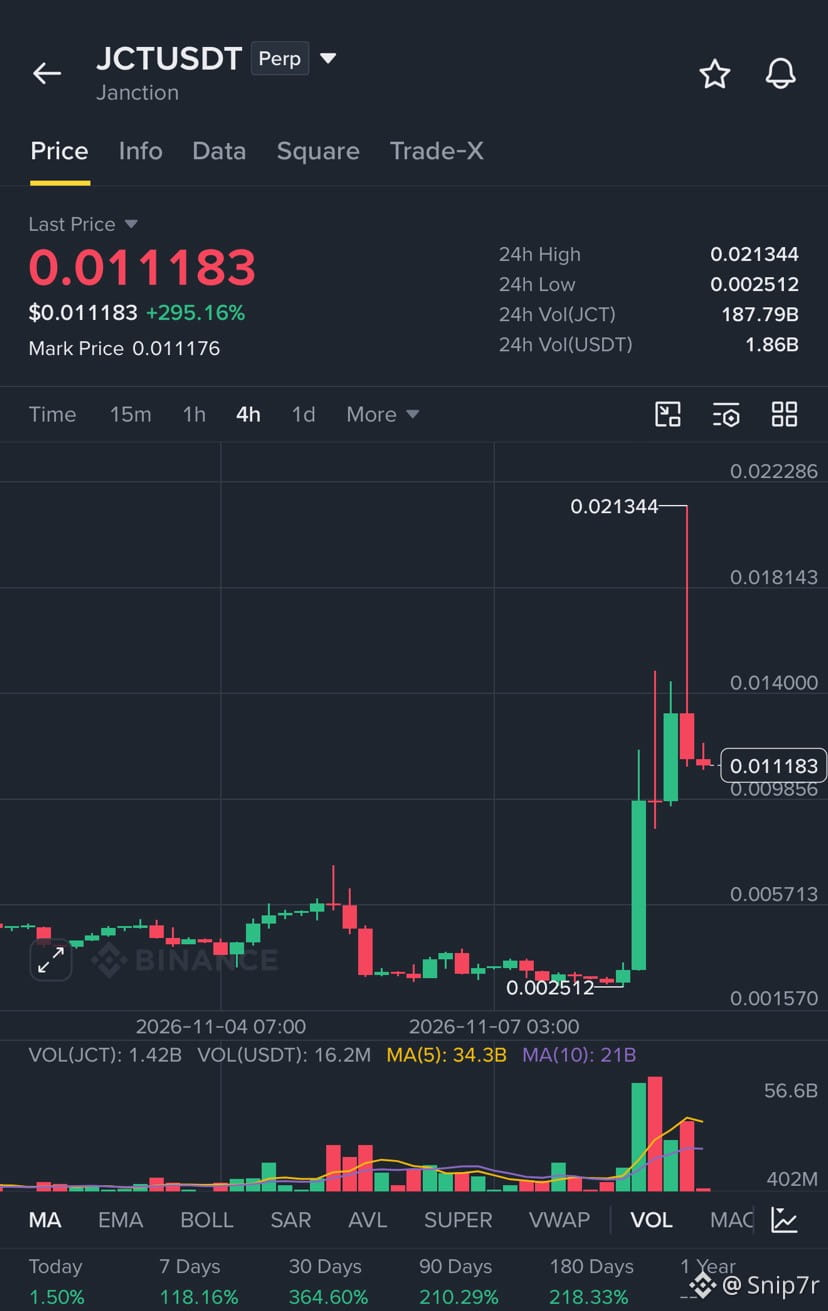
$JCT just did +295%. So what happened?
Janction ran from $0.0025 to $0.0213 in less than a day, then gave back almost half. It's now around $0.0112.
Honestly, there's no real news behind it. It looks like a short squeeze. JCT was the only big coin where more shorts got liquidated than longs in the last 24h. With only about 23% of the supply unlocked, it doesn't take much buying to push the price. Add the AI narrative and Jasmy backing, and traders piled in.
What I'd be careful about is the token unlock tomorrow, Nov 10. About 10% more supply enters the market, and early holders sitting on big gains may sell. That long wick to $0.0213 already shows sellers waiting.
Levels I'm watching:
Resistance at $0.0140 and $0.0181
Support at $0.0099 and $0.0080
My take: this is a squeeze, not fundamentals. If it holds $0.0099, momentum can continue. If it loses that after the unlock, it could drop hard.
Are you chasing this or waiting for the unlock?
NFA · DYOR
#AIChipSlumpNasdaq
$JCT just did +295%. So what happened?
Janction ran from $0.0025 to $0.0213 in less than a day, then gave back almost half. It's now around $0.0112.
Honestly, there's no real news behind it. It looks like a short squeeze. JCT was the only big coin where more shorts got liquidated than longs in the last 24h. With only about 23% of the supply unlocked, it doesn't take much buying to push the price. Add the AI narrative and Jasmy backing, and traders piled in.
What I'd be careful about is the token unlock tomorrow, Nov 10. About 10% more supply enters the market, and early holders sitting on big gains may sell. That long wick to $0.0213 already shows sellers waiting.
Levels I'm watching:
Resistance at $0.0140 and $0.0181
Support at $0.0099 and $0.0080
My take: this is a squeeze, not fundamentals. If it holds $0.0099, momentum can continue. If it loses that after the unlock, it could drop hard.
Are you chasing this or waiting for the unlock?
NFA · DYOR
#AIChipSlumpNasdaq
Janction ran from $0.0025 to $0.0213 in less than a day, then gave back almost half. It's now around $0.0112.
Honestly, there's no real news behind it. It looks like a short squeeze. JCT was the only big coin where more shorts got liquidated than longs in the last 24h. With only about 23% of the supply unlocked, it doesn't take much buying to push the price. Add the AI narrative and Jasmy backing, and traders piled in.
What I'd be careful about is the token unlock tomorrow, Nov 10. About 10% more supply enters the market, and early holders sitting on big gains may sell. That long wick to $0.0213 already shows sellers waiting.
Levels I'm watching:
Resistance at $0.0140 and $0.0181
Support at $0.0099 and $0.0080
My take: this is a squeeze, not fundamentals. If it holds $0.0099, momentum can continue. If it loses that after the unlock, it could drop hard.
Are you chasing this or waiting for the unlock?
NFA · DYOR
#AIChipSlumpNasdaq
322
·
--
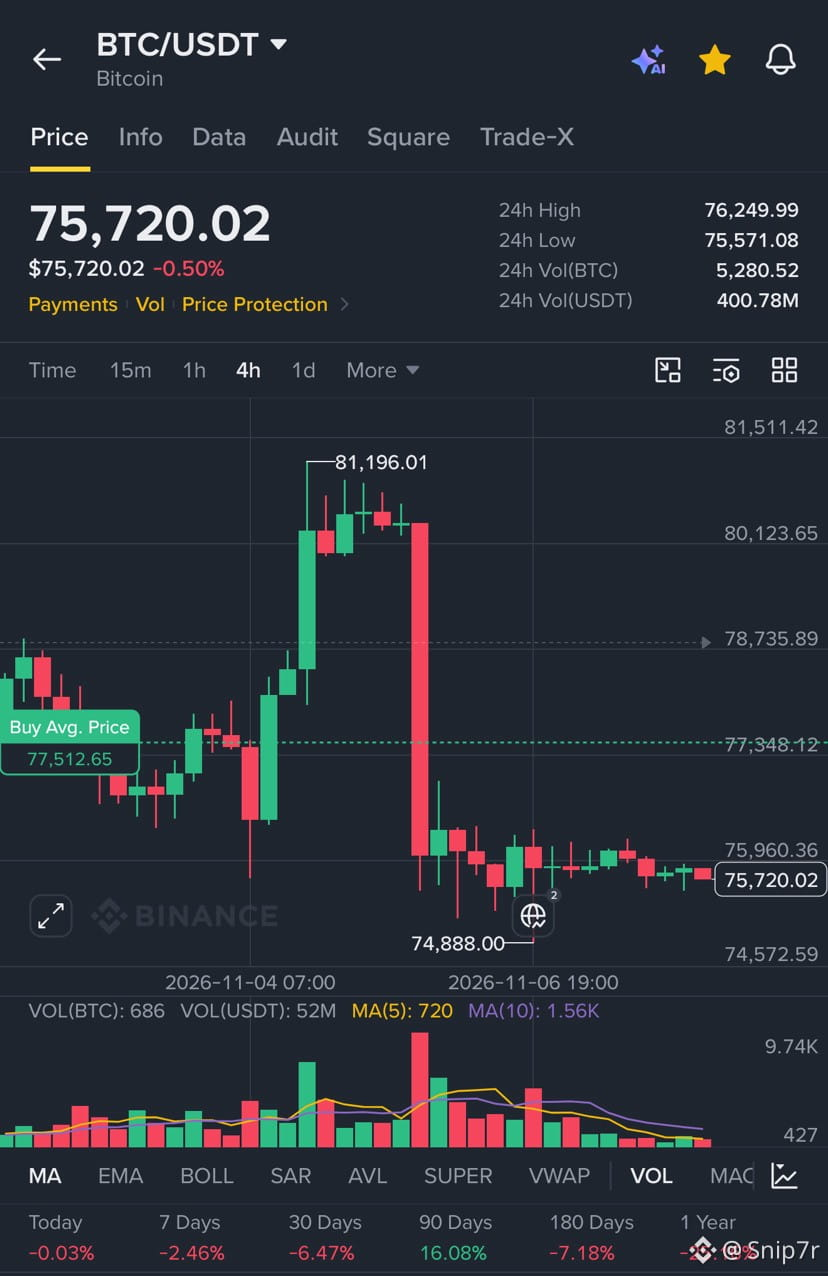
BTC Update: Range, Not Trend Yet. Is "Moonvember" Still Possible?
Chart (4H)
• BTC spiked to $81,196 this week, then dumped in a single heavy candle.
• It has been ranging between $74,900 and $76,500 since.
• Volume is drying up. That's compression, and a sharp move usually follows.
Key levels
• Support at $74,888. Losing it opens $74,000–$72,500.
• Resistance at $77,350. Above that, $78,700–$80,000 is the zone that flips the bias bullish.
Scenarios
• Bullish: holds $74,900 and breaks $77,350 on volume, targeting $78,700–$80,000.
• Bearish: loses $74,900 with volume, targeting $72,000–$74,000.
About "Moonvember"
November is historically strong for BTC, but the macro picture is still a headwind. A pump needs a confirmed break above $77K–$78K first.
Bottom line: BTC is coiling. Wait for the breakout and volume to confirm direction.
Which way do you think it breaks?
NFA · DYOR
#CPITestsDecemberRateOutlook
BTC Update: Range, Not Trend Yet. Is "Moonvember" Still Possible?
Chart (4H)
• BTC spiked to $81,196 this week, then dumped in a single heavy candle.
• It has been ranging between $74,900 and $76,500 since.
• Volume is drying up. That's compression, and a sharp move usually follows.
Key levels
• Support at $74,888. Losing it opens $74,000–$72,500.
• Resistance at $77,350. Above that, $78,700–$80,000 is the zone that flips the bias bullish.
Scenarios
• Bullish: holds $74,900 and breaks $77,350 on volume, targeting $78,700–$80,000.
• Bearish: loses $74,900 with volume, targeting $72,000–$74,000.
About "Moonvember"
November is historically strong for BTC, but the macro picture is still a headwind. A pump needs a confirmed break above $77K–$78K first.
Bottom line: BTC is coiling. Wait for the breakout and volume to confirm direction.
Which way do you think it breaks?
NFA · DYOR
#CPITestsDecemberRateOutlook
Chart (4H)
• BTC spiked to $81,196 this week, then dumped in a single heavy candle.
• It has been ranging between $74,900 and $76,500 since.
• Volume is drying up. That's compression, and a sharp move usually follows.
Key levels
• Support at $74,888. Losing it opens $74,000–$72,500.
• Resistance at $77,350. Above that, $78,700–$80,000 is the zone that flips the bias bullish.
Scenarios
• Bullish: holds $74,900 and breaks $77,350 on volume, targeting $78,700–$80,000.
• Bearish: loses $74,900 with volume, targeting $72,000–$74,000.
About "Moonvember"
November is historically strong for BTC, but the macro picture is still a headwind. A pump needs a confirmed break above $77K–$78K first.
Bottom line: BTC is coiling. Wait for the breakout and volume to confirm direction.
Which way do you think it breaks?
NFA · DYOR
#CPITestsDecemberRateOutlook
37
·
--
Crypto Market Wrap — Nov 8
BTC is holding the $75K–76K range after losing $78K earlier this week. The trend remains bearish, though selling pressure is easing.
ETH is underperforming BTC near $2,240, and there's no clear rotation into altcoins yet.
Total market cap is around $2.6T, down roughly 3% on the week and nearly 40% below the October 2025 peak.
Sentiment sits in Fear at 34 on the Fear & Greed Index. Positioning is cautious, which can precede a bottom, but nothing is confirmed.
Macro remains a headwind. The Fed is still hawkish, spot ETF flows are soft, and weakness in chip stocks is weighing on risk assets.
Regulation is still unresolved. The US CLARITY Act remains stalled, which keeps pressure on altcoins.
Institutional demand is still there. Corporate treasuries continue to accumulate BTC on dips.
Key BTC levels I'm watching
•Support at $75,000. A daily close below it opens $73K–74K.
•Resistance at $78K–80K. A reclaim would shift the short-term bias.
Bottom line: This market rewards patience over chasing. Wait for the levels to confirm.
Are you accumulating here or waiting for lower prices?
NFA · DYOR
#MarketSentimentToday
Crypto Market Wrap — Nov 8
BTC is holding the $75K–76K range after losing $78K earlier this week. The trend remains bearish, though selling pressure is easing.
ETH is underperforming BTC near $2,240, and there's no clear rotation into altcoins yet.
Total market cap is around $2.6T, down roughly 3% on the week and nearly 40% below the October 2025 peak.
Sentiment sits in Fear at 34 on the Fear & Greed Index. Positioning is cautious, which can precede a bottom, but nothing is confirmed.
Macro remains a headwind. The Fed is still hawkish, spot ETF flows are soft, and weakness in chip stocks is weighing on risk assets.
Regulation is still unresolved. The US CLARITY Act remains stalled, which keeps pressure on altcoins.
Institutional demand is still there. Corporate treasuries continue to accumulate BTC on dips.
Key BTC levels I'm watching
•Support at $75,000. A daily close below it opens $73K–74K.
•Resistance at $78K–80K. A reclaim would shift the short-term bias.
Bottom line: This market rewards patience over chasing. Wait for the levels to confirm.
Are you accumulating here or waiting for lower prices?
NFA · DYOR
#MarketSentimentToday
BTC is holding the $75K–76K range after losing $78K earlier this week. The trend remains bearish, though selling pressure is easing.
ETH is underperforming BTC near $2,240, and there's no clear rotation into altcoins yet.
Total market cap is around $2.6T, down roughly 3% on the week and nearly 40% below the October 2025 peak.
Sentiment sits in Fear at 34 on the Fear & Greed Index. Positioning is cautious, which can precede a bottom, but nothing is confirmed.
Macro remains a headwind. The Fed is still hawkish, spot ETF flows are soft, and weakness in chip stocks is weighing on risk assets.
Regulation is still unresolved. The US CLARITY Act remains stalled, which keeps pressure on altcoins.
Institutional demand is still there. Corporate treasuries continue to accumulate BTC on dips.
Key BTC levels I'm watching
•Support at $75,000. A daily close below it opens $73K–74K.
•Resistance at $78K–80K. A reclaim would shift the short-term bias.
Bottom line: This market rewards patience over chasing. Wait for the levels to confirm.
Are you accumulating here or waiting for lower prices?
NFA · DYOR
#MarketSentimentToday
294
·
--
$SOL — Up the Stairs, Down the Elevator 🛗
Nov 5: SOL climbed steadily from 92 to 98, step by step, candle by candle.
Then the elevator cable snapped. One 4H candle erased the whole climb and dropped price straight back to 90, on the biggest volume of the week.
Since then, SOL has been sitting in the lobby. Small candles, quiet volume, drifting sideways between 88.70 and 91. The Alpenglow upgrade headlines are making noise, but the chart isn't listening yet.
🟢 If the bulls find the stairs again
• 88.70–88.00 has caught every dip so far, with long lower wicks showing buyers waiting
• A reclaim of 90.60, then 92, puts SOL back inside the range it fell out of
• Above 94, the trapdoor at 96 comes back into play
🔴 If the floor gives way
• Each bounce since the dump has topped out a little lower
• 7-day: −6.7%. 30-day: −17%. The trend is not on the bulls' side
• A 4H close below 88 opens the basement, with little support close below
📍 Levels I'm watching
Support: 88.70 / 88.00
Resistance: 90.60 / 92.00 / 94.00 / 96.00
⏳ Quiet ranges rarely stay quiet. When volume walks back in, it usually picks a direction fast. I'm letting the market show its hand first.
So which button does SOL press next: up or down? 👇
NFA · DYOR
#JobsReportRaisesHikeOdds
$SOL — Up the Stairs, Down the Elevator 🛗
Nov 5: SOL climbed steadily from 92 to 98, step by step, candle by candle.
Then the elevator cable snapped. One 4H candle erased the whole climb and dropped price straight back to 90, on the biggest volume of the week.
Since then, SOL has been sitting in the lobby. Small candles, quiet volume, drifting sideways between 88.70 and 91. The Alpenglow upgrade headlines are making noise, but the chart isn't listening yet.
🟢 If the bulls find the stairs again
• 88.70–88.00 has caught every dip so far, with long lower wicks showing buyers waiting
• A reclaim of 90.60, then 92, puts SOL back inside the range it fell out of
• Above 94, the trapdoor at 96 comes back into play
🔴 If the floor gives way
• Each bounce since the dump has topped out a little lower
• 7-day: −6.7%. 30-day: −17%. The trend is not on the bulls' side
• A 4H close below 88 opens the basement, with little support close below
📍 Levels I'm watching
Support: 88.70 / 88.00
Resistance: 90.60 / 92.00 / 94.00 / 96.00
⏳ Quiet ranges rarely stay quiet. When volume walks back in, it usually picks a direction fast. I'm letting the market show its hand first.
So which button does SOL press next: up or down? 👇
NFA · DYOR
#JobsReportRaisesHikeOdds
Nov 5: SOL climbed steadily from 92 to 98, step by step, candle by candle.
Then the elevator cable snapped. One 4H candle erased the whole climb and dropped price straight back to 90, on the biggest volume of the week.
Since then, SOL has been sitting in the lobby. Small candles, quiet volume, drifting sideways between 88.70 and 91. The Alpenglow upgrade headlines are making noise, but the chart isn't listening yet.
🟢 If the bulls find the stairs again
• 88.70–88.00 has caught every dip so far, with long lower wicks showing buyers waiting
• A reclaim of 90.60, then 92, puts SOL back inside the range it fell out of
• Above 94, the trapdoor at 96 comes back into play
🔴 If the floor gives way
• Each bounce since the dump has topped out a little lower
• 7-day: −6.7%. 30-day: −17%. The trend is not on the bulls' side
• A 4H close below 88 opens the basement, with little support close below
📍 Levels I'm watching
Support: 88.70 / 88.00
Resistance: 90.60 / 92.00 / 94.00 / 96.00
⏳ Quiet ranges rarely stay quiet. When volume walks back in, it usually picks a direction fast. I'm letting the market show its hand first.
So which button does SOL press next: up or down? 👇
NFA · DYOR
#JobsReportRaisesHikeOdds
1
641
·
--
$NEAR — Double Bottom or Just a Pause?
NEAR is down about 18% this week, and the chart has made lower highs at 4.60, then 4.25, then 3.85. But price is now sitting on a level it defended earlier in the month.
The 3.60–3.65 zone held on Nov 3–4, and buyers are stepping in there again. Zoom out, and NEAR is still up roughly 125% over 90 days.
🟢 Bullish scenario
• 3.60–3.65 forms a double bottom
• The latest 4H dip to 3.615 was quickly bought back
• A 4H close above 3.80 with volume breaks the lower-high pattern and opens 4.00, then 4.20
🔴 Bearish scenario
• The short-term trend is still down, with lower highs intact
• 3.80 has capped every bounce for two days
• A 4H close below 3.60 breaks the base, and there is little support close below
📍 Levels I'm watching
Support: 3.65 / 3.60
Resistance: 3.80 / 4.00 / 4.20
⚠️ Volume is fading and the order book is close to 50/50. The middle of a range is where patience pays. I'm watching for either a clean reclaim of 3.80 or a decisive loss of 3.60.
Does the double bottom hold, or does 3.60 give way? 👇
NFA · DYOR
#JobsReportRaisesHikeOdds
$NEAR — Double Bottom or Just a Pause?
NEAR is down about 18% this week, and the chart has made lower highs at 4.60, then 4.25, then 3.85. But price is now sitting on a level it defended earlier in the month.
The 3.60–3.65 zone held on Nov 3–4, and buyers are stepping in there again. Zoom out, and NEAR is still up roughly 125% over 90 days.
🟢 Bullish scenario
• 3.60–3.65 forms a double bottom
• The latest 4H dip to 3.615 was quickly bought back
• A 4H close above 3.80 with volume breaks the lower-high pattern and opens 4.00, then 4.20
🔴 Bearish scenario
• The short-term trend is still down, with lower highs intact
• 3.80 has capped every bounce for two days
• A 4H close below 3.60 breaks the base, and there is little support close below
📍 Levels I'm watching
Support: 3.65 / 3.60
Resistance: 3.80 / 4.00 / 4.20
⚠️ Volume is fading and the order book is close to 50/50. The middle of a range is where patience pays. I'm watching for either a clean reclaim of 3.80 or a decisive loss of 3.60.
Does the double bottom hold, or does 3.60 give way? 👇
NFA · DYOR
#JobsReportRaisesHikeOdds
NEAR is down about 18% this week, and the chart has made lower highs at 4.60, then 4.25, then 3.85. But price is now sitting on a level it defended earlier in the month.
The 3.60–3.65 zone held on Nov 3–4, and buyers are stepping in there again. Zoom out, and NEAR is still up roughly 125% over 90 days.
🟢 Bullish scenario
• 3.60–3.65 forms a double bottom
• The latest 4H dip to 3.615 was quickly bought back
• A 4H close above 3.80 with volume breaks the lower-high pattern and opens 4.00, then 4.20
🔴 Bearish scenario
• The short-term trend is still down, with lower highs intact
• 3.80 has capped every bounce for two days
• A 4H close below 3.60 breaks the base, and there is little support close below
📍 Levels I'm watching
Support: 3.65 / 3.60
Resistance: 3.80 / 4.00 / 4.20
⚠️ Volume is fading and the order book is close to 50/50. The middle of a range is where patience pays. I'm watching for either a clean reclaim of 3.80 or a decisive loss of 3.60.
Does the double bottom hold, or does 3.60 give way? 👇
NFA · DYOR
#JobsReportRaisesHikeOdds
954
·
--
Partly True
$ZEC — Sell the News, or Reload Zone?
The NU7 upgrade is live on mainnet, but price did the opposite of what the hype crowd expected. ZEC tagged 1,364, got rejected, and is now back near 1,254, down about 5.5% on the day.
Over the bigger picture, ZEC is still up roughly 140% in 90 days. This is a pullback inside a strong trend, at least for now.
🟢 Bullish scenario
• 1,235–1,200 holds as support (it has been the pivot all week)
• The order book is leaning heavily to bids, so dips are being absorbed
• A reclaim of 1,280 puts 1,320 and the 1,360 highs back in play
🔴 Bearish scenario
• The rejection at 1,364 left a lower high on the 4H
• The upgrade catalyst is now priced in, with no fresh trigger in sight
• A 4H close below 1,200 opens a path toward 1,160, then the 1,120 lows from Nov 2
📍 Levels I'm watching
Support: 1,235 / 1,200 / 1,160
Resistance: 1,280 / 1,320 / 1,360
⚠️ Upgrade news often brings volatility both ways. I'm watching how price reacts at 1,200 before forming a bias.
Is this a dip to buy or the start of a deeper cooldown? 👇
NFA · DYOR
#CPITestsDecemberRateOutlook
$ZEC — Sell the News, or Reload Zone?
The NU7 upgrade is live on mainnet, but price did the opposite of what the hype crowd expected. ZEC tagged 1,364, got rejected, and is now back near 1,254, down about 5.5% on the day.
Over the bigger picture, ZEC is still up roughly 140% in 90 days. This is a pullback inside a strong trend, at least for now.
🟢 Bullish scenario
• 1,235–1,200 holds as support (it has been the pivot all week)
• The order book is leaning heavily to bids, so dips are being absorbed
• A reclaim of 1,280 puts 1,320 and the 1,360 highs back in play
🔴 Bearish scenario
• The rejection at 1,364 left a lower high on the 4H
• The upgrade catalyst is now priced in, with no fresh trigger in sight
• A 4H close below 1,200 opens a path toward 1,160, then the 1,120 lows from Nov 2
📍 Levels I'm watching
Support: 1,235 / 1,200 / 1,160
Resistance: 1,280 / 1,320 / 1,360
⚠️ Upgrade news often brings volatility both ways. I'm watching how price reacts at 1,200 before forming a bias.
Is this a dip to buy or the start of a deeper cooldown? 👇
NFA · DYOR
#CPITestsDecemberRateOutlook
The NU7 upgrade is live on mainnet, but price did the opposite of what the hype crowd expected. ZEC tagged 1,364, got rejected, and is now back near 1,254, down about 5.5% on the day.
Over the bigger picture, ZEC is still up roughly 140% in 90 days. This is a pullback inside a strong trend, at least for now.
🟢 Bullish scenario
• 1,235–1,200 holds as support (it has been the pivot all week)
• The order book is leaning heavily to bids, so dips are being absorbed
• A reclaim of 1,280 puts 1,320 and the 1,360 highs back in play
🔴 Bearish scenario
• The rejection at 1,364 left a lower high on the 4H
• The upgrade catalyst is now priced in, with no fresh trigger in sight
• A 4H close below 1,200 opens a path toward 1,160, then the 1,120 lows from Nov 2
📍 Levels I'm watching
Support: 1,235 / 1,200 / 1,160
Resistance: 1,280 / 1,320 / 1,360
⚠️ Upgrade news often brings volatility both ways. I'm watching how price reacts at 1,200 before forming a bias.
Is this a dip to buy or the start of a deeper cooldown? 👇
NFA · DYOR
#CPITestsDecemberRateOutlook
963
·
--
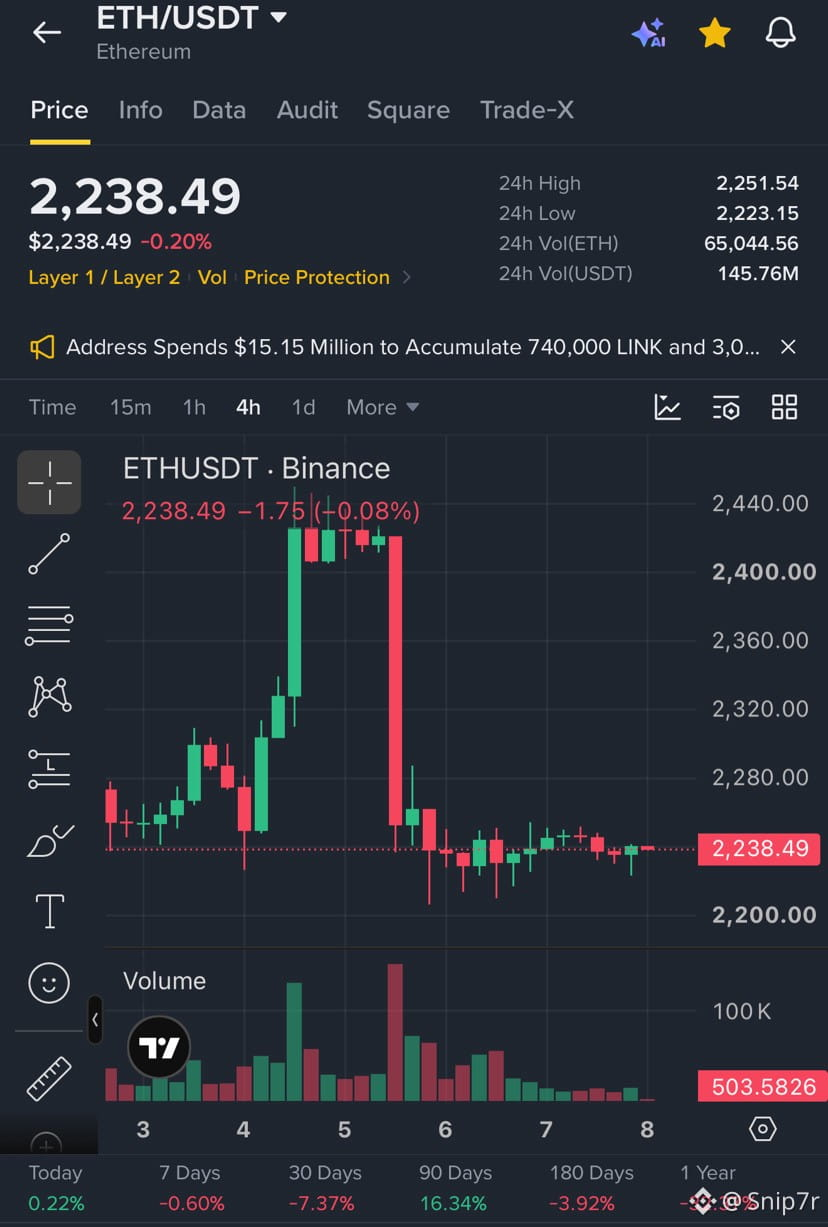
$ETH — The Squeeze Gets Tighter
ETH has spent two days locked between 2,215 and 2,260, and the range keeps narrowing. 24h volume dropped by about two-thirds, and buy and sell pressure is sitting near 50/50.
This is the calm before a move. The question is which direction.
🟢 Bullish scenario
• 2,215–2,200 keeps getting defended
• A 4H close above 2,260 opens 2,280, then 2,320
• Above 2,320, the 2,400 zone comes back into view
🔴 Bearish scenario
• The Nov 5 rejection from 2,440 still hangs over the chart
• Every bounce has stalled below 2,260
• A 4H close below 2,200 likely sends price searching for lower liquidity
📍 Levels I'm watching
Support: 2,215 / 2,200
Resistance: 2,260 / 2,280 / 2,320
⚠️ Weekend volume is thin, so early breakouts can be traps. I'd rather wait for the weekly close and a confirmed move with volume behind it.
Breakout or breakdown first? Drop your call below 👇
NFA · DYOR
#JobsReportRaisesHikeOdds #BinancePick
$ETH — The Squeeze Gets Tighter
ETH has spent two days locked between 2,215 and 2,260, and the range keeps narrowing. 24h volume dropped by about two-thirds, and buy and sell pressure is sitting near 50/50.
This is the calm before a move. The question is which direction.
🟢 Bullish scenario
• 2,215–2,200 keeps getting defended
• A 4H close above 2,260 opens 2,280, then 2,320
• Above 2,320, the 2,400 zone comes back into view
🔴 Bearish scenario
• The Nov 5 rejection from 2,440 still hangs over the chart
• Every bounce has stalled below 2,260
• A 4H close below 2,200 likely sends price searching for lower liquidity
📍 Levels I'm watching
Support: 2,215 / 2,200
Resistance: 2,260 / 2,280 / 2,320
⚠️ Weekend volume is thin, so early breakouts can be traps. I'd rather wait for the weekly close and a confirmed move with volume behind it.
Breakout or breakdown first? Drop your call below 👇
NFA · DYOR
#JobsReportRaisesHikeOdds #BinancePick
ETH has spent two days locked between 2,215 and 2,260, and the range keeps narrowing. 24h volume dropped by about two-thirds, and buy and sell pressure is sitting near 50/50.
This is the calm before a move. The question is which direction.
🟢 Bullish scenario
• 2,215–2,200 keeps getting defended
• A 4H close above 2,260 opens 2,280, then 2,320
• Above 2,320, the 2,400 zone comes back into view
🔴 Bearish scenario
• The Nov 5 rejection from 2,440 still hangs over the chart
• Every bounce has stalled below 2,260
• A 4H close below 2,200 likely sends price searching for lower liquidity
📍 Levels I'm watching
Support: 2,215 / 2,200
Resistance: 2,260 / 2,280 / 2,320
⚠️ Weekend volume is thin, so early breakouts can be traps. I'd rather wait for the weekly close and a confirmed move with volume behind it.
Breakout or breakdown first? Drop your call below 👇
NFA · DYOR
#JobsReportRaisesHikeOdds #BinancePick
125
·
--
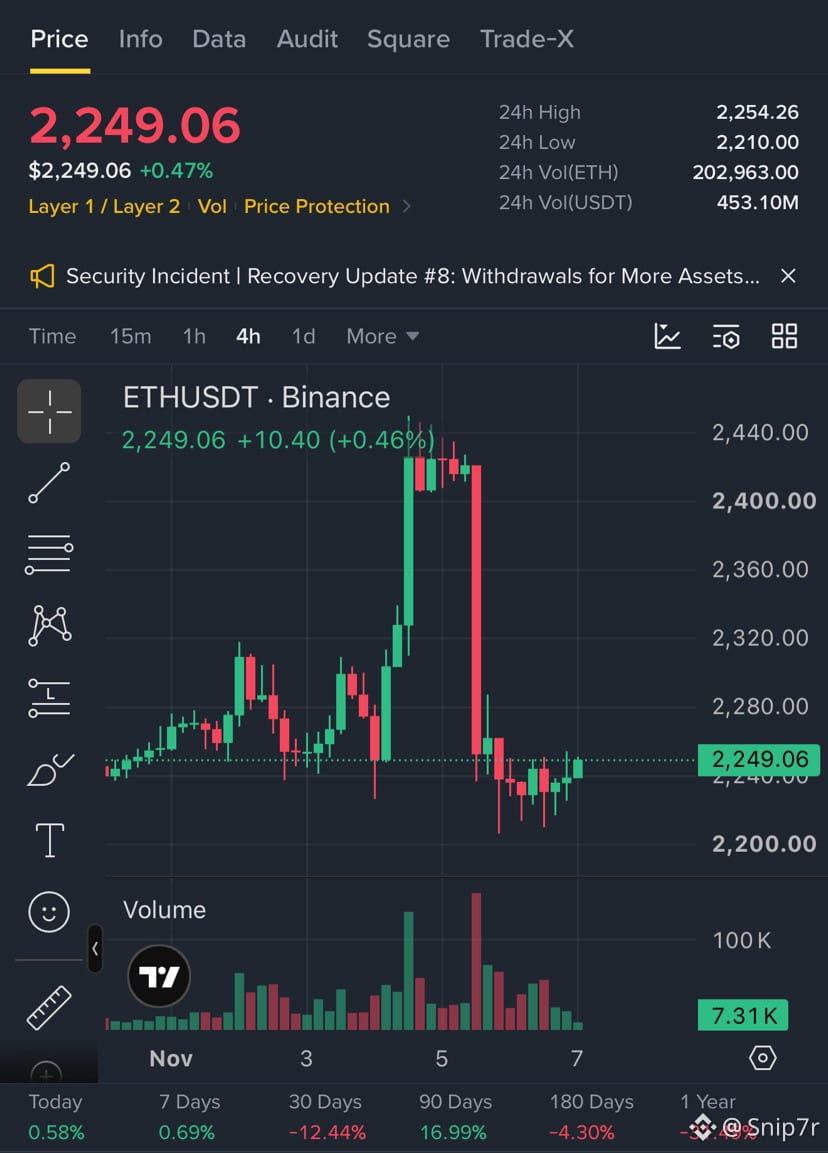
$ETH — Coiling at 2,250. Who blinks first?
ETH ran to 2,440 on Nov 5, then gave it ALL back in a single 4H candle 🩸 Since then, price has been stuck in a tight 2,210–2,260 box with volume drying up.
The market is holding its breath 👀
🟢 Bull case
• 2,200 defended again and again (long lower wicks = buyers stepping in)
• Reclaim 2,280 → opens 2,320, then the 2,400 supply zone
• Volume coming back on a breakout = real move
🔴 Bear case
• The Nov 5 dump came on huge volume, so sellers still control above 2,320
• Lower highs since the drop
• Lose 2,200 on a 4H close → stops below get hunted fast
📍 Levels I'm watching
Support: 2,210 / 2,200
Resistance: 2,260 / 2,280 / 2,320 / 2,400
💡 Low volume + tight range = energy building. I'm not guessing the direction. I'm waiting for a 4H close outside the box, with volume behind it.
Which way do you think ETH breaks: 2,300 or 2,150 first? 👇
NFA · DYOR
#JobsReportRaisesHikeOdds #BinancePick
$ETH — Coiling at 2,250. Who blinks first?
ETH ran to 2,440 on Nov 5, then gave it ALL back in a single 4H candle 🩸 Since then, price has been stuck in a tight 2,210–2,260 box with volume drying up.
The market is holding its breath 👀
🟢 Bull case
• 2,200 defended again and again (long lower wicks = buyers stepping in)
• Reclaim 2,280 → opens 2,320, then the 2,400 supply zone
• Volume coming back on a breakout = real move
🔴 Bear case
• The Nov 5 dump came on huge volume, so sellers still control above 2,320
• Lower highs since the drop
• Lose 2,200 on a 4H close → stops below get hunted fast
📍 Levels I'm watching
Support: 2,210 / 2,200
Resistance: 2,260 / 2,280 / 2,320 / 2,400
💡 Low volume + tight range = energy building. I'm not guessing the direction. I'm waiting for a 4H close outside the box, with volume behind it.
Which way do you think ETH breaks: 2,300 or 2,150 first? 👇
NFA · DYOR
#JobsReportRaisesHikeOdds #BinancePick
ETH ran to 2,440 on Nov 5, then gave it ALL back in a single 4H candle 🩸 Since then, price has been stuck in a tight 2,210–2,260 box with volume drying up.
The market is holding its breath 👀
🟢 Bull case
• 2,200 defended again and again (long lower wicks = buyers stepping in)
• Reclaim 2,280 → opens 2,320, then the 2,400 supply zone
• Volume coming back on a breakout = real move
🔴 Bear case
• The Nov 5 dump came on huge volume, so sellers still control above 2,320
• Lower highs since the drop
• Lose 2,200 on a 4H close → stops below get hunted fast
📍 Levels I'm watching
Support: 2,210 / 2,200
Resistance: 2,260 / 2,280 / 2,320 / 2,400
💡 Low volume + tight range = energy building. I'm not guessing the direction. I'm waiting for a 4H close outside the box, with volume behind it.
Which way do you think ETH breaks: 2,300 or 2,150 first? 👇
NFA · DYOR
#JobsReportRaisesHikeOdds #BinancePick
230
·
--
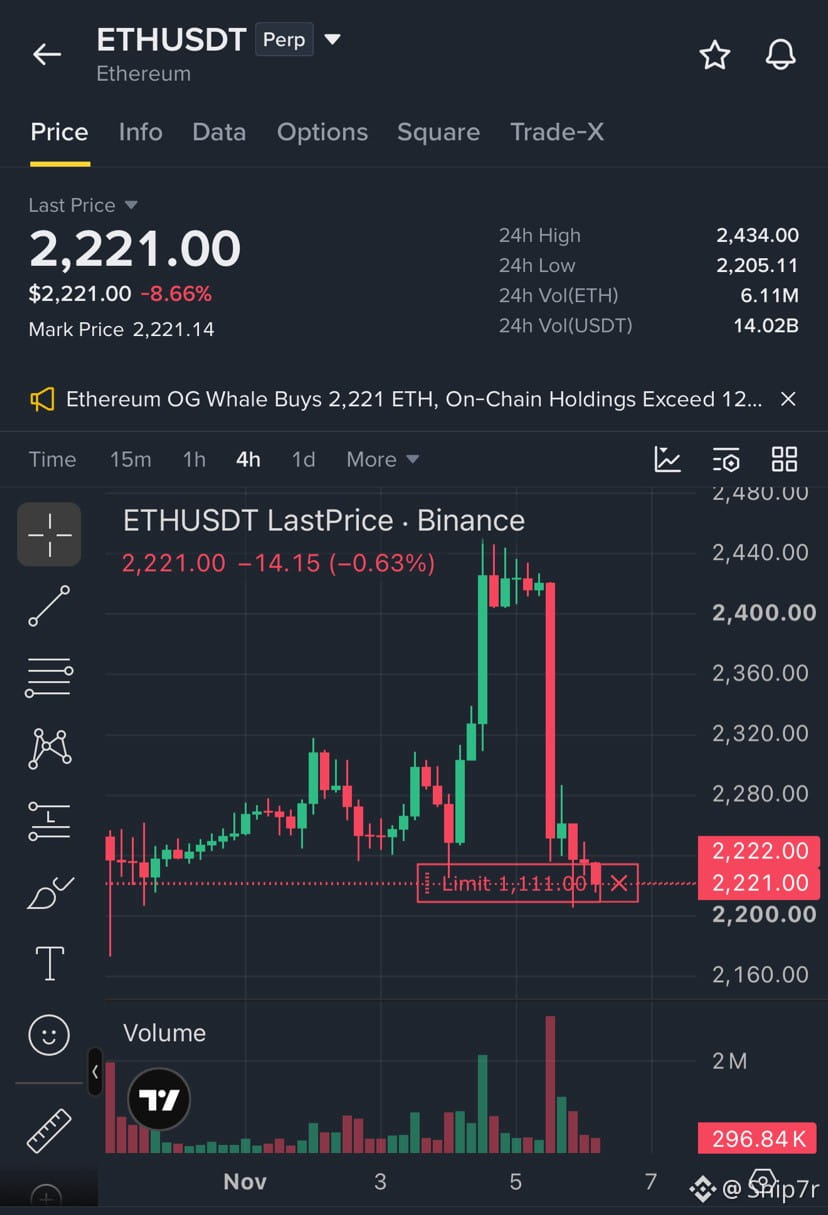
ETH Drops 8.66% — Following the Stock Market Sell-Off!
ETH is trading around $2,221, facing heavy selling pressure after rejection near $2,440. The 4H chart remains bearish.
🔴 Short Setup
Entry: $2,240–$2,260
TP1: $2,200 | TP2: $2,160
Stop Loss: $2,285
🟢 Long Setup
Entry: $2,205–$2,220 (if support holds)
TP1: $2,260 | TP2: $2,300
Stop Loss: $2,180
Outlook: ETH remains bearish below $2,280. Breaking $2,200 could trigger further selling toward $2,160.
Watch US stocks closely. Avoid chasing trades and wait for confirmation.
#ETH #Ethereum #CryptoTrading #BinanceSquare
Not financial advice. DYOR.
ETH Drops 8.66% — Following the Stock Market Sell-Off!
ETH is trading around $2,221, facing heavy selling pressure after rejection near $2,440. The 4H chart remains bearish.
🔴 Short Setup
Entry: $2,240–$2,260
TP1: $2,200 | TP2: $2,160
Stop Loss: $2,285
🟢 Long Setup
Entry: $2,205–$2,220 (if support holds)
TP1: $2,260 | TP2: $2,300
Stop Loss: $2,180
Outlook: ETH remains bearish below $2,280. Breaking $2,200 could trigger further selling toward $2,160.
Watch US stocks closely. Avoid chasing trades and wait for confirmation.
#ETH #Ethereum #CryptoTrading #BinanceSquare
Not financial advice. DYOR.
ETH is trading around $2,221, facing heavy selling pressure after rejection near $2,440. The 4H chart remains bearish.
🔴 Short Setup
Entry: $2,240–$2,260
TP1: $2,200 | TP2: $2,160
Stop Loss: $2,285
🟢 Long Setup
Entry: $2,205–$2,220 (if support holds)
TP1: $2,260 | TP2: $2,300
Stop Loss: $2,180
Outlook: ETH remains bearish below $2,280. Breaking $2,200 could trigger further selling toward $2,160.
Watch US stocks closely. Avoid chasing trades and wait for confirmation.
#ETH #Ethereum #CryptoTrading #BinanceSquare
Not financial advice. DYOR.
148
Log in to explore more content
Join global crypto users on Binance Square
⚡️ Get latest and useful information about crypto.
💬 Trusted by the world’s largest crypto exchange.
👍 Discover real insights from verified creators.
Email / Phone number
Trending Topics
HotCPIDecemberHikePriced
88,647 views
1,057 Discussing
CPI Market Watch | US CPI Rises 0.4% in October, Hotter Than 0.3% Forecast
Binance News
·27 Likes
·41.4k views
TrumpMediaAdds1510BTCInQ3
1,369 views
57 Discussing
AnthropicRejectsIPODelayValuationinQuestion
214,767 views
1,803 Discussing