
crypoavora
57 Posts

crypoavora
Report
Block User
🚀 Exploring Cryptocurrency | 📊 Crypto News & Blockchain | 💡 Learn • Explore • Grow | 🌐 Welcome to Crypavora
2 Following
2 Followers
7 Liked
Posts
·
--
$CEG 🚨 : TOKENIZED ENERGY STOCK — IS A BIG OPPORTUNITY FORMING? ⚡
Constellation Energy ($CEG ) is gaining attention as demand for electricity continues to grow, especially from AI data centers.
📊 Market Snapshot:
- Token: CEGon
- On-chain price (provided snapshot): $274.70
- Underlying stock reference: $273.85
- 24H token gain (provided snapshot): +8.8%
- Circulating supply: ~2,780 tokens
- Holders: 353
- On-chain market cap: ~$760K
🔥 What's Driving Interest?
1️⃣ Growing electricity demand from AI infrastructure.
2️⃣ Strong Q3 2026 earnings.
3️⃣ Increased 2026 earnings guidance.
4️⃣ Long-term nuclear energy agreements supporting future growth.
{future}(CEGUSDT)
⚠️ Important Risk:
The tokenized market remains extremely thin compared with the underlying stock's nearly $100B market capitalization.
Low liquidity can lead to price slippage, volatility and temporary price differences.
📈 My Take:
The fundamental story behind $CEG looks promising, but the token's liquidity needs close monitoring.
I'm watching whether on-chain demand can grow alongside the underlying stock.
Would you consider holding tokenized energy stocks like $CEG, or do you prefer traditional stocks?
#CEG #CEGon #TokenizedStocks #RWA #Crypto #AI #Energy #BinanceSquare
$CEG 🚨 : TOKENIZED ENERGY STOCK — IS A BIG OPPORTUNITY FORMING? ⚡
Constellation Energy ($CEG ) is gaining attention as demand for electricity continues to grow, especially from AI data centers.
📊 Market Snapshot:
- Token: CEGon
- On-chain price (provided snapshot): $274.70
- Underlying stock reference: $273.85
- 24H token gain (provided snapshot): +8.8%
- Circulating supply: ~2,780 tokens
- Holders: 353
- On-chain market cap: ~$760K
🔥 What's Driving Interest?
1️⃣ Growing electricity demand from AI infrastructure.
2️⃣ Strong Q3 2026 earnings.
3️⃣ Increased 2026 earnings guidance.
4️⃣ Long-term nuclear energy agreements supporting future growth.
⚠️ Important Risk:
The tokenized market remains extremely thin compared with the underlying stock's nearly $100B market capitalization.
Low liquidity can lead to price slippage, volatility and temporary price differences.
📈 My Take:
The fundamental story behind $CEG looks promising, but the token's liquidity needs close monitoring.
I'm watching whether on-chain demand can grow alongside the underlying stock.
Would you consider holding tokenized energy stocks like $CEG , or do you prefer traditional stocks?
#CEG #CEGon #TokenizedStocks #RWA #Crypto #AI #Energy #BinanceSquare
Constellation Energy ($CEG ) is gaining attention as demand for electricity continues to grow, especially from AI data centers.
📊 Market Snapshot:
- Token: CEGon
- On-chain price (provided snapshot): $274.70
- Underlying stock reference: $273.85
- 24H token gain (provided snapshot): +8.8%
- Circulating supply: ~2,780 tokens
- Holders: 353
- On-chain market cap: ~$760K
🔥 What's Driving Interest?
1️⃣ Growing electricity demand from AI infrastructure.
2️⃣ Strong Q3 2026 earnings.
3️⃣ Increased 2026 earnings guidance.
4️⃣ Long-term nuclear energy agreements supporting future growth.
⚠️ Important Risk:
The tokenized market remains extremely thin compared with the underlying stock's nearly $100B market capitalization.
Low liquidity can lead to price slippage, volatility and temporary price differences.
📈 My Take:
The fundamental story behind $CEG looks promising, but the token's liquidity needs close monitoring.
I'm watching whether on-chain demand can grow alongside the underlying stock.
Would you consider holding tokenized energy stocks like $CEG , or do you prefer traditional stocks?
#CEG #CEGon #TokenizedStocks #RWA #Crypto #AI #Energy #BinanceSquare
8
·
--
$LAB Key Technical Signals:
Sellers remain dominant on higher timeframes.
Price remains under important moving averages.
Daily RSI is showing weak momentum.
A recovery toward the entry zone could provide another rejection opportunity.
{future}(LABUSDT)
⚠️ Important Levels:
Support: 0.03360
Resistance: 0.03610
Major invalidation: 0.03966
My Strategy: I'm watching for a relief bounce followed by bearish rejection. A confirmed breakdown below support could open the door toward lower targets.
No blind entries — wait for confirmation and manage risk carefully.
🔥 What's your view on $LAB?
Are bears preparing for another dump, or could bulls surprise everyone?
#LAB #LABUSDT #CryptoAnalysis #BinanceSquare #TradingSignals #Altcoin
$LAB Key Technical Signals:
Sellers remain dominant on higher timeframes.
Price remains under important moving averages.
Daily RSI is showing weak momentum.
A recovery toward the entry zone could provide another rejection opportunity.
⚠️ Important Levels:
Support: 0.03360
Resistance: 0.03610
Major invalidation: 0.03966
My Strategy: I'm watching for a relief bounce followed by bearish rejection. A confirmed breakdown below support could open the door toward lower targets.
No blind entries — wait for confirmation and manage risk carefully.
🔥 What's your view on $LAB ?
Are bears preparing for another dump, or could bulls surprise everyone?
#LAB #LABUSDT #CryptoAnalysis #BinanceSquare #TradingSignals #Altcoin
Sellers remain dominant on higher timeframes.
Price remains under important moving averages.
Daily RSI is showing weak momentum.
A recovery toward the entry zone could provide another rejection opportunity.
⚠️ Important Levels:
Support: 0.03360
Resistance: 0.03610
Major invalidation: 0.03966
My Strategy: I'm watching for a relief bounce followed by bearish rejection. A confirmed breakdown below support could open the door toward lower targets.
No blind entries — wait for confirmation and manage risk carefully.
🔥 What's your view on $LAB ?
Are bears preparing for another dump, or could bulls surprise everyone?
#LAB #LABUSDT #CryptoAnalysis #BinanceSquare #TradingSignals #Altcoin
1
154
·
--
$TRUMP 🚨 — BIG COMEBACK OR MORE DOWNSIDE? 👀
$TRUMP is facing strong selling pressure, but could an oversold market set the stage for a recovery? 📉➡️📈
Current Market Analysis:
🔴 Price: Around $1.073
📉 Short-term trend: Bearish
🟢 Key Support: $1.066 – $1.024
🔴 First Resistance: $1.150
🚀 Next Resistance: $1.214
{future}(TRUMPUSDT)
Bullish Scenario: If buyers defend the $1.066 support and price breaks above $1.150, a recovery toward $1.214 could become possible.
Bearish Scenario: A breakdown below $1.066 could expose the $1.024 zone, with further downside risk.
⚠️ RSI is showing oversold conditions, but that alone does NOT confirm a trend reversal.
🔥 My View: I'm watching for a strong bounce and volume confirmation before considering a bullish setup. No blind dip buying!
👇 Your Turn: 1️⃣ Are you bullish or bearish on $TRUMP? 2️⃣ Can it reclaim $1.50? 3️⃣ What's your next bull-run target?
Share your prediction below!
#TRUMP #CryptoAnalysis #Memecoin #BinanceSquare #CryptoTrading
$TRUMP 🚨 — BIG COMEBACK OR MORE DOWNSIDE? 👀
$TRUMP is facing strong selling pressure, but could an oversold market set the stage for a recovery? 📉➡️📈
Current Market Analysis:
🔴 Price: Around $1.073
📉 Short-term trend: Bearish
🟢 Key Support: $1.066 – $1.024
🔴 First Resistance: $1.150
🚀 Next Resistance: $1.214
Bullish Scenario: If buyers defend the $1.066 support and price breaks above $1.150, a recovery toward $1.214 could become possible.
Bearish Scenario: A breakdown below $1.066 could expose the $1.024 zone, with further downside risk.
⚠️ RSI is showing oversold conditions, but that alone does NOT confirm a trend reversal.
🔥 My View: I'm watching for a strong bounce and volume confirmation before considering a bullish setup. No blind dip buying!
👇 Your Turn: 1️⃣ Are you bullish or bearish on $TRUMP ? 2️⃣ Can it reclaim $1.50? 3️⃣ What's your next bull-run target?
Share your prediction below!
#TRUMP #CryptoAnalysis #Memecoin #BinanceSquare #CryptoTrading
$TRUMP is facing strong selling pressure, but could an oversold market set the stage for a recovery? 📉➡️📈
Current Market Analysis:
🔴 Price: Around $1.073
📉 Short-term trend: Bearish
🟢 Key Support: $1.066 – $1.024
🔴 First Resistance: $1.150
🚀 Next Resistance: $1.214
Bullish Scenario: If buyers defend the $1.066 support and price breaks above $1.150, a recovery toward $1.214 could become possible.
Bearish Scenario: A breakdown below $1.066 could expose the $1.024 zone, with further downside risk.
⚠️ RSI is showing oversold conditions, but that alone does NOT confirm a trend reversal.
🔥 My View: I'm watching for a strong bounce and volume confirmation before considering a bullish setup. No blind dip buying!
👇 Your Turn: 1️⃣ Are you bullish or bearish on $TRUMP ? 2️⃣ Can it reclaim $1.50? 3️⃣ What's your next bull-run target?
Share your prediction below!
#TRUMP #CryptoAnalysis #Memecoin #BinanceSquare #CryptoTrading
141
·
--
$AVA 🚀 — BULLISH MOMENTUM BUILDING! 📈
AVA is showing positive momentum, currently trading around $0.2472 (+4.34%).
Buyers are attempting to push the price higher, but confirmation is still needed before expecting another strong move.
📊 KEY TECHNICAL LEVELS
🟢 Current Price: $0.2472
🎯 Resistance 1: $0.2510
🚀 Resistance 2: $0.2640
🛡️ Support 1: $0.2378
🛡️ Support 2: $0.2207
📈 BULLISH SCENARIO:
A strong breakout above $0.2510 with increasing volume could open the way toward $0.2640.
{future}(AVAXUSDT)
⚠️ BEARISH SCENARIO:
If AVA loses $0.2378, selling pressure could increase and price may revisit lower support levels.
🔥 MY STRATEGY:
Watching for a confirmed breakout before considering a LONG entry. Avoid chasing green candles without confirmation.
👀 Can AVA break $0.2640 next?
What do you think — BULLISH or BEARISH?
#AVA #AVAUSDT #CryptoAnalysis #BinanceSquare #Altcoins #CryptoTrading
$AVA 🚀 — BULLISH MOMENTUM BUILDING! 📈
AVA is showing positive momentum, currently trading around $0.2472 (+4.34%).
Buyers are attempting to push the price higher, but confirmation is still needed before expecting another strong move.
📊 KEY TECHNICAL LEVELS
🟢 Current Price: $0.2472
🎯 Resistance 1: $0.2510
🚀 Resistance 2: $0.2640
🛡️ Support 1: $0.2378
🛡️ Support 2: $0.2207
📈 BULLISH SCENARIO:
A strong breakout above $0.2510 with increasing volume could open the way toward $0.2640.
⚠️ BEARISH SCENARIO:
If AVA loses $0.2378, selling pressure could increase and price may revisit lower support levels.
🔥 MY STRATEGY:
Watching for a confirmed breakout before considering a LONG entry. Avoid chasing green candles without confirmation.
👀 Can AVA break $0.2640 next?
What do you think — BULLISH or BEARISH?
#AVA #AVAUSDT #CryptoAnalysis #BinanceSquare #Altcoins #CryptoTrading
AVA is showing positive momentum, currently trading around $0.2472 (+4.34%).
Buyers are attempting to push the price higher, but confirmation is still needed before expecting another strong move.
📊 KEY TECHNICAL LEVELS
🟢 Current Price: $0.2472
🎯 Resistance 1: $0.2510
🚀 Resistance 2: $0.2640
🛡️ Support 1: $0.2378
🛡️ Support 2: $0.2207
📈 BULLISH SCENARIO:
A strong breakout above $0.2510 with increasing volume could open the way toward $0.2640.
⚠️ BEARISH SCENARIO:
If AVA loses $0.2378, selling pressure could increase and price may revisit lower support levels.
🔥 MY STRATEGY:
Watching for a confirmed breakout before considering a LONG entry. Avoid chasing green candles without confirmation.
👀 Can AVA break $0.2640 next?
What do you think — BULLISH or BEARISH?
#AVA #AVAUSDT #CryptoAnalysis #BinanceSquare #Altcoins #CryptoTrading
43
·
--
$SOPH 🚀 $SOPH – Bulls Are Taking Control! Is Another Pump Coming?
SOPH is showing strong short-term bullish momentum after a sharp 14.92% move.
{future}(SOPHUSDT)
📊 My Technical Analysis:
🟢 Bullish Confirmation: A strong breakout and hold above $0.001500 could open the door for further upside.
🎯 Upside Targets:
TP1: $0.001590
TP2: $0.001650
🛡️ Support Zones:
$0.001420
$0.001400
❌ Stop Loss: $0.001380
⚡ Market Outlook: Bullish above $0.001500, but rejection could trigger a short-term pullback.
Don't FOMO after a big green candle. Wait for confirmation, manage your risk, and trade smart!
What do you think? Can $SOPH reach $0.001650? 🚀
#SOPH #SOPHUSDT #CryptoTrading #BinanceSquare #Altcoins
$SOPH 🚀 $SOPH – Bulls Are Taking Control! Is Another Pump Coming?
SOPH is showing strong short-term bullish momentum after a sharp 14.92% move.
📊 My Technical Analysis:
🟢 Bullish Confirmation: A strong breakout and hold above $0.001500 could open the door for further upside.
🎯 Upside Targets:
TP1: $0.001590
TP2: $0.001650
🛡️ Support Zones:
$0.001420
$0.001400
❌ Stop Loss: $0.001380
⚡ Market Outlook: Bullish above $0.001500, but rejection could trigger a short-term pullback.
Don't FOMO after a big green candle. Wait for confirmation, manage your risk, and trade smart!
What do you think? Can $SOPH reach $0.001650? 🚀
#SOPH #SOPHUSDT #CryptoTrading #BinanceSquare #Altcoins
SOPH is showing strong short-term bullish momentum after a sharp 14.92% move.
📊 My Technical Analysis:
🟢 Bullish Confirmation: A strong breakout and hold above $0.001500 could open the door for further upside.
🎯 Upside Targets:
TP1: $0.001590
TP2: $0.001650
🛡️ Support Zones:
$0.001420
$0.001400
❌ Stop Loss: $0.001380
⚡ Market Outlook: Bullish above $0.001500, but rejection could trigger a short-term pullback.
Don't FOMO after a big green candle. Wait for confirmation, manage your risk, and trade smart!
What do you think? Can $SOPH reach $0.001650? 🚀
#SOPH #SOPHUSDT #CryptoTrading #BinanceSquare #Altcoins
77
·
--
$HUMA 🚨 $HUMA – BULLISH RECOVERY WATCH!
HUMA is showing a strong short-term recovery, currently trading around $0.00846 (+12.65%).
Buyers are stepping in, but the bigger trend still needs confirmation. Here's what I'm watching:
{future}(HUMAUSDT)
📊 Technical Analysis:
🟢 Entry Zone: $0.00780 – $0.00810
🛡️ Support: $0.00764 – $0.00780
🚧 Resistance 1: $0.00885
🎯 Target 1: $0.00900
🎯 Target 2: $0.00987
🚀 Target 3: $0.01120
❌ Invalidation: A breakdown below $0.00764 could weaken the recovery setup.
🔥 My Outlook: If HUMA holds its support and breaks above $0.00885 with strong volume, another upward move could follow.
⚠️ Don't chase green candles. Wait for confirmation and manage your risk carefully.
What do you think? Is $HUMA ready for another leg up?
#HUMA #HUMAUSDT #CryptoAnalysis #BinanceSquare #Altcoins
$HUMA 🚨 $HUMA – BULLISH RECOVERY WATCH!
HUMA is showing a strong short-term recovery, currently trading around $0.00846 (+12.65%).
Buyers are stepping in, but the bigger trend still needs confirmation. Here's what I'm watching:
📊 Technical Analysis:
🟢 Entry Zone: $0.00780 – $0.00810
🛡️ Support: $0.00764 – $0.00780
🚧 Resistance 1: $0.00885
🎯 Target 1: $0.00900
🎯 Target 2: $0.00987
🚀 Target 3: $0.01120
❌ Invalidation: A breakdown below $0.00764 could weaken the recovery setup.
🔥 My Outlook: If HUMA holds its support and breaks above $0.00885 with strong volume, another upward move could follow.
⚠️ Don't chase green candles. Wait for confirmation and manage your risk carefully.
What do you think? Is $HUMA ready for another leg up?
#HUMA #HUMAUSDT #CryptoAnalysis #BinanceSquare #Altcoins
HUMA is showing a strong short-term recovery, currently trading around $0.00846 (+12.65%).
Buyers are stepping in, but the bigger trend still needs confirmation. Here's what I'm watching:
📊 Technical Analysis:
🟢 Entry Zone: $0.00780 – $0.00810
🛡️ Support: $0.00764 – $0.00780
🚧 Resistance 1: $0.00885
🎯 Target 1: $0.00900
🎯 Target 2: $0.00987
🚀 Target 3: $0.01120
❌ Invalidation: A breakdown below $0.00764 could weaken the recovery setup.
🔥 My Outlook: If HUMA holds its support and breaks above $0.00885 with strong volume, another upward move could follow.
⚠️ Don't chase green candles. Wait for confirmation and manage your risk carefully.
What do you think? Is $HUMA ready for another leg up?
#HUMA #HUMAUSDT #CryptoAnalysis #BinanceSquare #Altcoins
173
·
--
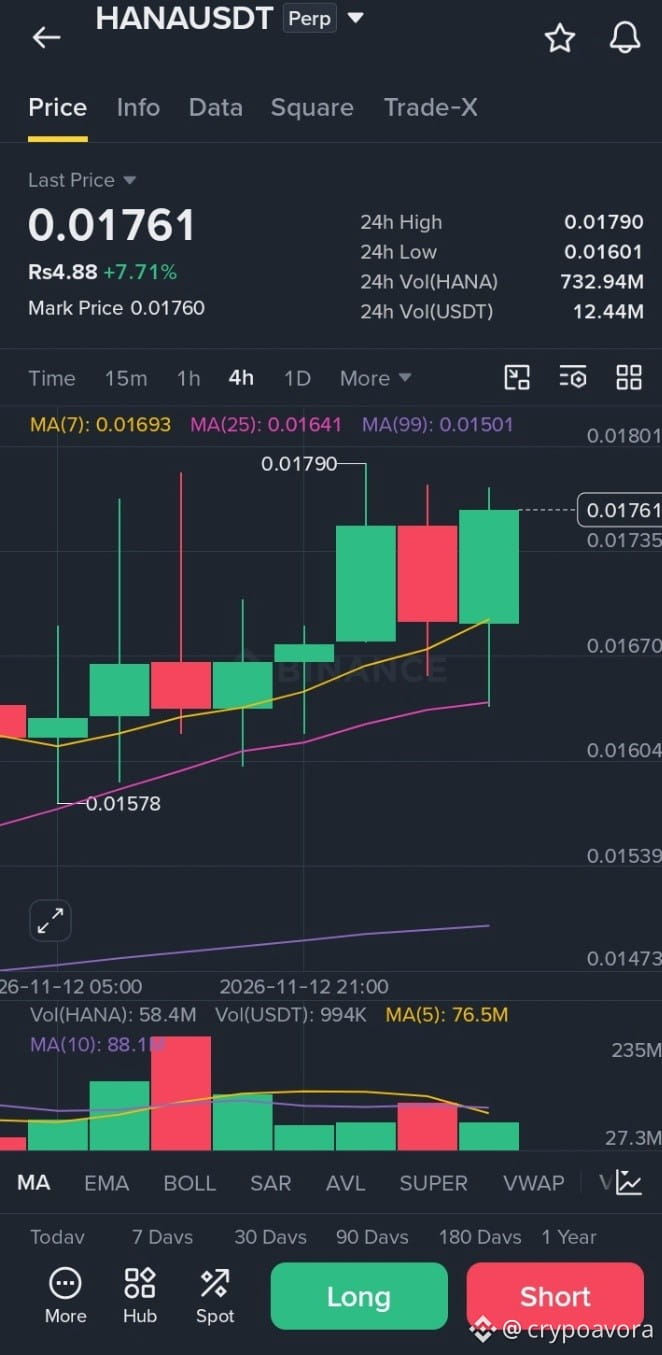
$HANA 🚀 — BULLISH RECOVERY UNDERWAY?
📊 HANAUSDT Perpetual
💰 Current Price: $0.01759
🟢 24H Change: +6.6%
HANA is showing a strong recovery, but bulls now face an important resistance zone.
🔍 KEY TECHNICAL LEVELS
🟢 Immediate Support: $0.01701
🟢 Major Demand Zone: $0.01400 – $0.01550
🔴 Immediate Resistance: $0.01745 – $0.01760
🚀 Next Resistance: $0.01926
🎯 Bullish Target: $0.02080
{future}(HANAUSDT)
{future}(BTCUSDT)
📈 BULLISH SCENARIO
A confirmed breakout above $0.01760 with strong volume could open the door toward $0.01926 and potentially $0.02080.
📉 BEARISH SCENARIO
If HANA loses the $0.01700 support, a pullback toward $0.01550 could follow.
🧠 MY VIEW:
Short-term momentum is improving, but the weekly timeframe still needs confirmation. Watch the breakout, volume, and weekly candle close before assuming a full trend reversal.
⚠️ Don't chase pumps. Manage risk and trade with a clear plan.
What do you think? Can $HANA reach $0.02080 next? 🚀
#HANA #HANAUSDT #CryptoAnalysis #BinanceSquare #Altcoins #CryptoTrading #BTC
$HANA 🚀 — BULLISH RECOVERY UNDERWAY?
📊 HANAUSDT Perpetual
💰 Current Price: $0.01759
🟢 24H Change: +6.6%
HANA is showing a strong recovery, but bulls now face an important resistance zone.
🔍 KEY TECHNICAL LEVELS
🟢 Immediate Support: $0.01701
🟢 Major Demand Zone: $0.01400 – $0.01550
🔴 Immediate Resistance: $0.01745 – $0.01760
🚀 Next Resistance: $0.01926
🎯 Bullish Target: $0.02080
📈 BULLISH SCENARIO
A confirmed breakout above $0.01760 with strong volume could open the door toward $0.01926 and potentially $0.02080.
📉 BEARISH SCENARIO
If HANA loses the $0.01700 support, a pullback toward $0.01550 could follow.
🧠 MY VIEW:
Short-term momentum is improving, but the weekly timeframe still needs confirmation. Watch the breakout, volume, and weekly candle close before assuming a full trend reversal.
⚠️ Don't chase pumps. Manage risk and trade with a clear plan.
What do you think? Can $HANA reach $0.02080 next? 🚀
#HANA #HANAUSDT #CryptoAnalysis #BinanceSquare #Altcoins #CryptoTrading #BTC
📊 HANAUSDT Perpetual
💰 Current Price: $0.01759
🟢 24H Change: +6.6%
HANA is showing a strong recovery, but bulls now face an important resistance zone.
🔍 KEY TECHNICAL LEVELS
🟢 Immediate Support: $0.01701
🟢 Major Demand Zone: $0.01400 – $0.01550
🔴 Immediate Resistance: $0.01745 – $0.01760
🚀 Next Resistance: $0.01926
🎯 Bullish Target: $0.02080
📈 BULLISH SCENARIO
A confirmed breakout above $0.01760 with strong volume could open the door toward $0.01926 and potentially $0.02080.
📉 BEARISH SCENARIO
If HANA loses the $0.01700 support, a pullback toward $0.01550 could follow.
🧠 MY VIEW:
Short-term momentum is improving, but the weekly timeframe still needs confirmation. Watch the breakout, volume, and weekly candle close before assuming a full trend reversal.
⚠️ Don't chase pumps. Manage risk and trade with a clear plan.
What do you think? Can $HANA reach $0.02080 next? 🚀
#HANA #HANAUSDT #CryptoAnalysis #BinanceSquare #Altcoins #CryptoTrading #BTC
240
·
--
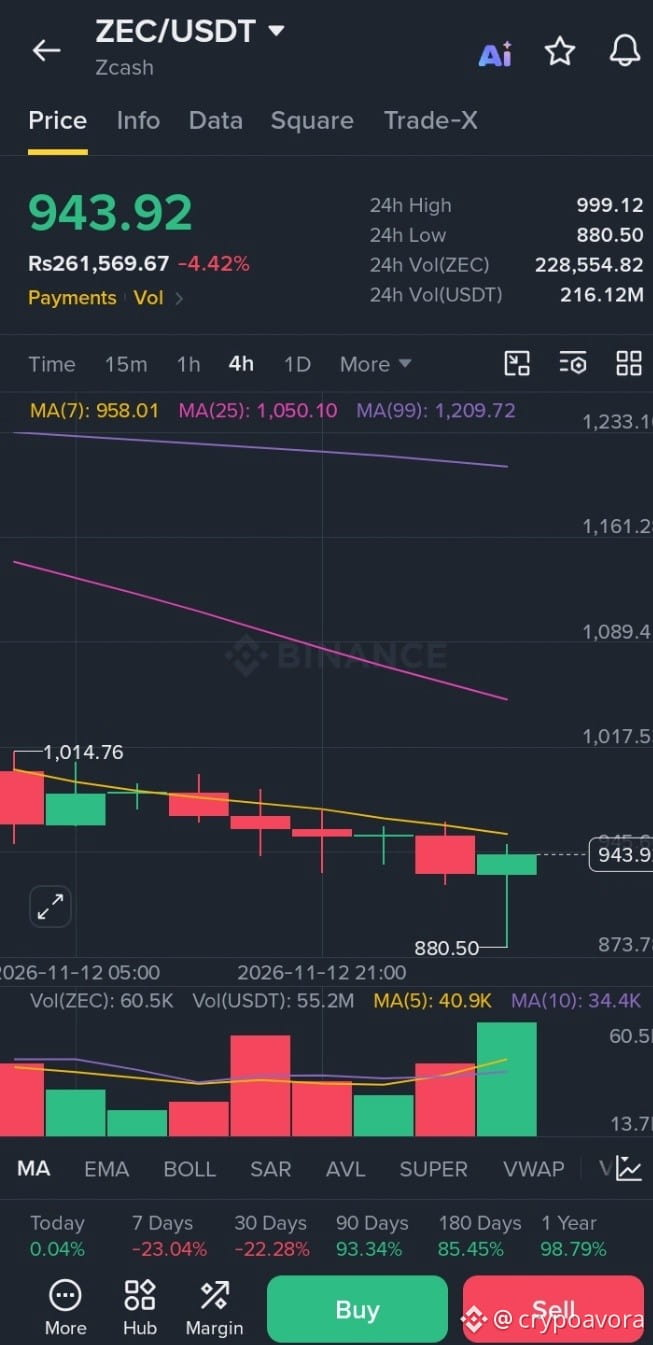
$ZEC 🚨 WHY HAS $ZEC CRASHED SO HARD?
Zcash ($ZEC) is facing serious selling pressure, and this correction is bigger than a normal market pullback.
📉 What's Behind the Drop?
1️⃣ ETF Outflows: Around $14.61M flowed out of Zcash ETFs on November 11, weakening institutional demand.
2️⃣ Long Liquidations: Nearly $18M in leveraged positions were liquidated, adding more selling pressure.
{future}(ZECUSDT)
3️⃣ Market Weakness: Broader crypto market uncertainty and profit-taking have accelerated the decline.
📊 KEY LEVELS TO WATCH
🔴 Resistance 1: $970–$1,000
🔴 Resistance 2: $1,005
🔴 Major Resistance: $1,200
🟢 Support 1: $900
🟢 Major Support Zone: $800–$850
📈 MY MARKET OUTLOOK
ZEC remains bearish in the short term.
A strong recovery above $1,000 could indicate buyers are returning.
However, a breakdown below $900 could expose ZEC to further downside toward the $800–$850 region.
⚠️ MY STRATEGY:
I'm watching for confirmation rather than blindly buying the dip. A falling price doesn't automatically mean a buying opportunity.
💬 Do you think $ZEC will recover above $1,000, or are we heading toward $800?
#ZEC #Zcash #CryptoAnalysis #BinanceSquare #Altcoins
$ZEC 🚨 WHY HAS $ZEC CRASHED SO HARD?
Zcash ($ZEC ) is facing serious selling pressure, and this correction is bigger than a normal market pullback.
📉 What's Behind the Drop?
1️⃣ ETF Outflows: Around $14.61M flowed out of Zcash ETFs on November 11, weakening institutional demand.
2️⃣ Long Liquidations: Nearly $18M in leveraged positions were liquidated, adding more selling pressure.
3️⃣ Market Weakness: Broader crypto market uncertainty and profit-taking have accelerated the decline.
📊 KEY LEVELS TO WATCH
🔴 Resistance 1: $970–$1,000
🔴 Resistance 2: $1,005
🔴 Major Resistance: $1,200
🟢 Support 1: $900
🟢 Major Support Zone: $800–$850
📈 MY MARKET OUTLOOK
ZEC remains bearish in the short term.
A strong recovery above $1,000 could indicate buyers are returning.
However, a breakdown below $900 could expose ZEC to further downside toward the $800–$850 region.
⚠️ MY STRATEGY:
I'm watching for confirmation rather than blindly buying the dip. A falling price doesn't automatically mean a buying opportunity.
💬 Do you think $ZEC will recover above $1,000, or are we heading toward $800?
#ZEC #Zcash #CryptoAnalysis #BinanceSquare #Altcoins
Zcash ($ZEC ) is facing serious selling pressure, and this correction is bigger than a normal market pullback.
📉 What's Behind the Drop?
1️⃣ ETF Outflows: Around $14.61M flowed out of Zcash ETFs on November 11, weakening institutional demand.
2️⃣ Long Liquidations: Nearly $18M in leveraged positions were liquidated, adding more selling pressure.
3️⃣ Market Weakness: Broader crypto market uncertainty and profit-taking have accelerated the decline.
📊 KEY LEVELS TO WATCH
🔴 Resistance 1: $970–$1,000
🔴 Resistance 2: $1,005
🔴 Major Resistance: $1,200
🟢 Support 1: $900
🟢 Major Support Zone: $800–$850
📈 MY MARKET OUTLOOK
ZEC remains bearish in the short term.
A strong recovery above $1,000 could indicate buyers are returning.
However, a breakdown below $900 could expose ZEC to further downside toward the $800–$850 region.
⚠️ MY STRATEGY:
I'm watching for confirmation rather than blindly buying the dip. A falling price doesn't automatically mean a buying opportunity.
💬 Do you think $ZEC will recover above $1,000, or are we heading toward $800?
#ZEC #Zcash #CryptoAnalysis #BinanceSquare #Altcoins
68
·
--
$ETH 🚨 ETHEREUM ($ETH) UNDER HEAVY SELLING PRESSURE — IS A BOUNCE COMING?
$ETH is struggling as sellers continue to dominate the market.
📉 ETH/USDT Market Analysis
💰 Current Price: $1,915.86 🔴 24H Change: -6.56%
📊 Key Technical Levels
🟢 Support Zone: $1,900 – $1,917 🔴 Resistance 1: $1,945 🔴 Resistance 2: $1,981 🔴 Major Resistance: $2,000
📉 Bearish Scenario: If ETH breaks below $1,900 with strong selling volume, the next downside levels could be $1,897 and $1,854.
{spot}(ETHUSDT)
📈 Bullish Scenario: If buyers defend support and ETH reclaims $1,945, a recovery toward $1,981–$2,000 could become possible.
⚠️ Market Insight: ETH is showing oversold conditions, but oversold doesn't automatically mean a reversal. Watch volume and price confirmation before taking any position.
🎯 My Strategy: Patience over panic. Avoid chasing falling prices and manage risk carefully.
👇 What do you think?
1️⃣ ETH will recover above $2,000. 2️⃣ ETH will fall below $1,900.
#ETH #Ethereum #CryptoAnalysis #BinanceSquare #Crypavora
$ETH 🚨 ETHEREUM ($ETH ) UNDER HEAVY SELLING PRESSURE — IS A BOUNCE COMING?
$ETH is struggling as sellers continue to dominate the market.
📉 ETH/USDT Market Analysis
💰 Current Price: $1,915.86 🔴 24H Change: -6.56%
📊 Key Technical Levels
🟢 Support Zone: $1,900 – $1,917 🔴 Resistance 1: $1,945 🔴 Resistance 2: $1,981 🔴 Major Resistance: $2,000
📉 Bearish Scenario: If ETH breaks below $1,900 with strong selling volume, the next downside levels could be $1,897 and $1,854.
📈 Bullish Scenario: If buyers defend support and ETH reclaims $1,945, a recovery toward $1,981–$2,000 could become possible.
⚠️ Market Insight: ETH is showing oversold conditions, but oversold doesn't automatically mean a reversal. Watch volume and price confirmation before taking any position.
🎯 My Strategy: Patience over panic. Avoid chasing falling prices and manage risk carefully.
👇 What do you think?
1️⃣ ETH will recover above $2,000. 2️⃣ ETH will fall below $1,900.
#ETH #Ethereum #CryptoAnalysis #BinanceSquare #Crypavora
$ETH is struggling as sellers continue to dominate the market.
📉 ETH/USDT Market Analysis
💰 Current Price: $1,915.86 🔴 24H Change: -6.56%
📊 Key Technical Levels
🟢 Support Zone: $1,900 – $1,917 🔴 Resistance 1: $1,945 🔴 Resistance 2: $1,981 🔴 Major Resistance: $2,000
📉 Bearish Scenario: If ETH breaks below $1,900 with strong selling volume, the next downside levels could be $1,897 and $1,854.
📈 Bullish Scenario: If buyers defend support and ETH reclaims $1,945, a recovery toward $1,981–$2,000 could become possible.
⚠️ Market Insight: ETH is showing oversold conditions, but oversold doesn't automatically mean a reversal. Watch volume and price confirmation before taking any position.
🎯 My Strategy: Patience over panic. Avoid chasing falling prices and manage risk carefully.
👇 What do you think?
1️⃣ ETH will recover above $2,000. 2️⃣ ETH will fall below $1,900.
#ETH #Ethereum #CryptoAnalysis #BinanceSquare #Crypavora
48
·
--
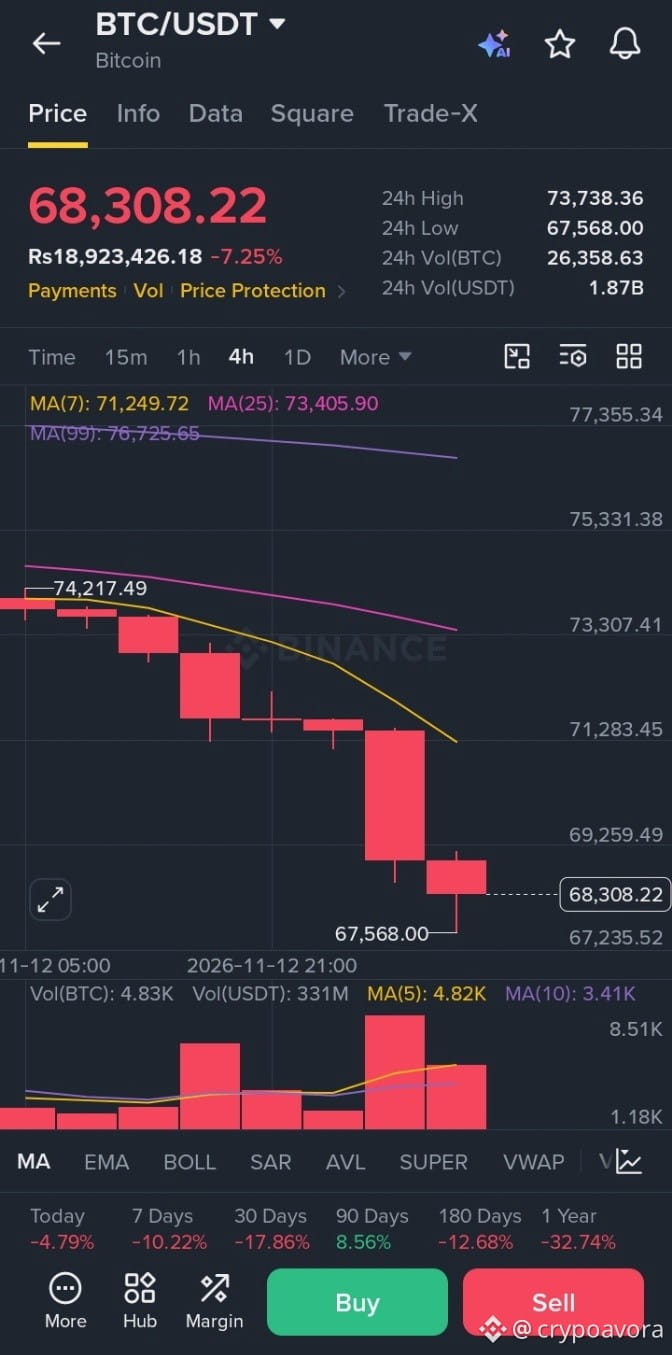
🚨 $BTC — BIG BOUNCE OR ANOTHER DUMP?
Bitcoin is facing heavy selling pressure, but could bulls be preparing a relief bounce? 👀
After this sharp decline, BTC is approaching an important support area. Oversold conditions may attract buyers, but a confirmed reversal is still needed.
📊 BTCUSDT MARKET ANALYSIS
🟢 Support Zone: $67,300 – $68,000
🔴 Resistance 1: $70,100 – $70,300
🔴 Resistance 2: $72,000 – $73,200
{future}(BTCUSDT)
📈 BULLISH SCENARIO: A strong reclaim above $70,300 with volume could open the door toward $72,000.
📉 BEARISH SCENARIO: A breakdown below $67,300 could trigger another wave of selling.
⚠️ MY STRATEGY: I'm watching for a confirmed support reaction before considering a LONG. No blind entries during extreme volatility.
Remember: A falling market can bounce, but not every bounce is a trend reversal.
🔥 Can BTC bulls surprise the market, or will bears remain in control?
#BTC #Bitcoin #CryptoAnalysis #BTCUSDT #BinanceSquare
🚨 $BTC — BIG BOUNCE OR ANOTHER DUMP?
Bitcoin is facing heavy selling pressure, but could bulls be preparing a relief bounce? 👀
After this sharp decline, BTC is approaching an important support area. Oversold conditions may attract buyers, but a confirmed reversal is still needed.
📊 BTCUSDT MARKET ANALYSIS
🟢 Support Zone: $67,300 – $68,000
🔴 Resistance 1: $70,100 – $70,300
🔴 Resistance 2: $72,000 – $73,200
📈 BULLISH SCENARIO: A strong reclaim above $70,300 with volume could open the door toward $72,000.
📉 BEARISH SCENARIO: A breakdown below $67,300 could trigger another wave of selling.
⚠️ MY STRATEGY: I'm watching for a confirmed support reaction before considering a LONG. No blind entries during extreme volatility.
Remember: A falling market can bounce, but not every bounce is a trend reversal.
🔥 Can BTC bulls surprise the market, or will bears remain in control?
#BTC #Bitcoin #CryptoAnalysis #BTCUSDT #BinanceSquare
Bitcoin is facing heavy selling pressure, but could bulls be preparing a relief bounce? 👀
After this sharp decline, BTC is approaching an important support area. Oversold conditions may attract buyers, but a confirmed reversal is still needed.
📊 BTCUSDT MARKET ANALYSIS
🟢 Support Zone: $67,300 – $68,000
🔴 Resistance 1: $70,100 – $70,300
🔴 Resistance 2: $72,000 – $73,200
📈 BULLISH SCENARIO: A strong reclaim above $70,300 with volume could open the door toward $72,000.
📉 BEARISH SCENARIO: A breakdown below $67,300 could trigger another wave of selling.
⚠️ MY STRATEGY: I'm watching for a confirmed support reaction before considering a LONG. No blind entries during extreme volatility.
Remember: A falling market can bounce, but not every bounce is a trend reversal.
🔥 Can BTC bulls surprise the market, or will bears remain in control?
#BTC #Bitcoin #CryptoAnalysis #BTCUSDT #BinanceSquare
83
·
--
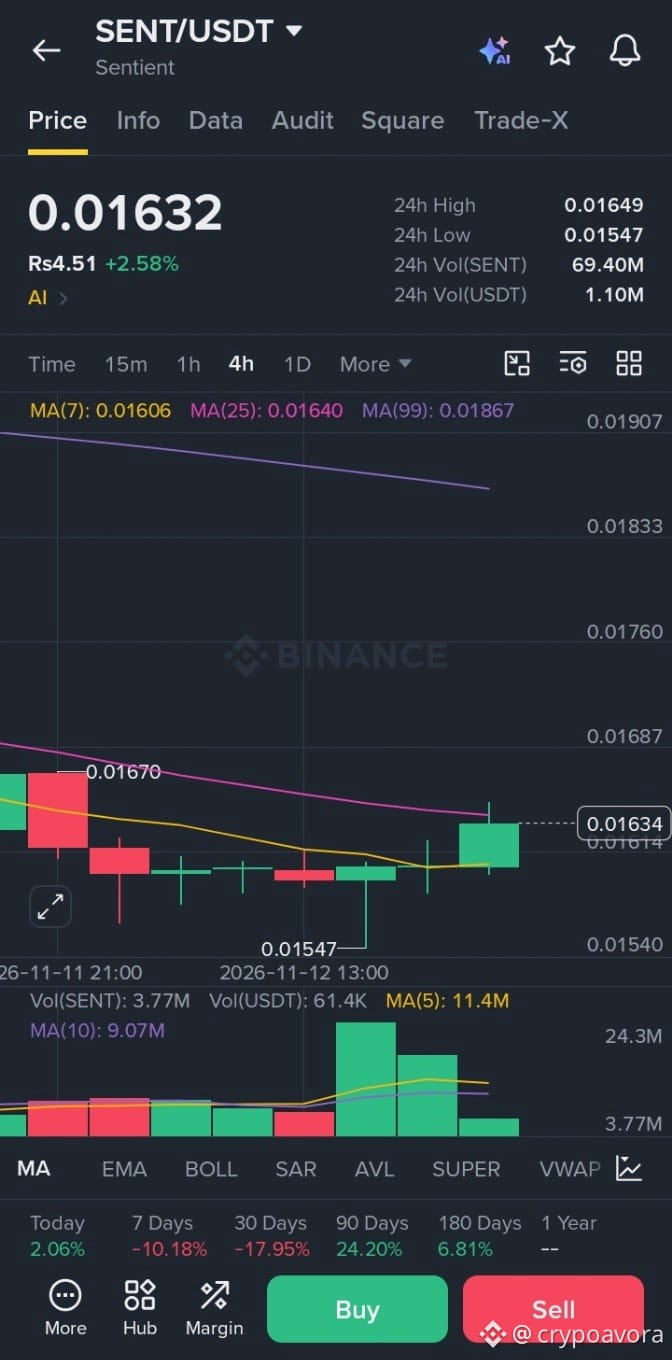
🚨 $SENT — BEARS STILL IN CONTROL! MORE DOWNSIDE AHEAD?
$SENT is struggling to recover, with the broader market structure remaining bearish. Sellers are still dominating, while buyers need stronger momentum to reverse the trend. 📉
📊 CURRENT MARKET ANALYSIS
🔴 Market Price: Around $0.0159
🔴 24H Change: Approximately -3%
🔴 RSI (Daily): 31.5 — Weak Momentum
🎯 KEY LEVELS TO WATCH
🟢 Immediate Support: $0.0154
🟢 Next Support: $0.0148
🔴 Immediate Resistance: $0.0163
🔴 Major Resistance: $0.0169
📉 BEARISH SCENARIO: A confirmed daily close below $0.0154 could expose $0.0148, with further downside risk toward $0.0136.
{future}(SENTUSDT)
🚀 BULLISH SCENARIO: A recovery above $0.0163 could bring buyers back into the market. A stronger move above $0.0169 would improve the short-term outlook.
⚠️ MY TAKE: SENT remains under bearish pressure. RSI is approaching oversold territory, so a relief bounce is possible. However, oversold conditions alone do not confirm a reversal.
👀 Watch support closely. Don't chase sudden moves. Wait for confirmation before making a decision.
What do you think? Will $SENT break support or surprise the bears with a recovery? 🔥
#SENT #Crypto #Altcoins #BinanceSquare #TechnicalAnalysis #CryptoTrading
🚨 $SENT — BEARS STILL IN CONTROL! MORE DOWNSIDE AHEAD?
$SENT is struggling to recover, with the broader market structure remaining bearish. Sellers are still dominating, while buyers need stronger momentum to reverse the trend. 📉
📊 CURRENT MARKET ANALYSIS
🔴 Market Price: Around $0.0159
🔴 24H Change: Approximately -3%
🔴 RSI (Daily): 31.5 — Weak Momentum
🎯 KEY LEVELS TO WATCH
🟢 Immediate Support: $0.0154
🟢 Next Support: $0.0148
🔴 Immediate Resistance: $0.0163
🔴 Major Resistance: $0.0169
📉 BEARISH SCENARIO: A confirmed daily close below $0.0154 could expose $0.0148, with further downside risk toward $0.0136.
🚀 BULLISH SCENARIO: A recovery above $0.0163 could bring buyers back into the market. A stronger move above $0.0169 would improve the short-term outlook.
⚠️ MY TAKE: SENT remains under bearish pressure. RSI is approaching oversold territory, so a relief bounce is possible. However, oversold conditions alone do not confirm a reversal.
👀 Watch support closely. Don't chase sudden moves. Wait for confirmation before making a decision.
What do you think? Will $SENT break support or surprise the bears with a recovery? 🔥
#SENT #Crypto #Altcoins #BinanceSquare #TechnicalAnalysis #CryptoTrading
$SENT is struggling to recover, with the broader market structure remaining bearish. Sellers are still dominating, while buyers need stronger momentum to reverse the trend. 📉
📊 CURRENT MARKET ANALYSIS
🔴 Market Price: Around $0.0159
🔴 24H Change: Approximately -3%
🔴 RSI (Daily): 31.5 — Weak Momentum
🎯 KEY LEVELS TO WATCH
🟢 Immediate Support: $0.0154
🟢 Next Support: $0.0148
🔴 Immediate Resistance: $0.0163
🔴 Major Resistance: $0.0169
📉 BEARISH SCENARIO: A confirmed daily close below $0.0154 could expose $0.0148, with further downside risk toward $0.0136.
🚀 BULLISH SCENARIO: A recovery above $0.0163 could bring buyers back into the market. A stronger move above $0.0169 would improve the short-term outlook.
⚠️ MY TAKE: SENT remains under bearish pressure. RSI is approaching oversold territory, so a relief bounce is possible. However, oversold conditions alone do not confirm a reversal.
👀 Watch support closely. Don't chase sudden moves. Wait for confirmation before making a decision.
What do you think? Will $SENT break support or surprise the bears with a recovery? 🔥
#SENT #Crypto #Altcoins #BinanceSquare #TechnicalAnalysis #CryptoTrading
19
·
--
$PLUME 🚨 SPOT TRADERS: DON'T LET MARKET PANIC DESTROY YOUR CAPITAL! 📉📈
Seeing your favorite coins drop after taking profits can be frustrating, but smart spot trading requires patience, discipline, and proper risk management.
🔥 COINS ON MY WATCHLIST THIS WEEK:
🟢 $PUMP – Pump.fun
Current price: Around $0.0034
Support zone: $0.00335–$0.00344
Resistance: $0.00376–$0.00386
Bearish target: $0.00310
PUMP needs stronger buying volume and a confirmed breakout above resistance to improve its short-term outlook.
{future}(PUMPUSDT)
{spot}(XECUSDT)
{future}(PLUMEUSDT)
🟡 $XEC – eCash
Support: $0.00000537
Resistance: $0.00000561
Next resistance: $0.00000584
XEC remains under bearish pressure. Watch for a confirmed recovery above resistance before expecting a stronger move.
🔴 – Plume
Support: $0.0127
Resistance: $0.0135
Next resistance: $0.0142
PLUME is showing a bearish daily trend. A breakdown below support could bring further downside, while reclaiming $0.0135 would improve recovery chances.
💡 MY SPOT TRADING STRATEGY:
1️⃣ Don't panic-sell just because the market turns red.
2️⃣ Consider taking partial profits around 10–20%, depending on your setup.
3️⃣ Never assume every falling coin will recover.
4️⃣ Keep some USDT available for better opportunities.
5️⃣ Always protect your capital with a clear exit strategy.
⚠️ Remember: A recovery is never guaranteed. Patience is important, but protecting your capital comes first.
Which coin are you watching this week?
$PUMP or $XEC or $PLUME? 👇
#Crypto #BinanceSquare #PUMP #XEC #PLUME #CryptoAnalysis #Altcoins
$PLUME 🚨 SPOT TRADERS: DON'T LET MARKET PANIC DESTROY YOUR CAPITAL! 📉📈
Seeing your favorite coins drop after taking profits can be frustrating, but smart spot trading requires patience, discipline, and proper risk management.
🔥 COINS ON MY WATCHLIST THIS WEEK:
🟢 $PUMP – Pump.fun
Current price: Around $0.0034
Support zone: $0.00335–$0.00344
Resistance: $0.00376–$0.00386
Bearish target: $0.00310
PUMP needs stronger buying volume and a confirmed breakout above resistance to improve its short-term outlook.
🟡 $XEC – eCash
Support: $0.00000537
Resistance: $0.00000561
Next resistance: $0.00000584
XEC remains under bearish pressure. Watch for a confirmed recovery above resistance before expecting a stronger move.
🔴 – Plume
Support: $0.0127
Resistance: $0.0135
Next resistance: $0.0142
PLUME is showing a bearish daily trend. A breakdown below support could bring further downside, while reclaiming $0.0135 would improve recovery chances.
💡 MY SPOT TRADING STRATEGY:
1️⃣ Don't panic-sell just because the market turns red.
2️⃣ Consider taking partial profits around 10–20%, depending on your setup.
3️⃣ Never assume every falling coin will recover.
4️⃣ Keep some USDT available for better opportunities.
5️⃣ Always protect your capital with a clear exit strategy.
⚠️ Remember: A recovery is never guaranteed. Patience is important, but protecting your capital comes first.
Which coin are you watching this week?
$PUMP or $XEC or $PLUME ? 👇
#Crypto #BinanceSquare #PUMP #XEC #PLUME #CryptoAnalysis #Altcoins
Seeing your favorite coins drop after taking profits can be frustrating, but smart spot trading requires patience, discipline, and proper risk management.
🔥 COINS ON MY WATCHLIST THIS WEEK:
🟢 $PUMP – Pump.fun
Current price: Around $0.0034
Support zone: $0.00335–$0.00344
Resistance: $0.00376–$0.00386
Bearish target: $0.00310
PUMP needs stronger buying volume and a confirmed breakout above resistance to improve its short-term outlook.
🟡 $XEC – eCash
Support: $0.00000537
Resistance: $0.00000561
Next resistance: $0.00000584
XEC remains under bearish pressure. Watch for a confirmed recovery above resistance before expecting a stronger move.
🔴 – Plume
Support: $0.0127
Resistance: $0.0135
Next resistance: $0.0142
PLUME is showing a bearish daily trend. A breakdown below support could bring further downside, while reclaiming $0.0135 would improve recovery chances.
💡 MY SPOT TRADING STRATEGY:
1️⃣ Don't panic-sell just because the market turns red.
2️⃣ Consider taking partial profits around 10–20%, depending on your setup.
3️⃣ Never assume every falling coin will recover.
4️⃣ Keep some USDT available for better opportunities.
5️⃣ Always protect your capital with a clear exit strategy.
⚠️ Remember: A recovery is never guaranteed. Patience is important, but protecting your capital comes first.
Which coin are you watching this week?
$PUMP or $XEC or $PLUME ? 👇
#Crypto #BinanceSquare #PUMP #XEC #PLUME #CryptoAnalysis #Altcoins
1
233
·
--
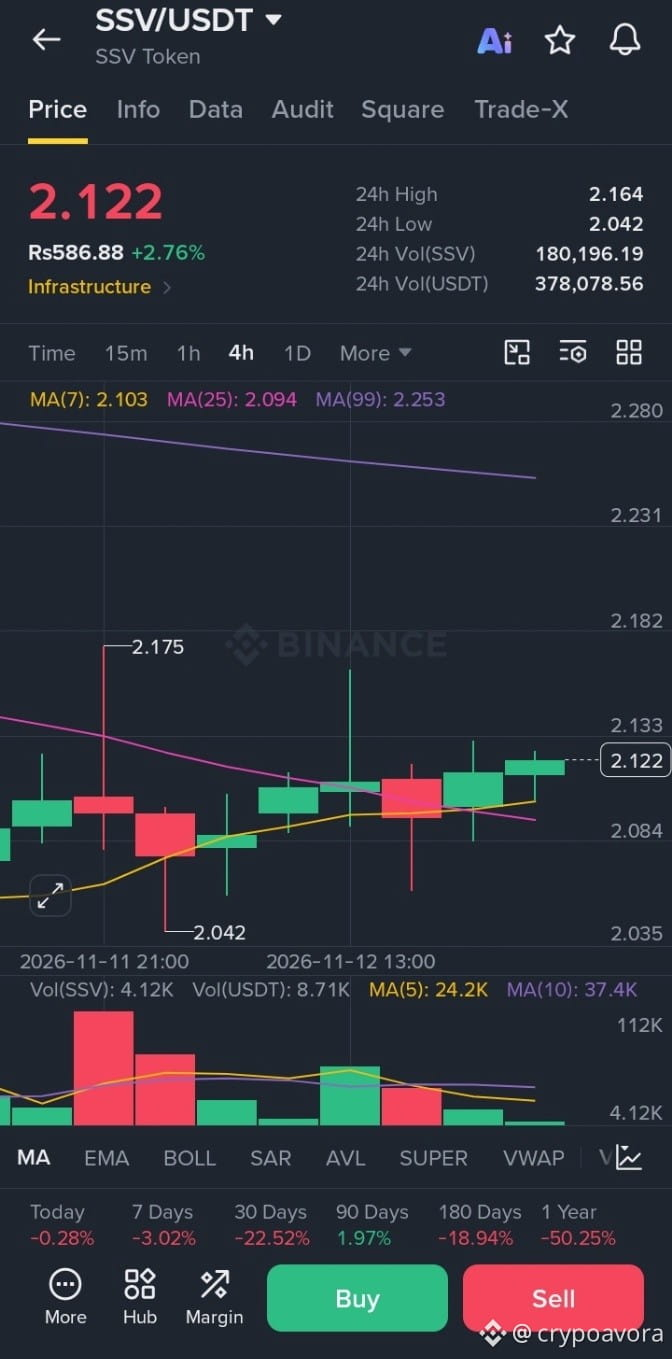
🚨 $SSV — RECOVERY OR ANOTHER BEARISH MOVE?
SSV Network is showing signs of a short-term recovery, but the bigger picture remains bearish. 👀
Currently trading around $2.09, SSV needs a strong breakout to confirm a potential trend reversal.
📊 KEY LEVELS TO WATCH:
🟢 Support: $2.02
🔴 Resistance: $2.11
🎯 Bullish Target 1: $2.17
🎯 Bullish Target 2: $2.29
⚠️ Bearish Target 1: $1.94
⚠️ Bearish Target 2: $1.85
{future}(SSVUSDT)
📈 BULLISH SCENARIO:
A strong breakout and sustained close above $2.11 with increasing volume could open the door toward $2.17.
📉 BEARISH SCENARIO:
If $2.02 support fails, selling pressure could push SSV toward $1.94.
🔥 MY MARKET VIEW:
Short-term recovery is possible, but the overall trend still favors caution. Buyers need stronger volume before bulls can take control.
What do you think? Can $SSV break $2.11, or are we heading toward $1.94? 👇
#SSV #SSVNetwork #CryptoAnalysis #Altcoins #BinanceSquare #CryptoTrading
🚨 $SSV — RECOVERY OR ANOTHER BEARISH MOVE?
SSV Network is showing signs of a short-term recovery, but the bigger picture remains bearish. 👀
Currently trading around $2.09, SSV needs a strong breakout to confirm a potential trend reversal.
📊 KEY LEVELS TO WATCH:
🟢 Support: $2.02
🔴 Resistance: $2.11
🎯 Bullish Target 1: $2.17
🎯 Bullish Target 2: $2.29
⚠️ Bearish Target 1: $1.94
⚠️ Bearish Target 2: $1.85
📈 BULLISH SCENARIO:
A strong breakout and sustained close above $2.11 with increasing volume could open the door toward $2.17.
📉 BEARISH SCENARIO:
If $2.02 support fails, selling pressure could push SSV toward $1.94.
🔥 MY MARKET VIEW:
Short-term recovery is possible, but the overall trend still favors caution. Buyers need stronger volume before bulls can take control.
What do you think? Can $SSV break $2.11, or are we heading toward $1.94? 👇
#SSV #SSVNetwork #CryptoAnalysis #Altcoins #BinanceSquare #CryptoTrading
SSV Network is showing signs of a short-term recovery, but the bigger picture remains bearish. 👀
Currently trading around $2.09, SSV needs a strong breakout to confirm a potential trend reversal.
📊 KEY LEVELS TO WATCH:
🟢 Support: $2.02
🔴 Resistance: $2.11
🎯 Bullish Target 1: $2.17
🎯 Bullish Target 2: $2.29
⚠️ Bearish Target 1: $1.94
⚠️ Bearish Target 2: $1.85
📈 BULLISH SCENARIO:
A strong breakout and sustained close above $2.11 with increasing volume could open the door toward $2.17.
📉 BEARISH SCENARIO:
If $2.02 support fails, selling pressure could push SSV toward $1.94.
🔥 MY MARKET VIEW:
Short-term recovery is possible, but the overall trend still favors caution. Buyers need stronger volume before bulls can take control.
What do you think? Can $SSV break $2.11, or are we heading toward $1.94? 👇
#SSV #SSVNetwork #CryptoAnalysis #Altcoins #BinanceSquare #CryptoTrading
176
·
--
$CBRSB 🐋 SMART MONEY WATCH: WHALE ACCUMULATION OR A FALSE BREAKOUT?
Three assets are catching attention as bullish momentum returns! 👀
🟢 $CBRSB — Strong price movement, but watch whether buyers can sustain the recovery.
{future}(CBRSUSDT)
{spot}(ONEUSDT)
🟢 $ONE — Harmony is showing renewed momentum, with elevated derivatives activity. Can buyers maintain the pressure?
🟢 $AVGOB — Another asset worth monitoring for a potential breakout confirmation.
{spot}(AVGOBUSDT)
📊 WHAT I'M WATCHING:
Increasing spot buying volume
Whale wallet accumulation
Rising Open Interest
Strong volume confirmation
Reduced selling pressure
⚠️ IMPORTANT: A price pump or rising Open Interest alone does NOT prove institutional accumulation.
🎯 MY TAKE: If genuine spot demand continues and resistance breaks, these assets could attract further attention. But a failed breakout could trigger another correction.
🐳 Is smart money accumulating, or are retail traders chasing momentum?
What is your pick: CBRSB, ONE, or AVGOB?
#Crypto #WhaleActivity #SmartMoney #ONE #CBRSB #AVGOB #Altcoins #BinanceSquare
$CBRSB 🐋 SMART MONEY WATCH: WHALE ACCUMULATION OR A FALSE BREAKOUT?
Three assets are catching attention as bullish momentum returns! 👀
🟢 $CBRSB — Strong price movement, but watch whether buyers can sustain the recovery.
🟢 $ONE — Harmony is showing renewed momentum, with elevated derivatives activity. Can buyers maintain the pressure?
🟢 $AVGOB — Another asset worth monitoring for a potential breakout confirmation.
📊 WHAT I'M WATCHING:
Increasing spot buying volume
Whale wallet accumulation
Rising Open Interest
Strong volume confirmation
Reduced selling pressure
⚠️ IMPORTANT: A price pump or rising Open Interest alone does NOT prove institutional accumulation.
🎯 MY TAKE: If genuine spot demand continues and resistance breaks, these assets could attract further attention. But a failed breakout could trigger another correction.
🐳 Is smart money accumulating, or are retail traders chasing momentum?
What is your pick: CBRSB, ONE, or AVGOB?
#Crypto #WhaleActivity #SmartMoney #ONE #CBRSB #AVGOB #Altcoins #BinanceSquare
Three assets are catching attention as bullish momentum returns! 👀
🟢 $CBRSB — Strong price movement, but watch whether buyers can sustain the recovery.
🟢 $ONE — Harmony is showing renewed momentum, with elevated derivatives activity. Can buyers maintain the pressure?
🟢 $AVGOB — Another asset worth monitoring for a potential breakout confirmation.
📊 WHAT I'M WATCHING:
Increasing spot buying volume
Whale wallet accumulation
Rising Open Interest
Strong volume confirmation
Reduced selling pressure
⚠️ IMPORTANT: A price pump or rising Open Interest alone does NOT prove institutional accumulation.
🎯 MY TAKE: If genuine spot demand continues and resistance breaks, these assets could attract further attention. But a failed breakout could trigger another correction.
🐳 Is smart money accumulating, or are retail traders chasing momentum?
What is your pick: CBRSB, ONE, or AVGOB?
#Crypto #WhaleActivity #SmartMoney #ONE #CBRSB #AVGOB #Altcoins #BinanceSquare
371
·
--
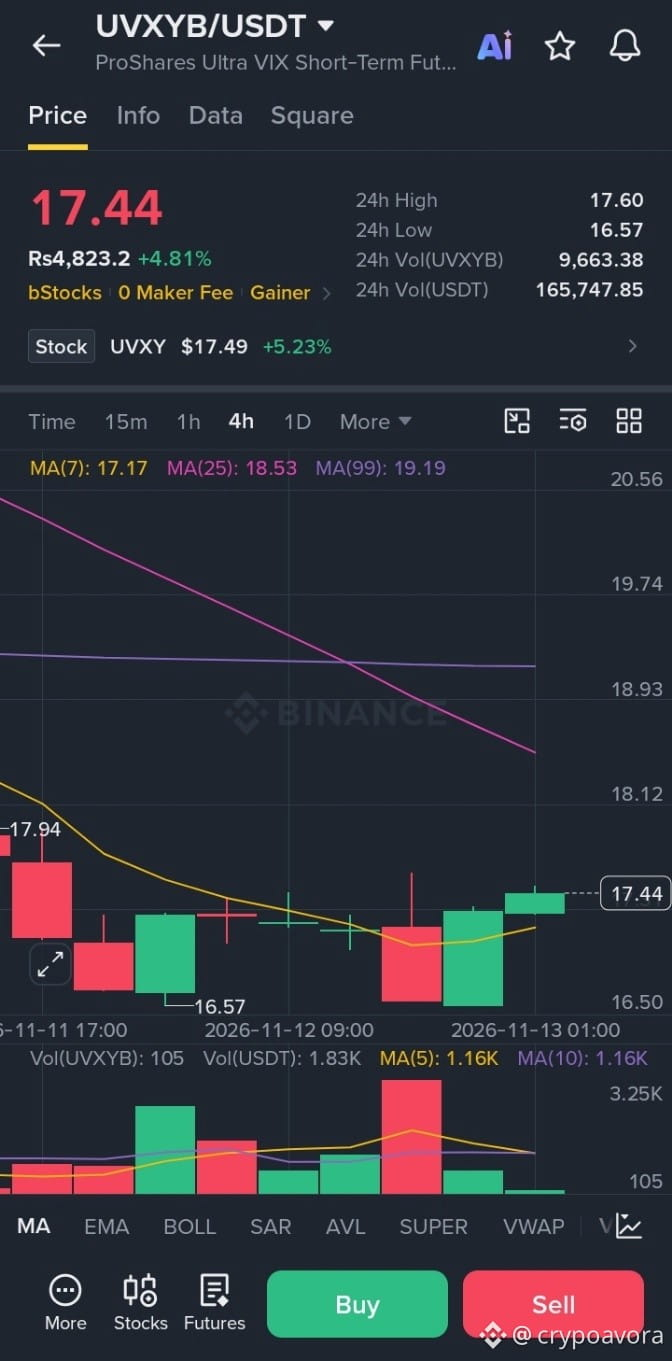
$UVXYB 🚨 $UVXYB — MASSIVE VOLATILITY, BUT IS THE RALLY LOSING STEAM?
UVXYB is showing extreme price swings after its recent explosive move! ⚡
However, recent market data shows a pullback from its highs, suggesting traders should wait for confirmation before entering.
📊 KEY LEVELS TO WATCH
🟢 Support 1: $16.50
🟢 Major Support: $16.00–$16.05
🔴 Resistance 1: $17.90
🔴 Resistance 2: $18.90
🚀 Major Resistance: $24.30–$24.60
{future}(UVXYUSDT)
📈 BULLISH SCENARIO:
A confirmed breakout above $17.90 could open the door toward $18.90.
📉 BEARISH SCENARIO:
Losing the $16.50 support could expose UVXYB to another downside move.
⚠️ IMPORTANT: UVXYB provides exposure to a leveraged volatility ETF through tokenized bStocks. Volatility, liquidity and rapid price reversals make chasing pumps extremely risky.
🎯 My strategy: Wait for confirmation, watch volume, and avoid emotional entries.
Is UVXYB preparing for another explosive rally or a deeper correction?
👇 Let me know your thoughts!
#UVXYB #CryptoTrading #BinanceSquare #MarketAnalysis #Volatility
$UVXYB 🚨 $UVXYB — MASSIVE VOLATILITY, BUT IS THE RALLY LOSING STEAM?
UVXYB is showing extreme price swings after its recent explosive move! ⚡
However, recent market data shows a pullback from its highs, suggesting traders should wait for confirmation before entering.
📊 KEY LEVELS TO WATCH
🟢 Support 1: $16.50
🟢 Major Support: $16.00–$16.05
🔴 Resistance 1: $17.90
🔴 Resistance 2: $18.90
🚀 Major Resistance: $24.30–$24.60
📈 BULLISH SCENARIO:
A confirmed breakout above $17.90 could open the door toward $18.90.
📉 BEARISH SCENARIO:
Losing the $16.50 support could expose UVXYB to another downside move.
⚠️ IMPORTANT: UVXYB provides exposure to a leveraged volatility ETF through tokenized bStocks. Volatility, liquidity and rapid price reversals make chasing pumps extremely risky.
🎯 My strategy: Wait for confirmation, watch volume, and avoid emotional entries.
Is UVXYB preparing for another explosive rally or a deeper correction?
👇 Let me know your thoughts!
#UVXYB #CryptoTrading #BinanceSquare #MarketAnalysis #Volatility
UVXYB is showing extreme price swings after its recent explosive move! ⚡
However, recent market data shows a pullback from its highs, suggesting traders should wait for confirmation before entering.
📊 KEY LEVELS TO WATCH
🟢 Support 1: $16.50
🟢 Major Support: $16.00–$16.05
🔴 Resistance 1: $17.90
🔴 Resistance 2: $18.90
🚀 Major Resistance: $24.30–$24.60
📈 BULLISH SCENARIO:
A confirmed breakout above $17.90 could open the door toward $18.90.
📉 BEARISH SCENARIO:
Losing the $16.50 support could expose UVXYB to another downside move.
⚠️ IMPORTANT: UVXYB provides exposure to a leveraged volatility ETF through tokenized bStocks. Volatility, liquidity and rapid price reversals make chasing pumps extremely risky.
🎯 My strategy: Wait for confirmation, watch volume, and avoid emotional entries.
Is UVXYB preparing for another explosive rally or a deeper correction?
👇 Let me know your thoughts!
#UVXYB #CryptoTrading #BinanceSquare #MarketAnalysis #Volatility
8
·
--
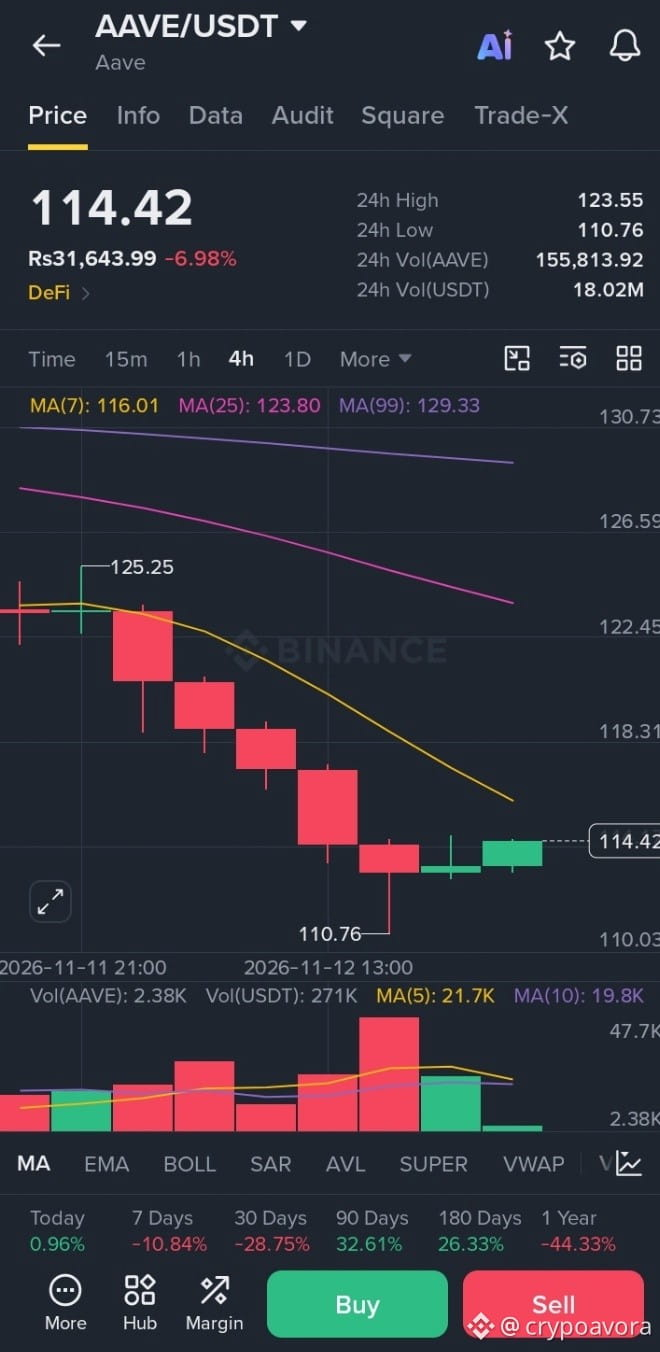
🚨 $ANKR — BEARS IN CONTROL OR A SHORT SQUEEZE LOADING?
ANKR is showing continued weakness, trading around $0.00345, down approximately 2–4% in recent market action. 📉
But there's an interesting signal in the futures market! 👀
📊 Current Market Analysis:
🔴 Immediate Support: $0.00342
🔴 Next Support: $0.00327
🟢 Immediate Resistance: $0.00357
🟢 Strong Resistance: $0.00368–$0.00382
What to Watch Next:
🐻 Bearish Scenario: A confirmed breakdown below $0.00342 could open the door toward $0.00327.
🐂 Bullish Scenario: A strong recovery above $0.00357 could trigger a move toward $0.00368 and $0.00382.
📊 RSI is showing weak momentum, while rising futures activity suggests traders are positioning for a bigger move.
⚠️ Remember: Rising Open Interest does NOT automatically mean more shorts. Watch price action, volume and funding rates together.
{future}(ANKRUSDT)
🔥 What's next for ANKR?
SHORT CONTINUATION 🐻 or BULLISH REVERSAL 🚀?
Drop your prediction below! 👇
#ANKR #ANKRUSDT #CryptoAnalysis #BinanceSquare #Altcoins
🚨 $ANKR — BEARS IN CONTROL OR A SHORT SQUEEZE LOADING?
ANKR is showing continued weakness, trading around $0.00345, down approximately 2–4% in recent market action. 📉
But there's an interesting signal in the futures market! 👀
📊 Current Market Analysis:
🔴 Immediate Support: $0.00342
🔴 Next Support: $0.00327
🟢 Immediate Resistance: $0.00357
🟢 Strong Resistance: $0.00368–$0.00382
What to Watch Next:
🐻 Bearish Scenario: A confirmed breakdown below $0.00342 could open the door toward $0.00327.
🐂 Bullish Scenario: A strong recovery above $0.00357 could trigger a move toward $0.00368 and $0.00382.
📊 RSI is showing weak momentum, while rising futures activity suggests traders are positioning for a bigger move.
⚠️ Remember: Rising Open Interest does NOT automatically mean more shorts. Watch price action, volume and funding rates together.
🔥 What's next for ANKR?
SHORT CONTINUATION 🐻 or BULLISH REVERSAL 🚀?
Drop your prediction below! 👇
#ANKR #ANKRUSDT #CryptoAnalysis #BinanceSquare #Altcoins
ANKR is showing continued weakness, trading around $0.00345, down approximately 2–4% in recent market action. 📉
But there's an interesting signal in the futures market! 👀
📊 Current Market Analysis:
🔴 Immediate Support: $0.00342
🔴 Next Support: $0.00327
🟢 Immediate Resistance: $0.00357
🟢 Strong Resistance: $0.00368–$0.00382
What to Watch Next:
🐻 Bearish Scenario: A confirmed breakdown below $0.00342 could open the door toward $0.00327.
🐂 Bullish Scenario: A strong recovery above $0.00357 could trigger a move toward $0.00368 and $0.00382.
📊 RSI is showing weak momentum, while rising futures activity suggests traders are positioning for a bigger move.
⚠️ Remember: Rising Open Interest does NOT automatically mean more shorts. Watch price action, volume and funding rates together.
🔥 What's next for ANKR?
SHORT CONTINUATION 🐻 or BULLISH REVERSAL 🚀?
Drop your prediction below! 👇
#ANKR #ANKRUSDT #CryptoAnalysis #BinanceSquare #Altcoins
44
·
--
🚨 $AAVE IS BLEEDING! CAN BUYERS SAVE THE TREND? 😰
AAVE is under serious selling pressure, and bulls need to step in before another major leg down! 📉
After the recent decline, the market is showing strong bearish momentum. However, RSI is approaching oversold territory, so a relief bounce is possible.
📊 KEY LEVELS TO WATCH:
🔴 Major Resistance: $123.77
🟡 Next Resistance: $127.48
🟢 Immediate Support: $108.03
⚠️ Next Support: $94.40
🐻 BEARISH SCENARIO: If AAVE loses the $108 support on a daily closing basis, further downside toward $94 could become possible.
🐂 BULLISH SCENARIO: If buyers defend $108 and reclaim $123.77, a recovery toward $127–$133 could be on the table.
🔥 MY TAKE: Don't panic sell or blindly buy the dip. Wait for confirmation and manage your risk carefully.
What do you think? 👇
Are you BUYING the dip or WAITING for lower prices?
#AAVE #Aave #CryptoAnalysis #BinanceSquare #CryptoMarket
{future}(AAVEUSDT)
🚨 $AAVE IS BLEEDING! CAN BUYERS SAVE THE TREND? 😰
AAVE is under serious selling pressure, and bulls need to step in before another major leg down! 📉
After the recent decline, the market is showing strong bearish momentum. However, RSI is approaching oversold territory, so a relief bounce is possible.
📊 KEY LEVELS TO WATCH:
🔴 Major Resistance: $123.77
🟡 Next Resistance: $127.48
🟢 Immediate Support: $108.03
⚠️ Next Support: $94.40
🐻 BEARISH SCENARIO: If AAVE loses the $108 support on a daily closing basis, further downside toward $94 could become possible.
🐂 BULLISH SCENARIO: If buyers defend $108 and reclaim $123.77, a recovery toward $127–$133 could be on the table.
🔥 MY TAKE: Don't panic sell or blindly buy the dip. Wait for confirmation and manage your risk carefully.
What do you think? 👇
Are you BUYING the dip or WAITING for lower prices?
#AAVE #Aave #CryptoAnalysis #BinanceSquare #CryptoMarket
AAVE is under serious selling pressure, and bulls need to step in before another major leg down! 📉
After the recent decline, the market is showing strong bearish momentum. However, RSI is approaching oversold territory, so a relief bounce is possible.
📊 KEY LEVELS TO WATCH:
🔴 Major Resistance: $123.77
🟡 Next Resistance: $127.48
🟢 Immediate Support: $108.03
⚠️ Next Support: $94.40
🐻 BEARISH SCENARIO: If AAVE loses the $108 support on a daily closing basis, further downside toward $94 could become possible.
🐂 BULLISH SCENARIO: If buyers defend $108 and reclaim $123.77, a recovery toward $127–$133 could be on the table.
🔥 MY TAKE: Don't panic sell or blindly buy the dip. Wait for confirmation and manage your risk carefully.
What do you think? 👇
Are you BUYING the dip or WAITING for lower prices?
#AAVE #Aave #CryptoAnalysis #BinanceSquare #CryptoMarket
20
·
--
🚀 $ONE — BULLISH MOMENTUM IS BUILDING! 🔥
Harmony (ONE) is showing a strong recovery, with buyers stepping in after the recent dip!
📊 Current Market Outlook:
💰 Price: Around $0.00165
🟢 Support: $0.00160 – $0.00153
🔴 Resistance: $0.00176 – $0.00183
🎯 Bullish Targets:
- Target 1: $0.00183
- Target 2: $0.00200
- Target 3: $0.00210
📈 RSI is showing positive momentum, suggesting buyers are gaining strength.
⚡ Key Trigger: A strong candle close above $0.00183 with increasing volume could open the door toward $0.002 and beyond.
{future}(ONEUSDT)
⚠️ If support at $0.00153 fails, expect a possible pullback.
Are you bullish on $ONE? Can it reclaim $0.002? 👀
👍 Like & Share if you're watching Harmony!
#ONE #Harmony #ONEUSDT #CryptoAnalysis #Altcoins #BinanceSquare
🚀 $ONE — BULLISH MOMENTUM IS BUILDING! 🔥
Harmony (ONE) is showing a strong recovery, with buyers stepping in after the recent dip!
📊 Current Market Outlook:
💰 Price: Around $0.00165
🟢 Support: $0.00160 – $0.00153
🔴 Resistance: $0.00176 – $0.00183
🎯 Bullish Targets:
- Target 1: $0.00183
- Target 2: $0.00200
- Target 3: $0.00210
📈 RSI is showing positive momentum, suggesting buyers are gaining strength.
⚡ Key Trigger: A strong candle close above $0.00183 with increasing volume could open the door toward $0.002 and beyond.
⚠️ If support at $0.00153 fails, expect a possible pullback.
Are you bullish on $ONE ? Can it reclaim $0.002? 👀
👍 Like & Share if you're watching Harmony!
#ONE #Harmony #ONEUSDT #CryptoAnalysis #Altcoins #BinanceSquare
Harmony (ONE) is showing a strong recovery, with buyers stepping in after the recent dip!
📊 Current Market Outlook:
💰 Price: Around $0.00165
🟢 Support: $0.00160 – $0.00153
🔴 Resistance: $0.00176 – $0.00183
🎯 Bullish Targets:
- Target 1: $0.00183
- Target 2: $0.00200
- Target 3: $0.00210
📈 RSI is showing positive momentum, suggesting buyers are gaining strength.
⚡ Key Trigger: A strong candle close above $0.00183 with increasing volume could open the door toward $0.002 and beyond.
⚠️ If support at $0.00153 fails, expect a possible pullback.
Are you bullish on $ONE ? Can it reclaim $0.002? 👀
👍 Like & Share if you're watching Harmony!
#ONE #Harmony #ONEUSDT #CryptoAnalysis #Altcoins #BinanceSquare
1
391
·
--
$SOXSB 🚨 THE HIDDEN DANGER OF 3X LEVERAGED ETFs! 📉
Many traders focus only on market direction, but there's another factor that can silently destroy their profits: Volatility Decay!
SOL provides 3x DAILY leveraged exposure to the semiconductor sector. That means:
📈 Best Market Conditions:
- Strong and consistent bullish trends.
- Clear upward momentum in semiconductor stocks.
- Low market volatility with limited price fluctuations.
- Short-term trades with proper risk management.
⚠️ When Things Get Dangerous:
- Sideways and choppy markets.
- Sharp daily reversals.
- Sudden market sell-offs.
- Extended holding periods without monitoring.
🔥 The Important Lesson:
A 3X $ETFT.ETF
{spot}(SOXSBUSDT)
{etf_us}(ETFT.ETF)
is designed to amplify DAILY returns, not guarantee 3x returns over weeks or months.
Even if the underlying semiconductor index eventually recovers, volatility and daily compounding can leave leveraged ETF investors with significant losses.
🎯 My Take: Strong trends create opportunities, but volatile sideways markets can become a nightmare for leveraged ETF holders.
What do you think? Would you trade $SOXL for a short-term momentum play or avoid 3X leveraged ETFs altogether?
#SOXL #ETF #Semiconductor #TradingStrategy #CryptoAndStocks #RiskManagement
$SOXSB 🚨 THE HIDDEN DANGER OF 3X LEVERAGED ETFs! 📉
Many traders focus only on market direction, but there's another factor that can silently destroy their profits: Volatility Decay!
SOL provides 3x DAILY leveraged exposure to the semiconductor sector. That means:
📈 Best Market Conditions:
- Strong and consistent bullish trends.
- Clear upward momentum in semiconductor stocks.
- Low market volatility with limited price fluctuations.
- Short-term trades with proper risk management.
⚠️ When Things Get Dangerous:
- Sideways and choppy markets.
- Sharp daily reversals.
- Sudden market sell-offs.
- Extended holding periods without monitoring.
🔥 The Important Lesson:
A 3X $ETFT.ETF
is designed to amplify DAILY returns, not guarantee 3x returns over weeks or months.
Even if the underlying semiconductor index eventually recovers, volatility and daily compounding can leave leveraged ETF investors with significant losses.
🎯 My Take: Strong trends create opportunities, but volatile sideways markets can become a nightmare for leveraged ETF holders.
What do you think? Would you trade $SOXL for a short-term momentum play or avoid 3X leveraged ETFs altogether?
#SOXL #ETF #Semiconductor #TradingStrategy #CryptoAndStocks #RiskManagement
Many traders focus only on market direction, but there's another factor that can silently destroy their profits: Volatility Decay!
SOL provides 3x DAILY leveraged exposure to the semiconductor sector. That means:
📈 Best Market Conditions:
- Strong and consistent bullish trends.
- Clear upward momentum in semiconductor stocks.
- Low market volatility with limited price fluctuations.
- Short-term trades with proper risk management.
⚠️ When Things Get Dangerous:
- Sideways and choppy markets.
- Sharp daily reversals.
- Sudden market sell-offs.
- Extended holding periods without monitoring.
🔥 The Important Lesson:
A 3X $ETFT.ETF
is designed to amplify DAILY returns, not guarantee 3x returns over weeks or months.
Even if the underlying semiconductor index eventually recovers, volatility and daily compounding can leave leveraged ETF investors with significant losses.
🎯 My Take: Strong trends create opportunities, but volatile sideways markets can become a nightmare for leveraged ETF holders.
What do you think? Would you trade $SOXL for a short-term momentum play or avoid 3X leveraged ETFs altogether?
#SOXL #ETF #Semiconductor #TradingStrategy #CryptoAndStocks #RiskManagement
569
·
--
$DODO 🚨 $BARD — CRITICAL SUPPORT TEST! BULLISH BOUNCE OR MORE DOWNSIDE?
Lombard ($BARD ) is facing selling pressure, but buyers are approaching an important support zone! 👀
📊 Current Market Analysis:
💰 Price: ~$0.0824
🔴 24H Change: -4.6%
🟢 Major Support: $0.0810–$0.0800
🔵 Resistance 1: $0.0858
🎯 Resistance 2: $0.0899
🚀 Bullish Target: $0.0948
📈 Bullish Scenario: If BARD holds above $0.0810 and reclaims $0.0858, a recovery toward $0.0899–$0.0948 could become possible.
{spot}(BARDUSDT)
⚠️ Bearish Scenario: A breakdown below $0.0800 could expose the next support near $0.0760.
🔥 My Take: BARD is approaching a critical decision zone. Oversold conditions may create a bounce, but the overall trend remains bearish until resistance is reclaimed.
Are you buying this dip or waiting for confirmation? 👇
#BARD #Lombard #CryptoTrading #BinanceSquare #Altcoins
{spot}(DODOUSDT)
$DODO 🚨 $BARD — CRITICAL SUPPORT TEST! BULLISH BOUNCE OR MORE DOWNSIDE?
Lombard ($BARD ) is facing selling pressure, but buyers are approaching an important support zone! 👀
📊 Current Market Analysis:
💰 Price: ~$0.0824
🔴 24H Change: -4.6%
🟢 Major Support: $0.0810–$0.0800
🔵 Resistance 1: $0.0858
🎯 Resistance 2: $0.0899
🚀 Bullish Target: $0.0948
📈 Bullish Scenario: If BARD holds above $0.0810 and reclaims $0.0858, a recovery toward $0.0899–$0.0948 could become possible.
⚠️ Bearish Scenario: A breakdown below $0.0800 could expose the next support near $0.0760.
🔥 My Take: BARD is approaching a critical decision zone. Oversold conditions may create a bounce, but the overall trend remains bearish until resistance is reclaimed.
Are you buying this dip or waiting for confirmation? 👇
#BARD #Lombard #CryptoTrading #BinanceSquare #Altcoins
Lombard ($BARD ) is facing selling pressure, but buyers are approaching an important support zone! 👀
📊 Current Market Analysis:
💰 Price: ~$0.0824
🔴 24H Change: -4.6%
🟢 Major Support: $0.0810–$0.0800
🔵 Resistance 1: $0.0858
🎯 Resistance 2: $0.0899
🚀 Bullish Target: $0.0948
📈 Bullish Scenario: If BARD holds above $0.0810 and reclaims $0.0858, a recovery toward $0.0899–$0.0948 could become possible.
⚠️ Bearish Scenario: A breakdown below $0.0800 could expose the next support near $0.0760.
🔥 My Take: BARD is approaching a critical decision zone. Oversold conditions may create a bounce, but the overall trend remains bearish until resistance is reclaimed.
Are you buying this dip or waiting for confirmation? 👇
#BARD #Lombard #CryptoTrading #BinanceSquare #Altcoins
290
Log in to explore more content
Join global crypto users on Binance Square
⚡️ Get latest and useful information about crypto.
💬 Trusted by the world’s largest crypto exchange.
👍 Discover real insights from verified creators.
Email / Phone number
Trending Topics
WhatWillDriveCryptoandStocks’NextRebound?
29,236 views
477 Discussing
Bitcoin Slips Below $70,000 as Dollar Index Hits 19-Month High
Binance News
·12 Likes
·28.9k views
Anthropic’s6xIPODemandSignalsPotentialRecordRaise
8,984 views
217 Discussing
HuangExitNvidiaStrategyInFocus
173,262 views
1,536 Discussing