Professional integration of momentum, trend, and price structure
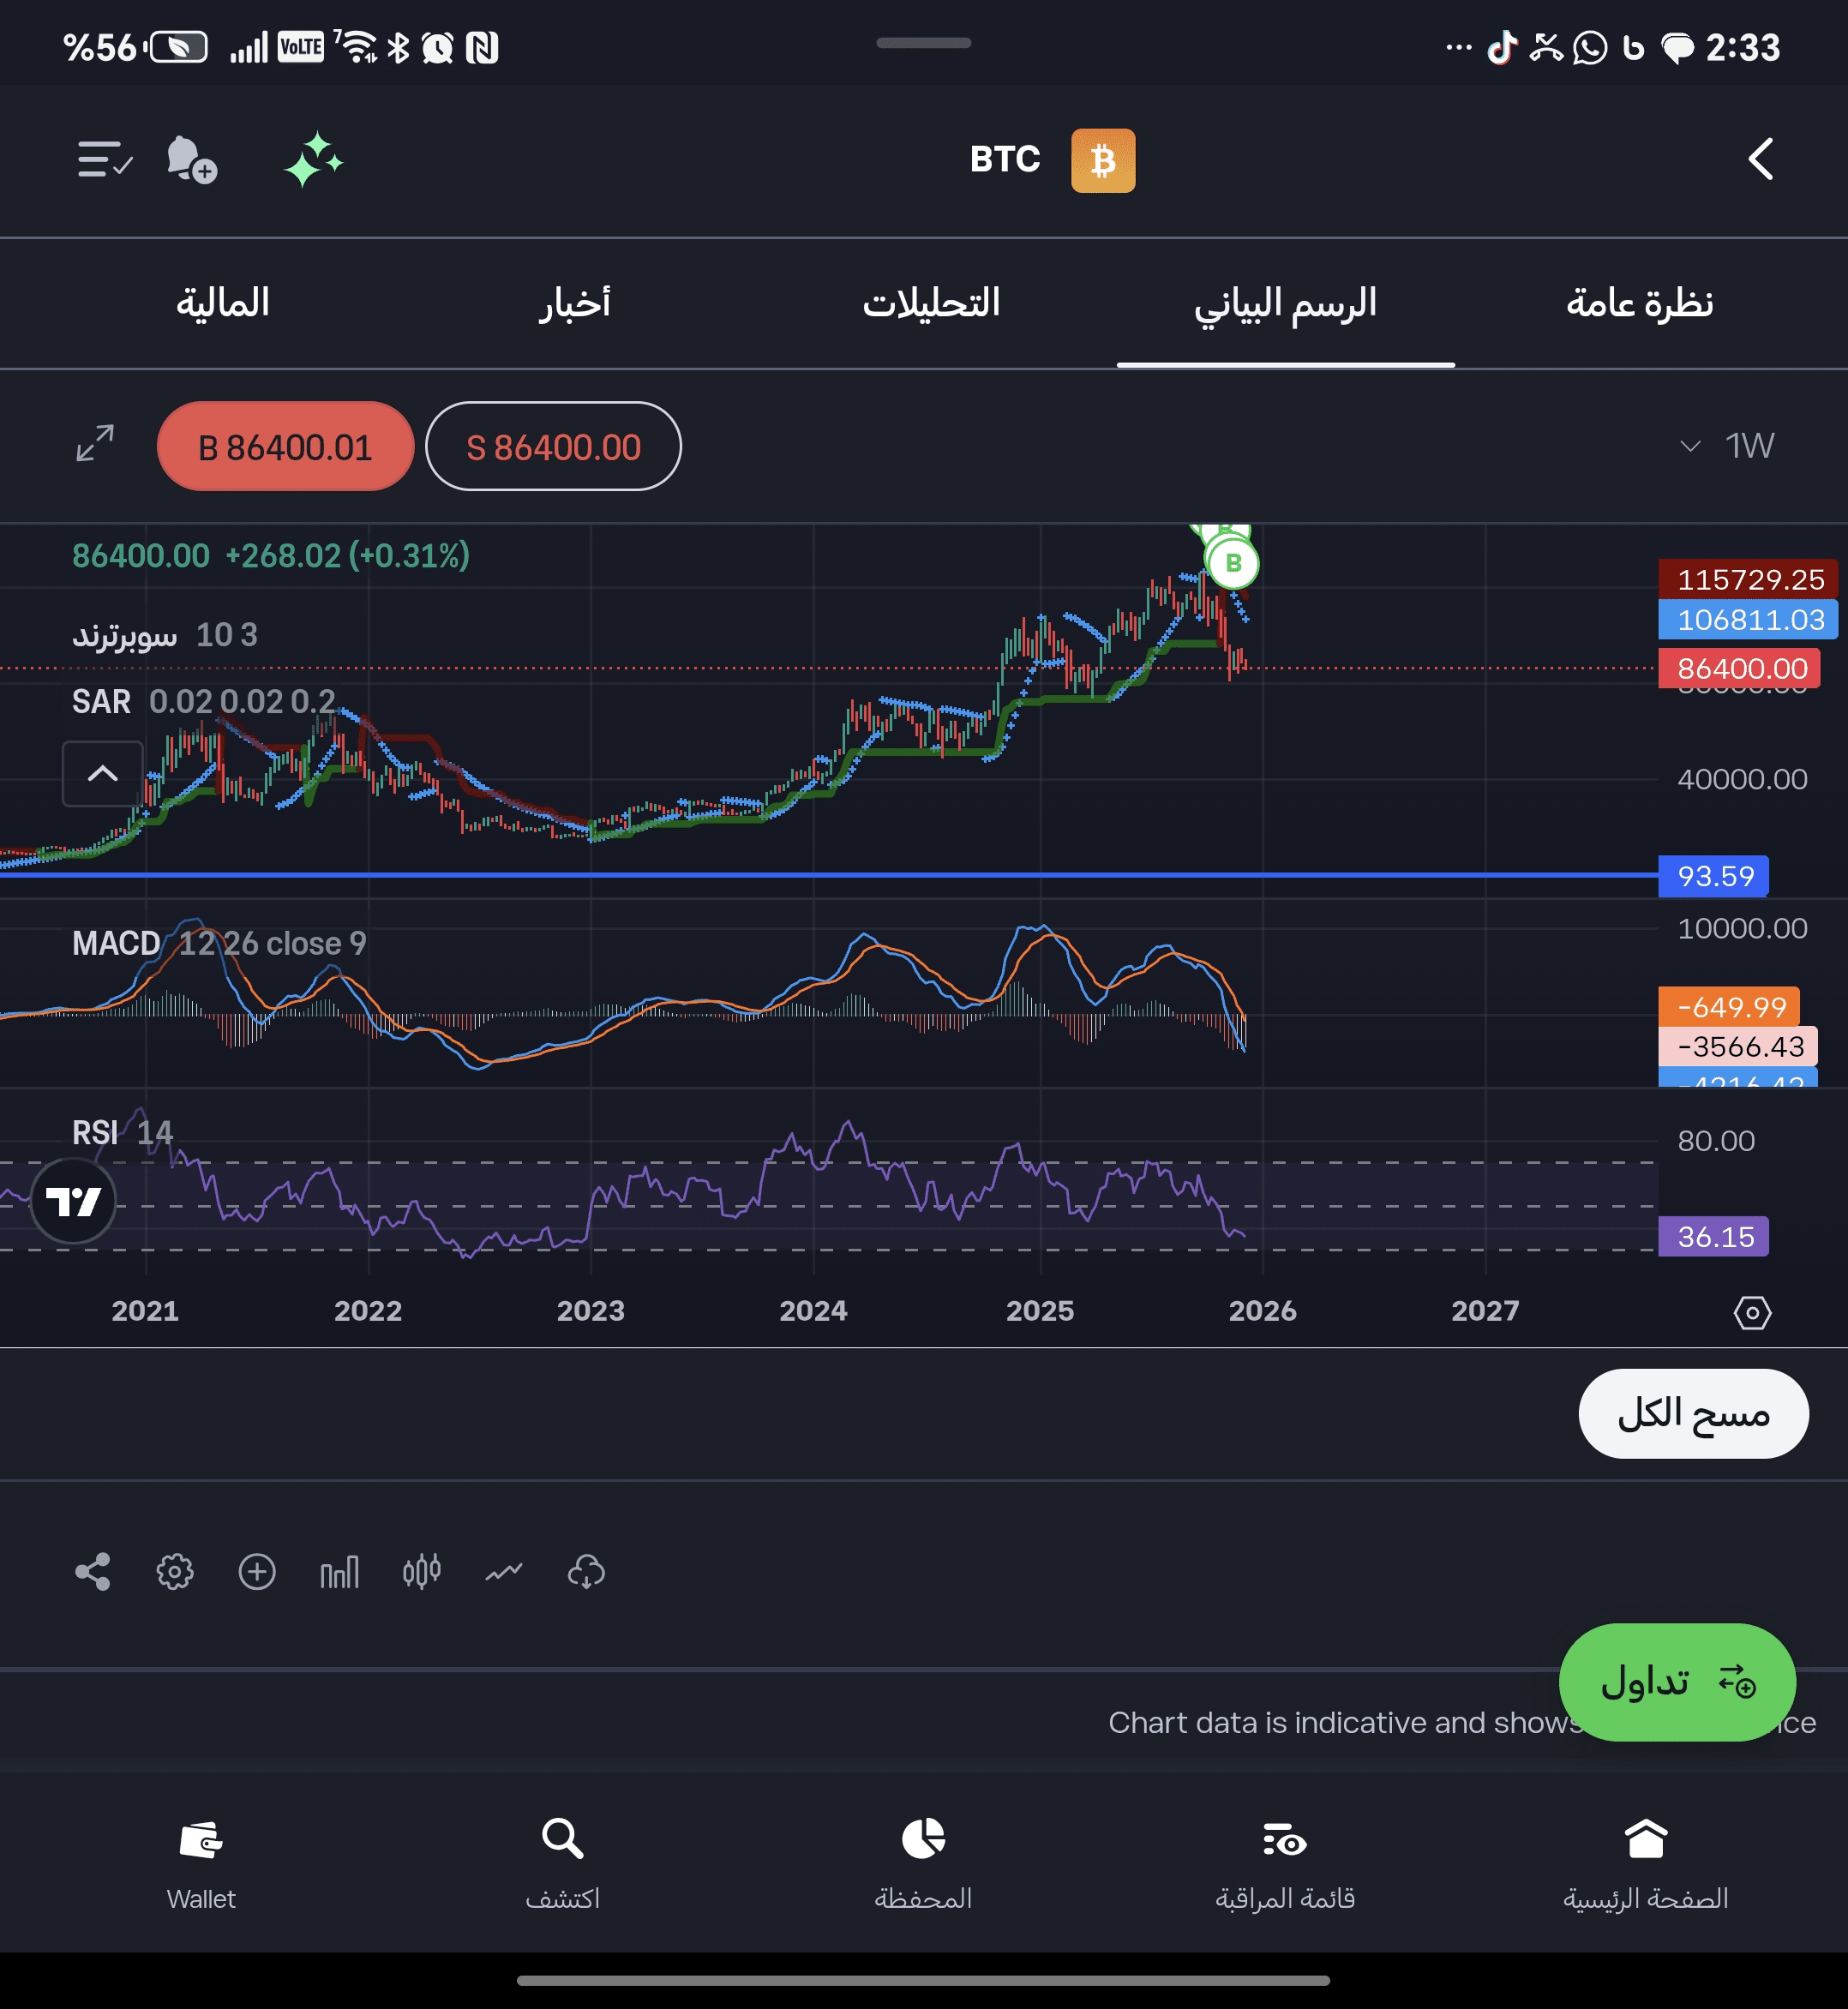
Origin: Bitcoin (BTC/USD)
Time frame: Weekly (1W)
Price at the time of analysis: $86,400
Approach: Trend + Momentum + Market Structure
🧠 1. The big picture (Macro Structure)
The long-term trend of Bitcoin is structurally bullish since 2023.
The historical peaks and troughs are still higher than their predecessors.
No long-term structural support has been broken.
📌 Conclusion:
Bitcoin is still in a major upward market (Macro Bull Market).
🔴 2. current weekly trend (Weekly Trend)
despite the long-term upward structure, the weekly frame clearly shows:
SuperTrend
the price broke the SuperTrend line downward.
closing below the indicator = confirmed exit signal.
Parabolic SAR
SAR points above the price.
confirming that the weekly trend has reversed to corrective/downward.
📌 Conclusion:
the weekly trend is currently corrective downward within a major upward market.
⚡ 3. momentum (Momentum Analysis)
MACD (12,26,9)
confirmed downward crossover.
the lines are below zero.
upward momentum lost control.
📌 Signal: Exit / Wait
RSI (14)
current reading: 36.15
less than 50 = negative momentum
close to 30 = approaching oversold territory
📌 smart reading:
not a buy signal yet
but it is a watch area for rebound
🧩 4. smart consolidation (most important part)
element reading
long-term structure upward
weekly trend corrective
momentum negative
RSI low (not yet oversold)
SuperTrend broken
SAR above the price
📌 core result:
we are not in a crash, and we are not in a buy —
we are in a correction phase within an upward trend
🎯 5. critical levels (Key Levels)
🔼 resistances
94,000: nearby technical resistance (Pivot)
106,800: SuperTrend recovery
115,700: historical peak
🔽 supports
83,000 – 80,000: critical short-term support
72,000 – 68,000: medium-term corrective support
40,000: distant structural support (panic scenario only)
🟢 6. professional scenarios
🟢 positive scenario (fundamental – higher probability)
consolidation above 80k
RSI rebounds from 30–35
MACD mitigates negativity
break above 94k
📌 Result:
rebound → accumulation → attempt to regain the upward trend
🔴 negative scenario (alternative)
clear breakout of 80k
RSI enters oversold territory
negative momentum acceleration
📌 Result:
> drop towards 72k then 68k before any new rise
🧠 7. final summary (Institutional Verdict)
> Bitcoin is still in a major upward market,
but it is currently undergoing a healthy weekly correction.
❌ no buying now for conservative investors
❌ no panic selling
✅ waiting for trend confirmation
✅ strict risk management
✅ monitoring starts from RSI + SuperTrend