🧠 Analysis on merging the 4-hour timeframe with the daily timeframe for BTC/USDT
(Daily + 4H | Market Structure + Price Action)
1️⃣ General Framework: The Big Picture Rules Everything (Daily Bias)
🔴 Primary Trend
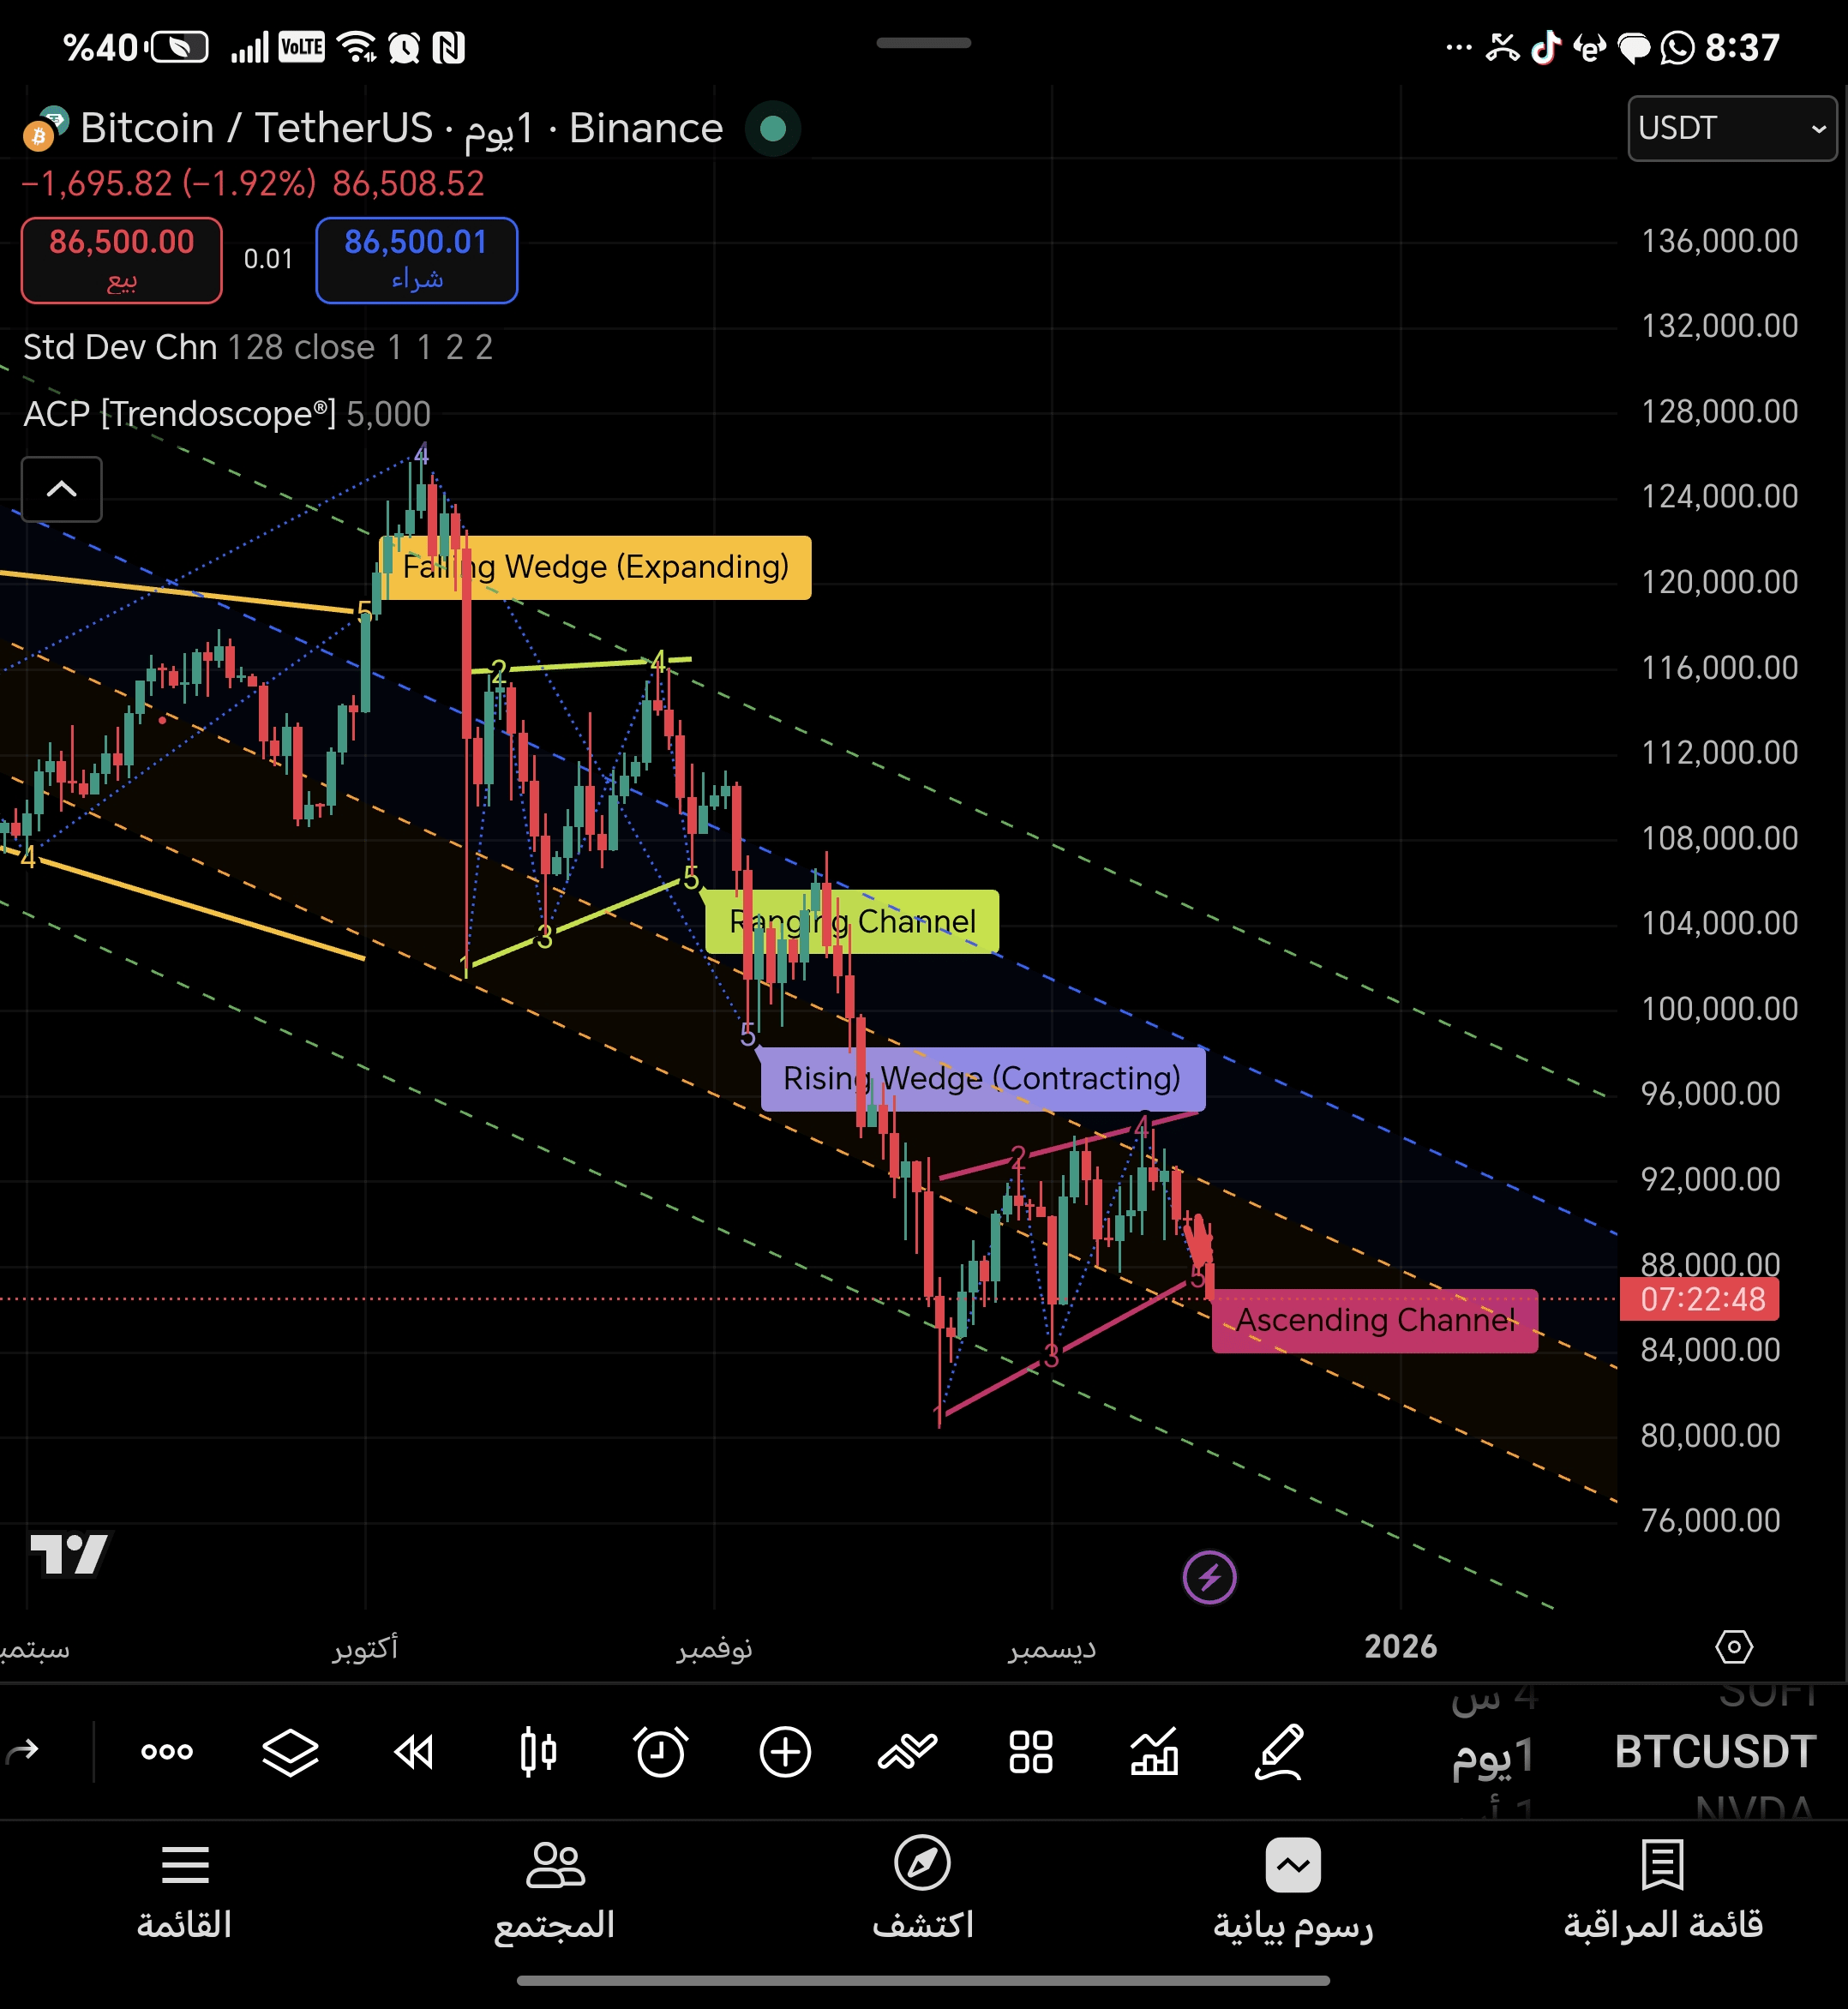
The market is moving within a broad falling channel (Broad Falling Channel).
The price structure is clear:
Lower Highs
Lower Lows
The current price is positioned in the lower half of the channel
➡️ This confirms that selling pressure is structurally dominant.
The conclusion here:
Any rise is considered corrective unless the daily structure is broken.
2️⃣ Sequence of patterns: Why is this drop “smart” and not random?
🧱 Smart reading of price history
The market has gone through a series of failed bounce attempts within the downward trend:
The pattern The real interpretation
Falling Wedge (Expanding) Failed reversal attempt → Strength of the downward trend
Ranging Channel Distribution not accumulation
Rising Wedge (Contracting) Continuation pattern downward → Its breakout accelerated selling
Ascending Channel (the last) Classic Bear Flag
📌 The most important point:
A strong trend is not measured by the success of one pattern,
But by the number of patterns that failed against it — and this is clearly what we see.
3️⃣ Critical linkage: What did the 4-hour frame add?
🔗 Role of 4H = Timing and confirmation
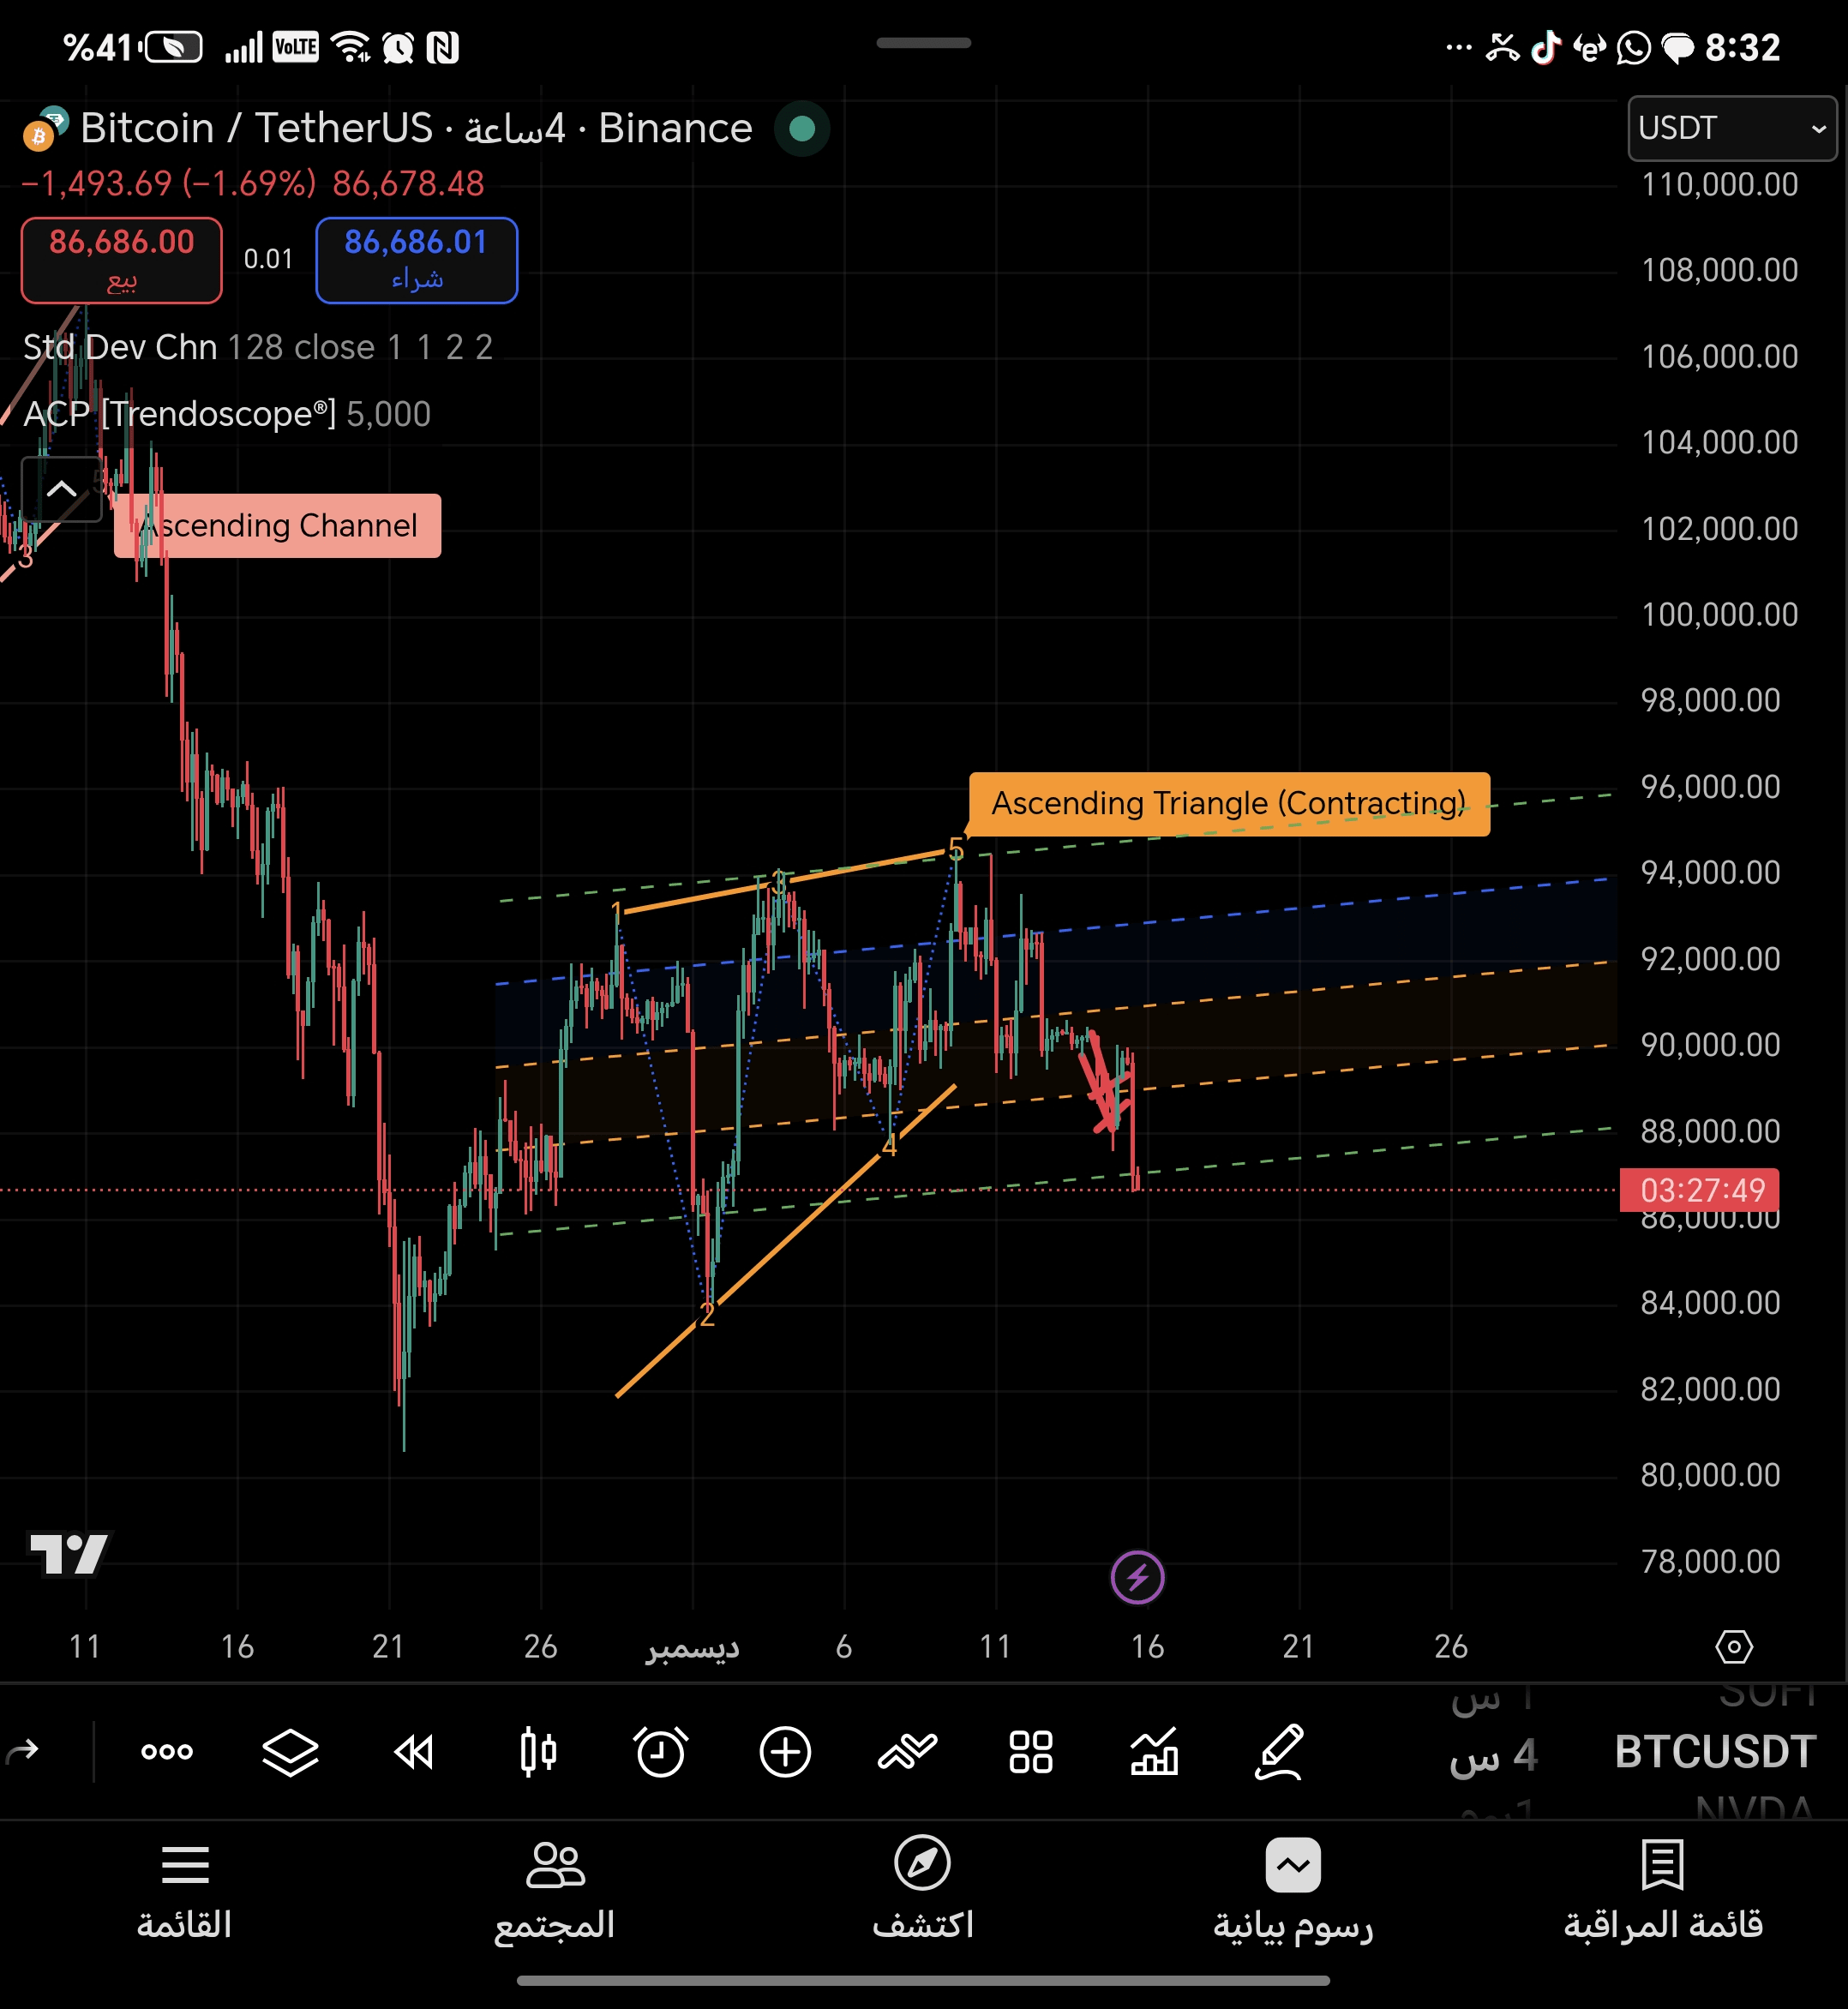
On 4H appeared:
Initial break of support inside the triangle/ascending channel
On Daily:
This breakout is no longer noise
But it has become aligned with the larger trend
➡️ The result:
Breakout on 4H = Trigger
Daily = Confirmation
And this raises the probability of the bearish scenario to 75–80%.
4️⃣ Current status with surgical precision (Where We Are Now)
🔻 What is happening now?
The last ascending channel (Bear Flag) is subject to breakout
None:
Bullish expansion
And no recovery to pivotal levels
Momentum tends to continue rather than reverse
📌 This means:
The market is not collapsing
The market resumes its trend.
5️⃣ Key levels (Execution Map)
🎯 Logical targets according to structure
Level Significance
86,000 Current structural resistance
84,500 First Demand
82,000 Strong daily Pivot
80,000 Structural Target
76,000–78,000 Extension in case of Panic / News
⚠️ Reaching 80K:
Not immediate
But it has become a realistic scenario and not a hypothetical one
6️⃣ Risk management: When do we err? (Invalidation)
❌ Cancelling the bearish scenario only if:
Clear daily close above:
92,500
Then 94,000
With recovery:
Mid of the descending channel
And a shift in structure (Higher High)
Without that:
Any rise = Relief Rally / Sell the Rally
🏁 Final Summary (Institutional Verdict)
Overall trend: Downward
All recent bounces: Corrective
Bullish patterns: failing consecutively
Current breakout: time-wise and structurally compatible
Control: with sellers until further notice
This is not a “Candle Prediction” analysis…
This is a diagnosis of a complete market cycle.