I’ve closely analyzed the Solana (SOL) chart using pure market structure, focusing on what has already happened and what is most likely to happen next. Based on this analysis, I see two possible scenarios, and both favor a bearish continuation.
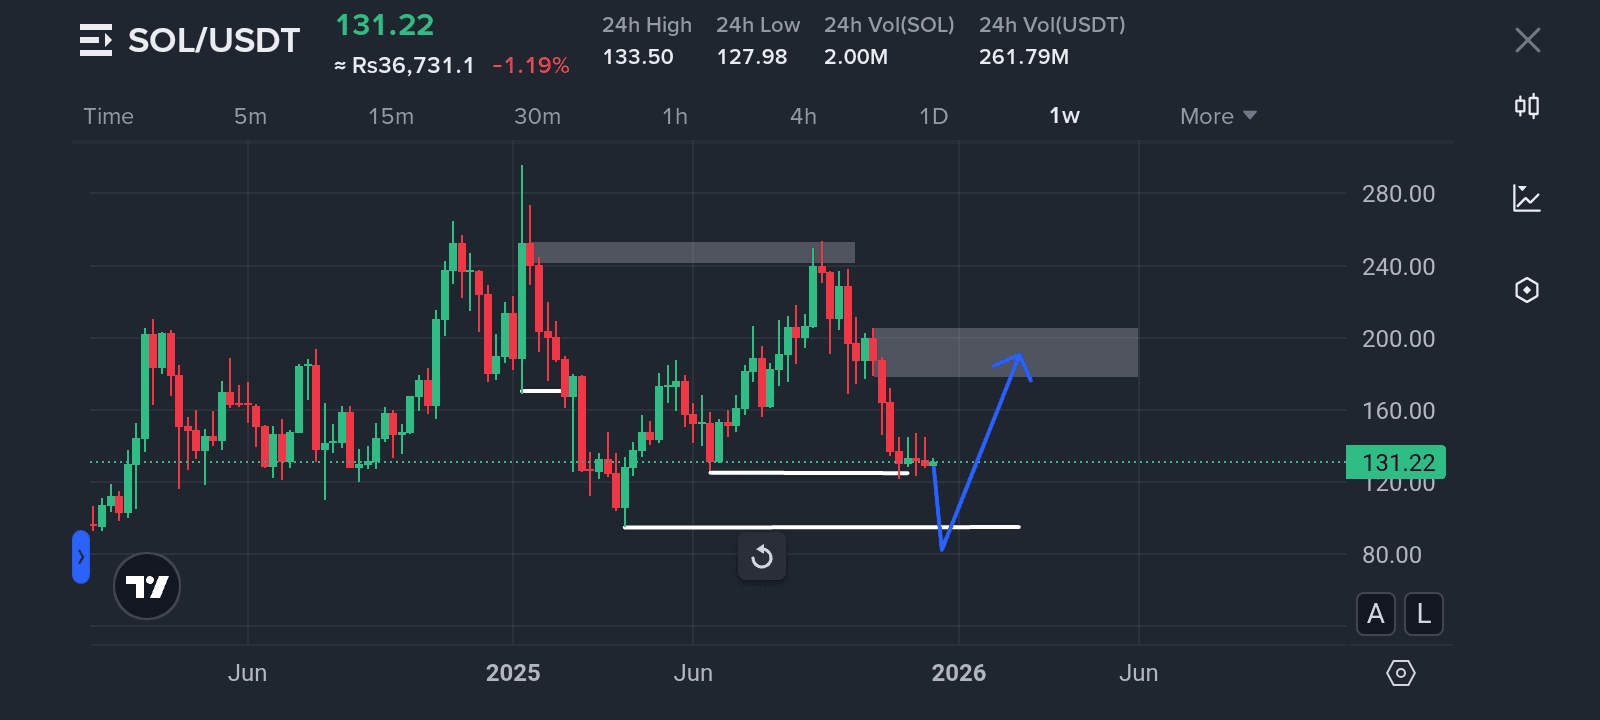
Scenario 1: Pullback Before Further Decline
On the weekly timeframe, SOL broke a major structural low at $170.25, which marked a clear trend shift from bullish to bearish.
After this shift:
SOL created another lower low by breaking $125
This confirms a bearish structure (lower highs and lower lows)
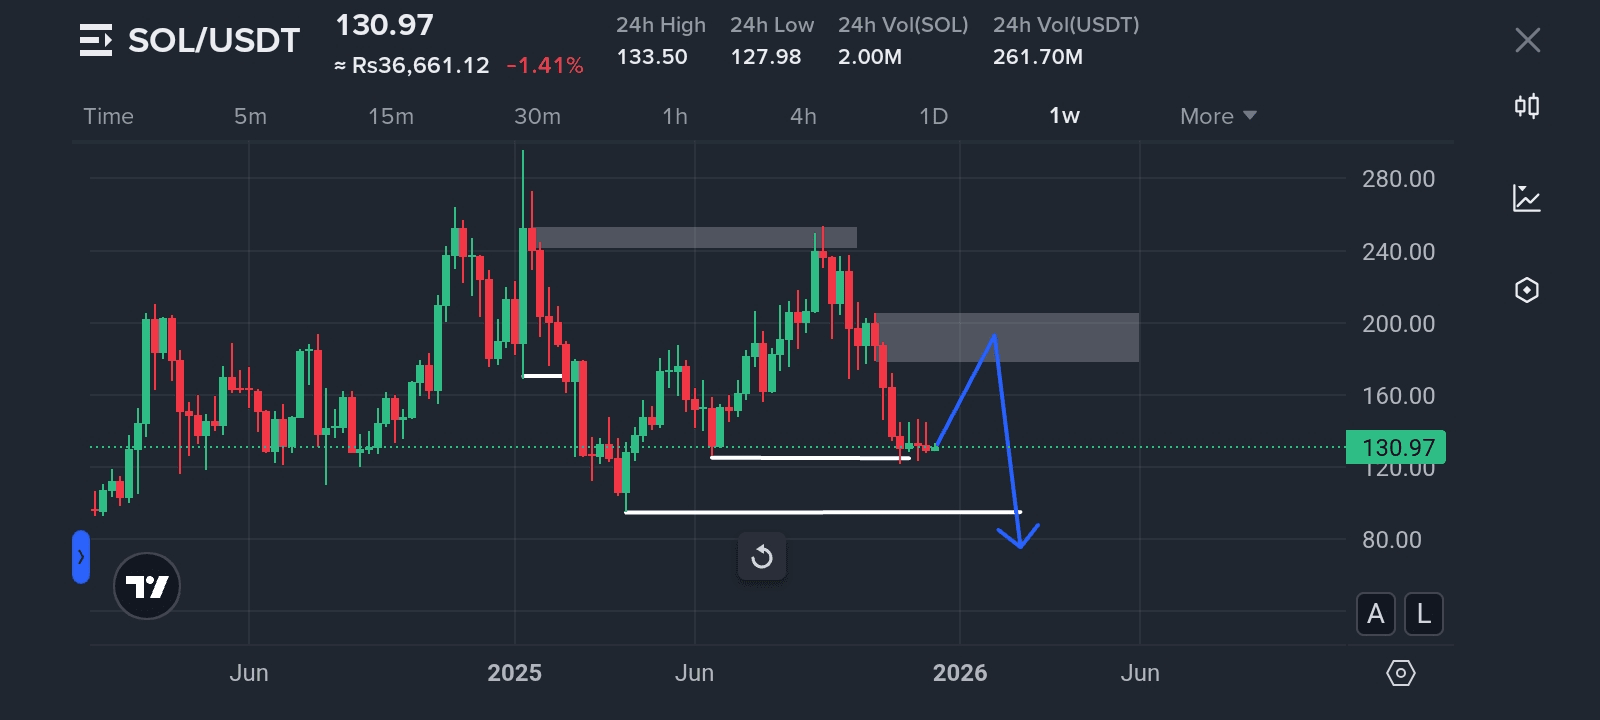
In this scenario, a pullback into the weekly supply zone at $178.33–$204.83 is expected.
Once price reaches this zone and forms a lower high, SOL may continue its bearish trend and break below $93, extending the downside move.
Scenario 2: Breakdown Before Pullback
In this case, SOL may:
First break below the $93 low, creating a new lower low
Then pull back into the weekly supply zone ($178.33–$204.83)
Use that zone to form a lower high, confirming bearish continuation
This scenario reflects strong bearish momentum, where price does not wait for a pullback before making another breakdown.
Conclusion
Both scenarios indicate that SOL remains in a bearish market structure. Until price reclaims key highs and invalidates the current structure, downside risk remains dominant.
If this analysis helped clarify the situation for you, like the post and share your thoughts in the comments.
