SOLUSDT
Always
137.03
+1.09%
📊 Structure, Areas, and Potential Playbook
Below is a clean, organized, and professional analysis of the chart you provided, using emojis for clarification while keeping the analysis at a high level and relevant for traders.
🔍 📌 Market Structure Analysis
🟡 General Context
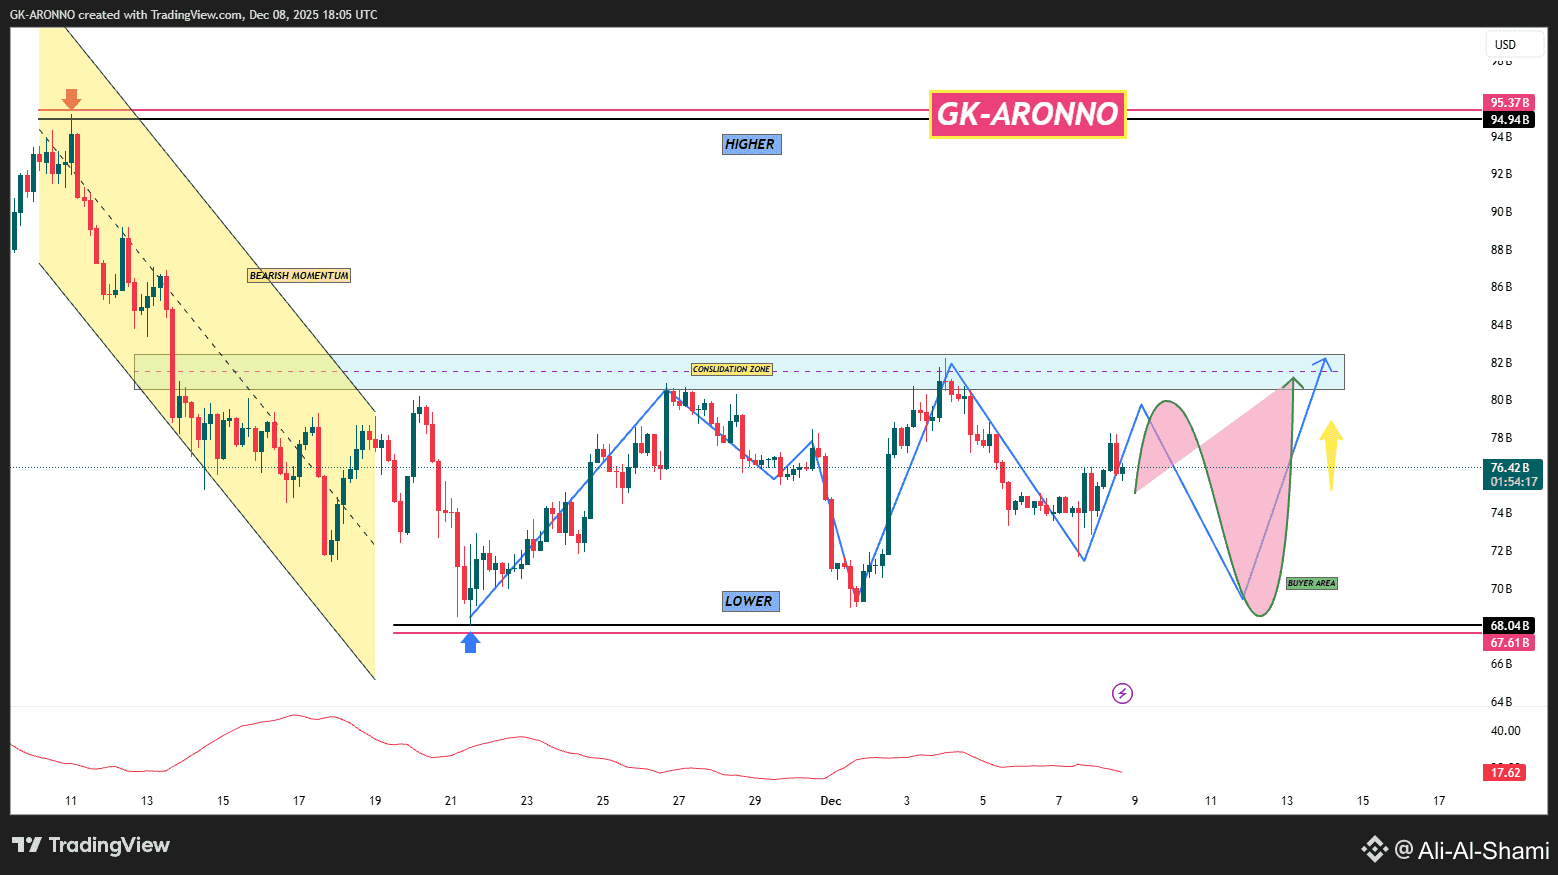
The price has moved from a strong downward momentum 📉 (downward channel on the left side)
To the range/consolidation phase 📦.
The market is currently trying to shift from bearish sentiment → neutral → potentially bullish.
🔵 1. Bearish momentum → Structure break
The yellow descending channel shows clear bearish pressure.
The breakout from that channel indicates the first sign of momentum weakness.
The price found a strong demand zone (buyer) around the 67–68 area 💎, forming a base (blue arrow).
🟢 2. Range/Consolidation area (main area 78–84)
The market is consolidating within a supply/resistance area between 78–84.
This is the decision area where the price collects liquidity before the next major move.
Several liquidity draws (equal highs and lows) within this area confirm accumulation/distribution behavior.
🔵 3. Structure shifts: Low → High
The chart shows a strong higher low (HL) and a break above the secondary structure.
This indicates a bullish structural shift, but it doesn't confirm until the price closes above 83.50–84.
🟢 4. Buyer's area and pullback expectations
I have identified the "buyer's area" around 72–73, which corresponds to:
FVG (Fair Value Gap) filling imbalance
Previous demand area
Lower high formation area
This makes it a high probability pullback area for entering new long trades 👍.
📘 5. Short-term expectations (Curved paths)
✔️ High probability movement
The price may first touch resistance at 82–84
Then it draws liquidity (false breakout)
Sharp pullback to return to the buyer's area 72–73 🟩
Before launching towards new highs if buyers defend that area.
This is a classic pattern:
Liquidity draw → Deep pullback → Continuation pattern 🔄
🎯 6. Key levels to follow
🔺 Resistance (Main supply area)
84–85 (Liquidity cluster + Previous rejection area)
94–95 (Total supply target)
🟩 Support (Strong demand area)
72–73 (Buyer's area — Ideal entry zone)
67–68 (Total support)
📈 7. Summary — Professional outlook
✨ Bullish if:
✔️ Price retests 72–73 and respects it
✔️ Breaks out and closes above 84
⚠️ Bearish if:
❌ Price breaks below 67
❌ Fails to maintain HL and re-enters the bearish structure
📌 The final point
🧭 The chart shows a transition from bearish → accumulation → potential bullish trend, but confirmation requires a breakout above 84 after the expected pullback.
The best long entry aligns with the buyer's area 72–73, targeting 84, then 95 if momentum supports.
✅ Trade here on $SOL