Starting with the big pancake, I will try to detail mainstream quality as much as possible, and later all the counterfeit will be discarded into the channel.
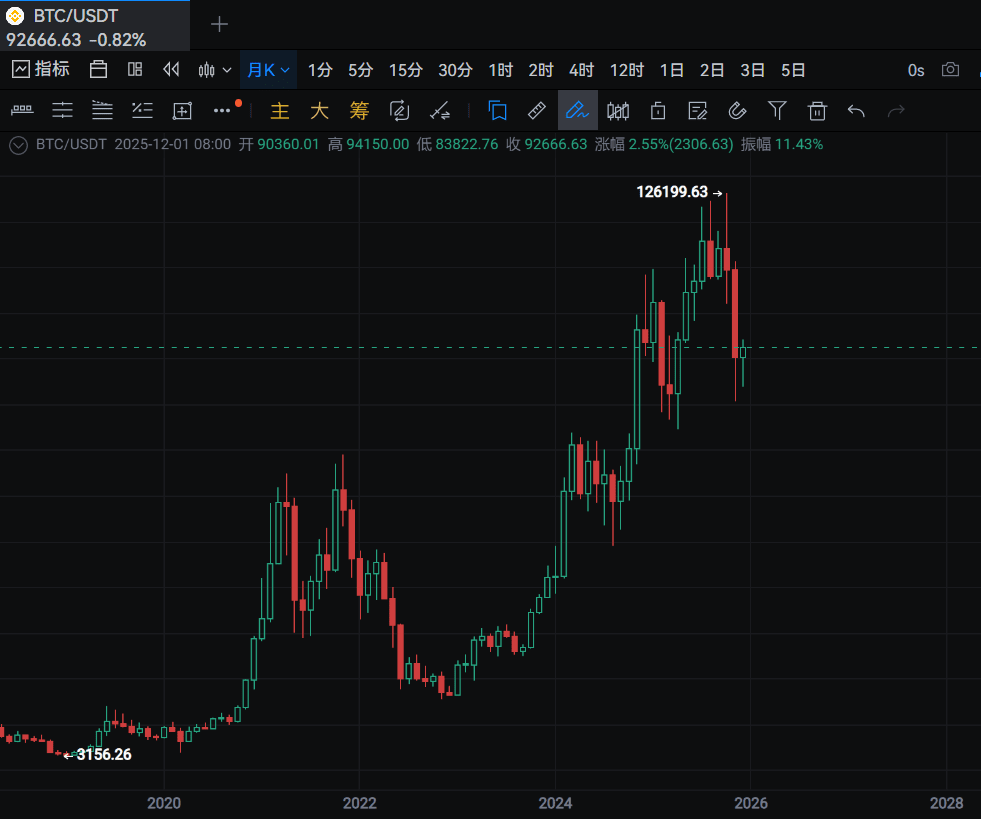
This article uses 2 technical points, using peak volume lines and star lines to make a detailed review expectation, analyzing the big pancake from the low position of 3156 to the current market, which points are important? The reference time range for price penetration is from 2018 to 2028.
As for why we need to start from the past, the secret of the price lies in the previous market, and the traces of the operators cannot be erased. Interesting things can be done: 1. Track to find important prices, 2. Look for star line expectations, 3. The resonance of important historical prices and future prices' star lines will lead to the same conclusion.
 Review and expectations from 2018 to 2028.
I have always believed that prices are reflected on the charts, and there is no need to look at other noisy information. The important prices that appeared in history will still show their effects in the future. In the financial market, retail investors cut losses while market makers buy in, and retail investors take over while market makers dump—there have never been exceptions.
We only need to look at simple information to achieve easy profits. Investment often only requires adherence to the most basic and essential truths, without being deceived by its glamorous appearance, especially not to blindly believe in any so-called 'authority' or anyone’s judgment.
Now starting to create detailed graphs:
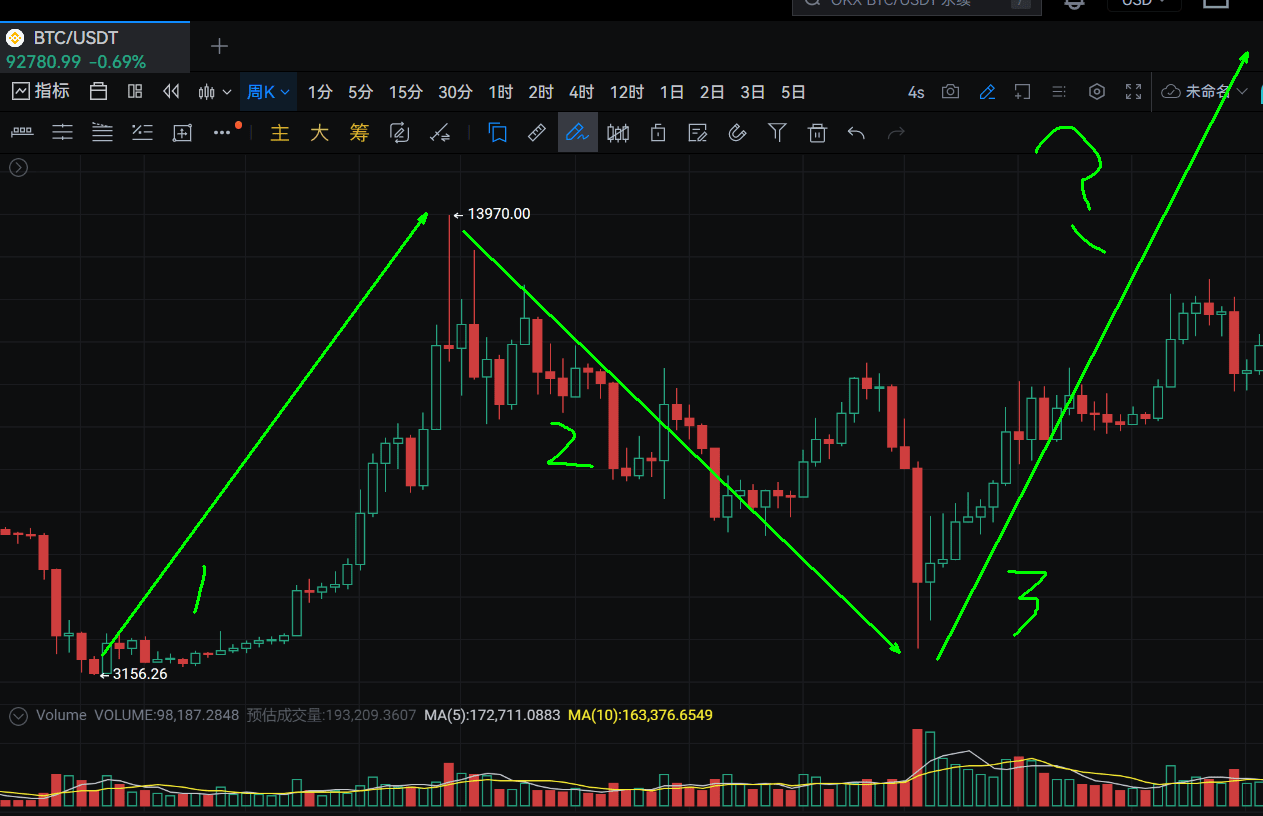
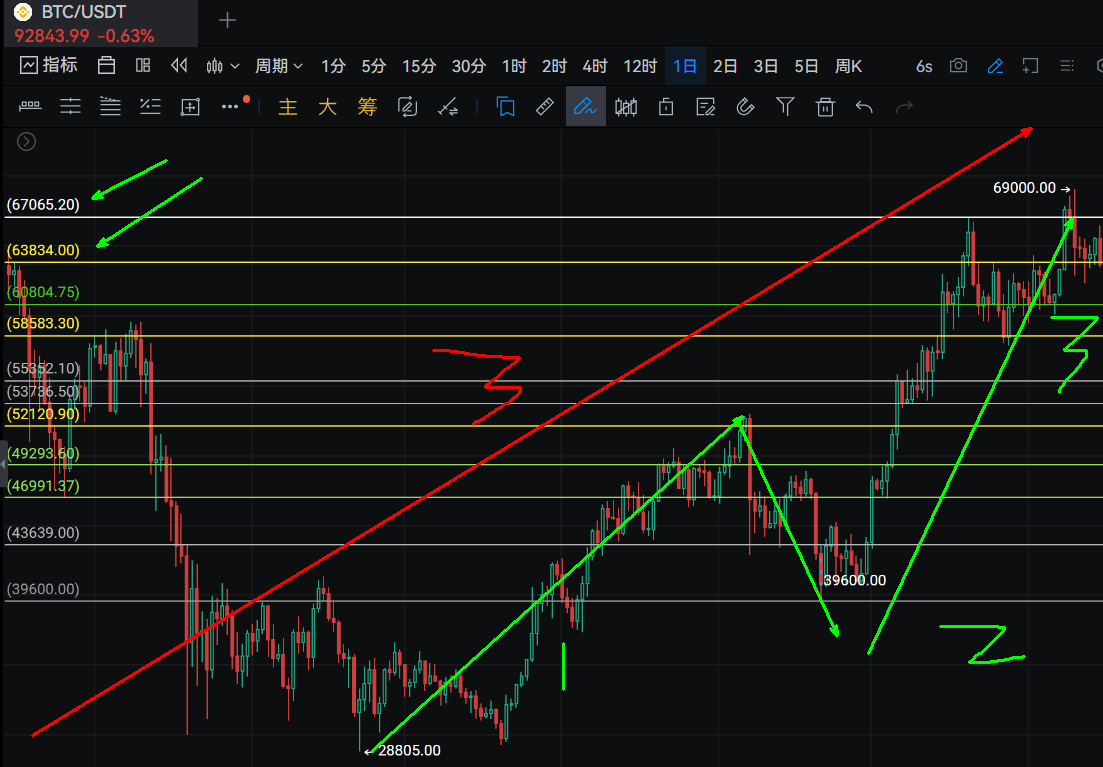
The following chart shows the 123 waves of the 2021 bull market. The peak of wave 1 showed market makers dumping their stocks, followed by a long decline. In March 2020, panic occurred, generating the bottom of wave 2, and there was a massive buying behavior from market makers. The bottom volume exceeded the top volume, and the future looks promising, starting the bull market directly to 69,000.
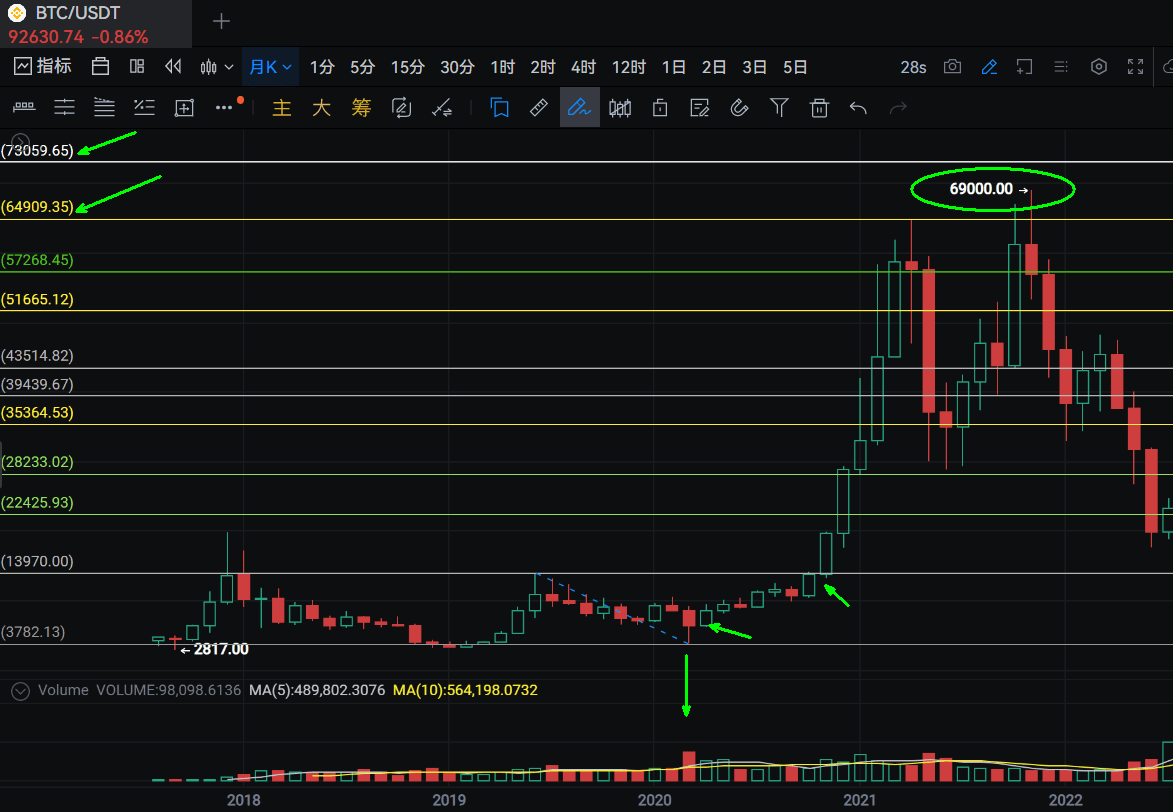 The first turning point expectation: The historical large fluctuations formed in June 2019 and November 2020 are building momentum, directly reaching the target of 8 lines at 64,909. This is also the position where the first needle insertion at 519 obstructed. The 9 lines at 73,059 will not be realized until 2024 and obstructed the subsequent market for 7 months. This is also the suppressive effect of the star line.
The second turning point expectation: On July 1, 2021, the visible prices are 66,000 and 71,700, which can be seen on July 1, and the subsequent K lines have not appeared.
 The third turning point expectation: July 26, 2021, with visible turning point prices of 64,000 and 68,893.
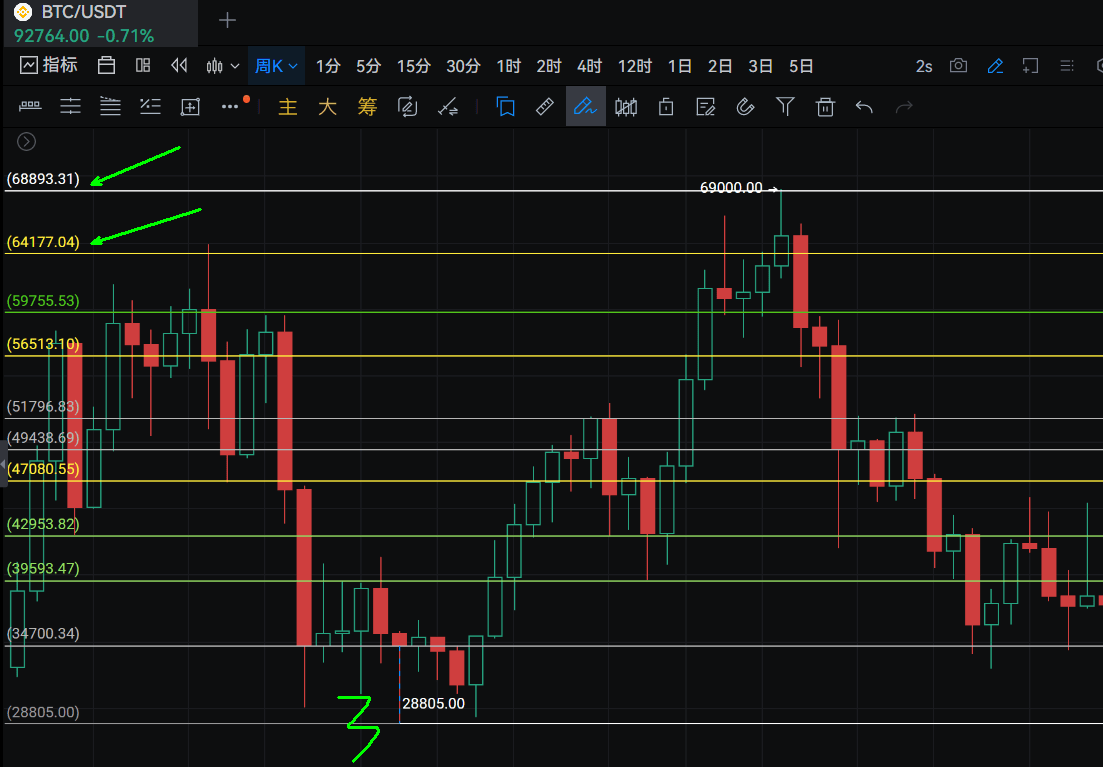 The fourth turning point: Appeared on September 21, 2021, confirmed on October 1, with visible high point expectations of 63,000 and 67,000.
At different turning points with time-space resonance, there is no expectation of 100,000. Moreover, if we remove the highest expectation, then actually withdrawing all at 63,000 and 67,000 is very good, allowing for relatively high position exit and reducing fantasies.
In fact, these high points appear under the condition that subsequent K lines do not exist, just appearing as peak types that can be seen in advance. This is also something that market makers cannot surpass, the suppressive effect of the galactic celestial bodies.
All turning points have not seen expectations above 100,000. Therefore, many people in 2021 chose to increase their positions aggressively after breaking through 69,000 and 64,000 at 51.9, resulting in outcomes that did not meet expectations. Even many founders of expensive colleges led all their students to fail completely, which is quite unfortunate.
Perhaps the original intention is good, but trading is a very serious matter. Only the market is right; the market's candlestick patterns are cold and objective, while human subjective fantasies are the most terrifying, as they may all be wrong guesses.
So at major turning points, prices are always traceable. I believe that prices in known domains, whether retracing or oscillating, are mainly manipulated by market makers at peak volume lines. When prices break through the territory of new lows and new highs, star lines need to be referred to.
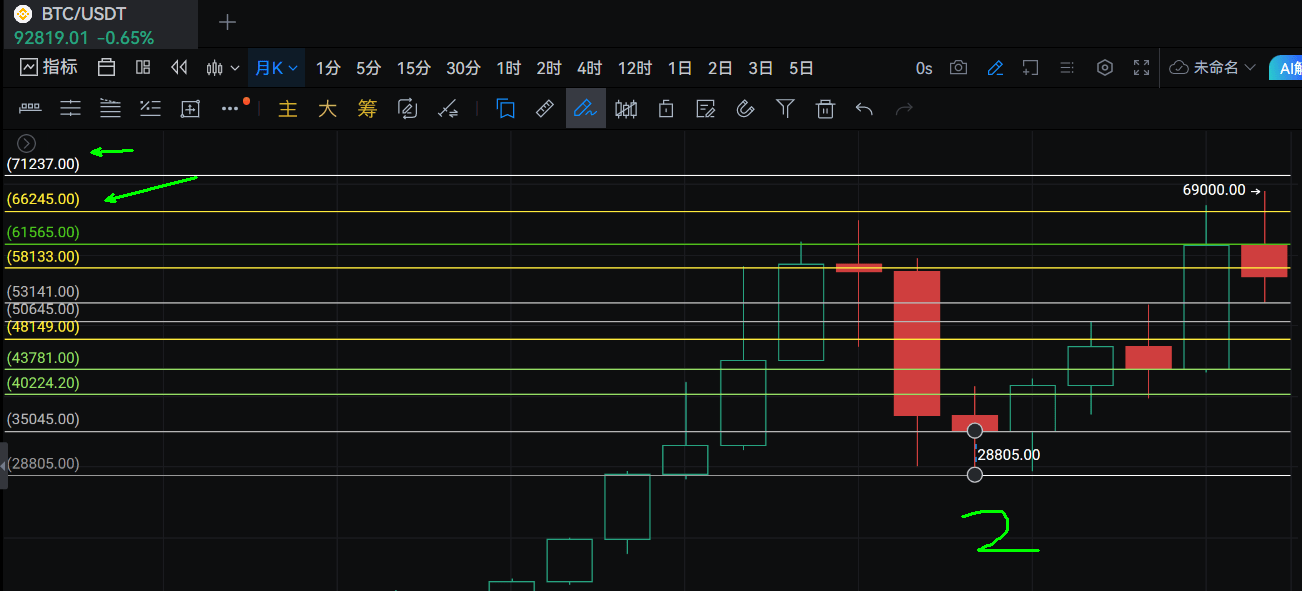
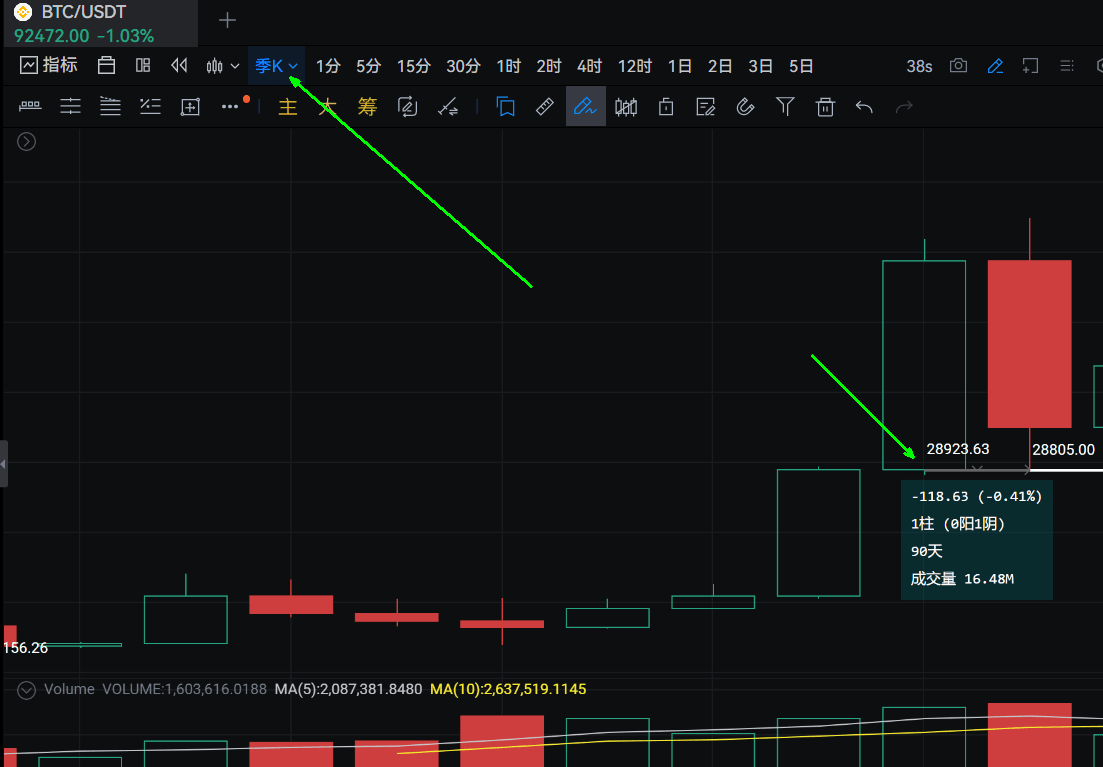
What price is it when 519 plummets to 28,805?
This is just the opening year peak, which is also the seasonal peak line at 28,923, with an error of 0.41%. This importance is significant; the needle insertion makes everyone play in vain and can achieve the best effect of washing out positions, which is similar to why the structure inserted at 48,959 will be discussed later.
Trading at important prices can result in very small stop losses. This is also the reason why most of the time is garbage time, and there is no need to watch the market. Prices are always in motion, whether regular or irregular, but there is always a trace to follow, running in an orderly manner.
 Then the high point of 69,000 appeared, and the bear market began with a long decline. The star line predicts the price as follows:
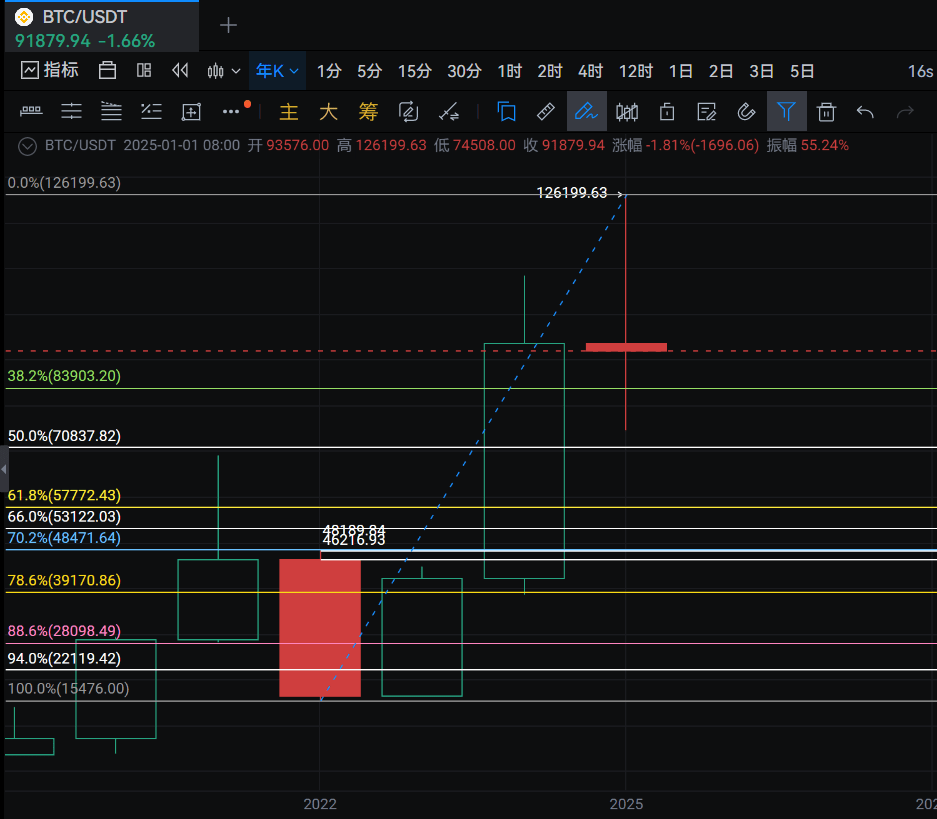
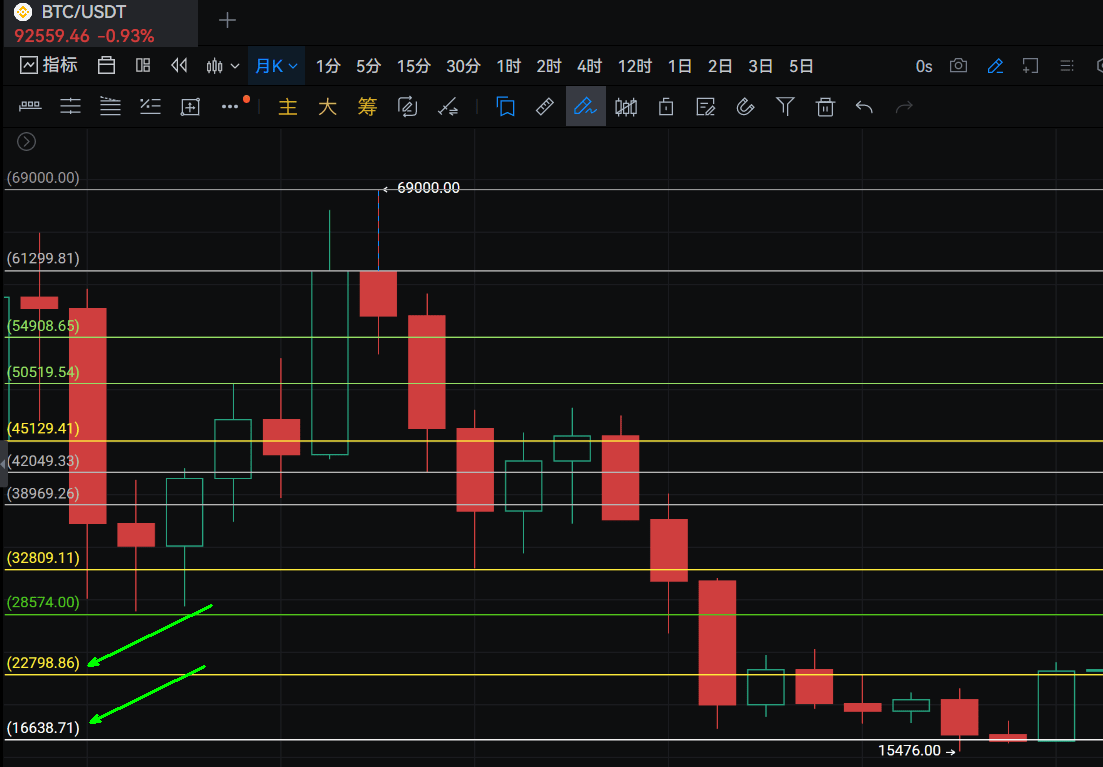 Another good tool for predicting the lion's low point is the golden retracement line. Pay attention to the 786 line, with prices as shown: 17,246.
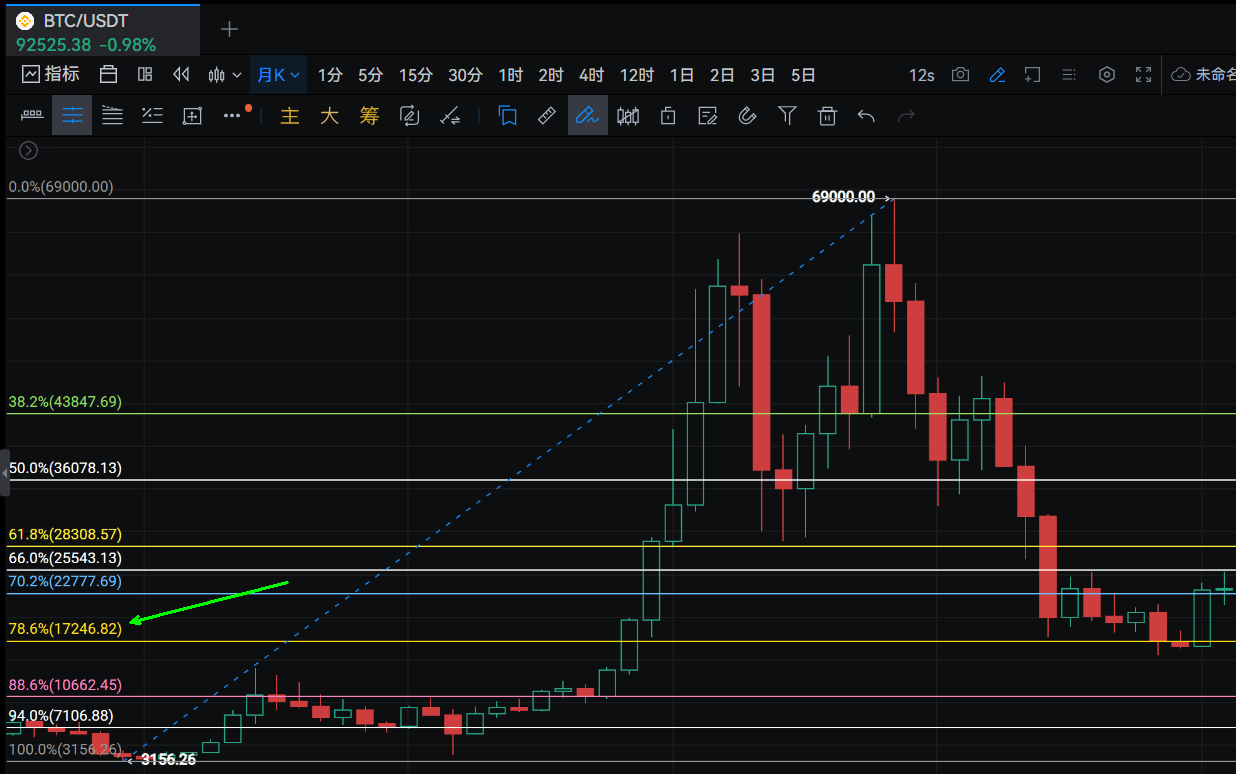 On December 1, 2021, it could be seen, and many months of K-lines afterward do not need to be looked at. The K-line at 22,798 is too long, making it difficult to stabilize. Whether it is 8 lines, 8.5 lines, or 9 lines, there are always funny and magical things happening. Retail investors at the bottom are always cutting losses and panicking, while market makers and large institutional funds are building positions, which is a natural law with no exceptions.
Retail investors always look bearish at low positions and dare not buy, while at high positions they are bullish and chase high prices. If you have such issues yourself, it is worth reflecting on. From another turning point, the price visible on August 15, 2022, is 16,582 and 15,432.
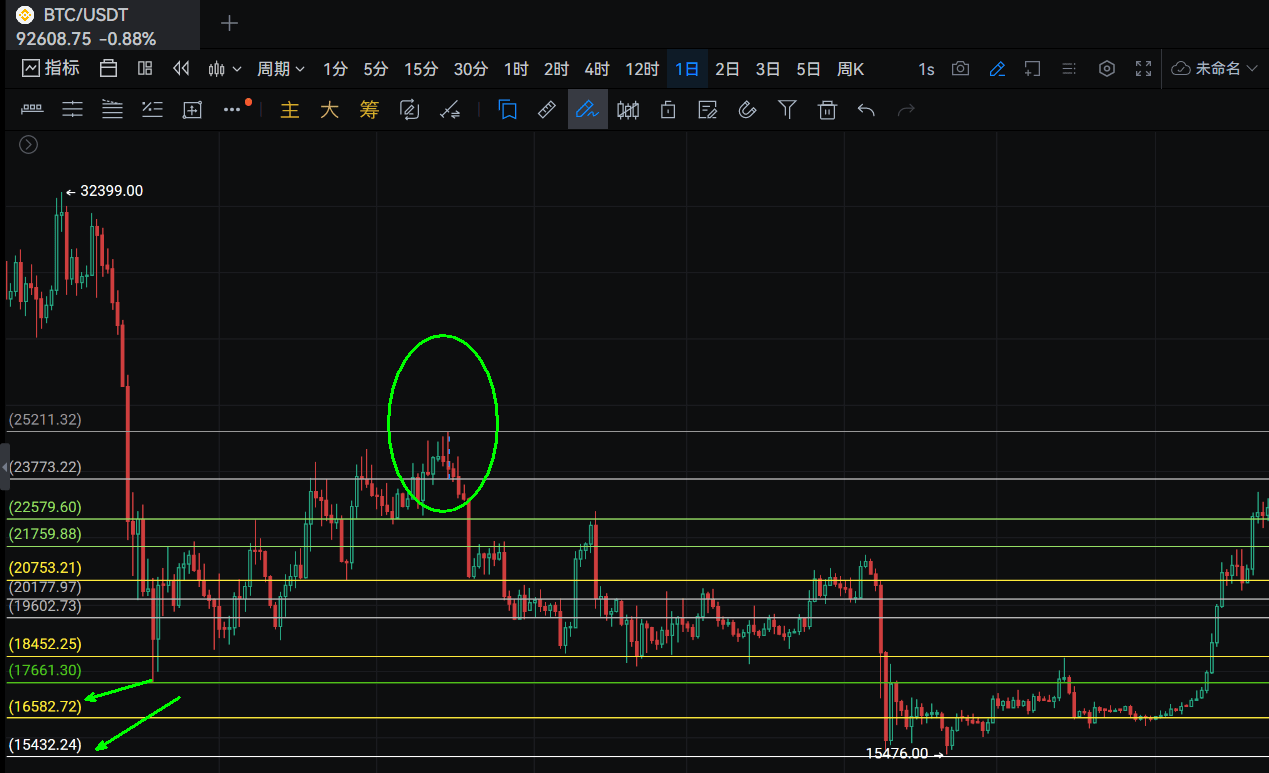 If you do not understand the star line technology but understand peak volume technology, you can still buy at the bottom. After 15,476 appears, market makers gave more than 2 months for people to board (actually for washing positions and cutting losses). Escaping the peak should be done quickly, but buying at the bottom always has sufficient time. Therefore, a good meal does not fear being late; do not rush to catch the knife. Letting trading become calm is the best.
How to go down and how to go up. The weekly peak line is 16,329. The daily peak volume at high positions is more aggressive, and the order is set at 17,166. The low position is 15,922.
At this point, the question arises: those who understand peak volume can buy at the bottom and sell at the top, while those who do not understand may fantasize about breaking below 10,000. So who will win?
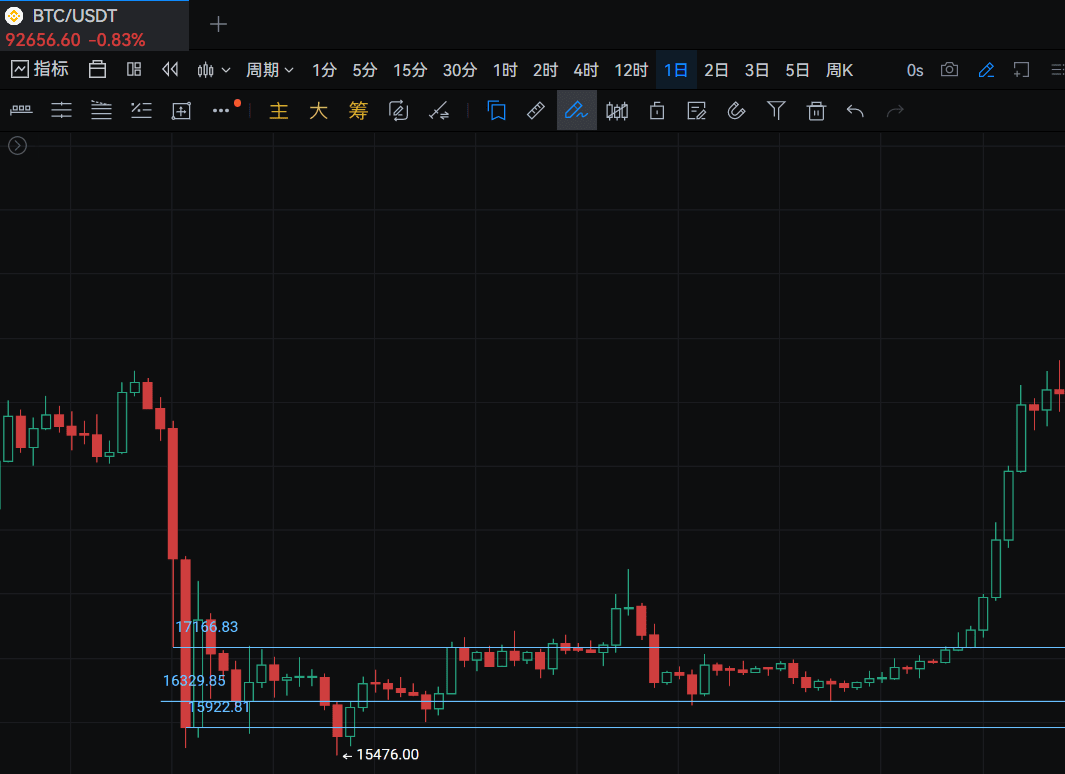 This also means that many people must wait for their wishes of 12,000, 10,000, 9,000, and 8,000 to come true. The technical basics might all meet the standards, but it just lacks a little something—a pot of good rice just needs a spoonful of salt. This is the guidance of the star line, the ancient wisdom of the East.
Although Gann's hexagon can also see this price, Gann lacks clear point guidance and cannot effectively reflect prices on the chart. Therefore, those in the Gann school must be confident to use Gann's techniques well and not self-pua and get trapped. This issue is actually a common pain point in the Gann circle.
As shown in the picture, this is a very interesting tool. The principle is that Gann learned from the Chinese I Ching, the 24 solar terms, and the counterclockwise rotation of planets and invented this tool:
It can be seen that Bitcoin has a strong guiding role on this line, which is called the clustering effect. It can also be said to be hedging and 90-degree and 180-degree interactions. The principle is based on the Chinese 12 Earthly Branches interacting. The first low point is 17,600, and the second low point is 15,476.
The first high point is 64,000, the second high point is 69,000, and even the ninth line years later is suppressed at 73777, which also has a clear clustering price guidance at 736.
However, having posted so many graphs and texts, everyone can see a conclusion: the Gann school requires subjective speculation. For price guidance, it is not as objective as the star lines and requires more observation and guessing. Additionally, there is a difficulty in Gann's theory; clustering is not necessarily reliable. Sometimes, when the market does not cluster, it becomes very difficult. This is also a topic that those who promote the Gann circle to mainland China have spent their lives researching.
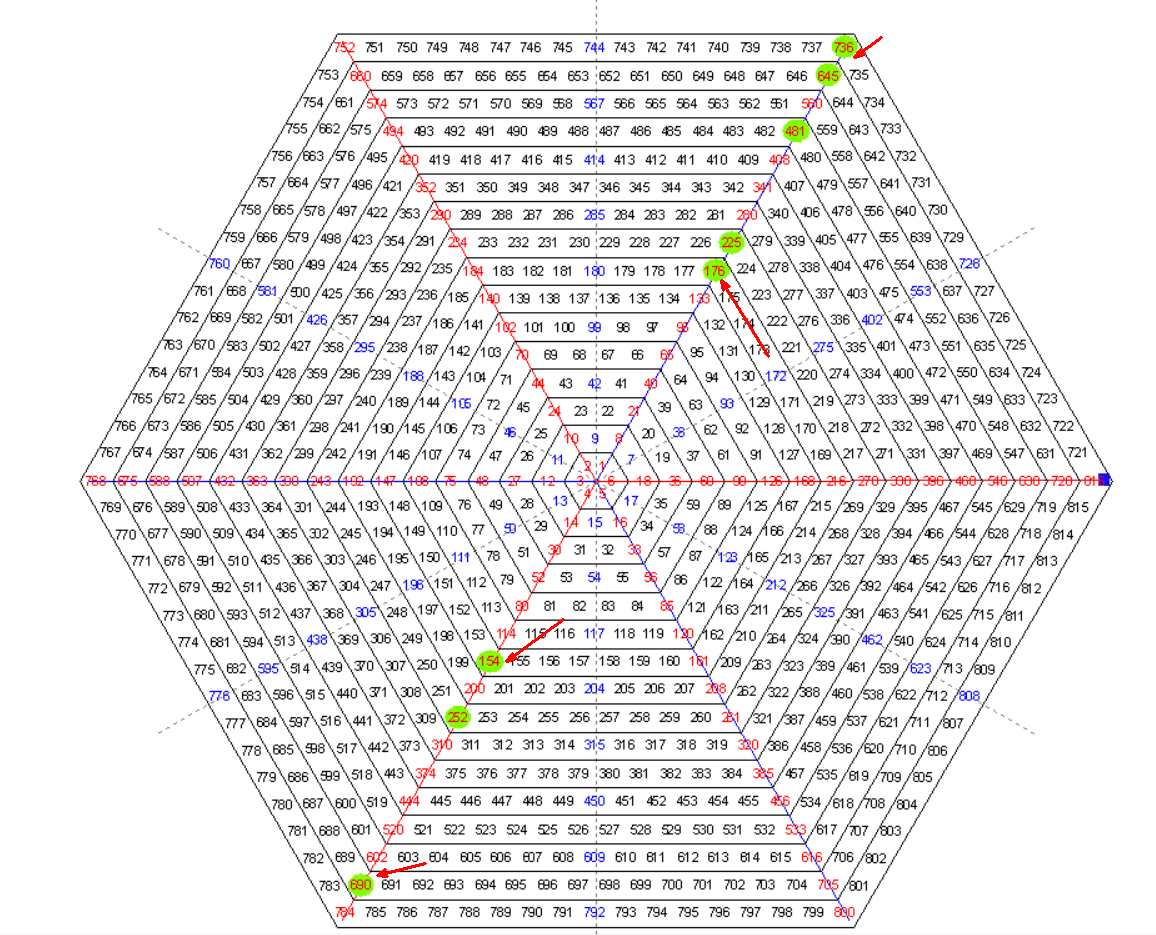 This is a diagram of the operation of cosmic celestial bodies, commonly referred to as Gann's hexagon or Gann's hexagonal diagram. The Gann matrix or the nine-square diagram has similar effects.
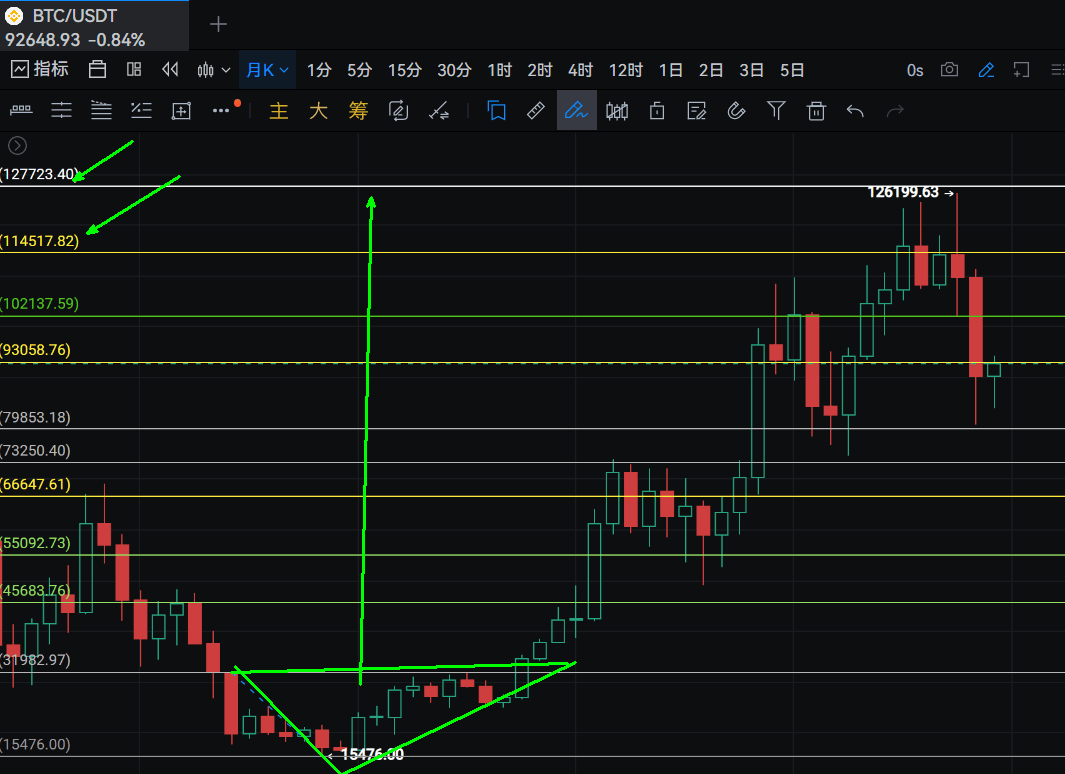
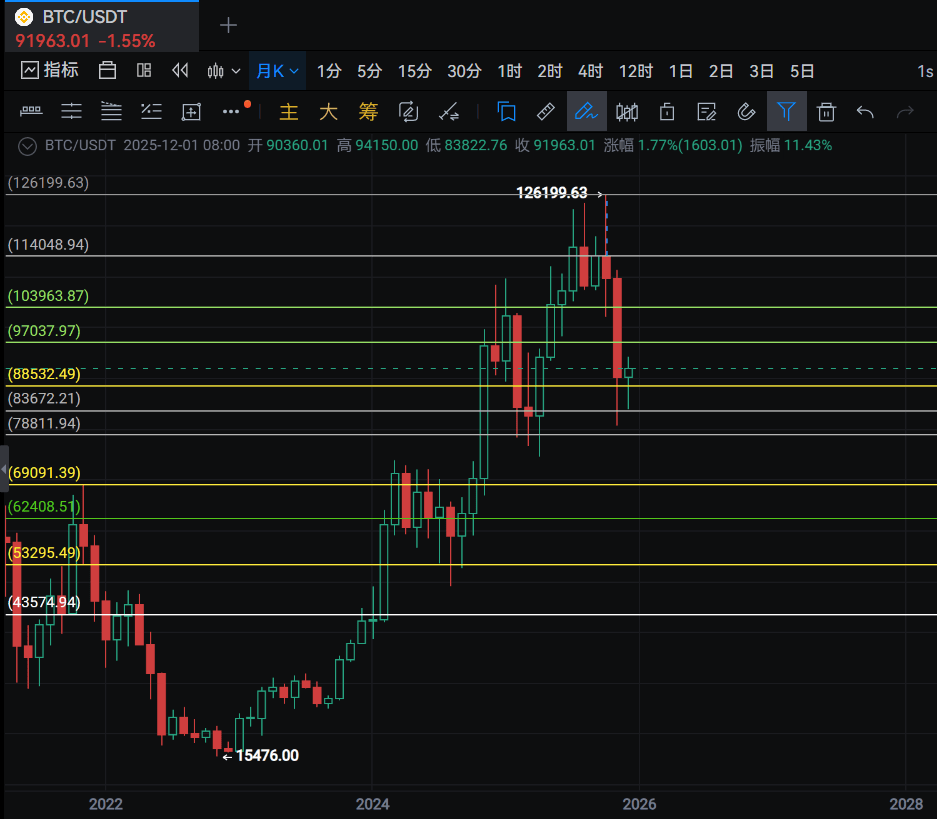
Now starting to review the rising wave of this bull market from 15476, how it fell down and how it went up. The time visible for this bottom arrow is October 1, 2023, with prices at 114,000 and 127,000.
Then running away at 114,000 and 120,000 is also appropriate, belonging to a successful trade, achieving knowledge and action unity. At least most of the principal and profits should be withdrawn.
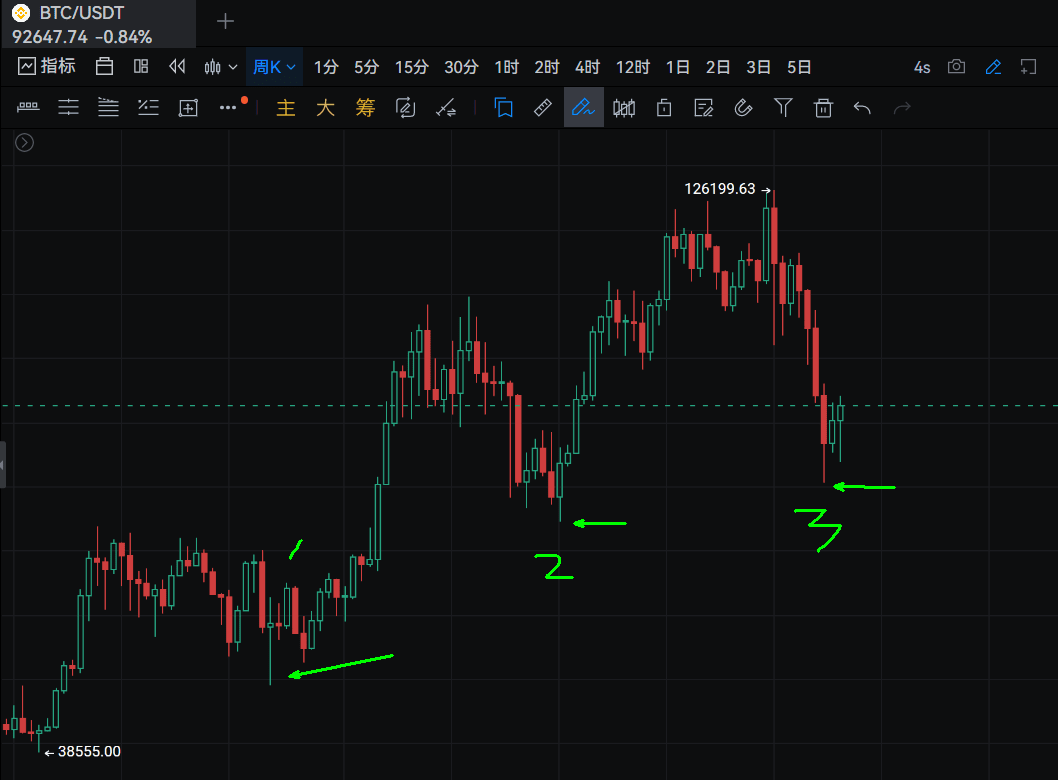
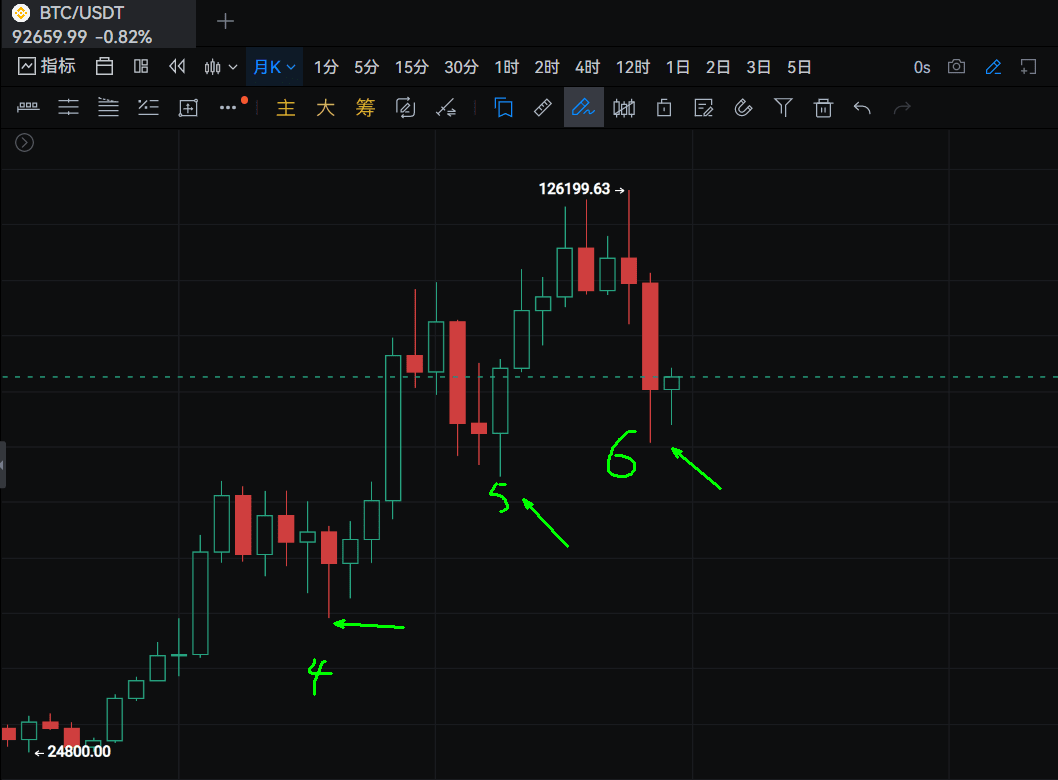
 There are other turning points as shown in the picture, about 6. From the perspective of importance combined with peak volume, what other prices are worth paying attention to in the future?
Among them, the reference effect is 1 greater than 2, greater than 3, 4 greater than 5, greater than 6. It is better to prioritize abandoning high price expectations and try to exit at reasonable price expectations.
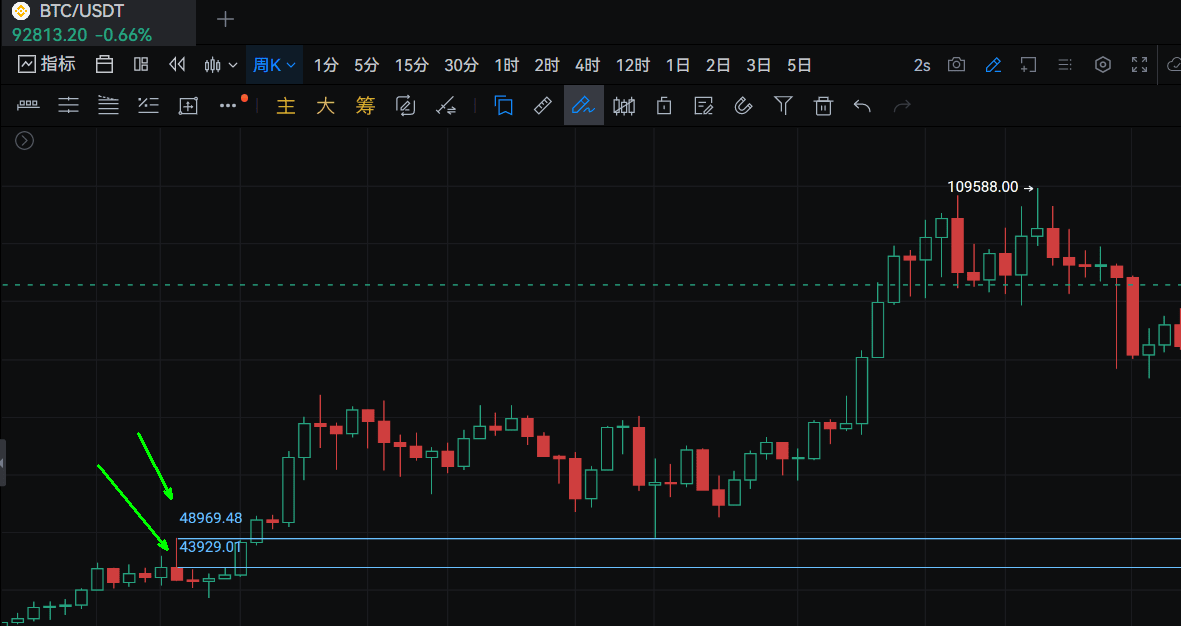
 First, look at 49,000 here, an important turning point at the weekly level, with visible prices at 103,000 and 111,000. It formed a large pullback afterward.
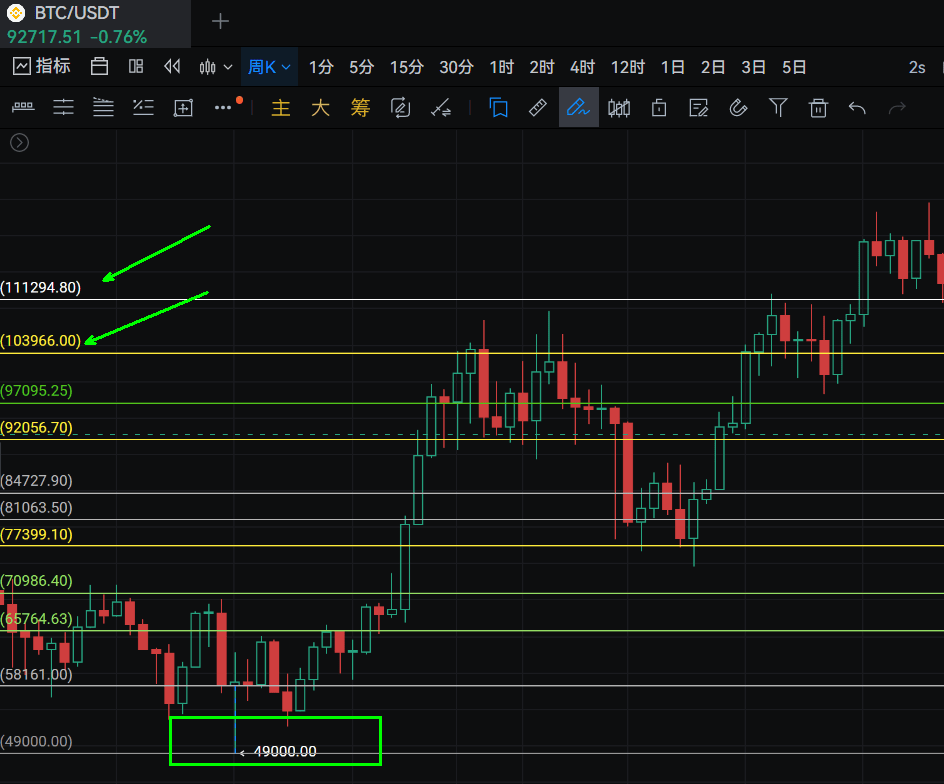 So how did 49,000 come about?
In fact, everything is on the surface; to trace and understand, it is not difficult:
48,969 is an important weekly peak volume price for January 2024. The lower side still has 43,900 that hasn't been touched. Touching 48,969 stopped; this is the pressure test line. My previous articles were also published in advance, focusing on the price behavior of 48,969, which has again appeared with important peak volumes. It is very daring to buy at the bottom, and everyone can pay attention to 43,929 in the future; this may be the pressure line of a deep bear market.
 Let's take a look at other important price expectations:
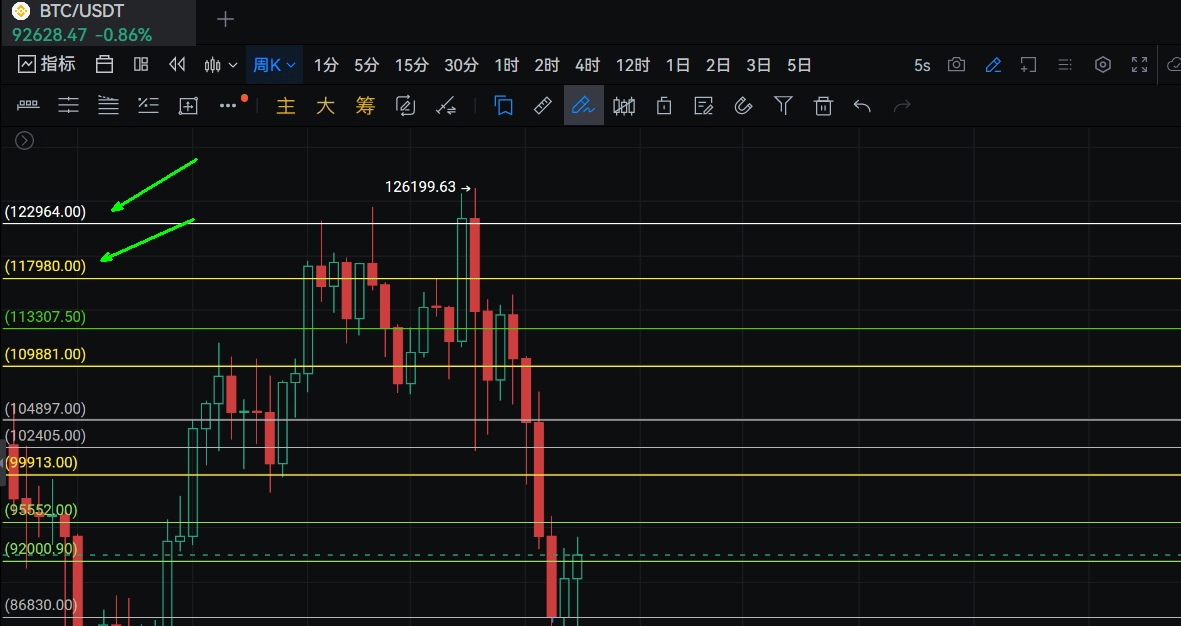
The turning point time is April 14, 2025, with visible prices at 121,000 and 131,000, which are also under pressure, reaching 85,000. The 90,000 line has not been touched.
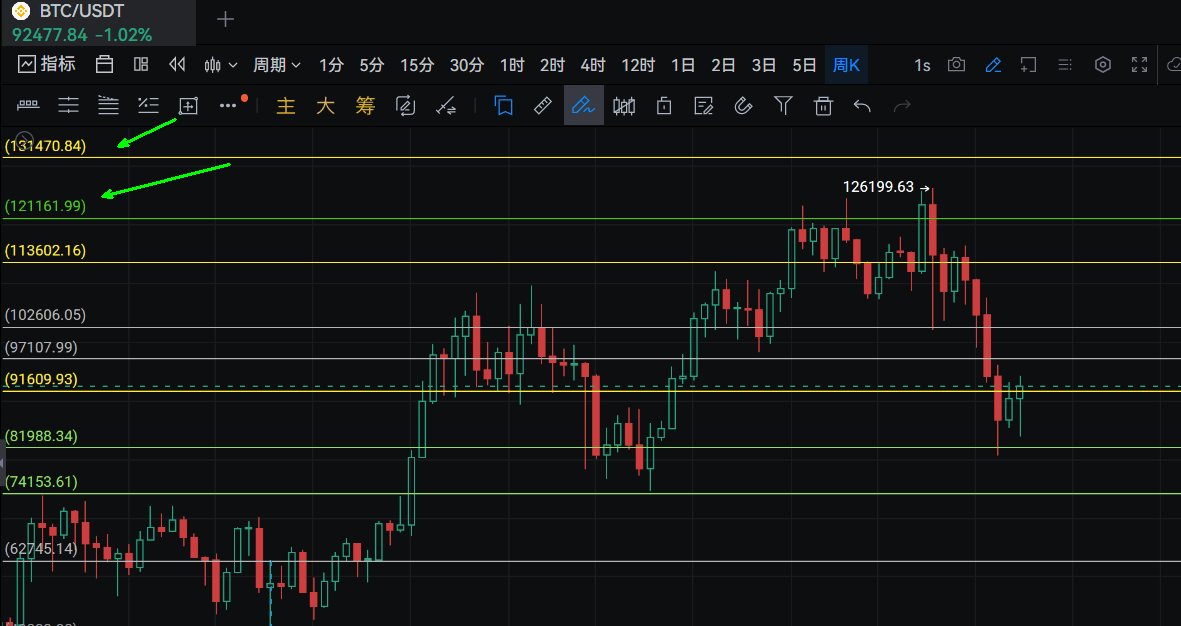
 On April 14, 2025, there is another high-intensity expectation, with prices at 144,000 and 153,000. This is too high; for now, let's not look at it, as the low-intensity 130,000 has not yet been reached.
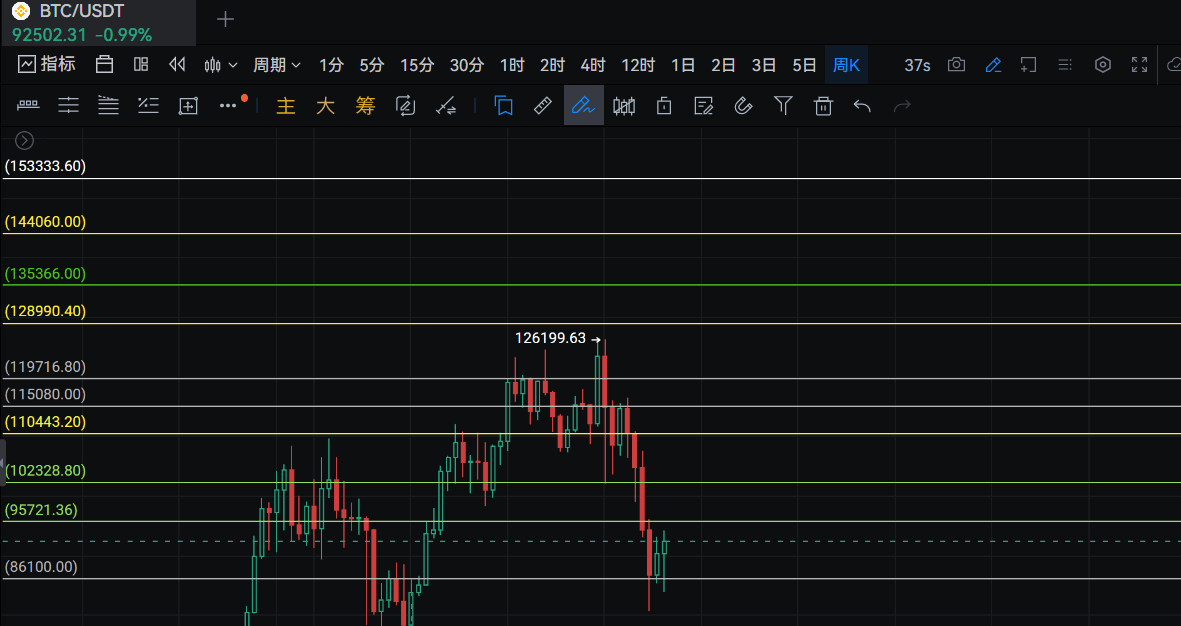
On September 1, 2024, another expectation can be seen: after countless needle insertions, the closing could not go up, with prices at 108,800 and 116,000.
 Expanding this expectation, the highest visible prices are 141,000 and 154,000. This phenomenon of multiple turning points resonating in time and space has appeared, with 140,000 and 150,000 appearing at different times.
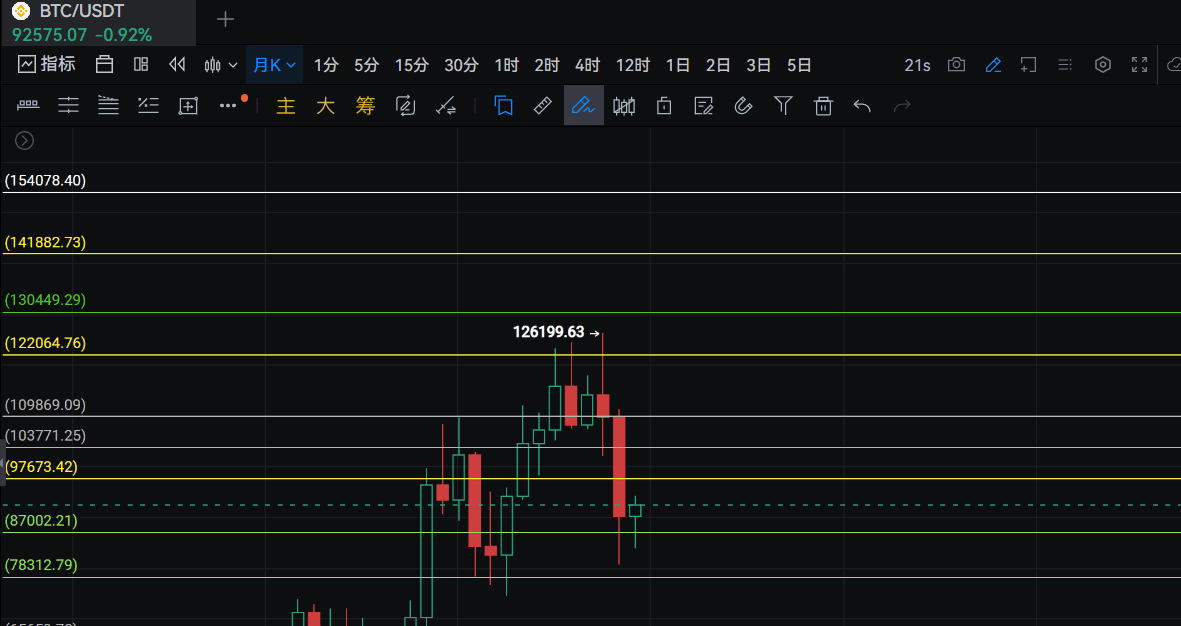
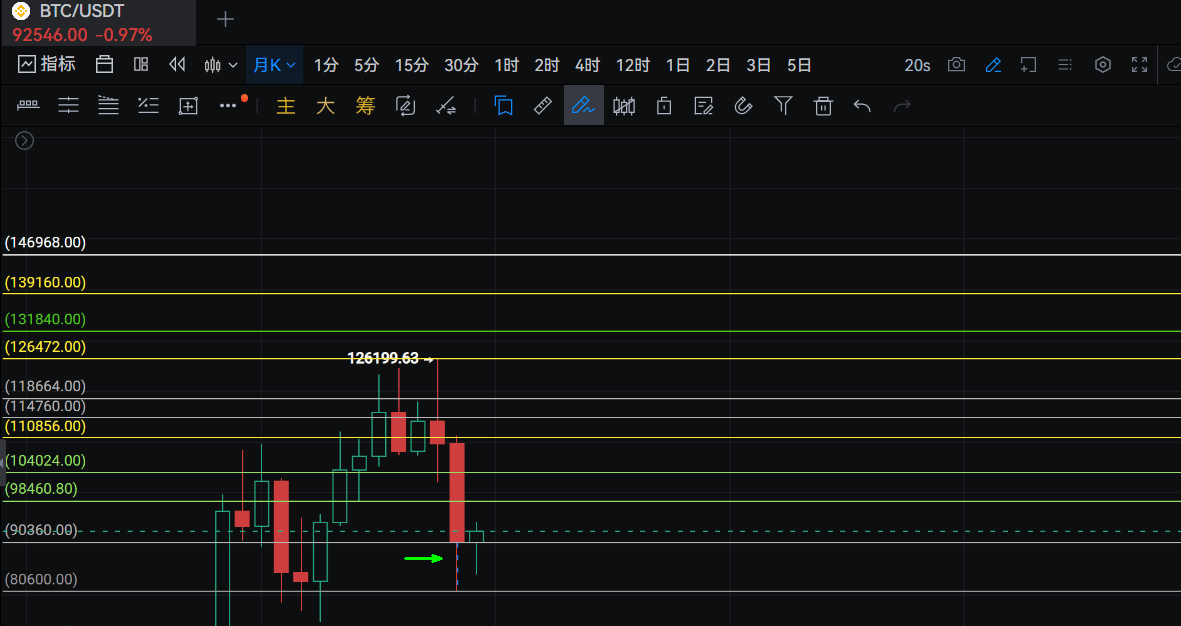
The following is the expectation for May 1, 2025, with prices at 122,000 and 129,000, still at 8.5 lines. The 9 lines are optional and have not been touched.
 The following chart is a hard line reference for recent K lines, with low reliability because it has not broken out. It can be seen at 139,000 and 146,000.
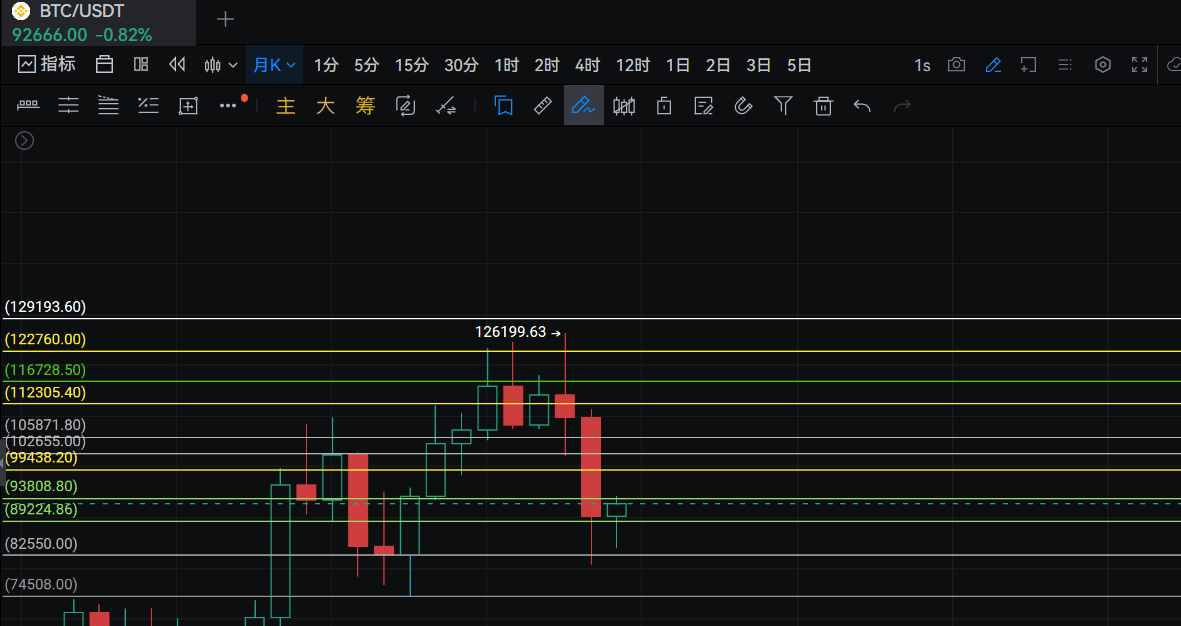
Another important point of expectation is that due to the resonance with high position peak volumes, the prices are shown in the diagram: 117,000 and 122,000.
 For the current situation: from the perspective of the market makers: selling off at high positions formed the largest single-day peak volume, and then bought back at 80,600. It can be understood that the market makers are doing high selling and low buying, selling at high positions and buying at low positions. If it returns to 100,000 and 110,000, shouldn’t you close your long positions? Selling high can lead to time freedom.
 What price is this low point of 80,600? In fact, it is the peak volume support price of 81,500 and 80,734. It is rare to break through here because real money has been spent. Where the needle is inserted is determined by the market maker, but the traces cannot be erased.
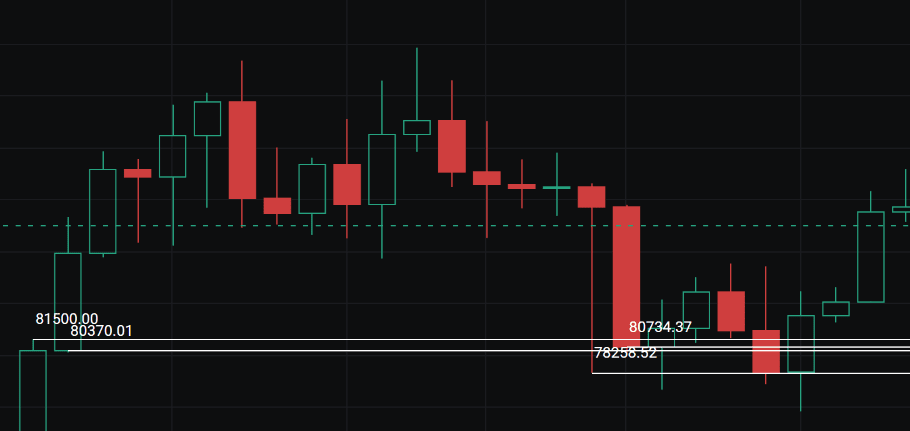 80370, 80374, 81500; the important one is the weekly peak of 80370, but it did not touch. If it has to touch later, that will also be an opportunity, but the market makers chose to insert the needle at 80734. I had also reminded everyone in my posts at that time.
Why do I always say to try to trade at higher levels? Because the profits are larger and do not require constant monitoring. Currently, the 4H has completed the 9 lines and returned to the 2 lines. If it goes down to the 8 lines, then it will return to the 1 lines. Based on daily prices, what resistances exist in the future?
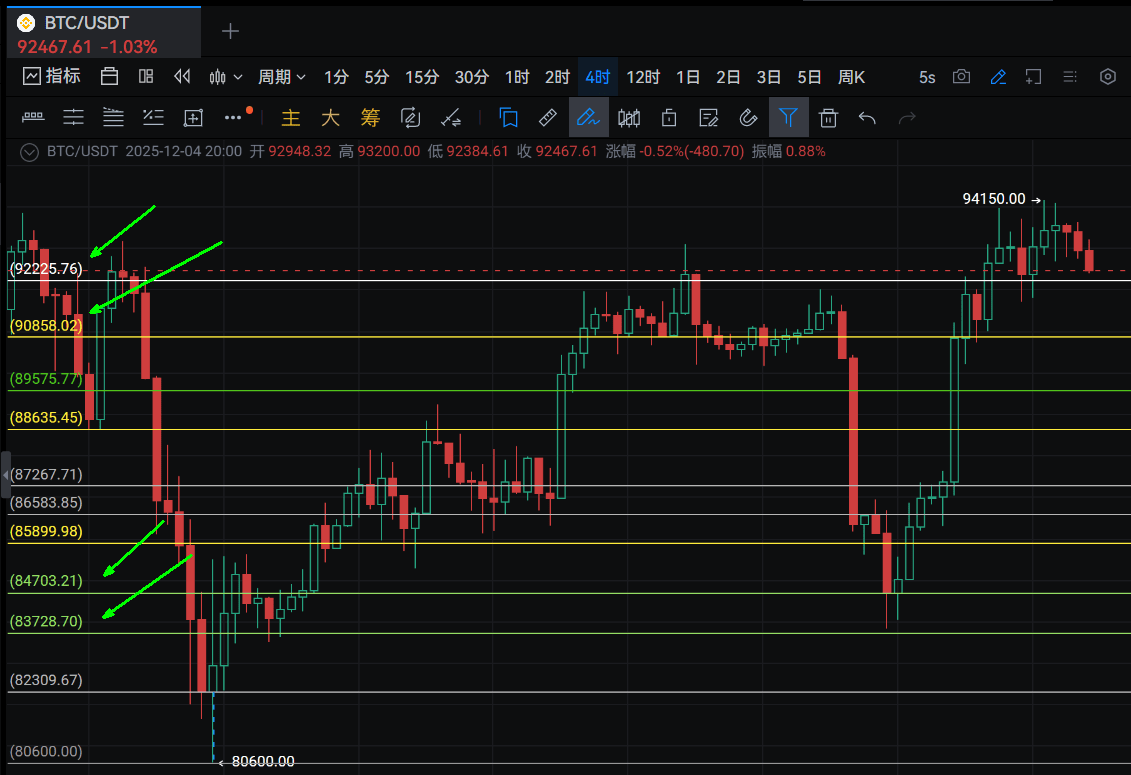 The weekly high position selling line also resonates with the secondary peak line at 96,258 and the monthly peak at 96,407. Looking up towards 99,588, will there be any tricks played here? Do not buy here; those who have goods at low positions are all selling. Important prices are worth setting alarms to observe behavior; where the needle is inserted is determined by the market maker. Even if a small level forms a peak type, the stop loss for trading is very small.
Let's also look at expectations from a small cycle perspective. The 6 and 9 lines resonate with the blue market maker selling line: 102,000 resonates with the 6 lines at 101,888, and the 9 lines at 111,400 resonate with the high position selling line at 112,774.
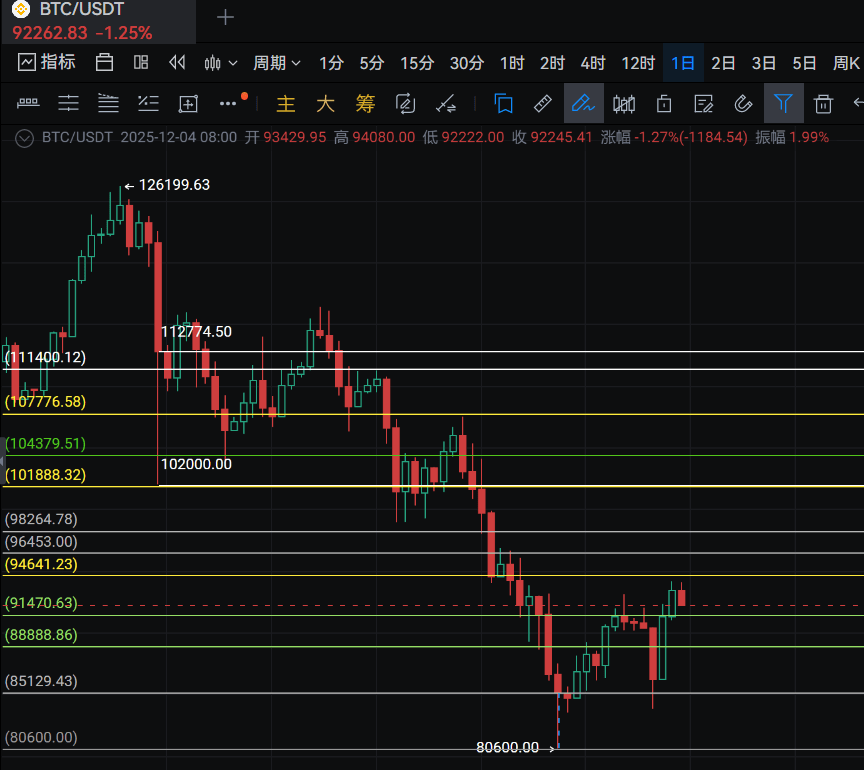 If 80,600 is the maximum expectation for the day:
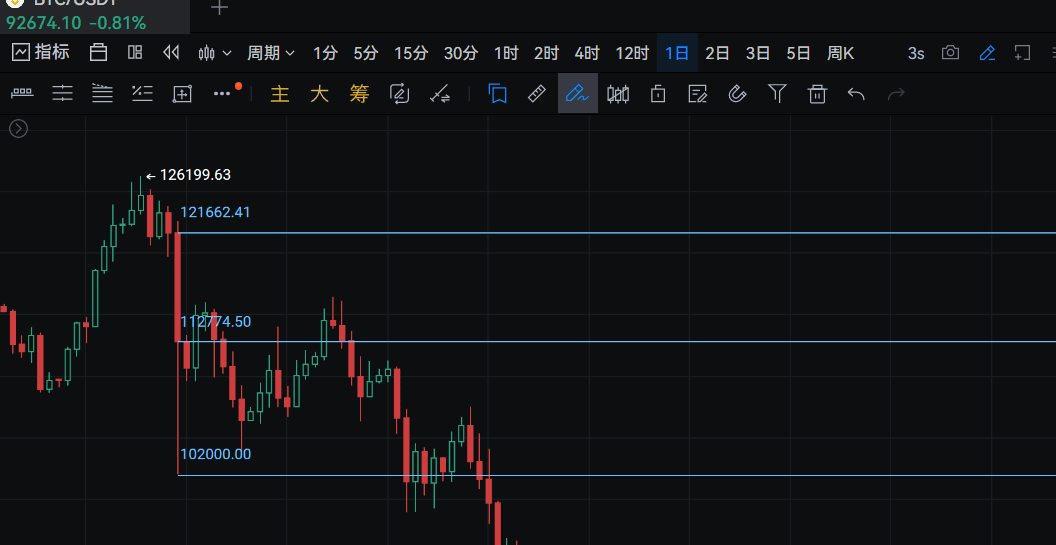
 101,986 and 102,000 resonate; 102,000 is a strong resistance. 113,025 resonates with the selling line at 112,774, and 121,993 resonates with the 8 lines and the daily high position selling line at 121,662. There is an expectation to break through the previous high at 127,512; let's just give up on this, it’s optional.
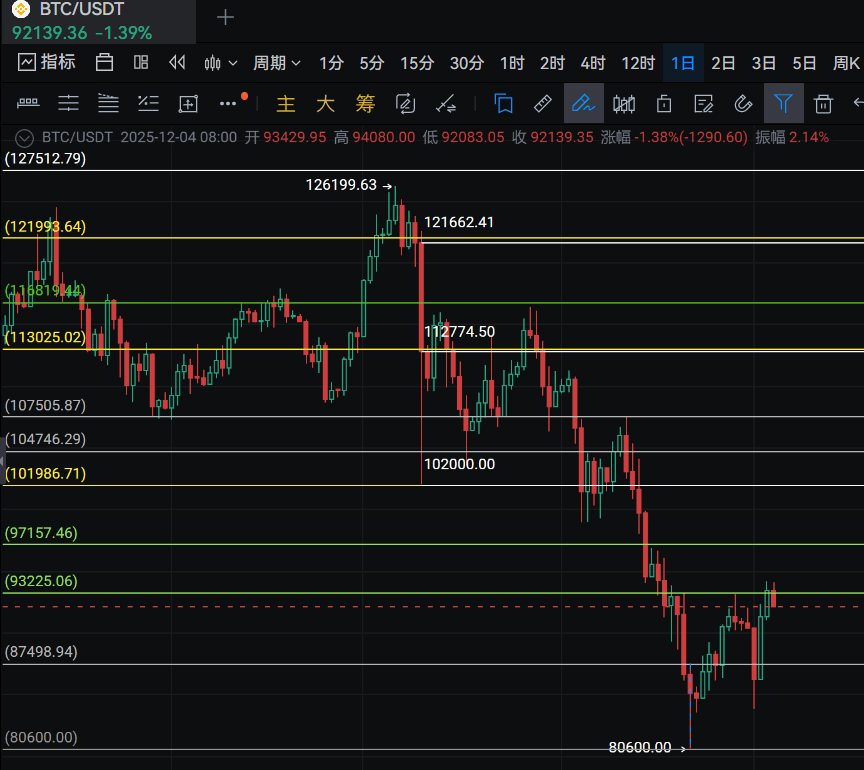
Due to the formation of a peak type on the current monthly line, if we look at the expectation slightly differently, as long as the previous high is not broken, it is effective. We can irresponsibly take a look at where the low points of the bear market might be.
Having experienced the baptism of the 26th and 27th red sheep disaster, regardless of how the cycle evolves, let's see how 53,000 and 43,500 are doing.
43,574 is also a magical price, exactly the weekly peak volume line at the beginning of 2024, making all diamond hands play in vain once again. That price has special explanations and belongs to the pressure K-line at 48,969.
In the future, we need to find turning point crossings for time-space resonance to predict: let’s take another look at what strong supports are available in the lower positions? The monthly peak volume at 73,777 is definitely a place to fight for rebounds, and then continue downwards.
There are 2 positions based on the important peak volume lines of the annual level, 48,100 and 46,200, which have also reached the golden retracement line at the 702 position. These are all very good buying points, and opportunities appear. As for the 786 line, the price has already reached 39,000, which is indeed low enough. Based on the time and market digestion, the difficulty has increased. If a black swan needle insertion occurs, it will definitely also be a big opportunity.
The 886 and 94 line prices are very low and can be observed, but it is highly unlikely they will go there because the market makers have already raised the price to 31,000 with real money. Therefore, breaking below 30,000 might just be a dream. Don’t think about lower prices and not dare to buy; just observe.
In the future, 50,000 may be the key price for the bear market among various institutions, with battles around 48,100 and 46,000 lasting a long time. The star line prediction of 43,500 will be left to time to prove. Where will it fall to?
 This is the high and low visibility of BTC that I present. In the future, pay attention to the occurrence of the largest daily and weekly trading volumes, focusing on weekly volumes greater than 410,000 coins and 1,330,000 coins. Another turning point may appear, and updates will come later. Most of the time, being neither up nor down is just a distraction, not worth watching the market; just set the price alarm O(∩_∩)O.
Here, I hope everyone can gain insight into the price of Bitcoin, and feel free to leave your thoughts. It’s okay to say anything; believing in oneself through knowledge and action is important.
Thank you for watching. I am Xiao Fei, very pleased to meet everyone. Xiao Fei focuses on Ethereum contract spot ambush, and our team has positions ready for you to become a market maker and a winner. #美联储重启降息步伐 #加密市场观察 $ETH$BTC
