

Cas Abbé
12.8k Posts

Cas Abbé
 Square Verified+
Report
Block User
Binance KOL & Crypto Mentor 🙌 X : @cas_abbe

Creator Awards 2024
1 Following
166.2K+ Followers
354.1K+ Liked
1 Badges
Posts
All
Quotes
Videos
PINNED
·
--
Verified
Article
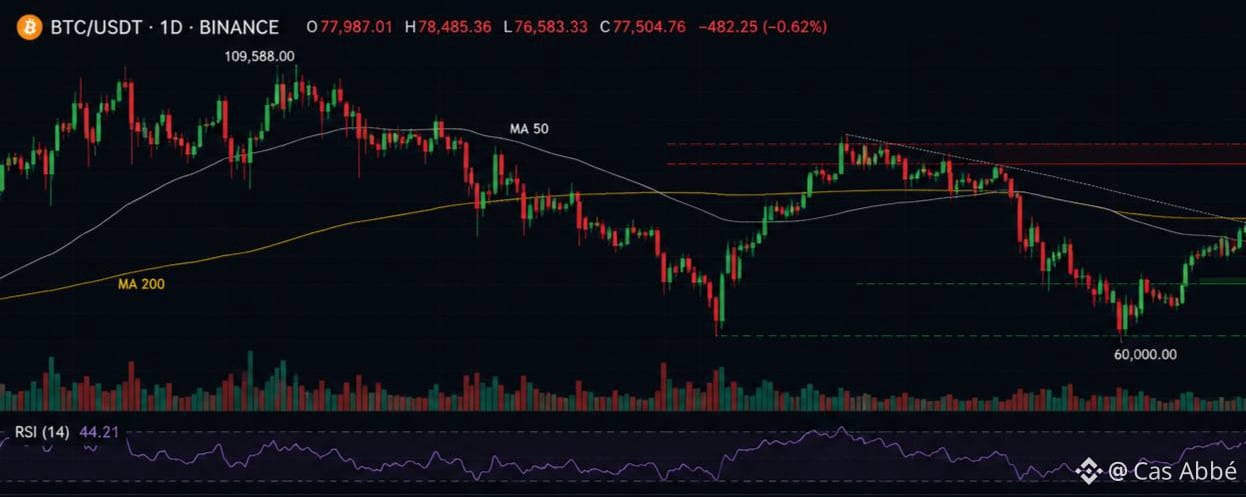
BTC & ETH BOTH BREAKING: IT’S TIME THE MARKET STOPS PRETENDINGI’m looking at both charts side by side and the message is getting harder to ignore.
$BTC and $ETH are both losing structure at the same time.
Not just random red candles. Not just healthy correction talk from people trying to sound smart on Twitter. I’m talking about a market structure that has been weakening for weeks while people kept calling every bounce the bottom
Bitcoin rejected again near the upper resistance trendline, then lost momentum fast. Ethereum did the exact same thing. Same rising structure. Same exhaustion. Same failure. That kind of synchronized weakness matters because ETH usually follows BTC, but when both start breaking down together, liquidity leaves the entire market.
Most people only look at candles.
I look at behavior
And the behavior right now feels very different from the aggressive breakout environment we had earlier in the cycle. Buyers are weaker. Every push upward is getting sold faster. The rallies are shorter. Volume isn’t convincing. That’s what distribution looks like before volatility expands.
What makes this more dangerous is that leverage is still extremely high across the market. Open interest has been sitting near cycle highs while price struggles to reclaim key levels. That’s usually not a good combination. It means too many traders are positioned before confirmation.
And honestly, this is where most retail traders get trapped.
People think breakdowns happen in one giant candle. They don’t.
First the market stops making strong highs. Then momentum weakens. Then support lines that “always hold” suddenly don’t hold anymore. After that, panic starts. The real move usually comes after denial.
Ethereum especially looks weak here.
ETH has already been underperforming Bitcoin for weeks, ETF flows are slowing, and exchange reserves have been climbing again. That means more supply sitting on exchanges waiting to move. At the same time, long positioning stayed crowded while price kept falling. That’s a brutal setup when support finally breaks.
Now here’s the important part most people miss.
A rising wedge is not magic.
Some traders treat it like a guaranteed crash signal, which is wrong. Historically, these patterns fail often and sometimes even break upward instead.
But context matters.
And the context right now is ugly:
> weakening momentum
> macro uncertainty
> unstable risk appetite
> heavy leverage
> fading ETF strength
> repeated rejection at resistance
That combination is what makes this dangerous.
I’m not saying the bull market is dead forever.
I’m saying the market is entering the phase where blind optimism becomes expensive.
There’s a huge difference.
If BTC loses major support cleanly, the conversation changes fast. Suddenly everyone who was posting moon targets starts talking about market manipulation. That’s how crypto cycles always work. Confidence disappears much faster than it was built.
I think people got too comfortable again.
Every dip was bought.
Every warning was ignored.
Every breakout call got engagement.
Markets punish comfort eventually.
For me, this is not the time to chase random altcoins because some influencer posted rocket emojis. This is the time to protect capital, stay patient, and wait for confirmation instead of gambling on hope.
Because when both BTC and ETH start breaking structure together, the market is usually telling you something before the crowd realizes it.
#BTC
BTC & ETH BOTH BREAKING: IT’S TIME THE MARKET STOPS PRETENDING
I’m looking at both charts side by side and the message is getting harder to ignore.
$BTC and $ETH are both losing structure at the same time.
Not just random red candles. Not just healthy correction talk from people trying to sound smart on Twitter. I’m talking about a market structure that has been weakening for weeks while people kept calling every bounce the bottom
Bitcoin rejected again near the upper resistance trendline, then lost momentum fast. Ethereum did the exact same thing. Same rising structure. Same exhaustion. Same failure. That kind of synchronized weakness matters because ETH usually follows BTC, but when both start breaking down together, liquidity leaves the entire market.
Most people only look at candles.
I look at behavior
And the behavior right now feels very different from the aggressive breakout environment we had earlier in the cycle. Buyers are weaker. Every push upward is getting sold faster. The rallies are shorter. Volume isn’t convincing. That’s what distribution looks like before volatility expands.
What makes this more dangerous is that leverage is still extremely high across the market. Open interest has been sitting near cycle highs while price struggles to reclaim key levels. That’s usually not a good combination. It means too many traders are positioned before confirmation.
And honestly, this is where most retail traders get trapped.
People think breakdowns happen in one giant candle. They don’t.
First the market stops making strong highs. Then momentum weakens. Then support lines that “always hold” suddenly don’t hold anymore. After that, panic starts. The real move usually comes after denial.
Ethereum especially looks weak here.
ETH has already been underperforming Bitcoin for weeks, ETF flows are slowing, and exchange reserves have been climbing again. That means more supply sitting on exchanges waiting to move. At the same time, long positioning stayed crowded while price kept falling. That’s a brutal setup when support finally breaks.
Now here’s the important part most people miss.
A rising wedge is not magic.
Some traders treat it like a guaranteed crash signal, which is wrong. Historically, these patterns fail often and sometimes even break upward instead.
But context matters.
And the context right now is ugly:
> weakening momentum
> macro uncertainty
> unstable risk appetite
> heavy leverage
> fading ETF strength
> repeated rejection at resistance
That combination is what makes this dangerous.
I’m not saying the bull market is dead forever.
I’m saying the market is entering the phase where blind optimism becomes expensive.
There’s a huge difference.
If BTC loses major support cleanly, the conversation changes fast. Suddenly everyone who was posting moon targets starts talking about market manipulation. That’s how crypto cycles always work. Confidence disappears much faster than it was built.
I think people got too comfortable again.
Every dip was bought.
Every warning was ignored.
Every breakout call got engagement.
Markets punish comfort eventually.
For me, this is not the time to chase random altcoins because some influencer posted rocket emojis. This is the time to protect capital, stay patient, and wait for confirmation instead of gambling on hope.
Because when both BTC and ETH start breaking structure together, the market is usually telling you something before the crowd realizes it.
#BTC
$BTC and $ETH are both losing structure at the same time.
Not just random red candles. Not just healthy correction talk from people trying to sound smart on Twitter. I’m talking about a market structure that has been weakening for weeks while people kept calling every bounce the bottom
Bitcoin rejected again near the upper resistance trendline, then lost momentum fast. Ethereum did the exact same thing. Same rising structure. Same exhaustion. Same failure. That kind of synchronized weakness matters because ETH usually follows BTC, but when both start breaking down together, liquidity leaves the entire market.
Most people only look at candles.
I look at behavior
And the behavior right now feels very different from the aggressive breakout environment we had earlier in the cycle. Buyers are weaker. Every push upward is getting sold faster. The rallies are shorter. Volume isn’t convincing. That’s what distribution looks like before volatility expands.
What makes this more dangerous is that leverage is still extremely high across the market. Open interest has been sitting near cycle highs while price struggles to reclaim key levels. That’s usually not a good combination. It means too many traders are positioned before confirmation.
And honestly, this is where most retail traders get trapped.
People think breakdowns happen in one giant candle. They don’t.
First the market stops making strong highs. Then momentum weakens. Then support lines that “always hold” suddenly don’t hold anymore. After that, panic starts. The real move usually comes after denial.
Ethereum especially looks weak here.
ETH has already been underperforming Bitcoin for weeks, ETF flows are slowing, and exchange reserves have been climbing again. That means more supply sitting on exchanges waiting to move. At the same time, long positioning stayed crowded while price kept falling. That’s a brutal setup when support finally breaks.
Now here’s the important part most people miss.
A rising wedge is not magic.
Some traders treat it like a guaranteed crash signal, which is wrong. Historically, these patterns fail often and sometimes even break upward instead.
But context matters.
And the context right now is ugly:
> weakening momentum
> macro uncertainty
> unstable risk appetite
> heavy leverage
> fading ETF strength
> repeated rejection at resistance
That combination is what makes this dangerous.
I’m not saying the bull market is dead forever.
I’m saying the market is entering the phase where blind optimism becomes expensive.
There’s a huge difference.
If BTC loses major support cleanly, the conversation changes fast. Suddenly everyone who was posting moon targets starts talking about market manipulation. That’s how crypto cycles always work. Confidence disappears much faster than it was built.
I think people got too comfortable again.
Every dip was bought.
Every warning was ignored.
Every breakout call got engagement.
Markets punish comfort eventually.
For me, this is not the time to chase random altcoins because some influencer posted rocket emojis. This is the time to protect capital, stay patient, and wait for confirmation instead of gambling on hope.
Because when both BTC and ETH start breaking structure together, the market is usually telling you something before the crowd realizes it.
#BTC
79
15
257
382.1k
PINNED
·
--
8 years of @Binance and it still finds ways to surprise.
Binance came through with a solid swag box... jersey, hoodie, some other goodies that actually hit.
Been around long enough to see Binance go from a startup to the world’s biggest crypto exchange:
• 280M+ users
• 100s Trillion in trading volume
• 100+ supported countries
• 1,700+ listed trading pairs
• 30M+ active weekly visits
Big shoutout to @blueshirt666 & the Binance Square crew @karin_veri, you all are building something real out here.
Respect the consistency and community focus.
Let’s keep building. #BinanceTurns8
8 years of @Binance and it still finds ways to surprise.
Binance came through with a solid swag box... jersey, hoodie, some other goodies that actually hit.
Been around long enough to see Binance go from a startup to the world’s biggest crypto exchange:
• 280M+ users
• 100s Trillion in trading volume
• 100+ supported countries
• 1,700+ listed trading pairs
• 30M+ active weekly visits
Big shoutout to @blueshirt666 & the Binance Square crew @karin_veri, you all are building something real out here.
Respect the consistency and community focus.
Let’s keep building. #BinanceTurns8
Binance came through with a solid swag box... jersey, hoodie, some other goodies that actually hit.
Been around long enough to see Binance go from a startup to the world’s biggest crypto exchange:
• 280M+ users
• 100s Trillion in trading volume
• 100+ supported countries
• 1,700+ listed trading pairs
• 30M+ active weekly visits
Big shoutout to @blueshirt666 & the Binance Square crew @karin_veri, you all are building something real out here.
Respect the consistency and community focus.
Let’s keep building. #BinanceTurns8


28
8
165
7.9k
·
--
Verified
Article
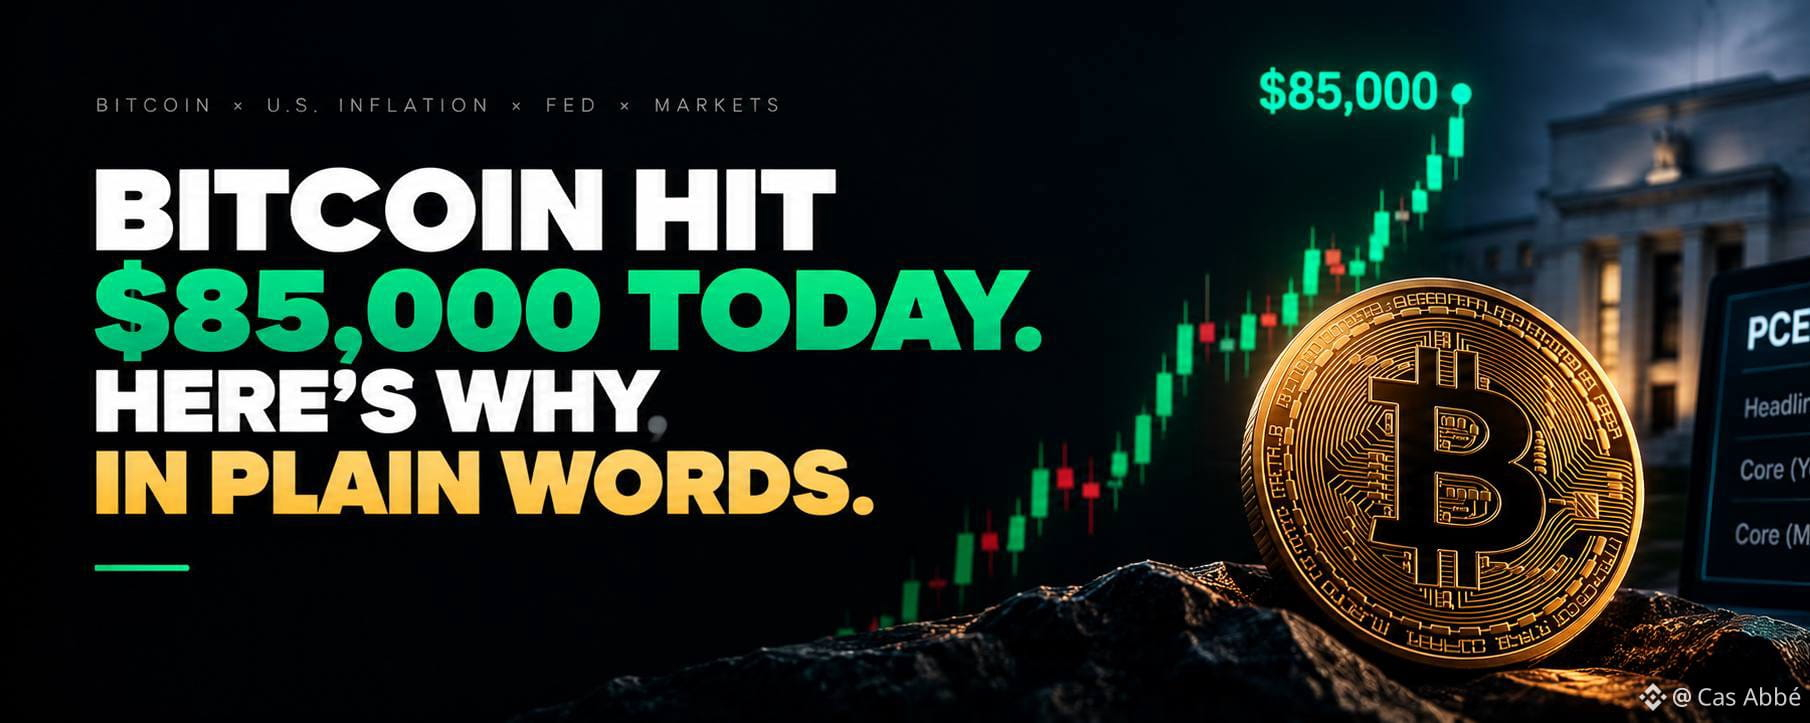
BITCOIN HIT $85,000 TODAY. HERE’S WHY AND WHAT’S NEXTI was watching the charts and Bitcoin jumped fast. Within minutes of a big US inflation report, it went above $85,000. I want to explain what happened in simple words.
First, what is PCE?
PCE is a number that shows how fast prices are rising in the US. It is the inflation gauge the Federal Reserve (the Fed) watches most closely. When prices rise too fast, the Fed can raise interest rates to slow things down.
The numbers surprised people
The report came out this morning, and it was lower than experts expected.
• Yearly PCE inflation was 3.4%, while experts expected 3.7%.
• Core PCE, which leaves out food and energy, was 3.0%, while experts expected 3.3%.
• Core prices rose 0.2% in the month, against a forecast of 0.3%.
So prices are still rising, but more slowly than people feared.
Why did Bitcoin care?
Think of it this way. Higher interest rates make safe things, like government bonds, look better. That pulls money away from risky things, like Bitcoin. Lower rate fears do the opposite.
After the report, the chance of an October Fed rate hike fell to about 35%. The Fed already raised rates by 0.25 percentage points earlier this month, so traders were nervous about another hike.
Bond yields also dipped a little. The 10-year yield fell from about 5.234% to about 5.203%. That took a bit of pressure off Bitcoin.
What did the price do?
Bitcoin hit a high of $85,598.94. Before the report, it was trading around $83,000 to $84,000. More than $75 million of short bets were wiped out within an hour. A short is a bet that the price will fall. When the price rises instead, those traders are forced to buy back, and that pushes the price up even more.
But here is the honest part
The move did not hold. Bitcoin gave back some gains and settled near $84,000. I think that is worth knowing.
Also, 3.0% core inflation is still well above the Fed's 2% target. Consumer spending was strong too, and strong spending can keep prices from falling quickly. Some analysts also say a change in how the data is measured helped make the number look cooler.
What I am watching next
• Whether Bitcoin can get back above the $87,000 area.
• Friday's jobs report, the last big data release before the Fed meets.
• Whether the Fed really holds off on another hike.
Today was a good day for Bitcoin. But one report does not change the whole story. I will keep watching the data, and I hope you will too.
#BTC #BTC走势分析
BITCOIN HIT $85,000 TODAY. HERE’S WHY AND WHAT’S NEXT
I was watching the charts and Bitcoin jumped fast. Within minutes of a big US inflation report, it went above $85,000. I want to explain what happened in simple words.
First, what is PCE?
PCE is a number that shows how fast prices are rising in the US. It is the inflation gauge the Federal Reserve (the Fed) watches most closely. When prices rise too fast, the Fed can raise interest rates to slow things down.
The numbers surprised people
The report came out this morning, and it was lower than experts expected.
• Yearly PCE inflation was 3.4%, while experts expected 3.7%.
• Core PCE, which leaves out food and energy, was 3.0%, while experts expected 3.3%.
• Core prices rose 0.2% in the month, against a forecast of 0.3%.
So prices are still rising, but more slowly than people feared.
Why did Bitcoin care?
Think of it this way. Higher interest rates make safe things, like government bonds, look better. That pulls money away from risky things, like Bitcoin. Lower rate fears do the opposite.
After the report, the chance of an October Fed rate hike fell to about 35%. The Fed already raised rates by 0.25 percentage points earlier this month, so traders were nervous about another hike.
Bond yields also dipped a little. The 10-year yield fell from about 5.234% to about 5.203%. That took a bit of pressure off Bitcoin.
What did the price do?
Bitcoin hit a high of $85,598.94. Before the report, it was trading around $83,000 to $84,000. More than $75 million of short bets were wiped out within an hour. A short is a bet that the price will fall. When the price rises instead, those traders are forced to buy back, and that pushes the price up even more.
But here is the honest part
The move did not hold. Bitcoin gave back some gains and settled near $84,000. I think that is worth knowing.
Also, 3.0% core inflation is still well above the Fed's 2% target. Consumer spending was strong too, and strong spending can keep prices from falling quickly. Some analysts also say a change in how the data is measured helped make the number look cooler.
What I am watching next
• Whether Bitcoin can get back above the $87,000 area.
• Friday's jobs report, the last big data release before the Fed meets.
• Whether the Fed really holds off on another hike.
Today was a good day for Bitcoin. But one report does not change the whole story. I will keep watching the data, and I hope you will too.
#BTC #BTC走势分析
First, what is PCE?
PCE is a number that shows how fast prices are rising in the US. It is the inflation gauge the Federal Reserve (the Fed) watches most closely. When prices rise too fast, the Fed can raise interest rates to slow things down.
The numbers surprised people
The report came out this morning, and it was lower than experts expected.
• Yearly PCE inflation was 3.4%, while experts expected 3.7%.
• Core PCE, which leaves out food and energy, was 3.0%, while experts expected 3.3%.
• Core prices rose 0.2% in the month, against a forecast of 0.3%.
So prices are still rising, but more slowly than people feared.
Why did Bitcoin care?
Think of it this way. Higher interest rates make safe things, like government bonds, look better. That pulls money away from risky things, like Bitcoin. Lower rate fears do the opposite.
After the report, the chance of an October Fed rate hike fell to about 35%. The Fed already raised rates by 0.25 percentage points earlier this month, so traders were nervous about another hike.
Bond yields also dipped a little. The 10-year yield fell from about 5.234% to about 5.203%. That took a bit of pressure off Bitcoin.
What did the price do?
Bitcoin hit a high of $85,598.94. Before the report, it was trading around $83,000 to $84,000. More than $75 million of short bets were wiped out within an hour. A short is a bet that the price will fall. When the price rises instead, those traders are forced to buy back, and that pushes the price up even more.
But here is the honest part
The move did not hold. Bitcoin gave back some gains and settled near $84,000. I think that is worth knowing.
Also, 3.0% core inflation is still well above the Fed's 2% target. Consumer spending was strong too, and strong spending can keep prices from falling quickly. Some analysts also say a change in how the data is measured helped make the number look cooler.
What I am watching next
• Whether Bitcoin can get back above the $87,000 area.
• Friday's jobs report, the last big data release before the Fed meets.
• Whether the Fed really holds off on another hike.
Today was a good day for Bitcoin. But one report does not change the whole story. I will keep watching the data, and I hope you will too.
#BTC #BTC走势分析
20
23
2k
·
--
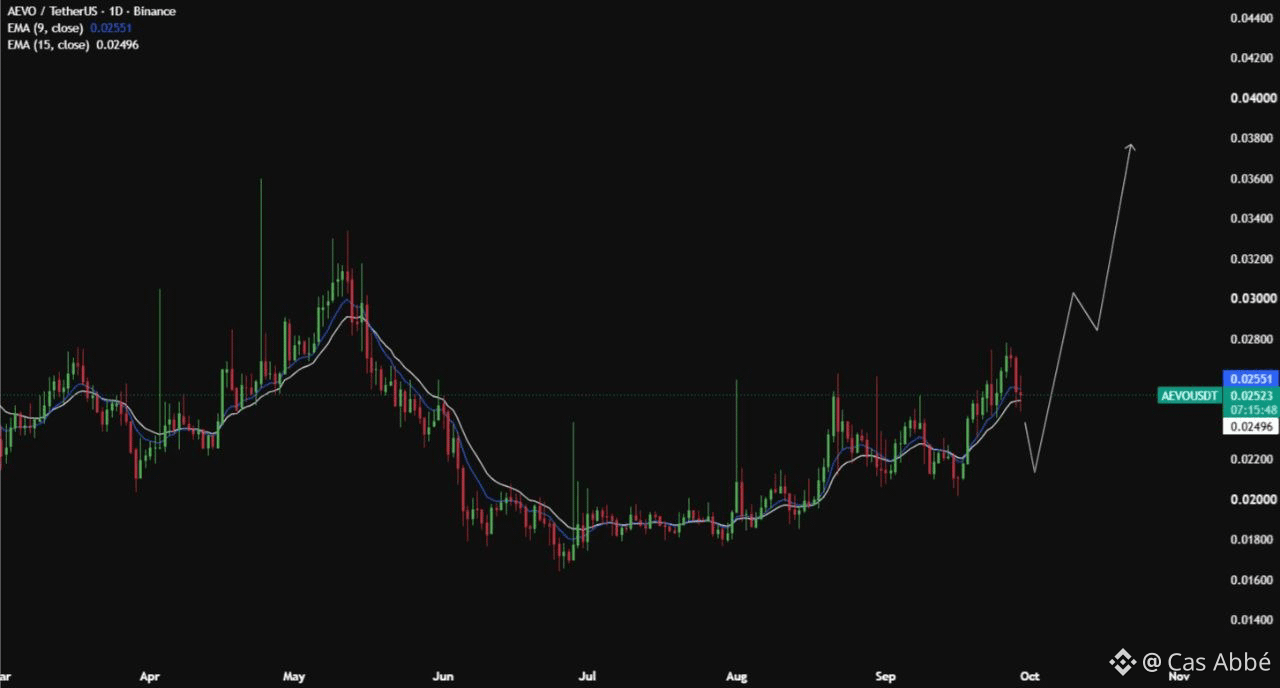
$AEVO is trading around $0.0252, sitting between the 9 EMA and 15 EMA on the daily chart.
A clean reclaim of $0.0255 could open the door toward $0.0300, followed by $0.0380.
Key support: $0.0240–$0.0250
Structure is getting interesting. 👀
@Aevoxyz is building a broader on-chain derivatives ecosystem.
While $HYPE , GMX, $DYDX and JUP compete for derivatives traders, Aevo combines perpetuals, options and other structured products in one platform.
The interesting part is the focus on giving traders more ways to manage exposure instead of relying on simple leverage alone.
As on-chain derivatives keep evolving, liquidity, execution and product depth will matter more than hype.
AEVO stays on my radar. 👀
Not financial advice.
#btc
$AEVO is trading around $0.0252, sitting between the 9 EMA and 15 EMA on the daily chart.
A clean reclaim of $0.0255 could open the door toward $0.0300, followed by $0.0380.
Key support: $0.0240–$0.0250
Structure is getting interesting. 👀
@Aevo is building a broader on-chain derivatives ecosystem.
While $HYPE , GMX, $DYDX and JUP compete for derivatives traders, Aevo combines perpetuals, options and other structured products in one platform.
The interesting part is the focus on giving traders more ways to manage exposure instead of relying on simple leverage alone.
As on-chain derivatives keep evolving, liquidity, execution and product depth will matter more than hype.
AEVO stays on my radar. 👀
Not financial advice.
#btc
A clean reclaim of $0.0255 could open the door toward $0.0300, followed by $0.0380.
Key support: $0.0240–$0.0250
Structure is getting interesting. 👀
@Aevo is building a broader on-chain derivatives ecosystem.
While $HYPE , GMX, $DYDX and JUP compete for derivatives traders, Aevo combines perpetuals, options and other structured products in one platform.
The interesting part is the focus on giving traders more ways to manage exposure instead of relying on simple leverage alone.
As on-chain derivatives keep evolving, liquidity, execution and product depth will matter more than hype.
AEVO stays on my radar. 👀
Not financial advice.
#btc
42
1
42
7.7k
·
--

Article
MORE MONEY THAN EVER, AT THE HIGHEST PRICE IN DECADES!The most bullish chart and the most bearish chart of the year are sitting on my timeline at the same time.
The bullish one is global M2. The money supply across the US, China, the euro zone and Japan hit a record of roughly $103 trillion in August, after adding about $1 trillion in a single month. That was the 10th straight monthly increase, and Bitcoin still trades about 33% below its high. That last part is what I keep coming back to. The liquidity up = Bitcoin up trade is the one every crypto account runs with, and this time Bitcoin isn’t following.
The bearish one is the bond market. The US 30-year yield hit 5.5% on Thursday, its highest since 2004, and the 10-year reached 5.22%, the highest since 2007. Traders are now pricing a 71% chance of a Fed hike in October, up from 11% a month ago. The Fed already raised to 3.75%-4% on September 16, its first hike since 2023, with August CPI at 3.4% and oil near $100. And Monday opened with stocks sliding as oil and yields jumped after Trump rejected Iran’s conditions for a ceasefire, with Brent above $106.
How both can be true
I’ve traded stocks longer than I’ve traded crypto, so this is where I’d slow down. M2 measures how much money exists. Yields measure what it costs to borrow. They aren’t the same thing, and the headline number has a few asterisks:
• It’s measured in dollars, so a weaker dollar inflates it. The total is up roughly 8% year over year in dollar terms, but closer to 4.5% at fixed exchange rates, about a third of the 2021 peak.
• The money is going somewhere other than risk assets. Bond investors are demanding more to lend, and that raises the discount rate on everything, crypto included.
• An asset that pays no yield has a harder job when cash pays 4% and 30-year Treasuries pay 5.5%.
So I’m not reading the record M2 chart as number go up, BTC goes up. The lag on that chart is doing a lot of the work, and the last 12 months show it can break.
Why yields are rising now
Reuters points to high energy costs, resilient growth and heavy government spending, with the AI boom driving a lot of the spending. That AI piece matters for what I cover. The five biggest US hyperscalers issued $159 billion in bonds by mid-2026, more than the $121 billion they issued in all of 2025. AI is now competing with governments for the same pool of capital, and that pushes the price of money up for everyone.
It also explains why the research warning that landed today is more than tech news. Leaders from OpenAI, Anthropic, Microsoft and Meta warned that automating AI research could trigger an intelligence explosion, and noted that Claude already leads 26% of Anthropic’s R&D. The concern is a possible future loss of control, not evidence that a runaway system exists today. But the capital behind this buildout is now big enough to show up in Treasury yields.
Where crypto fits
The one clean divergence I see is ETH. ETH/BTC printed its highest weekly close in eight months on September 22. Ash Crypto’s chart has ETH closing above its 1-week 50 MA two weeks running, with price around $2,685. That’s relative strength, not a breakout. It says money is rotating inside crypto, not that macro turned bullish.
What I’m watching this week:
• Friday’s September jobs report and this week’s inflation data, since the week is packed with inflation and labor numbers.
• Whether the 30-year holds above 5.5%.
• Whether M2 keeps growing once the dollar stops weakening.
If liquidity keeps rising and yields stop, that’s the setup I want. Right now I only have one of the two.
Not financial advice.
#BTC走势分析
MORE MONEY THAN EVER, AT THE HIGHEST PRICE IN DECADES!
The most bullish chart and the most bearish chart of the year are sitting on my timeline at the same time.
The bullish one is global M2. The money supply across the US, China, the euro zone and Japan hit a record of roughly $103 trillion in August, after adding about $1 trillion in a single month. That was the 10th straight monthly increase, and Bitcoin still trades about 33% below its high. That last part is what I keep coming back to. The liquidity up = Bitcoin up trade is the one every crypto account runs with, and this time Bitcoin isn’t following.
The bearish one is the bond market. The US 30-year yield hit 5.5% on Thursday, its highest since 2004, and the 10-year reached 5.22%, the highest since 2007. Traders are now pricing a 71% chance of a Fed hike in October, up from 11% a month ago. The Fed already raised to 3.75%-4% on September 16, its first hike since 2023, with August CPI at 3.4% and oil near $100. And Monday opened with stocks sliding as oil and yields jumped after Trump rejected Iran’s conditions for a ceasefire, with Brent above $106.
How both can be true
I’ve traded stocks longer than I’ve traded crypto, so this is where I’d slow down. M2 measures how much money exists. Yields measure what it costs to borrow. They aren’t the same thing, and the headline number has a few asterisks:
• It’s measured in dollars, so a weaker dollar inflates it. The total is up roughly 8% year over year in dollar terms, but closer to 4.5% at fixed exchange rates, about a third of the 2021 peak.
• The money is going somewhere other than risk assets. Bond investors are demanding more to lend, and that raises the discount rate on everything, crypto included.
• An asset that pays no yield has a harder job when cash pays 4% and 30-year Treasuries pay 5.5%.
So I’m not reading the record M2 chart as number go up, BTC goes up. The lag on that chart is doing a lot of the work, and the last 12 months show it can break.
Why yields are rising now
Reuters points to high energy costs, resilient growth and heavy government spending, with the AI boom driving a lot of the spending. That AI piece matters for what I cover. The five biggest US hyperscalers issued $159 billion in bonds by mid-2026, more than the $121 billion they issued in all of 2025. AI is now competing with governments for the same pool of capital, and that pushes the price of money up for everyone.
It also explains why the research warning that landed today is more than tech news. Leaders from OpenAI, Anthropic, Microsoft and Meta warned that automating AI research could trigger an intelligence explosion, and noted that Claude already leads 26% of Anthropic’s R&D. The concern is a possible future loss of control, not evidence that a runaway system exists today. But the capital behind this buildout is now big enough to show up in Treasury yields.
Where crypto fits
The one clean divergence I see is ETH. ETH/BTC printed its highest weekly close in eight months on September 22. Ash Crypto’s chart has ETH closing above its 1-week 50 MA two weeks running, with price around $2,685. That’s relative strength, not a breakout. It says money is rotating inside crypto, not that macro turned bullish.
What I’m watching this week:
• Friday’s September jobs report and this week’s inflation data, since the week is packed with inflation and labor numbers.
• Whether the 30-year holds above 5.5%.
• Whether M2 keeps growing once the dollar stops weakening.
If liquidity keeps rising and yields stop, that’s the setup I want. Right now I only have one of the two.
Not financial advice.
#BTC走势分析
The bullish one is global M2. The money supply across the US, China, the euro zone and Japan hit a record of roughly $103 trillion in August, after adding about $1 trillion in a single month. That was the 10th straight monthly increase, and Bitcoin still trades about 33% below its high. That last part is what I keep coming back to. The liquidity up = Bitcoin up trade is the one every crypto account runs with, and this time Bitcoin isn’t following.
The bearish one is the bond market. The US 30-year yield hit 5.5% on Thursday, its highest since 2004, and the 10-year reached 5.22%, the highest since 2007. Traders are now pricing a 71% chance of a Fed hike in October, up from 11% a month ago. The Fed already raised to 3.75%-4% on September 16, its first hike since 2023, with August CPI at 3.4% and oil near $100. And Monday opened with stocks sliding as oil and yields jumped after Trump rejected Iran’s conditions for a ceasefire, with Brent above $106.
How both can be true
I’ve traded stocks longer than I’ve traded crypto, so this is where I’d slow down. M2 measures how much money exists. Yields measure what it costs to borrow. They aren’t the same thing, and the headline number has a few asterisks:
• It’s measured in dollars, so a weaker dollar inflates it. The total is up roughly 8% year over year in dollar terms, but closer to 4.5% at fixed exchange rates, about a third of the 2021 peak.
• The money is going somewhere other than risk assets. Bond investors are demanding more to lend, and that raises the discount rate on everything, crypto included.
• An asset that pays no yield has a harder job when cash pays 4% and 30-year Treasuries pay 5.5%.
So I’m not reading the record M2 chart as number go up, BTC goes up. The lag on that chart is doing a lot of the work, and the last 12 months show it can break.
Why yields are rising now
Reuters points to high energy costs, resilient growth and heavy government spending, with the AI boom driving a lot of the spending. That AI piece matters for what I cover. The five biggest US hyperscalers issued $159 billion in bonds by mid-2026, more than the $121 billion they issued in all of 2025. AI is now competing with governments for the same pool of capital, and that pushes the price of money up for everyone.
It also explains why the research warning that landed today is more than tech news. Leaders from OpenAI, Anthropic, Microsoft and Meta warned that automating AI research could trigger an intelligence explosion, and noted that Claude already leads 26% of Anthropic’s R&D. The concern is a possible future loss of control, not evidence that a runaway system exists today. But the capital behind this buildout is now big enough to show up in Treasury yields.
Where crypto fits
The one clean divergence I see is ETH. ETH/BTC printed its highest weekly close in eight months on September 22. Ash Crypto’s chart has ETH closing above its 1-week 50 MA two weeks running, with price around $2,685. That’s relative strength, not a breakout. It says money is rotating inside crypto, not that macro turned bullish.
What I’m watching this week:
• Friday’s September jobs report and this week’s inflation data, since the week is packed with inflation and labor numbers.
• Whether the 30-year holds above 5.5%.
• Whether M2 keeps growing once the dollar stops weakening.
If liquidity keeps rising and yields stop, that’s the setup I want. Right now I only have one of the two.
Not financial advice.
#BTC走势分析
46
50
7.9k
·
--
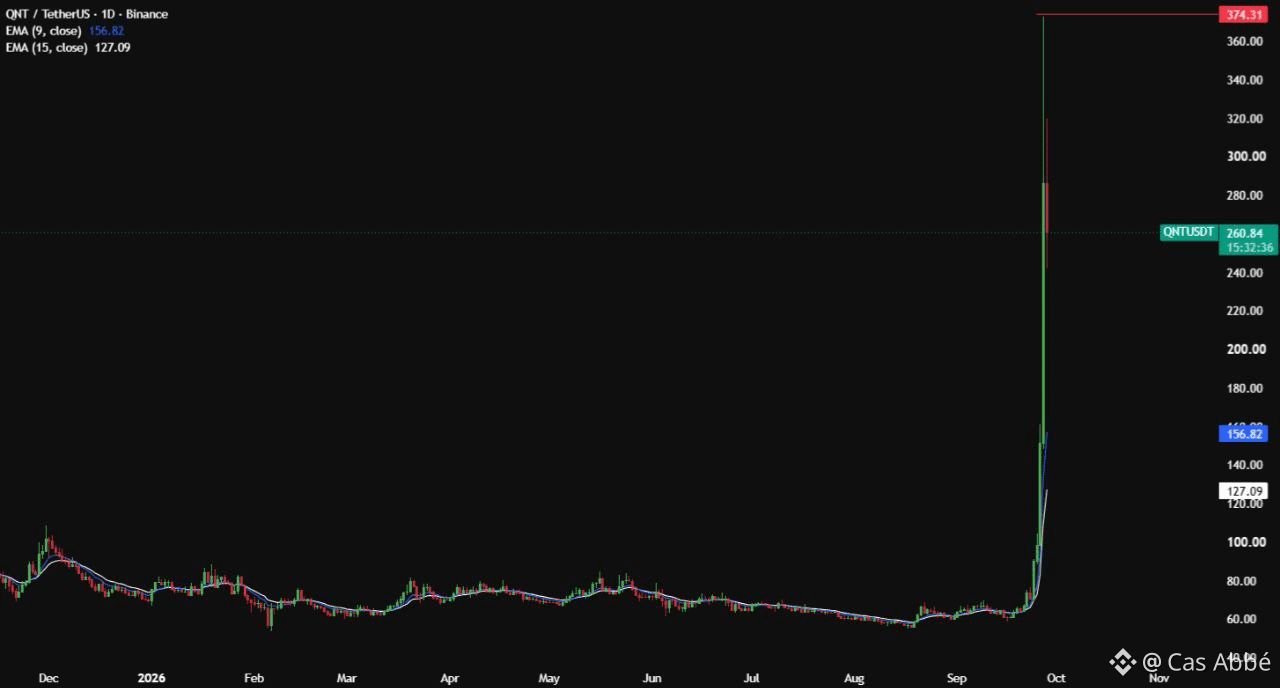
$QNT
The breakout delivered far more than expected.
$QNT pushed from around $100 to above $350, briefly touching the $350–$360 zone, before pulling back.
Now the key area to watch is $238–$266 as support, while $350–$360 remains the major resistance zone.
Momentum is still strong, but after such a sharp move, volatility can stay high.
#QNT #Quant #Crypto #BinanceSquare
$QNT
The breakout delivered far more than expected.
$QNT pushed from around $100 to above $350, briefly touching the $350–$360 zone, before pulling back.
Now the key area to watch is $238–$266 as support, while $350–$360 remains the major resistance zone.
Momentum is still strong, but after such a sharp move, volatility can stay high.
#QNT #Quant #Crypto #BinanceSquare
The breakout delivered far more than expected.
$QNT pushed from around $100 to above $350, briefly touching the $350–$360 zone, before pulling back.
Now the key area to watch is $238–$266 as support, while $350–$360 remains the major resistance zone.
Momentum is still strong, but after such a sharp move, volatility can stay high.
#QNT #Quant #Crypto #BinanceSquare
59
4
101
48.1k
·
--
#Polymarket isn’t just about predicting outcomes it’s about trading changing probabilities.
A market can move from 30¢ to 60¢ as new information comes in, giving traders a real time view of how conviction is shifting.
You can buy or sell positions before the event resolves, while prices are driven by supply and demand between market participants.
That makes the interesting part less about guessing once, and more about watching how the market reacts to information.
Different events. Different opinions. One live market.
@polymarket
Not financial advice.
#Polymarket isn’t just about predicting outcomes it’s about trading changing probabilities.
A market can move from 30¢ to 60¢ as new information comes in, giving traders a real time view of how conviction is shifting.
You can buy or sell positions before the event resolves, while prices are driven by supply and demand between market participants.
That makes the interesting part less about guessing once, and more about watching how the market reacts to information.
Different events. Different opinions. One live market.
@Polymarket
Not financial advice.
A market can move from 30¢ to 60¢ as new information comes in, giving traders a real time view of how conviction is shifting.
You can buy or sell positions before the event resolves, while prices are driven by supply and demand between market participants.
That makes the interesting part less about guessing once, and more about watching how the market reacts to information.
Different events. Different opinions. One live market.
@Polymarket
Not financial advice.

54
1
68
11.5k
·
--
Verified
Acurast just added another layer of transparency to $ACU .
The team has published its ACU Token Transparency Filing through the Blockworks Token Transparency Framework, covering token allocation, vesting, governance and administrative controls.
For the community, having these details publicly available makes it easier to verify the underlying token structure instead of relying only on narratives.
Don’t trust. Verify. 👀
Source: Acurast / Blockworks
Acurast just added another layer of transparency to $ACU .
The team has published its ACU Token Transparency Filing through the Blockworks Token Transparency Framework, covering token allocation, vesting, governance and administrative controls.
For the community, having these details publicly available makes it easier to verify the underlying token structure instead of relying only on narratives.
Don’t trust. Verify. 👀
Source: Acurast / Blockworks
The team has published its ACU Token Transparency Filing through the Blockworks Token Transparency Framework, covering token allocation, vesting, governance and administrative controls.
For the community, having these details publicly available makes it easier to verify the underlying token structure instead of relying only on narratives.
Don’t trust. Verify. 👀
Source: Acurast / Blockworks

50
1
47
9.1k
·
--

Article
BITCOIN JUST RECLAIMED $85K NOW I’M WATCHING OCTOBERI honestly think the market is starting to look very different from where it was a few weeks ago.
Bitcoin is back above $85K after briefly pushing above $86K, while Ethereum has reclaimed $2,700. What caught my attention is that BTC is doing this after spending weeks dealing with rate hikes, regulatory uncertainty and heavy selling pressure. The latest rally also pushed Bitcoin to an eight-month high.
But price is only half the story.
The money coming into the market is getting harder to ignore. U.S. spot Bitcoin ETFs pulled in another $190.7M on Sept. 24, while Ethereum ETFs added $66.1M. Bitcoin ETFs have now recorded six straight sessions of inflows, with the streak reaching more than $2.8B.
That is very different from a market where everyone is simply chasing a quick bounce.
I’m also watching what happened during the recent pullback. Large Bitcoin-holding wallets reportedly added around 30,269 BTC over 96 hours while BTC was falling from the $87K area. Binance also saw more than 13,800 BTC leave its platform in one day, its biggest daily net outflow since 2023 according to CryptoQuant data.
None of this guarantees the next move higher. Wallet data cannot tell us exactly who is buying, and ETF flows can reverse. But when price corrects and those two areas continue showing demand, I don’t want to ignore it.
Then there is October.
The broader historical data is more useful to me. October has been one of Bitcoin’s strongest months, with historical datasets showing an average return around 19% and positive performance in roughly 82% of years since 2015. September, meanwhile, has historically been one of the weaker months.
And this September is already behaving differently.
Bitcoin is currently up around 8% for the month, despite September normally being its weakest month historically.
That is the part I keep coming back to.
We have BTC back above $85K, ETH back above $2,700, billions flowing into spot ETFs, large wallets accumulating during weakness, and October only days away.
I’m not saying the market cannot pull back. After a move this fast, I actually expect volatility.
But I am starting to think the bigger question is no longer whether Bitcoin can survive the fear.
It is whether the market is preparing for a much stronger Q4.
#BTC走势分析 #BTC
BITCOIN JUST RECLAIMED $85K NOW I’M WATCHING OCTOBER
I honestly think the market is starting to look very different from where it was a few weeks ago.
Bitcoin is back above $85K after briefly pushing above $86K, while Ethereum has reclaimed $2,700. What caught my attention is that BTC is doing this after spending weeks dealing with rate hikes, regulatory uncertainty and heavy selling pressure. The latest rally also pushed Bitcoin to an eight-month high.
But price is only half the story.
The money coming into the market is getting harder to ignore. U.S. spot Bitcoin ETFs pulled in another $190.7M on Sept. 24, while Ethereum ETFs added $66.1M. Bitcoin ETFs have now recorded six straight sessions of inflows, with the streak reaching more than $2.8B.
That is very different from a market where everyone is simply chasing a quick bounce.
I’m also watching what happened during the recent pullback. Large Bitcoin-holding wallets reportedly added around 30,269 BTC over 96 hours while BTC was falling from the $87K area. Binance also saw more than 13,800 BTC leave its platform in one day, its biggest daily net outflow since 2023 according to CryptoQuant data.
None of this guarantees the next move higher. Wallet data cannot tell us exactly who is buying, and ETF flows can reverse. But when price corrects and those two areas continue showing demand, I don’t want to ignore it.
Then there is October.
The broader historical data is more useful to me. October has been one of Bitcoin’s strongest months, with historical datasets showing an average return around 19% and positive performance in roughly 82% of years since 2015. September, meanwhile, has historically been one of the weaker months.
And this September is already behaving differently.
Bitcoin is currently up around 8% for the month, despite September normally being its weakest month historically.
That is the part I keep coming back to.
We have BTC back above $85K, ETH back above $2,700, billions flowing into spot ETFs, large wallets accumulating during weakness, and October only days away.
I’m not saying the market cannot pull back. After a move this fast, I actually expect volatility.
But I am starting to think the bigger question is no longer whether Bitcoin can survive the fear.
It is whether the market is preparing for a much stronger Q4.
#BTC走势分析 #BTC
Bitcoin is back above $85K after briefly pushing above $86K, while Ethereum has reclaimed $2,700. What caught my attention is that BTC is doing this after spending weeks dealing with rate hikes, regulatory uncertainty and heavy selling pressure. The latest rally also pushed Bitcoin to an eight-month high.
But price is only half the story.
The money coming into the market is getting harder to ignore. U.S. spot Bitcoin ETFs pulled in another $190.7M on Sept. 24, while Ethereum ETFs added $66.1M. Bitcoin ETFs have now recorded six straight sessions of inflows, with the streak reaching more than $2.8B.
That is very different from a market where everyone is simply chasing a quick bounce.
I’m also watching what happened during the recent pullback. Large Bitcoin-holding wallets reportedly added around 30,269 BTC over 96 hours while BTC was falling from the $87K area. Binance also saw more than 13,800 BTC leave its platform in one day, its biggest daily net outflow since 2023 according to CryptoQuant data.
None of this guarantees the next move higher. Wallet data cannot tell us exactly who is buying, and ETF flows can reverse. But when price corrects and those two areas continue showing demand, I don’t want to ignore it.
Then there is October.
The broader historical data is more useful to me. October has been one of Bitcoin’s strongest months, with historical datasets showing an average return around 19% and positive performance in roughly 82% of years since 2015. September, meanwhile, has historically been one of the weaker months.
And this September is already behaving differently.
Bitcoin is currently up around 8% for the month, despite September normally being its weakest month historically.
That is the part I keep coming back to.
We have BTC back above $85K, ETH back above $2,700, billions flowing into spot ETFs, large wallets accumulating during weakness, and October only days away.
I’m not saying the market cannot pull back. After a move this fast, I actually expect volatility.
But I am starting to think the bigger question is no longer whether Bitcoin can survive the fear.
It is whether the market is preparing for a much stronger Q4.
#BTC走势分析 #BTC
42
47
7.6k
·
--
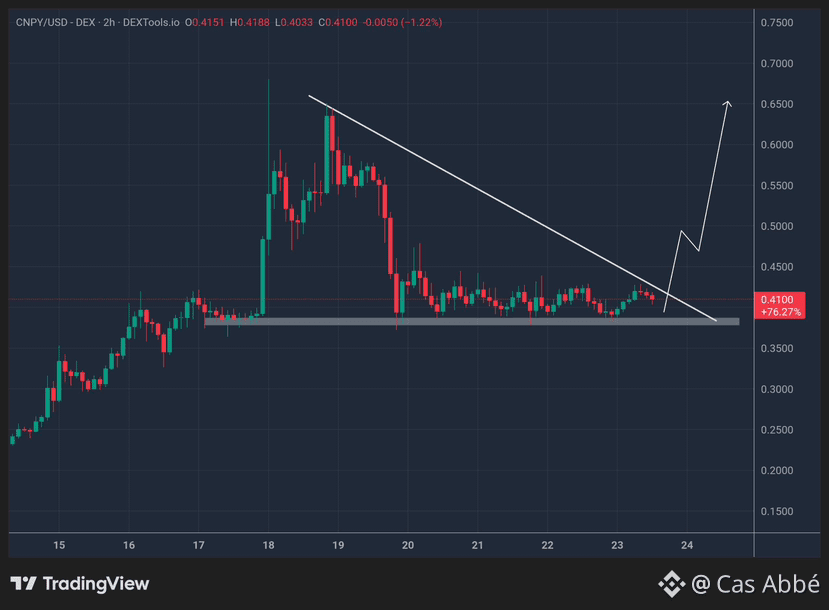
$CNPY
I’ve been looking at the 2h on this one and ngl it’s looking good.
+76% off the recent low, and it’s squeezing tighter and tighter into that trendline sitting around 0.41.
You can just see the coil building.
What I like about the pullback from 0.65, it wasn’t panic selling. Lower highs, sure, but the base is flattening out nicely. That usually means sellers are running out of ammo, not that more pain is coming.
Quick context for anyone just seeing this, Canopy lets devs spin up their own blockchain in like 200 lines of code, no need to bootstrap validators from scratch. Team’s got $8.5M behind them (Arrington, Fenbushi, Borderless, few others), already on Binance Alpha, mainnet’s next up.
That’s the real catalyst here 👏🏻
Clean close above that trendline, roughly 0.45, and I think this moves. Until then I’m not touching it, just watching.
DYOR
$CNPY
I’ve been looking at the 2h on this one and ngl it’s looking good.
+76% off the recent low, and it’s squeezing tighter and tighter into that trendline sitting around 0.41.
You can just see the coil building.
What I like about the pullback from 0.65, it wasn’t panic selling. Lower highs, sure, but the base is flattening out nicely. That usually means sellers are running out of ammo, not that more pain is coming.
Quick context for anyone just seeing this, Canopy lets devs spin up their own blockchain in like 200 lines of code, no need to bootstrap validators from scratch. Team’s got $8.5M behind them (Arrington, Fenbushi, Borderless, few others), already on Binance Alpha, mainnet’s next up.
That’s the real catalyst here 👏🏻
Clean close above that trendline, roughly 0.45, and I think this moves. Until then I’m not touching it, just watching.
DYOR
I’ve been looking at the 2h on this one and ngl it’s looking good.
+76% off the recent low, and it’s squeezing tighter and tighter into that trendline sitting around 0.41.
You can just see the coil building.
What I like about the pullback from 0.65, it wasn’t panic selling. Lower highs, sure, but the base is flattening out nicely. That usually means sellers are running out of ammo, not that more pain is coming.
Quick context for anyone just seeing this, Canopy lets devs spin up their own blockchain in like 200 lines of code, no need to bootstrap validators from scratch. Team’s got $8.5M behind them (Arrington, Fenbushi, Borderless, few others), already on Binance Alpha, mainnet’s next up.
That’s the real catalyst here 👏🏻
Clean close above that trendline, roughly 0.45, and I think this moves. Until then I’m not touching it, just watching.
DYOR
52
58
11.5k
·
--
#Polymarket is interesting because the market itself tells a story.
Instead of waiting for headlines, you can watch traders continuously price different outcomes in real time.
A YES position moving from 30¢ to 55¢ isn’t just a number it shows changing market conviction.
The real edge is watching when sentiment shifts, where liquidity moves, and how quickly the market reacts to new information.
That makes Polymarket more than a prediction platform. It’s becoming a place to track real-time conviction across crypto, macro, sports and more.
Worth keeping an eye on. 👀
Not financial advice.
@polymarket
#btc
#Polymarket is interesting because the market itself tells a story.
Instead of waiting for headlines, you can watch traders continuously price different outcomes in real time.
A YES position moving from 30¢ to 55¢ isn’t just a number it shows changing market conviction.
The real edge is watching when sentiment shifts, where liquidity moves, and how quickly the market reacts to new information.
That makes Polymarket more than a prediction platform. It’s becoming a place to track real-time conviction across crypto, macro, sports and more.
Worth keeping an eye on. 👀
Not financial advice.
@Polymarket
#btc
Instead of waiting for headlines, you can watch traders continuously price different outcomes in real time.
A YES position moving from 30¢ to 55¢ isn’t just a number it shows changing market conviction.
The real edge is watching when sentiment shifts, where liquidity moves, and how quickly the market reacts to new information.
That makes Polymarket more than a prediction platform. It’s becoming a place to track real-time conviction across crypto, macro, sports and more.
Worth keeping an eye on. 👀
Not financial advice.
@Polymarket
#btc

48
52
9.2k
·
--
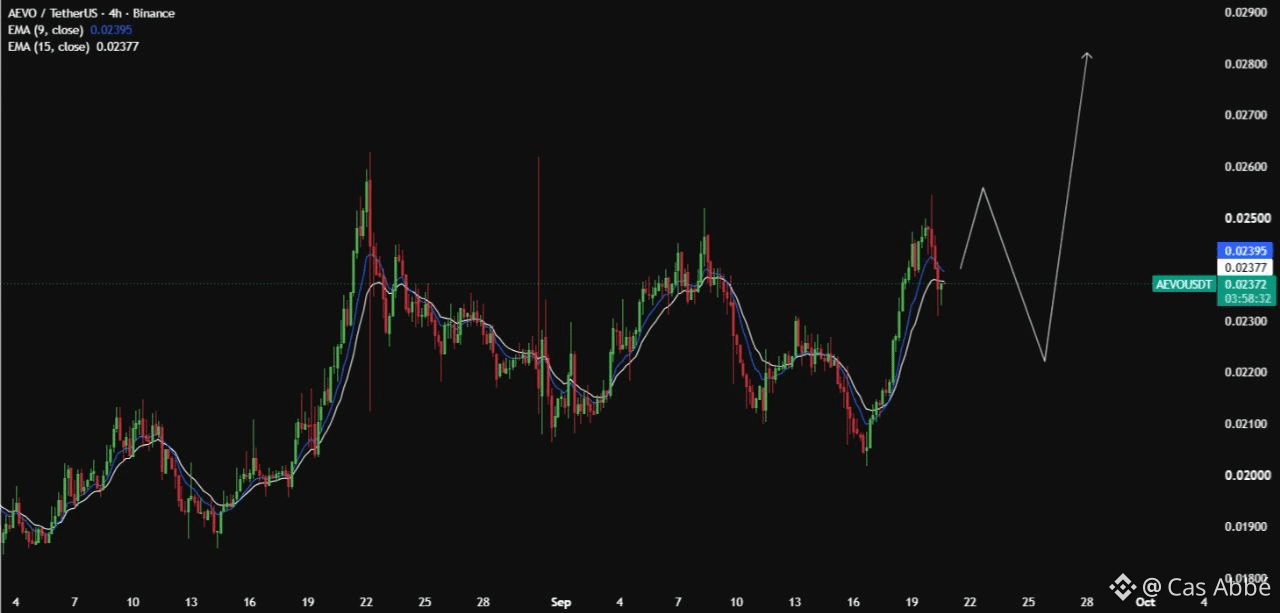
$AEVO is still an interesting name in the on-chain derivatives race.
With $HYPE , GMX, $DYDX and JUP competing for traders, Aevo is taking a different route by combining perpetuals, options and structured products in one trading ecosystem.
What I like about the setup is the focus on bringing a more familiar trading experience on-chain while keeping the broader DeFi infrastructure underneath.
The derivatives market is getting more competitive, so execution, liquidity and product depth will matter more than hype.
@Aevoxyz is definitely one I’m keeping on the radar. 👀
Not financial advice.
#btc
$AEVO is still an interesting name in the on-chain derivatives race.
With $HYPE , GMX, $DYDX and JUP competing for traders, Aevo is taking a different route by combining perpetuals, options and structured products in one trading ecosystem.
What I like about the setup is the focus on bringing a more familiar trading experience on-chain while keeping the broader DeFi infrastructure underneath.
The derivatives market is getting more competitive, so execution, liquidity and product depth will matter more than hype.
@Aevo is definitely one I’m keeping on the radar. 👀
Not financial advice.
#btc
With $HYPE , GMX, $DYDX and JUP competing for traders, Aevo is taking a different route by combining perpetuals, options and structured products in one trading ecosystem.
What I like about the setup is the focus on bringing a more familiar trading experience on-chain while keeping the broader DeFi infrastructure underneath.
The derivatives market is getting more competitive, so execution, liquidity and product depth will matter more than hype.
@Aevo is definitely one I’m keeping on the radar. 👀
Not financial advice.
#btc
40
46
8.1k
·
--
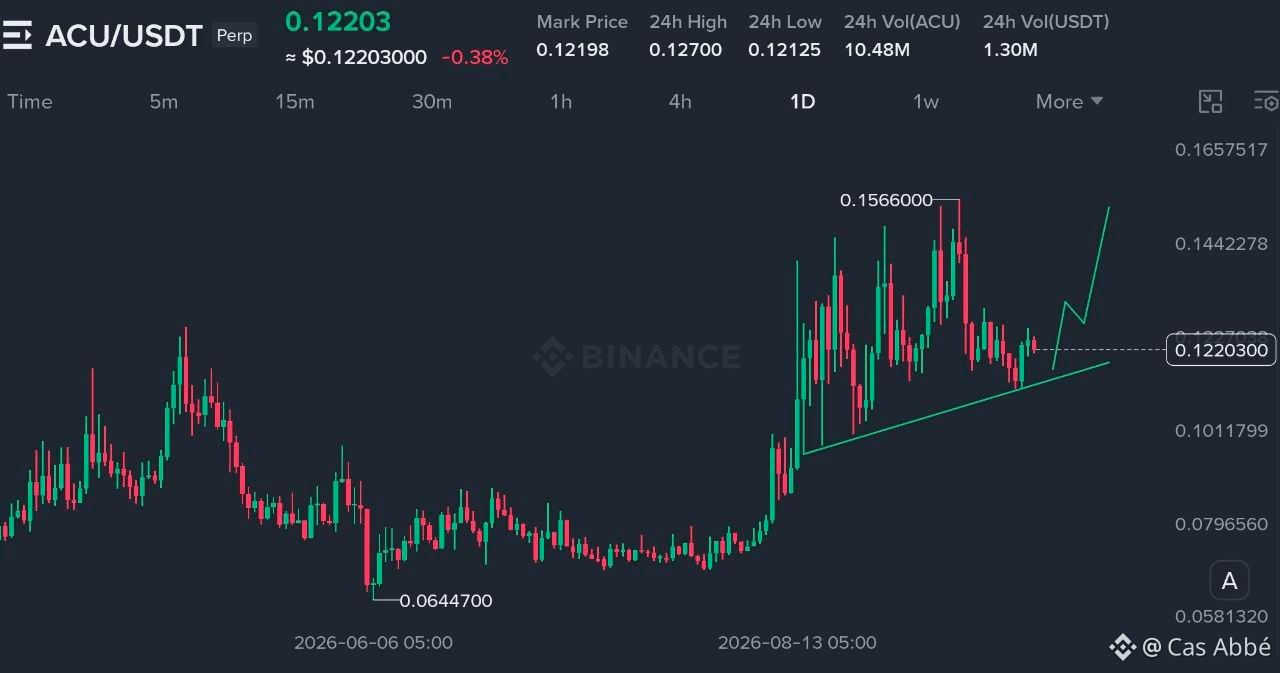
$ACU is showing an interesting market structure.
Price is holding above a rising support trendline while repeatedly testing the $0.127 resistance area.
Key levels to watch:
• Support: $0.115–$0.120
• Resistance: $0.127
• Major resistance: $0.145–$0.156
A sustained move above resistance can change the short-term structure, while a breakdown below support may signal weakness.
Always wait for confirmation rather than chasing the first breakout.
$ACU is showing an interesting market structure.
Price is holding above a rising support trendline while repeatedly testing the $0.127 resistance area.
Key levels to watch:
• Support: $0.115–$0.120
• Resistance: $0.127
• Major resistance: $0.145–$0.156
A sustained move above resistance can change the short-term structure, while a breakdown below support may signal weakness.
Always wait for confirmation rather than chasing the first breakout.
Price is holding above a rising support trendline while repeatedly testing the $0.127 resistance area.
Key levels to watch:
• Support: $0.115–$0.120
• Resistance: $0.127
• Major resistance: $0.145–$0.156
A sustained move above resistance can change the short-term structure, while a breakdown below support may signal weakness.
Always wait for confirmation rather than chasing the first breakout.
39
48
7k
·
--
Article
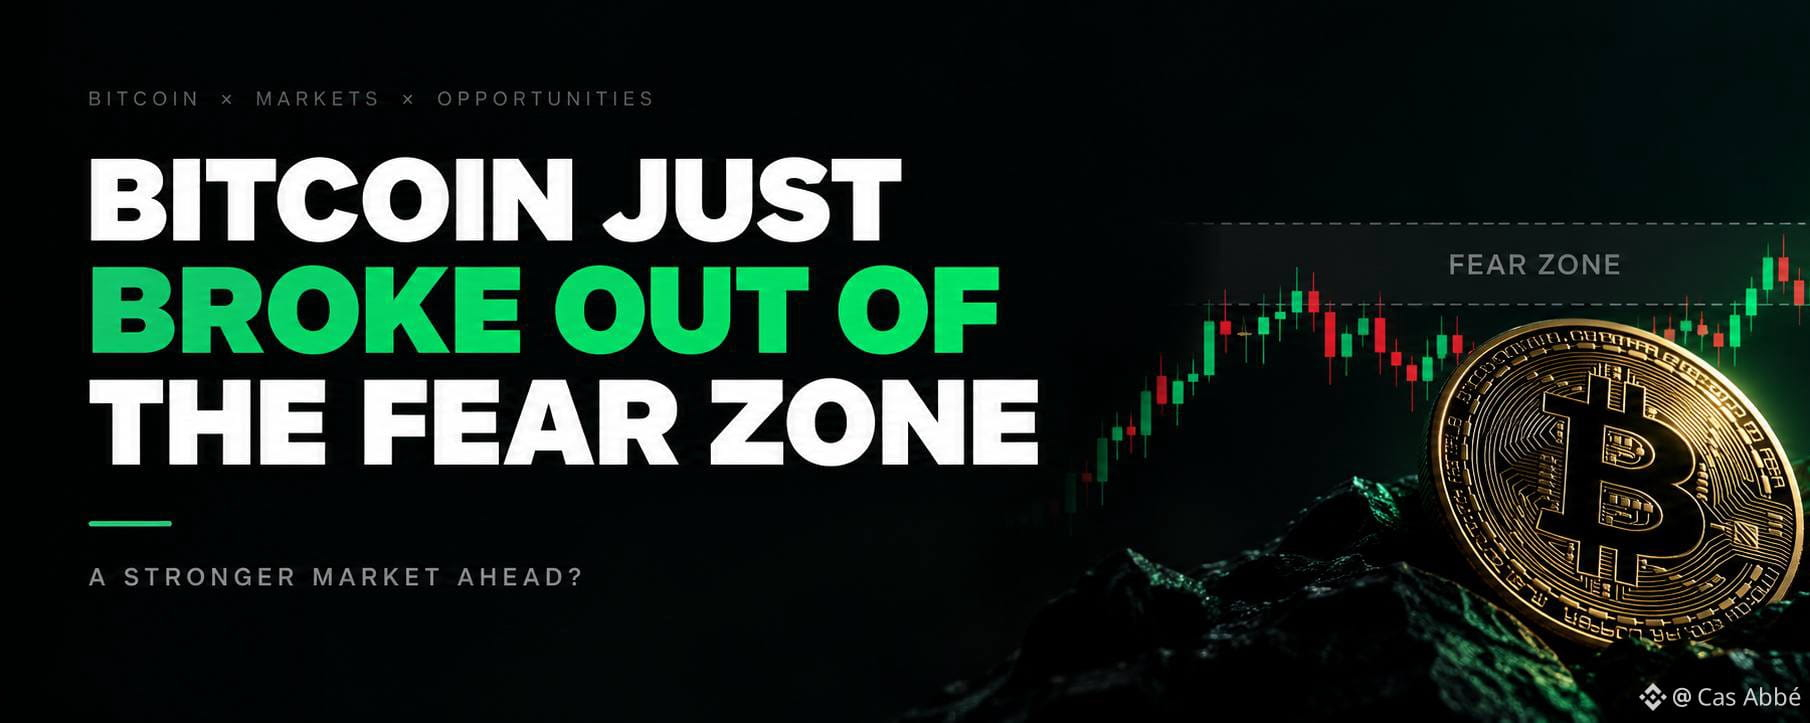
BITCOIN JUST BROKE OUT OF THE FEAR ZONEThis is the kind of move that makes me pay attention.
A few days ago, Bitcoin was trading near $75K after the CLARITY Act failed in the Senate and the Fed delivered its first rate hike since 2023. Today, BTC has pushed back toward $81K, while SOL has climbed above $110 and the altcoin market has moved back above $220B.
What changed?
The market realized that the regulatory story did not end with CLARITY.
The CFTC has now sent its proposed crypto market rules to the White House for review, moving ahead with rulemaking even after the Senate setback. The SEC has also introduced a five-year exemption framework for platforms trading tokenized stocks on blockchain, while requiring those tokens to carry the same shareholder rights as the underlying stocks.
That is a pretty important distinction.
I was watching the CLARITY vote because legislation can create a much cleaner framework. But the market is now getting something else: regulators are continuing to build the framework themselves.
At the same time, Bitcoin is showing me something technically interesting.
BTC went from roughly $75K to above $80K in just a few sessions. The latest move is not happening in isolation either. Solana is back above $106, total crypto market cap is around $2.66T, and several large-cap altcoins are outperforming Bitcoin on the rebound.
For me, $82K is now the level I care about.
That area has repeatedly acted as the upper edge of Bitcoin’s recent range. A clean break above it would tell me the market is finally trying to move beyond the range that has capped BTC for weeks. Until then, I see this as a strong recovery, but not something I want to chase blindly.
There is also a macro contradiction here that I find fascinating.
The Fed just raised rates to 3.75%-4.00%, and the 10-year Treasury yield remains close to 5%. On paper, that is not the environment where I would expect crypto to suddenly rip higher. Yet Bitcoin is doing exactly that.
That tells me crypto is currently responding to more than just interest rates.
Regulation, liquidity expectations, positioning and risk appetite are all fighting for control of the tape.
So I’m not calling this a new bull run yet.
I’m watching $82K on Bitcoin, $110 on SOL, and whether altcoins can keep gaining without BTC dominance ripping higher again.
If those pieces continue to line up, this rebound gets a lot more interesting.
#BTC走势分析
BITCOIN JUST BROKE OUT OF THE FEAR ZONE
This is the kind of move that makes me pay attention.
A few days ago, Bitcoin was trading near $75K after the CLARITY Act failed in the Senate and the Fed delivered its first rate hike since 2023. Today, BTC has pushed back toward $81K, while SOL has climbed above $110 and the altcoin market has moved back above $220B.
What changed?
The market realized that the regulatory story did not end with CLARITY.
The CFTC has now sent its proposed crypto market rules to the White House for review, moving ahead with rulemaking even after the Senate setback. The SEC has also introduced a five-year exemption framework for platforms trading tokenized stocks on blockchain, while requiring those tokens to carry the same shareholder rights as the underlying stocks.
That is a pretty important distinction.
I was watching the CLARITY vote because legislation can create a much cleaner framework. But the market is now getting something else: regulators are continuing to build the framework themselves.
At the same time, Bitcoin is showing me something technically interesting.
BTC went from roughly $75K to above $80K in just a few sessions. The latest move is not happening in isolation either. Solana is back above $106, total crypto market cap is around $2.66T, and several large-cap altcoins are outperforming Bitcoin on the rebound.
For me, $82K is now the level I care about.
That area has repeatedly acted as the upper edge of Bitcoin’s recent range. A clean break above it would tell me the market is finally trying to move beyond the range that has capped BTC for weeks. Until then, I see this as a strong recovery, but not something I want to chase blindly.
There is also a macro contradiction here that I find fascinating.
The Fed just raised rates to 3.75%-4.00%, and the 10-year Treasury yield remains close to 5%. On paper, that is not the environment where I would expect crypto to suddenly rip higher. Yet Bitcoin is doing exactly that.
That tells me crypto is currently responding to more than just interest rates.
Regulation, liquidity expectations, positioning and risk appetite are all fighting for control of the tape.
So I’m not calling this a new bull run yet.
I’m watching $82K on Bitcoin, $110 on SOL, and whether altcoins can keep gaining without BTC dominance ripping higher again.
If those pieces continue to line up, this rebound gets a lot more interesting.
#BTC走势分析
A few days ago, Bitcoin was trading near $75K after the CLARITY Act failed in the Senate and the Fed delivered its first rate hike since 2023. Today, BTC has pushed back toward $81K, while SOL has climbed above $110 and the altcoin market has moved back above $220B.
What changed?
The market realized that the regulatory story did not end with CLARITY.
The CFTC has now sent its proposed crypto market rules to the White House for review, moving ahead with rulemaking even after the Senate setback. The SEC has also introduced a five-year exemption framework for platforms trading tokenized stocks on blockchain, while requiring those tokens to carry the same shareholder rights as the underlying stocks.
That is a pretty important distinction.
I was watching the CLARITY vote because legislation can create a much cleaner framework. But the market is now getting something else: regulators are continuing to build the framework themselves.
At the same time, Bitcoin is showing me something technically interesting.
BTC went from roughly $75K to above $80K in just a few sessions. The latest move is not happening in isolation either. Solana is back above $106, total crypto market cap is around $2.66T, and several large-cap altcoins are outperforming Bitcoin on the rebound.
For me, $82K is now the level I care about.
That area has repeatedly acted as the upper edge of Bitcoin’s recent range. A clean break above it would tell me the market is finally trying to move beyond the range that has capped BTC for weeks. Until then, I see this as a strong recovery, but not something I want to chase blindly.
There is also a macro contradiction here that I find fascinating.
The Fed just raised rates to 3.75%-4.00%, and the 10-year Treasury yield remains close to 5%. On paper, that is not the environment where I would expect crypto to suddenly rip higher. Yet Bitcoin is doing exactly that.
That tells me crypto is currently responding to more than just interest rates.
Regulation, liquidity expectations, positioning and risk appetite are all fighting for control of the tape.
So I’m not calling this a new bull run yet.
I’m watching $82K on Bitcoin, $110 on SOL, and whether altcoins can keep gaining without BTC dominance ripping higher again.
If those pieces continue to line up, this rebound gets a lot more interesting.
#BTC走势分析
35
40
6.9k
·
--
Verified
@polymarket is starting to look less like a simple prediction platform and more like a real-time information market.
Right now, you can find live markets around BTC price levels, $ETH , $SOL , XRP, macro data and major financial events with millions of dollars flowing through individual markets.
What I find interesting is the speed at which these probabilities react.
New information comes in → traders reposition → market probability changes.
And now #Polymarket is expanding beyond event markets with Perps across crypto, equities, indices and commodities, bringing another layer of active trading to the platform.
That combination of prediction markets + real-time trading makes #Polymarket one of the platforms I’m watching closely.
As the #prediction market sector grows, the real question is how much of traditional market information can eventually move on-chain.
Not financial advice.
@Polymarket is starting to look less like a simple prediction platform and more like a real-time information market.
Right now, you can find live markets around BTC price levels, $ETH , $SOL , XRP, macro data and major financial events with millions of dollars flowing through individual markets.
What I find interesting is the speed at which these probabilities react.
New information comes in → traders reposition → market probability changes.
And now #Polymarket is expanding beyond event markets with Perps across crypto, equities, indices and commodities, bringing another layer of active trading to the platform.
That combination of prediction markets + real-time trading makes #Polymarket one of the platforms I’m watching closely.
As the #prediction market sector grows, the real question is how much of traditional market information can eventually move on-chain.
Not financial advice.
Right now, you can find live markets around BTC price levels, $ETH , $SOL , XRP, macro data and major financial events with millions of dollars flowing through individual markets.
What I find interesting is the speed at which these probabilities react.
New information comes in → traders reposition → market probability changes.
And now #Polymarket is expanding beyond event markets with Perps across crypto, equities, indices and commodities, bringing another layer of active trading to the platform.
That combination of prediction markets + real-time trading makes #Polymarket one of the platforms I’m watching closely.
As the #prediction market sector grows, the real question is how much of traditional market information can eventually move on-chain.
Not financial advice.

29
36
5.8k
·
--
Verified
I’ve always thought the hardest part of trading low caps was finding the next move. Turns out, it’s knowing what you’re actually buying.
Bubblemaps just rolled out a full platform revamp and it’s not the new coat of paint kind.
It actually changes how I look for tokens. I used to have five tabs open, one for the chart, one for the bubble map, one to check the launchpad, one to stalk the socials, one to actually swap. Now it’s just… one tab.
Opened the new trending/fresh feed first (Arc is live on it from day one, along with the usual chains) and started hovering over tokens before I even clicked in. It throws up an instant bubble map scan right there, no page load, no separate tab. That alone would’ve saved me from two coins I aped into blind last month.
The part that actually stopped me: clicking a candle. Any candle. It shows you the holder distribution at that exact moment, not now, but at the point in the chart where the pump or dump happened. That’s the difference between this looks bundled and I can see the wallets that bundled it.
Quick rundown of what’s actually in there:
↳ Bubblemaps Score, flags insider clusters and bundled wallets before you buy
↳ Filters by chain, launchpad, price, volume, liquidity
↳ Verified/reviewed project socials, so you’re not trusting a random link
↳ Wallet labels reviewed by actual on-chain sleuths, not just an algo guess
↳ Built-in swap at 0.5%, lowest I’ve seen anywhere
↳ In-app boosting if you want a token to actually get seen
The whole point is you can find, vet, and buy without leaving the platform, with the risky stuff getting filtered out before you even buy. After using it for an hour, I get why that matters more than it sounds. Every extra tab you open is a chance to miss the thing that mattered.
Testing it out properly this week. If you’re still finding tokens on one app and checking them on another, you’re doing it the slow way.
@bubblemaps $BMT
I’ve always thought the hardest part of trading low caps was finding the next move. Turns out, it’s knowing what you’re actually buying.
Bubblemaps just rolled out a full platform revamp and it’s not the new coat of paint kind.
It actually changes how I look for tokens. I used to have five tabs open, one for the chart, one for the bubble map, one to check the launchpad, one to stalk the socials, one to actually swap. Now it’s just… one tab.
Opened the new trending/fresh feed first (Arc is live on it from day one, along with the usual chains) and started hovering over tokens before I even clicked in. It throws up an instant bubble map scan right there, no page load, no separate tab. That alone would’ve saved me from two coins I aped into blind last month.
The part that actually stopped me: clicking a candle. Any candle. It shows you the holder distribution at that exact moment, not now, but at the point in the chart where the pump or dump happened. That’s the difference between this looks bundled and I can see the wallets that bundled it.
Quick rundown of what’s actually in there:
↳ Bubblemaps Score, flags insider clusters and bundled wallets before you buy
↳ Filters by chain, launchpad, price, volume, liquidity
↳ Verified/reviewed project socials, so you’re not trusting a random link
↳ Wallet labels reviewed by actual on-chain sleuths, not just an algo guess
↳ Built-in swap at 0.5%, lowest I’ve seen anywhere
↳ In-app boosting if you want a token to actually get seen
The whole point is you can find, vet, and buy without leaving the platform, with the risky stuff getting filtered out before you even buy. After using it for an hour, I get why that matters more than it sounds. Every extra tab you open is a chance to miss the thing that mattered.
Testing it out properly this week. If you’re still finding tokens on one app and checking them on another, you’re doing it the slow way.
@Bubblemaps.io $BMT
Bubblemaps just rolled out a full platform revamp and it’s not the new coat of paint kind.
It actually changes how I look for tokens. I used to have five tabs open, one for the chart, one for the bubble map, one to check the launchpad, one to stalk the socials, one to actually swap. Now it’s just… one tab.
Opened the new trending/fresh feed first (Arc is live on it from day one, along with the usual chains) and started hovering over tokens before I even clicked in. It throws up an instant bubble map scan right there, no page load, no separate tab. That alone would’ve saved me from two coins I aped into blind last month.
The part that actually stopped me: clicking a candle. Any candle. It shows you the holder distribution at that exact moment, not now, but at the point in the chart where the pump or dump happened. That’s the difference between this looks bundled and I can see the wallets that bundled it.
Quick rundown of what’s actually in there:
↳ Bubblemaps Score, flags insider clusters and bundled wallets before you buy
↳ Filters by chain, launchpad, price, volume, liquidity
↳ Verified/reviewed project socials, so you’re not trusting a random link
↳ Wallet labels reviewed by actual on-chain sleuths, not just an algo guess
↳ Built-in swap at 0.5%, lowest I’ve seen anywhere
↳ In-app boosting if you want a token to actually get seen
The whole point is you can find, vet, and buy without leaving the platform, with the risky stuff getting filtered out before you even buy. After using it for an hour, I get why that matters more than it sounds. Every extra tab you open is a chance to miss the thing that mattered.
Testing it out properly this week. If you’re still finding tokens on one app and checking them on another, you’re doing it the slow way.
@Bubblemaps.io $BMT
49
47
12.8k
·
--
Verified
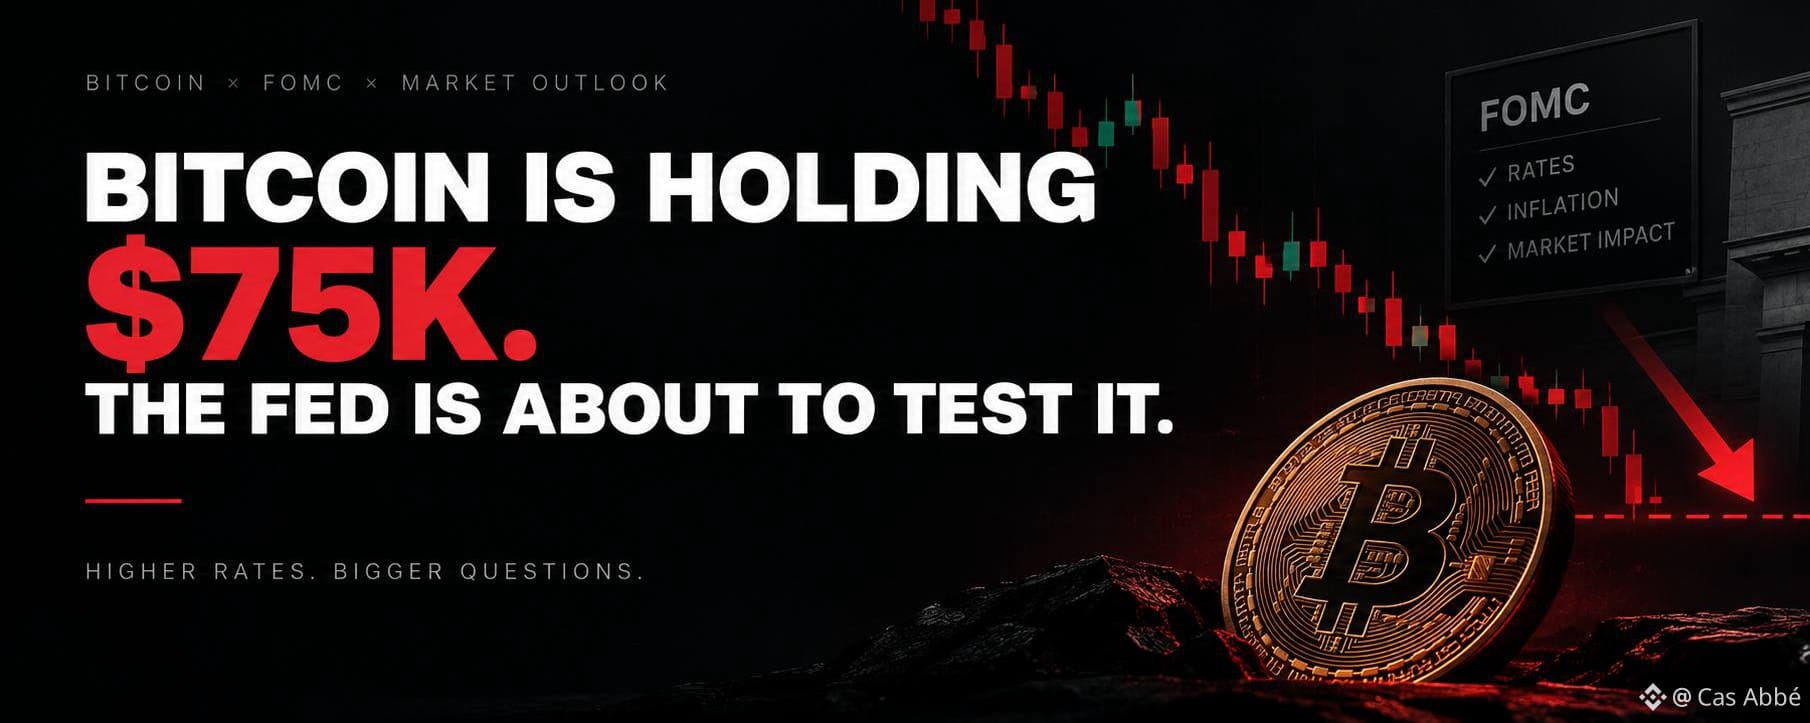
Article
BITCOIN IS HOLDING $75K & THE FED IS ABOUT TO TEST ITI think this is one of those moments where the market can punish both bulls and bears.
Bitcoin is still hovering around the $75K area after the Senate failed to advance the CLARITY Act. The vote was 49-50, falling short of the 60 votes needed to move the bill forward. BTC then dropped toward $75K, while ETH and several major altcoins took a harder hit.
What interests me is that Bitcoin has not completely broken down despite losing one of the biggest regulatory catalysts the market had been pricing in.
Now the Fed takes over.
Markets have been pricing a 25 bp hike, which would take the policy range to 3.75%-4.00%. Inflation is still running above the Fed’s 2% target, while the 10-year Treasury yield has pushed above 5%. That combination is not exactly friendly for high-risk assets.
And this is why I’m not expecting the headline rate decision alone to tell us much.
The hike is already heavily expected. What I care about is what comes after it. Does Fed Chair Kevin Warsh signal another hike is possible? Does he leave the door open for a pause? What does the updated path for rates look like?
That reaction could matter more than the 25 bp itself.
There’s another interesting detail here. CoinMarketCap Research says Bitcoin’s short-term correlation with traditional markets has weakened sharply after the CLARITY shock, suggesting crypto is currently being driven more by crypto-specific catalysts than the usual macro playbook.
So I’m watching two things at the same time.
$75K is the line I don’t want Bitcoin to lose decisively. And the Fed’s language is the catalyst that could decide whether that level holds.
If BTC survives the CLARITY disappointment and the FOMC without losing $75K, I think the market is showing more underlying strength than the red candles suggest.
If $75K breaks cleanly, though, I’m not going to force a bullish narrative.
Let the chart prove it.
#BTC走势分析
BITCOIN IS HOLDING $75K & THE FED IS ABOUT TO TEST IT
I think this is one of those moments where the market can punish both bulls and bears.
Bitcoin is still hovering around the $75K area after the Senate failed to advance the CLARITY Act. The vote was 49-50, falling short of the 60 votes needed to move the bill forward. BTC then dropped toward $75K, while ETH and several major altcoins took a harder hit.
What interests me is that Bitcoin has not completely broken down despite losing one of the biggest regulatory catalysts the market had been pricing in.
Now the Fed takes over.
Markets have been pricing a 25 bp hike, which would take the policy range to 3.75%-4.00%. Inflation is still running above the Fed’s 2% target, while the 10-year Treasury yield has pushed above 5%. That combination is not exactly friendly for high-risk assets.
And this is why I’m not expecting the headline rate decision alone to tell us much.
The hike is already heavily expected. What I care about is what comes after it. Does Fed Chair Kevin Warsh signal another hike is possible? Does he leave the door open for a pause? What does the updated path for rates look like?
That reaction could matter more than the 25 bp itself.
There’s another interesting detail here. CoinMarketCap Research says Bitcoin’s short-term correlation with traditional markets has weakened sharply after the CLARITY shock, suggesting crypto is currently being driven more by crypto-specific catalysts than the usual macro playbook.
So I’m watching two things at the same time.
$75K is the line I don’t want Bitcoin to lose decisively. And the Fed’s language is the catalyst that could decide whether that level holds.
If BTC survives the CLARITY disappointment and the FOMC without losing $75K, I think the market is showing more underlying strength than the red candles suggest.
If $75K breaks cleanly, though, I’m not going to force a bullish narrative.
Let the chart prove it.
#BTC走势分析
Bitcoin is still hovering around the $75K area after the Senate failed to advance the CLARITY Act. The vote was 49-50, falling short of the 60 votes needed to move the bill forward. BTC then dropped toward $75K, while ETH and several major altcoins took a harder hit.
What interests me is that Bitcoin has not completely broken down despite losing one of the biggest regulatory catalysts the market had been pricing in.
Now the Fed takes over.
Markets have been pricing a 25 bp hike, which would take the policy range to 3.75%-4.00%. Inflation is still running above the Fed’s 2% target, while the 10-year Treasury yield has pushed above 5%. That combination is not exactly friendly for high-risk assets.
And this is why I’m not expecting the headline rate decision alone to tell us much.
The hike is already heavily expected. What I care about is what comes after it. Does Fed Chair Kevin Warsh signal another hike is possible? Does he leave the door open for a pause? What does the updated path for rates look like?
That reaction could matter more than the 25 bp itself.
There’s another interesting detail here. CoinMarketCap Research says Bitcoin’s short-term correlation with traditional markets has weakened sharply after the CLARITY shock, suggesting crypto is currently being driven more by crypto-specific catalysts than the usual macro playbook.
So I’m watching two things at the same time.
$75K is the line I don’t want Bitcoin to lose decisively. And the Fed’s language is the catalyst that could decide whether that level holds.
If BTC survives the CLARITY disappointment and the FOMC without losing $75K, I think the market is showing more underlying strength than the red candles suggest.
If $75K breaks cleanly, though, I’m not going to force a bullish narrative.
Let the chart prove it.
#BTC走势分析
38
48
16.5k
·
--
Verified

Article
BITCOIN IS AT A VERY IMPORTANT LEVEL. THIS IS WHERE THE BULL CASE GETS TESTED.I’m watching Bitcoin a lot more closely here because the market is starting to look less clean than it did a few weeks ago.
Bitcoin recently pushed above $82,000, but the move lost momentum right around the 50-week moving average. That level has become a serious line in the sand. Galaxy Research had the 50-week average around $81,000 earlier this month, while Bitcoin has since slipped back toward the $77,000 area.
What makes this interesting is that the market has already done a lot of work on the upside. BTC rallied from roughly $62,000 to $82,000 before the recent Golden Cross even appeared. So I don’t want to look at one bullish indicator and immediately call a new bull market. The Golden Cross is useful, but it is also a lagging signal. Bitcoin has historically pulled back after some Golden Crosses, including in 2021, 2023, 2024 and 2025.
For me, the next few weekly candles matter more than the headline.
I want to see Bitcoin reclaim the 50-week MA and actually close above it. If that happens, the rejection starts looking more like a temporary shakeout. If BTC keeps getting rejected and loses the $75,000 area, I would become much more cautious. Recent market analysis also points to roughly $72,800 as an important lower support around the 200-day EMA.
And then there is the macro problem nobody can ignore. Markets are now pricing an increasingly high probability of a Fed rate hike on September 16 after hotter inflation data. Reuters reported that core CPI rose 0.3% in August, above expectations, while overall inflation reached 3.4%. Rate-hike odds climbed to around 85% after the data.
So yes, I still see a bullish case here.
But I think Bitcoin has to prove it.
Hold the major support, reclaim the 50-week average, then break the $82,000 to $83,000 resistance zone. Until that happens, I’m treating this as a decision point, not confirmation of a new bull run.
#BTC走势分析
BITCOIN IS AT A VERY IMPORTANT LEVEL. THIS IS WHERE THE BULL CASE GETS TESTED.
I’m watching Bitcoin a lot more closely here because the market is starting to look less clean than it did a few weeks ago.
Bitcoin recently pushed above $82,000, but the move lost momentum right around the 50-week moving average. That level has become a serious line in the sand. Galaxy Research had the 50-week average around $81,000 earlier this month, while Bitcoin has since slipped back toward the $77,000 area.
What makes this interesting is that the market has already done a lot of work on the upside. BTC rallied from roughly $62,000 to $82,000 before the recent Golden Cross even appeared. So I don’t want to look at one bullish indicator and immediately call a new bull market. The Golden Cross is useful, but it is also a lagging signal. Bitcoin has historically pulled back after some Golden Crosses, including in 2021, 2023, 2024 and 2025.
For me, the next few weekly candles matter more than the headline.
I want to see Bitcoin reclaim the 50-week MA and actually close above it. If that happens, the rejection starts looking more like a temporary shakeout. If BTC keeps getting rejected and loses the $75,000 area, I would become much more cautious. Recent market analysis also points to roughly $72,800 as an important lower support around the 200-day EMA.
And then there is the macro problem nobody can ignore. Markets are now pricing an increasingly high probability of a Fed rate hike on September 16 after hotter inflation data. Reuters reported that core CPI rose 0.3% in August, above expectations, while overall inflation reached 3.4%. Rate-hike odds climbed to around 85% after the data.
So yes, I still see a bullish case here.
But I think Bitcoin has to prove it.
Hold the major support, reclaim the 50-week average, then break the $82,000 to $83,000 resistance zone. Until that happens, I’m treating this as a decision point, not confirmation of a new bull run.
#BTC走势分析
Bitcoin recently pushed above $82,000, but the move lost momentum right around the 50-week moving average. That level has become a serious line in the sand. Galaxy Research had the 50-week average around $81,000 earlier this month, while Bitcoin has since slipped back toward the $77,000 area.
What makes this interesting is that the market has already done a lot of work on the upside. BTC rallied from roughly $62,000 to $82,000 before the recent Golden Cross even appeared. So I don’t want to look at one bullish indicator and immediately call a new bull market. The Golden Cross is useful, but it is also a lagging signal. Bitcoin has historically pulled back after some Golden Crosses, including in 2021, 2023, 2024 and 2025.
For me, the next few weekly candles matter more than the headline.
I want to see Bitcoin reclaim the 50-week MA and actually close above it. If that happens, the rejection starts looking more like a temporary shakeout. If BTC keeps getting rejected and loses the $75,000 area, I would become much more cautious. Recent market analysis also points to roughly $72,800 as an important lower support around the 200-day EMA.
And then there is the macro problem nobody can ignore. Markets are now pricing an increasingly high probability of a Fed rate hike on September 16 after hotter inflation data. Reuters reported that core CPI rose 0.3% in August, above expectations, while overall inflation reached 3.4%. Rate-hike odds climbed to around 85% after the data.
So yes, I still see a bullish case here.
But I think Bitcoin has to prove it.
Hold the major support, reclaim the 50-week average, then break the $82,000 to $83,000 resistance zone. Until that happens, I’m treating this as a decision point, not confirmation of a new bull run.
#BTC走势分析
33
47
6k
·
--
#Polymarket is becoming more than a prediction platform.
What stands out to me is the variety of markets from crypto and macro to sports, politics and major global events.
You’re not just reading opinions you can watch probabilities change as new information enters the market.
With prediction markets gaining traction across crypto, @polymarket remains one of the strongest products in the sector.
The real time information layer is what keeps it interesting. 👀
#Polymarket #DeFi #Crypto
#Polymarket is becoming more than a prediction platform.
What stands out to me is the variety of markets from crypto and macro to sports, politics and major global events.
You’re not just reading opinions you can watch probabilities change as new information enters the market.
With prediction markets gaining traction across crypto, @Polymarket remains one of the strongest products in the sector.
The real time information layer is what keeps it interesting. 👀
#Polymarket #DeFi #Crypto
What stands out to me is the variety of markets from crypto and macro to sports, politics and major global events.
You’re not just reading opinions you can watch probabilities change as new information enters the market.
With prediction markets gaining traction across crypto, @Polymarket remains one of the strongest products in the sector.
The real time information layer is what keeps it interesting. 👀
#Polymarket #DeFi #Crypto

40
54
7.2k
·
--
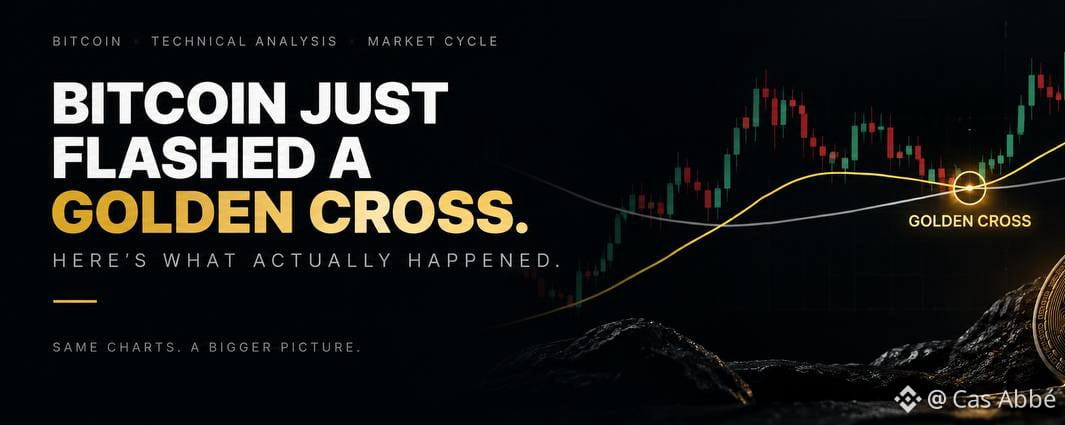
Article
BITCOIN FLASHED A GOLDEN CROSS. BUT I’M NOT CALLING THE BOTTOM YET.Bitcoin just gave traders a signal that gets everyone’s attention: the 50-day moving average moved above the 200-day moving average, creating a Golden Cross. It is the first daily Golden Cross since May 2025, after Bitcoin spent months in a brutal downtrend.
The reason this one matters is the 2023 comparison. Back then, Bitcoin formed a Golden Cross in February 2023 after the 2022 bear market had already done most of its damage. BTC was around $23,000 at the time, and that crossover was followed by a much stronger recovery. Historical data shows the February 2023 cross was eventually followed by substantial upside.
But here is where I would slow down.
Bitcoin is not entering this Golden Cross from the same starting point. BTC has already rallied from around $59,000 to above $80,000, so a lot of the recovery happened before the signal appeared.
That is important because moving averages are lagging indicators. They confirm that momentum has improved, but they do not predict the next move by themselves.
There is another reason I am staying cautious. Bitcoin briefly confirmed the Golden Cross this week, but the 50-day EMA slipped back below the 200-day EMA on Friday as BTC pulled toward $77,000. At the same time, markets have become more worried about a possible Fed rate hike, which is putting pressure on risk assets.
For me, the real confirmation is not the Golden Cross itself.
I want to see Bitcoin reclaim and hold the $80,000 to $82,000 area, while the moving averages continue separating and macro pressure starts easing.
The setup is definitely interesting. But I would rather let Bitcoin prove the reversal than turn one bullish crossover into a guaranteed bull market.
#BTC走势分析
BITCOIN FLASHED A GOLDEN CROSS. BUT I’M NOT CALLING THE BOTTOM YET.
Bitcoin just gave traders a signal that gets everyone’s attention: the 50-day moving average moved above the 200-day moving average, creating a Golden Cross. It is the first daily Golden Cross since May 2025, after Bitcoin spent months in a brutal downtrend.
The reason this one matters is the 2023 comparison. Back then, Bitcoin formed a Golden Cross in February 2023 after the 2022 bear market had already done most of its damage. BTC was around $23,000 at the time, and that crossover was followed by a much stronger recovery. Historical data shows the February 2023 cross was eventually followed by substantial upside.
But here is where I would slow down.
Bitcoin is not entering this Golden Cross from the same starting point. BTC has already rallied from around $59,000 to above $80,000, so a lot of the recovery happened before the signal appeared.
That is important because moving averages are lagging indicators. They confirm that momentum has improved, but they do not predict the next move by themselves.
There is another reason I am staying cautious. Bitcoin briefly confirmed the Golden Cross this week, but the 50-day EMA slipped back below the 200-day EMA on Friday as BTC pulled toward $77,000. At the same time, markets have become more worried about a possible Fed rate hike, which is putting pressure on risk assets.
For me, the real confirmation is not the Golden Cross itself.
I want to see Bitcoin reclaim and hold the $80,000 to $82,000 area, while the moving averages continue separating and macro pressure starts easing.
The setup is definitely interesting. But I would rather let Bitcoin prove the reversal than turn one bullish crossover into a guaranteed bull market.
#BTC走势分析
The reason this one matters is the 2023 comparison. Back then, Bitcoin formed a Golden Cross in February 2023 after the 2022 bear market had already done most of its damage. BTC was around $23,000 at the time, and that crossover was followed by a much stronger recovery. Historical data shows the February 2023 cross was eventually followed by substantial upside.
But here is where I would slow down.
Bitcoin is not entering this Golden Cross from the same starting point. BTC has already rallied from around $59,000 to above $80,000, so a lot of the recovery happened before the signal appeared.
That is important because moving averages are lagging indicators. They confirm that momentum has improved, but they do not predict the next move by themselves.
There is another reason I am staying cautious. Bitcoin briefly confirmed the Golden Cross this week, but the 50-day EMA slipped back below the 200-day EMA on Friday as BTC pulled toward $77,000. At the same time, markets have become more worried about a possible Fed rate hike, which is putting pressure on risk assets.
For me, the real confirmation is not the Golden Cross itself.
I want to see Bitcoin reclaim and hold the $80,000 to $82,000 area, while the moving averages continue separating and macro pressure starts easing.
The setup is definitely interesting. But I would rather let Bitcoin prove the reversal than turn one bullish crossover into a guaranteed bull market.
#BTC走势分析
41
43
14.1k
Log in to explore more content
Join global crypto users on Binance Square
⚡️ Get latest and useful information about crypto.
💬 Trusted by the world’s largest crypto exchange.
👍 Discover real insights from verified creators.
Email / Phone number
Trending Topics
BitcoinClears$85200
7,593 views
184 Discussing
We got the move, and $BTC is standing exactly where we were before the data. That’s what actual patience for a trade looks like.
The data came in mixed but with some important numbers. ADP Non-Farm Employment Change came at 90K vs 73K forecast, while Core PCE came in at 0.2% vs 0.3% expected. Final GDP was also stronger at 2.2% vs 1.5% forecast, while Personal Spending came in at 0.9% vs 0.8% expected. At the same time, Personal Income missed at 0.2% vs 0.5% forecast.
BTC initially surged to $85,600 and is now back where it needs to be. I’m still looking toward the lower ranges at $82,759 and the $80,000 liquidity, because the overhead liquidity is done and dusted.
We had a live session during the data, and during that session we saw the market at $83,800, then $85,600, and then back toward $83,000 and we still didn’t enter a trade.
That’s what patience is.
We can’t force an entry when the market has no clear direction. The same range is still in focus, and we’ll wait for the market to give us the setup.
Let me know, guys, how was the session? And should we have more regular sessions with our respected members so we can have proper discussions regarding the market?
#BitcoinClears$85200 #AltcoinSeasonIndexHoldsAbove60For5Days #USADPAdds90000JobsInSeptember #BitcoinSlipsBelow$84000 #SECToClarifyOnChainFundraisingRules
Crypto_LUX
·24 Likes
·14.2k views
AltcoinSeasonIndexHoldsAbove60For5Days
40,484 views
999 Discussing
USADPAdds90000JobsInSeptember
18,409 views
568 Discussing