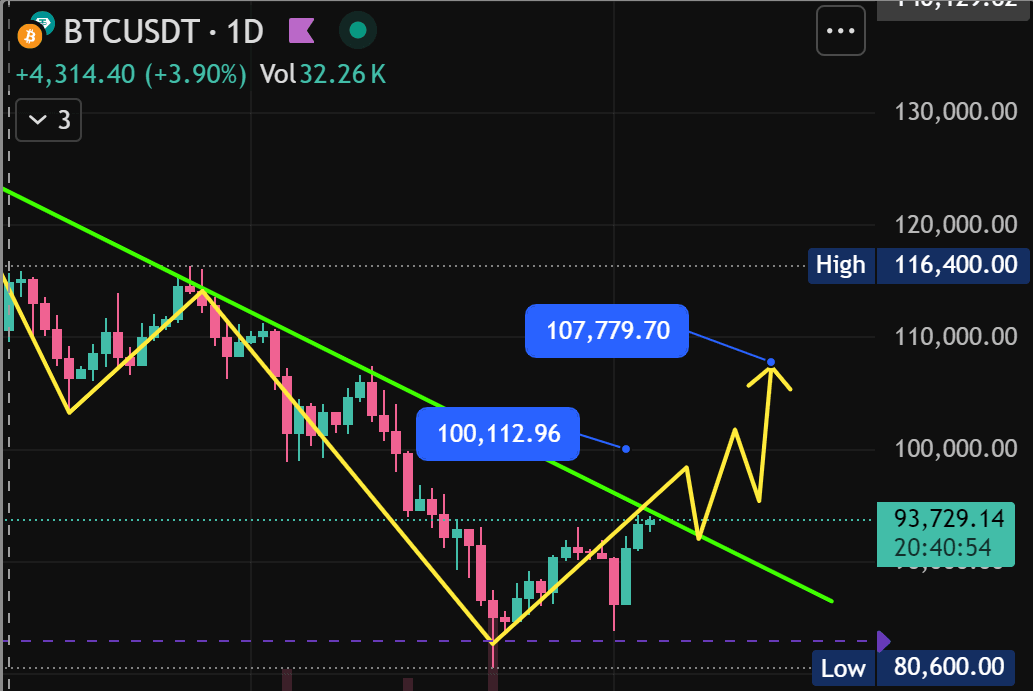
$BTC has nearly broken the downtrend line that has lasted for many weeks, creating a reversal pattern with higher lows. This is a strong signal indicating that selling pressure has diminished and the market is beginning to shift into an accelerating phase.
Right after the breakout, $BTC aiming for the first target area around $100K – which is also the retest point of the previous down structure. If it continues to maintain momentum, the $107.5K area will be the next target before hitting the High area of $116K.
The important thing: the price model is creating a rise – correction – rise, indicating that smart money is returning to the market.
If BTC can stay above the trendline it just broke, the chances of a strong breakout are very high.
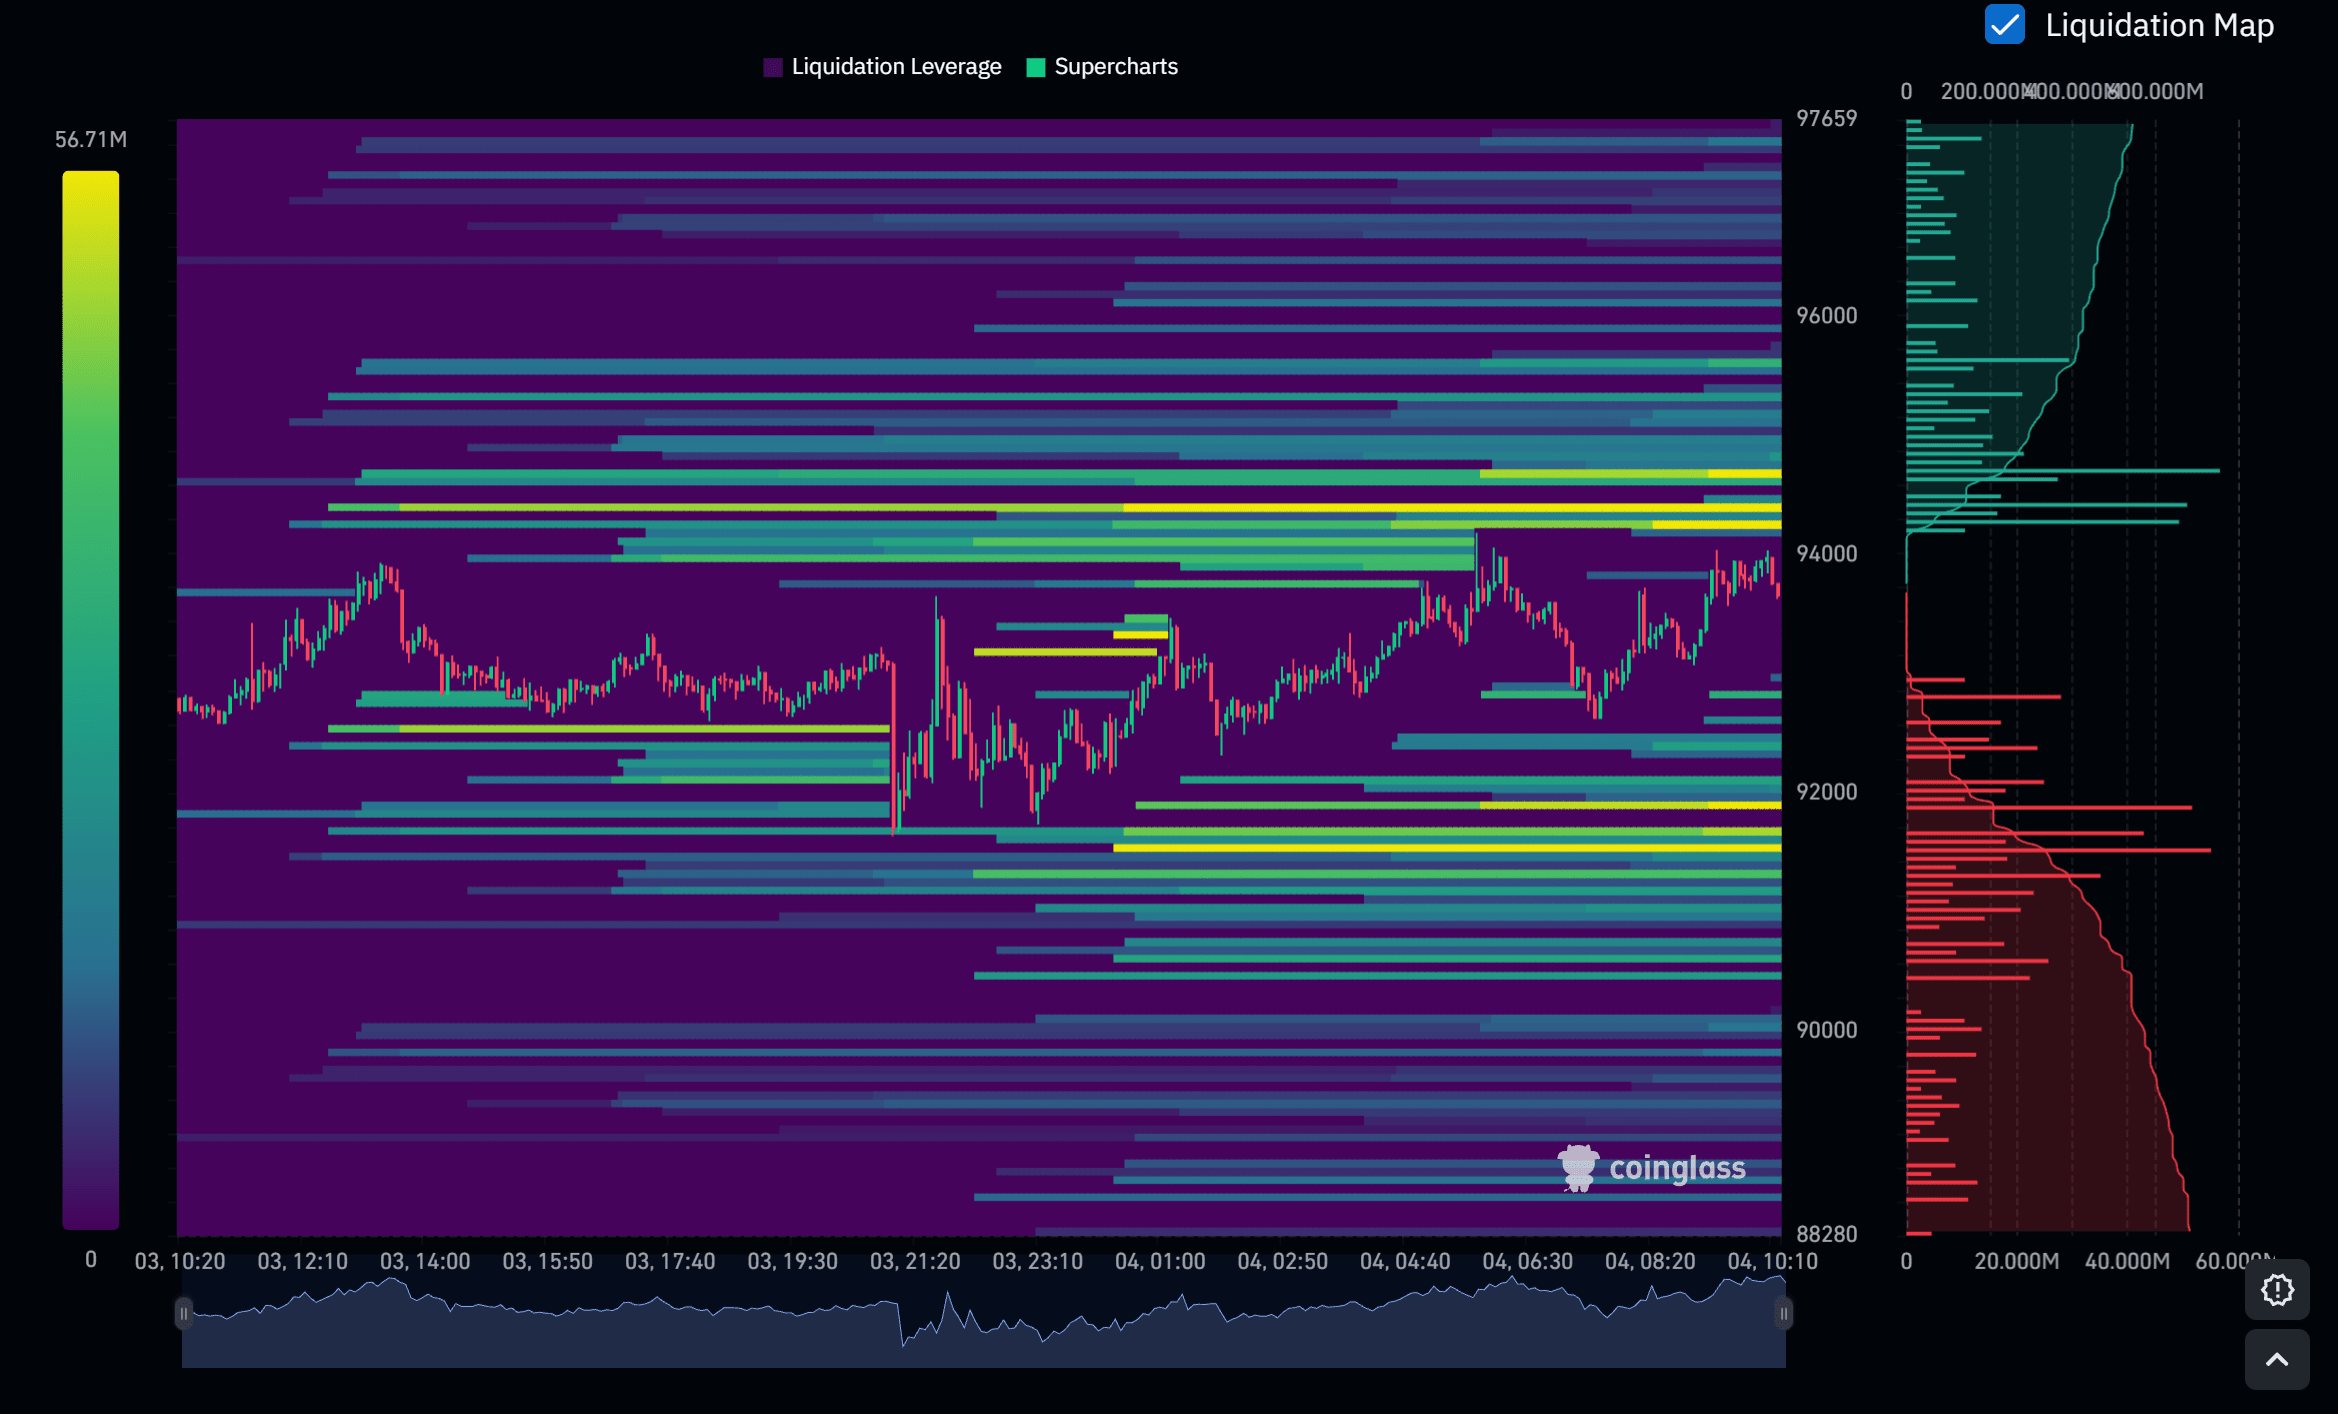
However, to manage risk, I have a tip I want to share with you, which is to always check the liquidation heat map of BTC at Coinglass. It will give you an insight into which price areas are likely to be targeted. The brighter areas with horizontal yellow lines indicate thick liquidity, a juicy bait for market makers to hunt.
Brothers, what do you predict: Is BTC about to make a big move or is it just a bounce?
👉 $BTC still remains a coin worth holding for the long term.
#BTC #bitcoin #crypto #Price-Prediction #bullish