
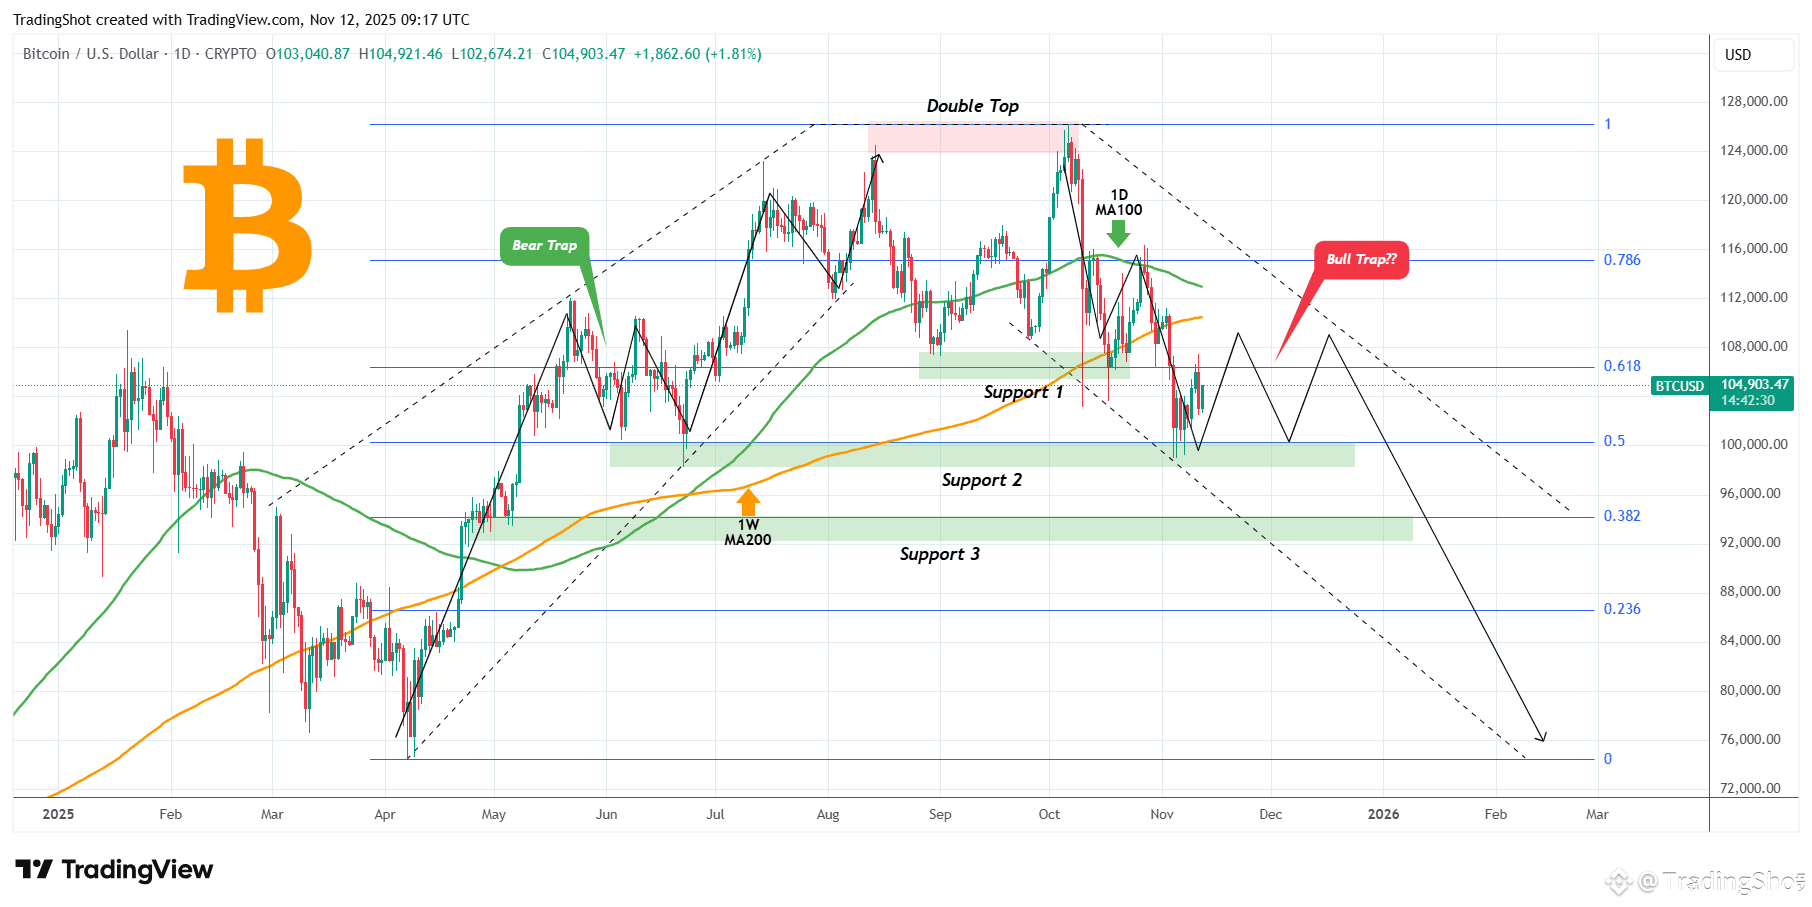
Bitcoin (BTCUSD) recently broke below the $100000 level for the first time since June and is currently on a short rebound. It has turned however all major MAs both the 1D MA100 (green trend-line) and 1D MA200 (orange trend-line) into Resistances, so the downtrend remains.
By doing so, we can see a highly symmetric pattern emerging, the inverse of the April - August uptrend. Following the (nearly) October 06 Double Top, the symmetrical downtrend has been testing and respecting all subsequent Support levels (so far Support 1 and 2), filling at the same time all Fibonacci gaps. See how accurately those Fibs formed key demand levels during the uptrend.
As a result, if this symmetry continues to hold, we can expect BTC to trade sideways for another month between Support 2 (Fib 0.5) and $110000 (roughly) before making the next leg down. Such price behavior typically confuses market participants and traps traders who stick to the former trend and haven't adapted yet.
Please LIKE 👍, FOLLOW ✅, SHARE 🙌 and COMMENT ✍ if you enjoy this idea!
