
#trx
trx
11.7M views
34,542 Discussing
Hot
Latest

·
--
Bearish
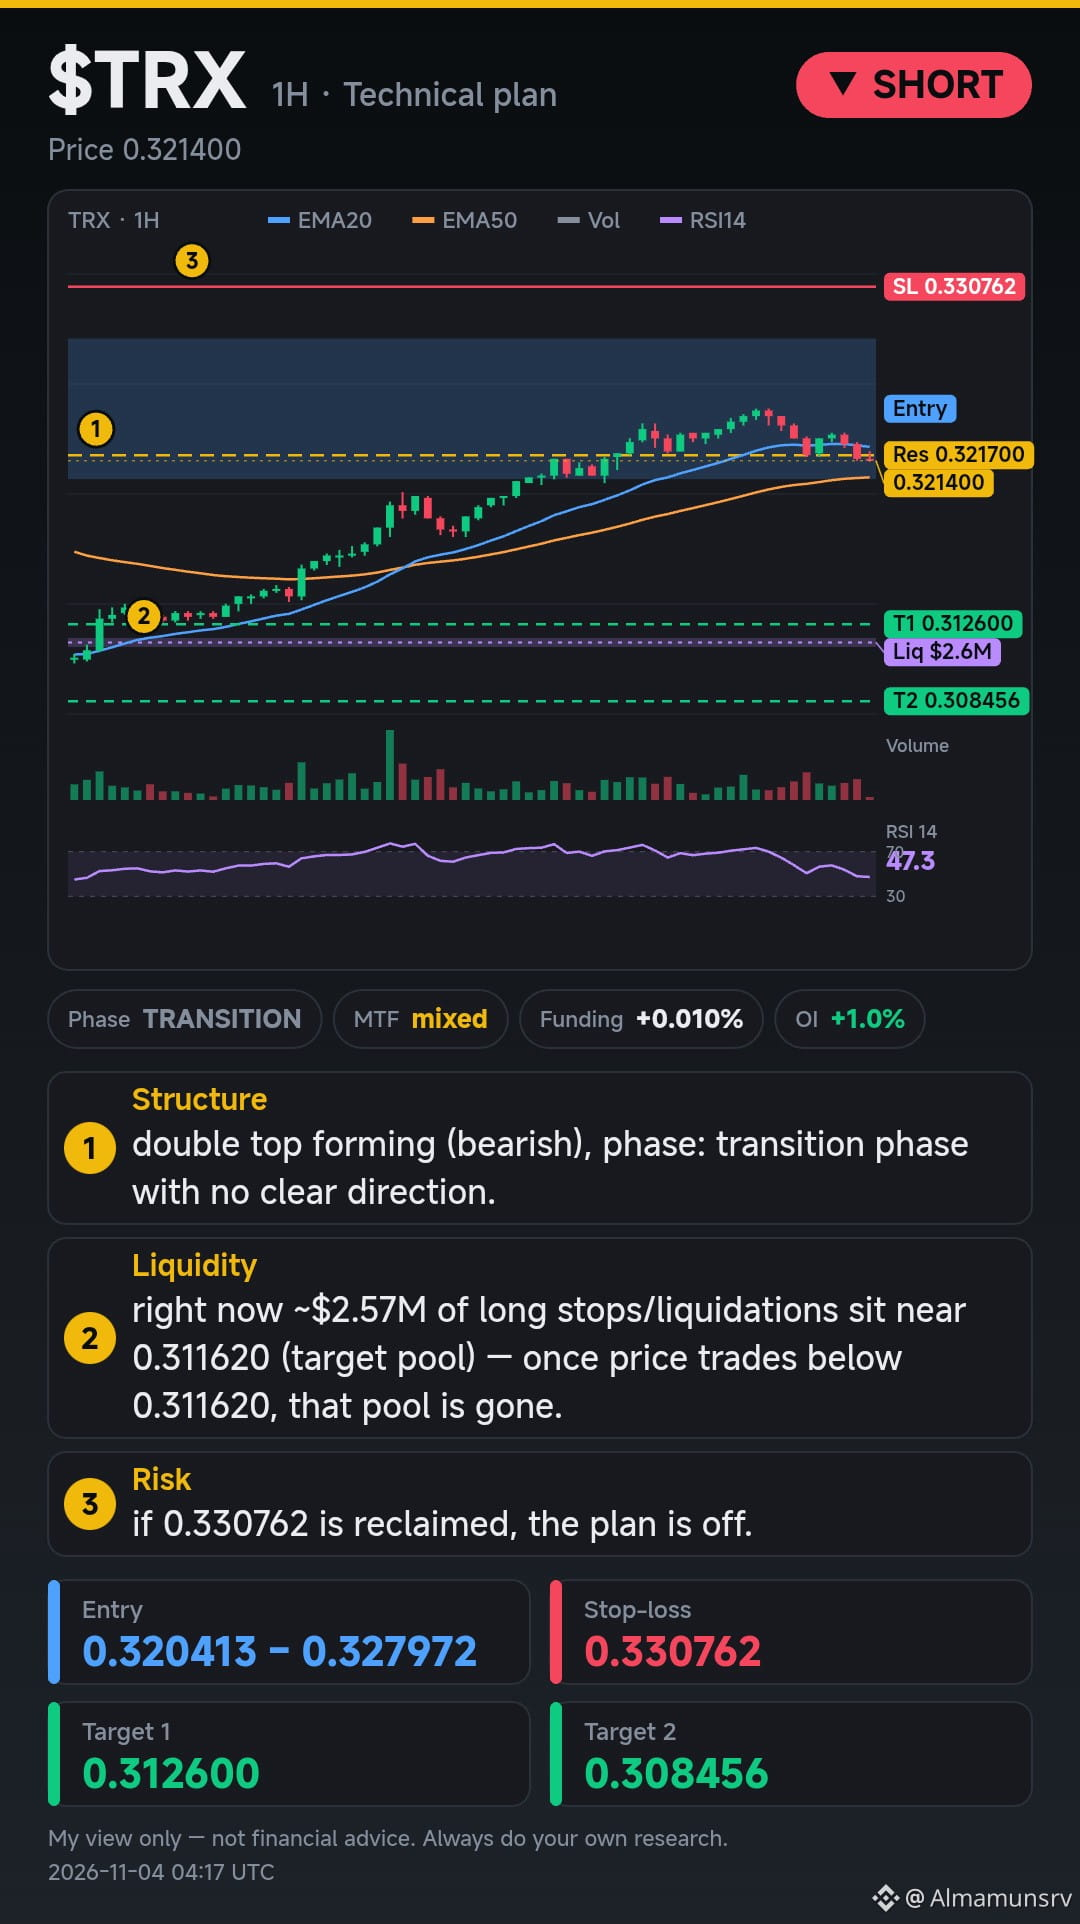
$TRX 1H — SHORT 🔻 plan
1) Structure: double top forming (bearish), phase: transition phase with no clear direction.
2) Liquidity: right now ~$2.57M of long stops/liquidations sit near 0.311620 (target pool) — once price trades below 0.311620, that pool is gone.
3) Risk: if 0.330762 is reclaimed, the plan is off.
📍 Entry: 0.320413 – 0.327972
🎯 Target 1: 0.312600
🎯 Target 2: 0.308456
🛑 Stop-loss: 0.330762
DYOR. #TRX
{future}(TRXUSDT)
$TRX 1H — SHORT 🔻 plan
1) Structure: double top forming (bearish), phase: transition phase with no clear direction.
2) Liquidity: right now ~$2.57M of long stops/liquidations sit near 0.311620 (target pool) — once price trades below 0.311620, that pool is gone.
3) Risk: if 0.330762 is reclaimed, the plan is off.
📍 Entry: 0.320413 – 0.327972
🎯 Target 1: 0.312600
🎯 Target 2: 0.308456
🛑 Stop-loss: 0.330762
DYOR. #TRX
1) Structure: double top forming (bearish), phase: transition phase with no clear direction.
2) Liquidity: right now ~$2.57M of long stops/liquidations sit near 0.311620 (target pool) — once price trades below 0.311620, that pool is gone.
3) Risk: if 0.330762 is reclaimed, the plan is off.
📍 Entry: 0.320413 – 0.327972
🎯 Target 1: 0.312600
🎯 Target 2: 0.308456
🛑 Stop-loss: 0.330762
DYOR. #TRX
76

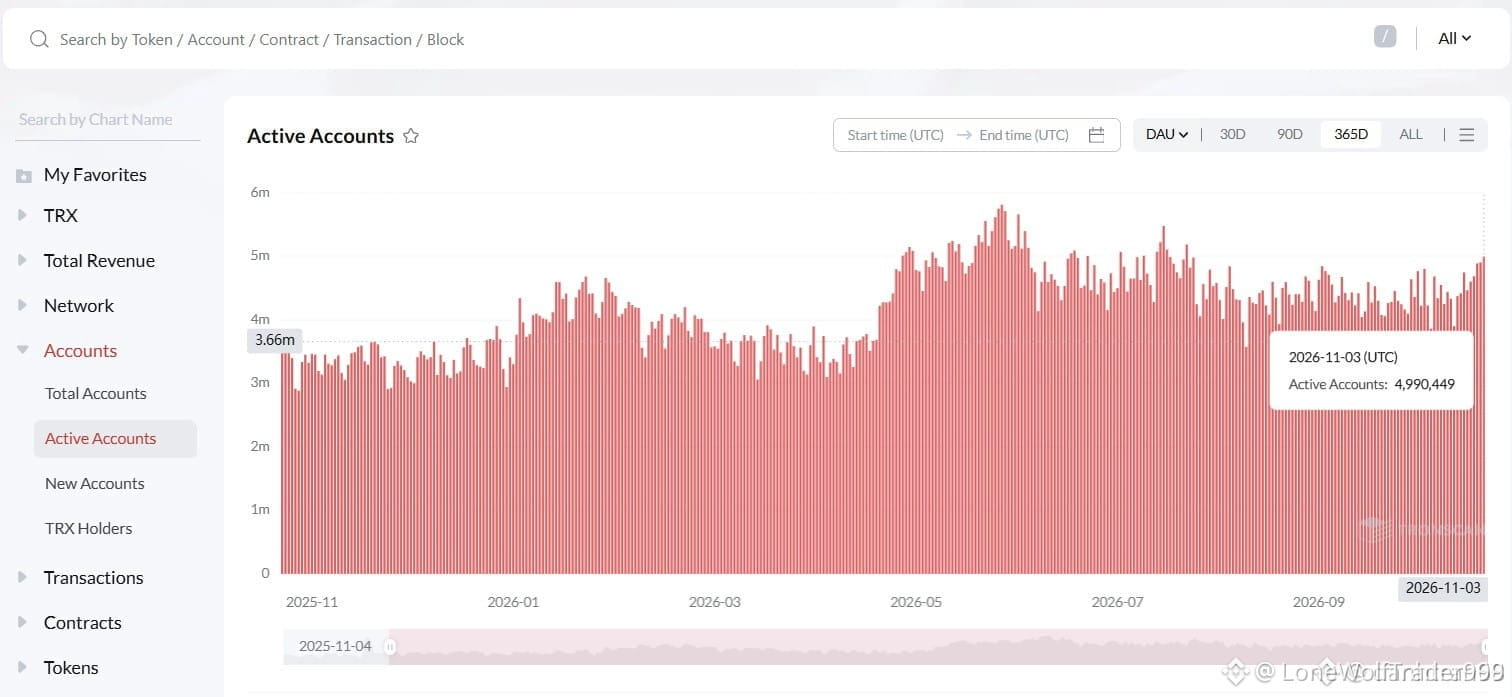
🚀 $TRX SMASHES 5M ACTIVE ACCOUNTS MILESTONE! 🟢
TRON’s daily active accounts just cracked the 5‑million mark, sitting at 4,990,449 on 03/11/2026 – the strongest count since August. 📊
That surge signals fresh user inflow on a chain that already dominates stable‑coin traffic, hinting that smart‑money whales may be loading up ahead of the next USDT swing. 🦈⚡
Liquidity on the network is tightening, giving price action room to break higher. 📈
💬 Are you ready to ride the next wave of TRX demand? 👇
⚠️ Not financial advice. Always manage your risk. 🛡️
🏷️ #TRX #ActiveAccounts #Bullish #Crypto
🔥 💎
🚀 $TRX SMASHES 5M ACTIVE ACCOUNTS MILESTONE! 🟢
TRON’s daily active accounts just cracked the 5‑million mark, sitting at 4,990,449 on 03/11/2026 – the strongest count since August. 📊
That surge signals fresh user inflow on a chain that already dominates stable‑coin traffic, hinting that smart‑money whales may be loading up ahead of the next USDT swing. 🦈⚡
Liquidity on the network is tightening, giving price action room to break higher. 📈
💬 Are you ready to ride the next wave of TRX demand? 👇
⚠️ Not financial advice. Always manage your risk. 🛡️
🏷️ #TRX #ActiveAccounts #Bullish #Crypto
🔥 💎
TRON’s daily active accounts just cracked the 5‑million mark, sitting at 4,990,449 on 03/11/2026 – the strongest count since August. 📊
That surge signals fresh user inflow on a chain that already dominates stable‑coin traffic, hinting that smart‑money whales may be loading up ahead of the next USDT swing. 🦈⚡
Liquidity on the network is tightening, giving price action room to break higher. 📈
💬 Are you ready to ride the next wave of TRX demand? 👇
⚠️ Not financial advice. Always manage your risk. 🛡️
🏷️ #TRX #ActiveAccounts #Bullish #Crypto
🔥 💎

·
--
Most people who want to buy on a schedule should use Auto-Invest, not the Spot DCA bot or a script.
Pick $TRX, set 10 USDT weekly (example values) and tick Use Simple Earn Flexible Balance so a thin Spot wallet doesn't fail a buy. The fee per buy shows under History > Subscription. It goes wrong on a coin you wouldn't hold through a bad year, since a schedule buys every dip without asking why 📉
Fair point for tinkerers: a Python script on the Binance API can skip a $TRX buy when price runs far above its 200-day average. Switch off withdrawals on that key and restrict it to your IP.
Which coin would you hold long enough to let a schedule buy it?
#AutomateYourCrypto #TRX #AutoInvest #DCA
Most people who want to buy on a schedule should use Auto-Invest, not the Spot DCA bot or a script.
Pick $TRX , set 10 USDT weekly (example values) and tick Use Simple Earn Flexible Balance so a thin Spot wallet doesn't fail a buy. The fee per buy shows under History > Subscription. It goes wrong on a coin you wouldn't hold through a bad year, since a schedule buys every dip without asking why 📉
Fair point for tinkerers: a Python script on the Binance API can skip a $TRX buy when price runs far above its 200-day average. Switch off withdrawals on that key and restrict it to your IP.
Which coin would you hold long enough to let a schedule buy it?
#AutomateYourCrypto #TRX #AutoInvest #DCA
Pick $TRX , set 10 USDT weekly (example values) and tick Use Simple Earn Flexible Balance so a thin Spot wallet doesn't fail a buy. The fee per buy shows under History > Subscription. It goes wrong on a coin you wouldn't hold through a bad year, since a schedule buys every dip without asking why 📉
Fair point for tinkerers: a Python script on the Binance API can skip a $TRX buy when price runs far above its 200-day average. Switch off withdrawals on that key and restrict it to your IP.
Which coin would you hold long enough to let a schedule buy it?
#AutomateYourCrypto #TRX #AutoInvest #DCA
26

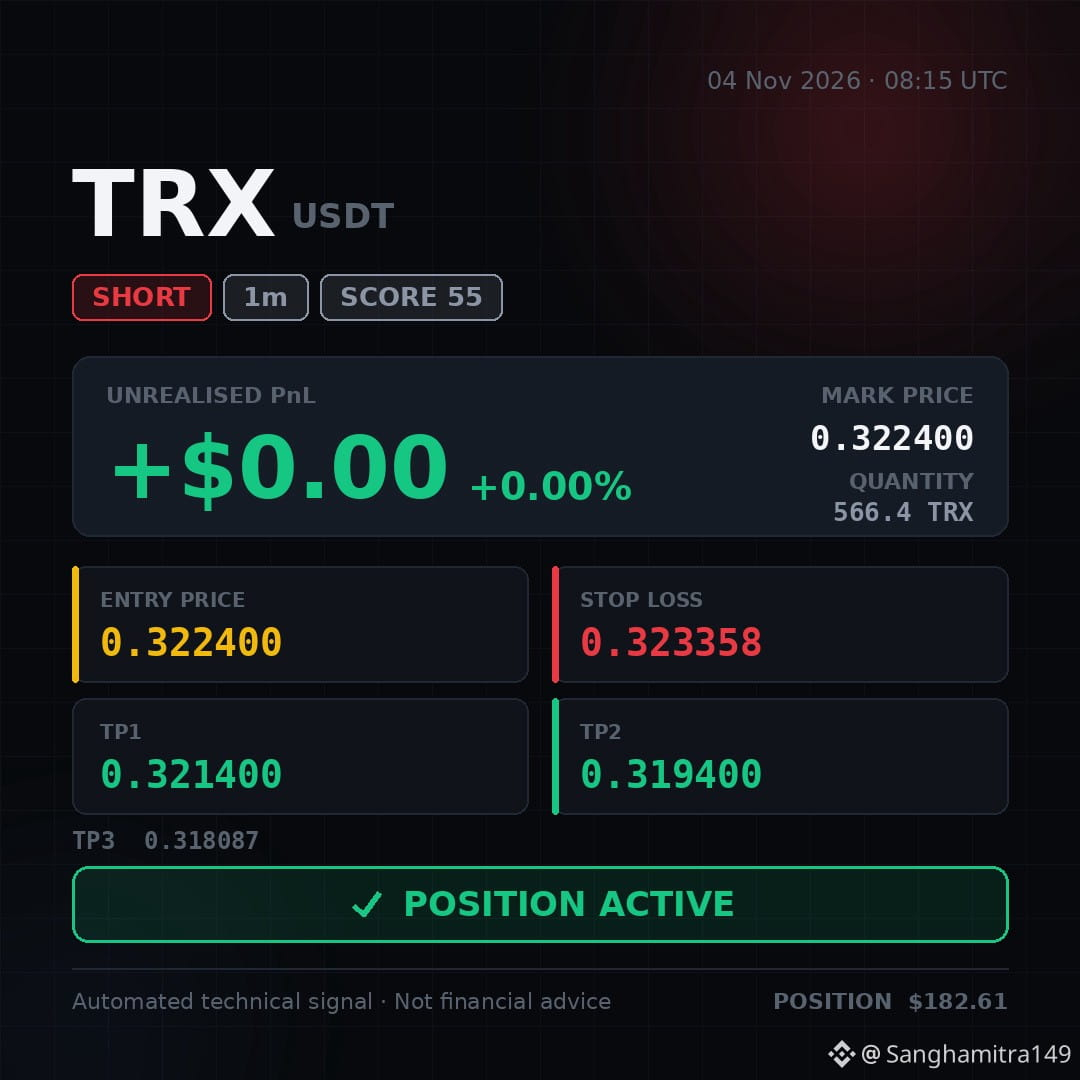
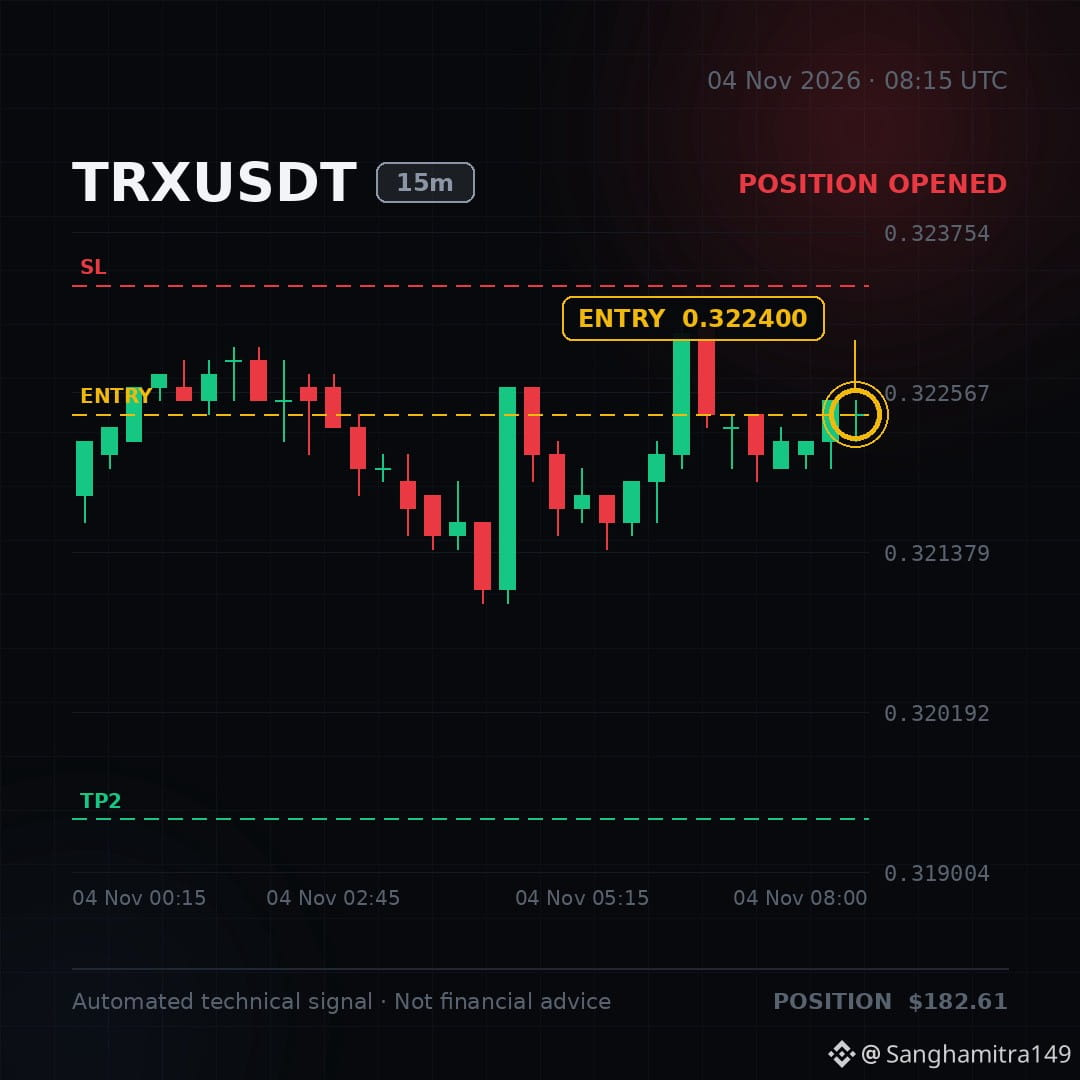
✅ POSITION ACTIVE — I've taken this short. Running at +0.00%.
🚨 #TRX Liquidity Sweep Ignites Massive Short Wave! 🤯⚡
I'm riding this short right now $TRX 👇
Short..... Sweep..... Hold tight..... Ride the swing.....‼️‼️‼️
Entry: 0.3224 – 0.3228
Stop-loss: 0.3234
🟢 TP1: 0.3214
🟢 TP2: 0.3194
🟢 TP3: 0.3181
Join me, trade the move now 👇⬇️⬇️ Short.. With meee...👇⬇️ $TRX
✅ POSITION ACTIVE — I've taken this short. Running at +0.00%.
🚨 #TRX Liquidity Sweep Ignites Massive Short Wave! 🤯⚡
I'm riding this short right now $TRX 👇
Short..... Sweep..... Hold tight..... Ride the swing.....‼️‼️‼️
Entry: 0.3224 – 0.3228
Stop-loss: 0.3234
🟢 TP1: 0.3214
🟢 TP2: 0.3194
🟢 TP3: 0.3181
Join me, trade the move now 👇⬇️⬇️ Short.. With meee...👇⬇️ $TRX
🚨 #TRX Liquidity Sweep Ignites Massive Short Wave! 🤯⚡
I'm riding this short right now $TRX 👇
Short..... Sweep..... Hold tight..... Ride the swing.....‼️‼️‼️
Entry: 0.3224 – 0.3228
Stop-loss: 0.3234
🟢 TP1: 0.3214
🟢 TP2: 0.3194
🟢 TP3: 0.3181
Join me, trade the move now 👇⬇️⬇️ Short.. With meee...👇⬇️ $TRX

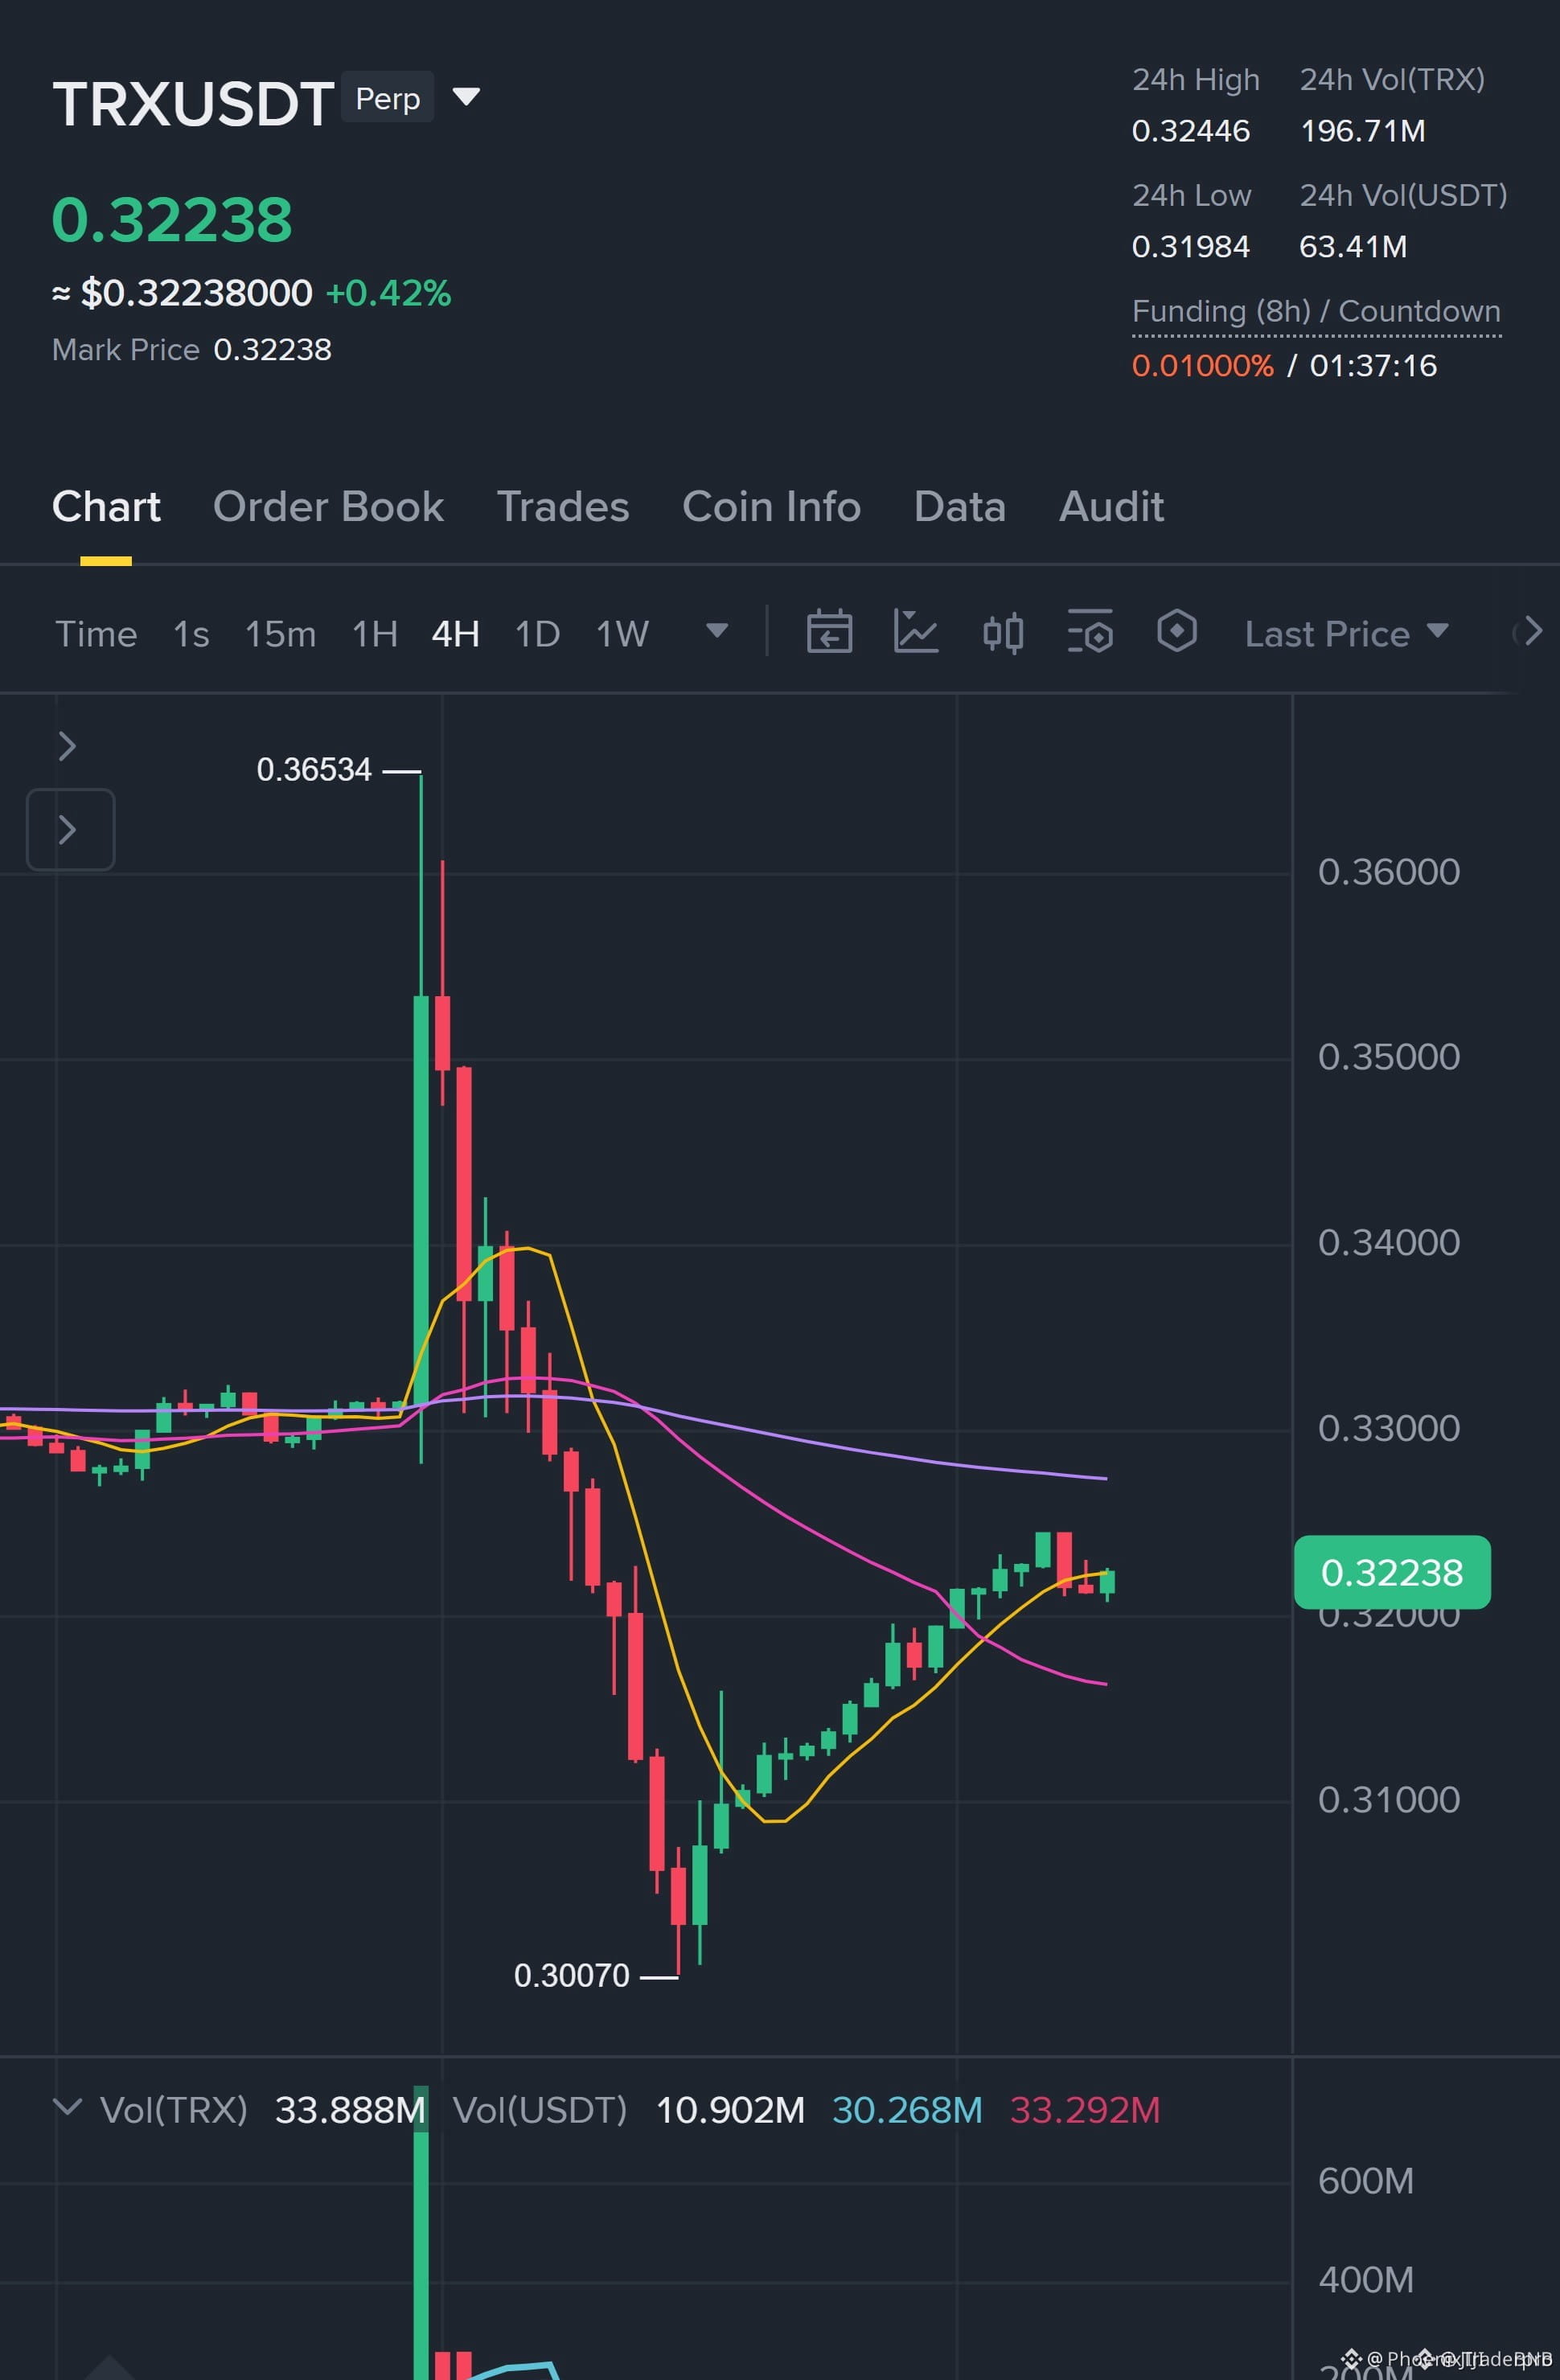
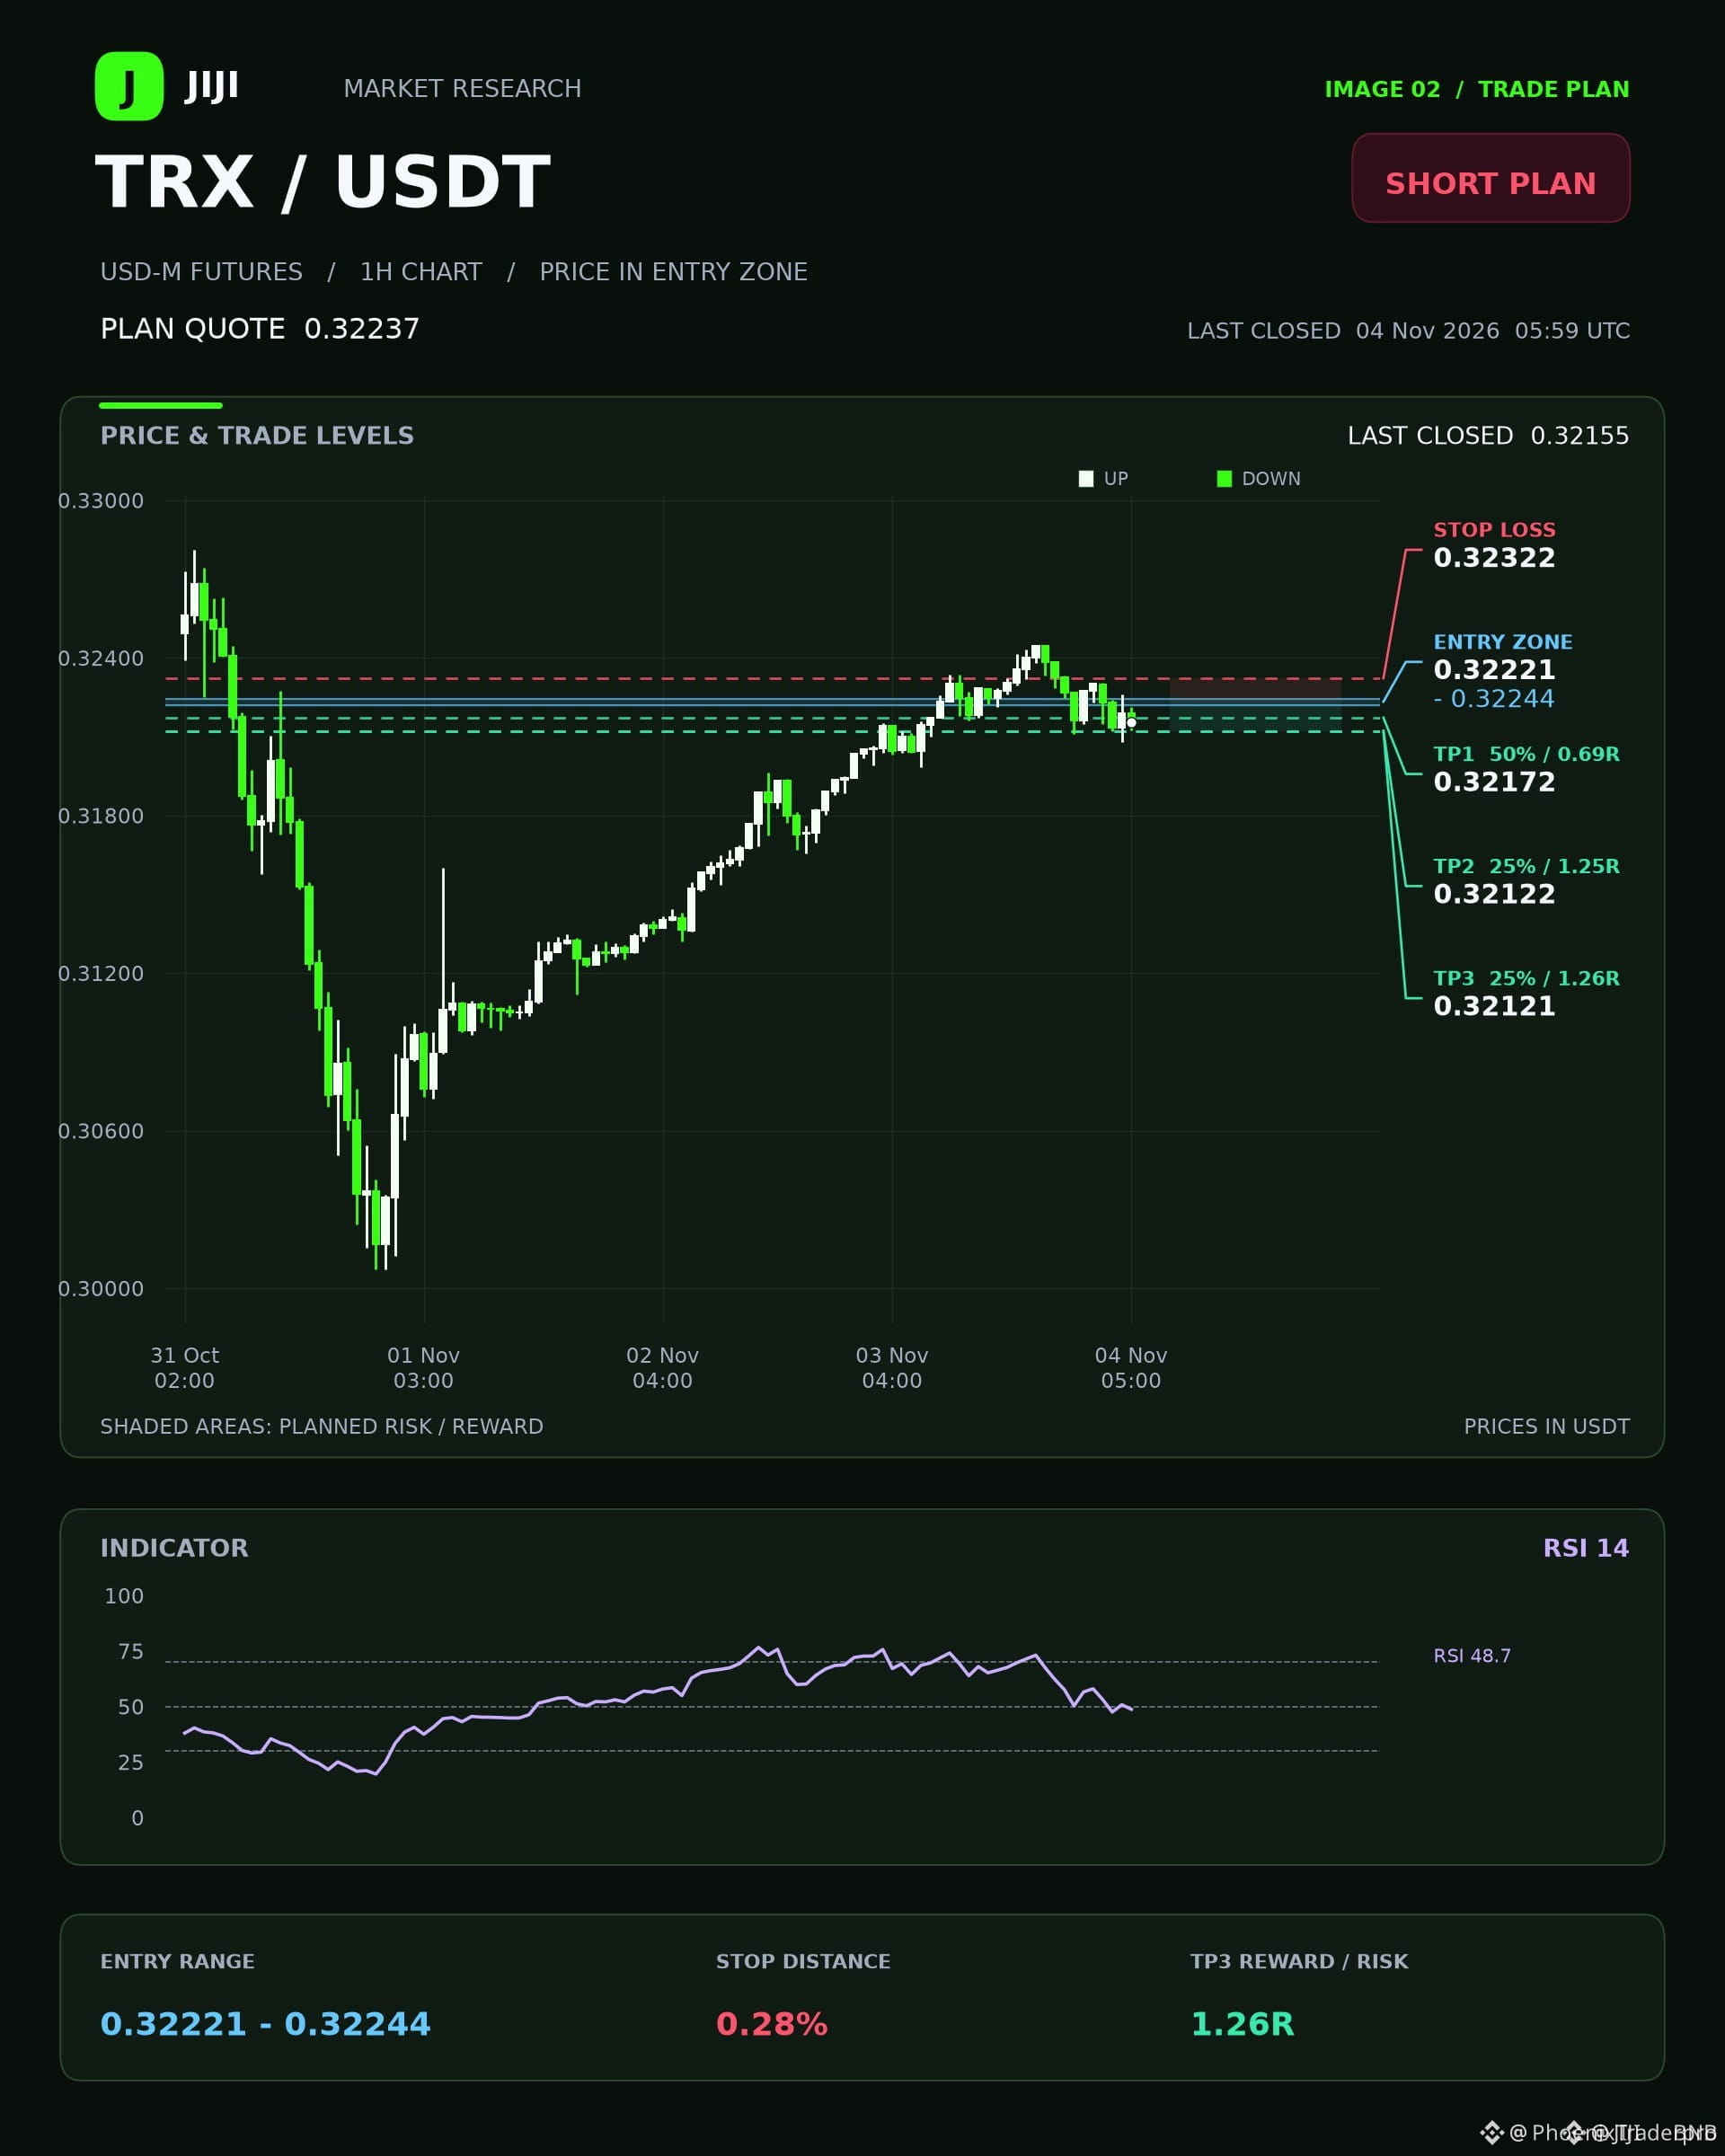
🔴 $TRX SHORT ALERT: EMA STACK SQUEEZE SET TO CRUSH BELOW 0.322! 📈
Entry: 0.32221 – 0.32244 ⚡
Target: 0.32172 🚀
Target: 0.32122 🚀
Target: 0.32121 🚀
Stop Loss: 0.32322 ⚠️
📊 The 4‑hour EMA50/200 are locked in a bearish stack while the 1‑hour shows mixed vibes; RSI hovers at 48.7, neutral ground. DI+ 17.6 vs DI‑ 22.7 and ADX 28.6 whisper a short‑leaning pressure from smart‑money sharks 🦈. ⚡ Entry zone just hit, but the reward is razor‑thin after fees.
📌 Keep an eye on the 1‑hour support at 0.32161 – a potential roadblock that could stall the cascade toward deeper targets. 💡 Are you ready to ride the short wave or waiting for a cleaner breakout? 🤔
⚠️ Not financial advice. Always manage your risk. 🛡️
🏷️ #TRX #ShortSetup #EMAStack #Crypto
🦈 🔥
🔴 $TRX SHORT ALERT: EMA STACK SQUEEZE SET TO CRUSH BELOW 0.322! 📈
Entry: 0.32221 – 0.32244 ⚡
Target: 0.32172 🚀
Target: 0.32122 🚀
Target: 0.32121 🚀
Stop Loss: 0.32322 ⚠️
📊 The 4‑hour EMA50/200 are locked in a bearish stack while the 1‑hour shows mixed vibes; RSI hovers at 48.7, neutral ground. DI+ 17.6 vs DI‑ 22.7 and ADX 28.6 whisper a short‑leaning pressure from smart‑money sharks 🦈. ⚡ Entry zone just hit, but the reward is razor‑thin after fees.
📌 Keep an eye on the 1‑hour support at 0.32161 – a potential roadblock that could stall the cascade toward deeper targets. 💡 Are you ready to ride the short wave or waiting for a cleaner breakout? 🤔
⚠️ Not financial advice. Always manage your risk. 🛡️
🏷️ #TRX #ShortSetup #EMAStack #Crypto
🦈 🔥
Entry: 0.32221 – 0.32244 ⚡
Target: 0.32172 🚀
Target: 0.32122 🚀
Target: 0.32121 🚀
Stop Loss: 0.32322 ⚠️
📊 The 4‑hour EMA50/200 are locked in a bearish stack while the 1‑hour shows mixed vibes; RSI hovers at 48.7, neutral ground. DI+ 17.6 vs DI‑ 22.7 and ADX 28.6 whisper a short‑leaning pressure from smart‑money sharks 🦈. ⚡ Entry zone just hit, but the reward is razor‑thin after fees.
📌 Keep an eye on the 1‑hour support at 0.32161 – a potential roadblock that could stall the cascade toward deeper targets. 💡 Are you ready to ride the short wave or waiting for a cleaner breakout? 🤔
⚠️ Not financial advice. Always manage your risk. 🛡️
🏷️ #TRX #ShortSetup #EMAStack #Crypto
🦈 🔥
1

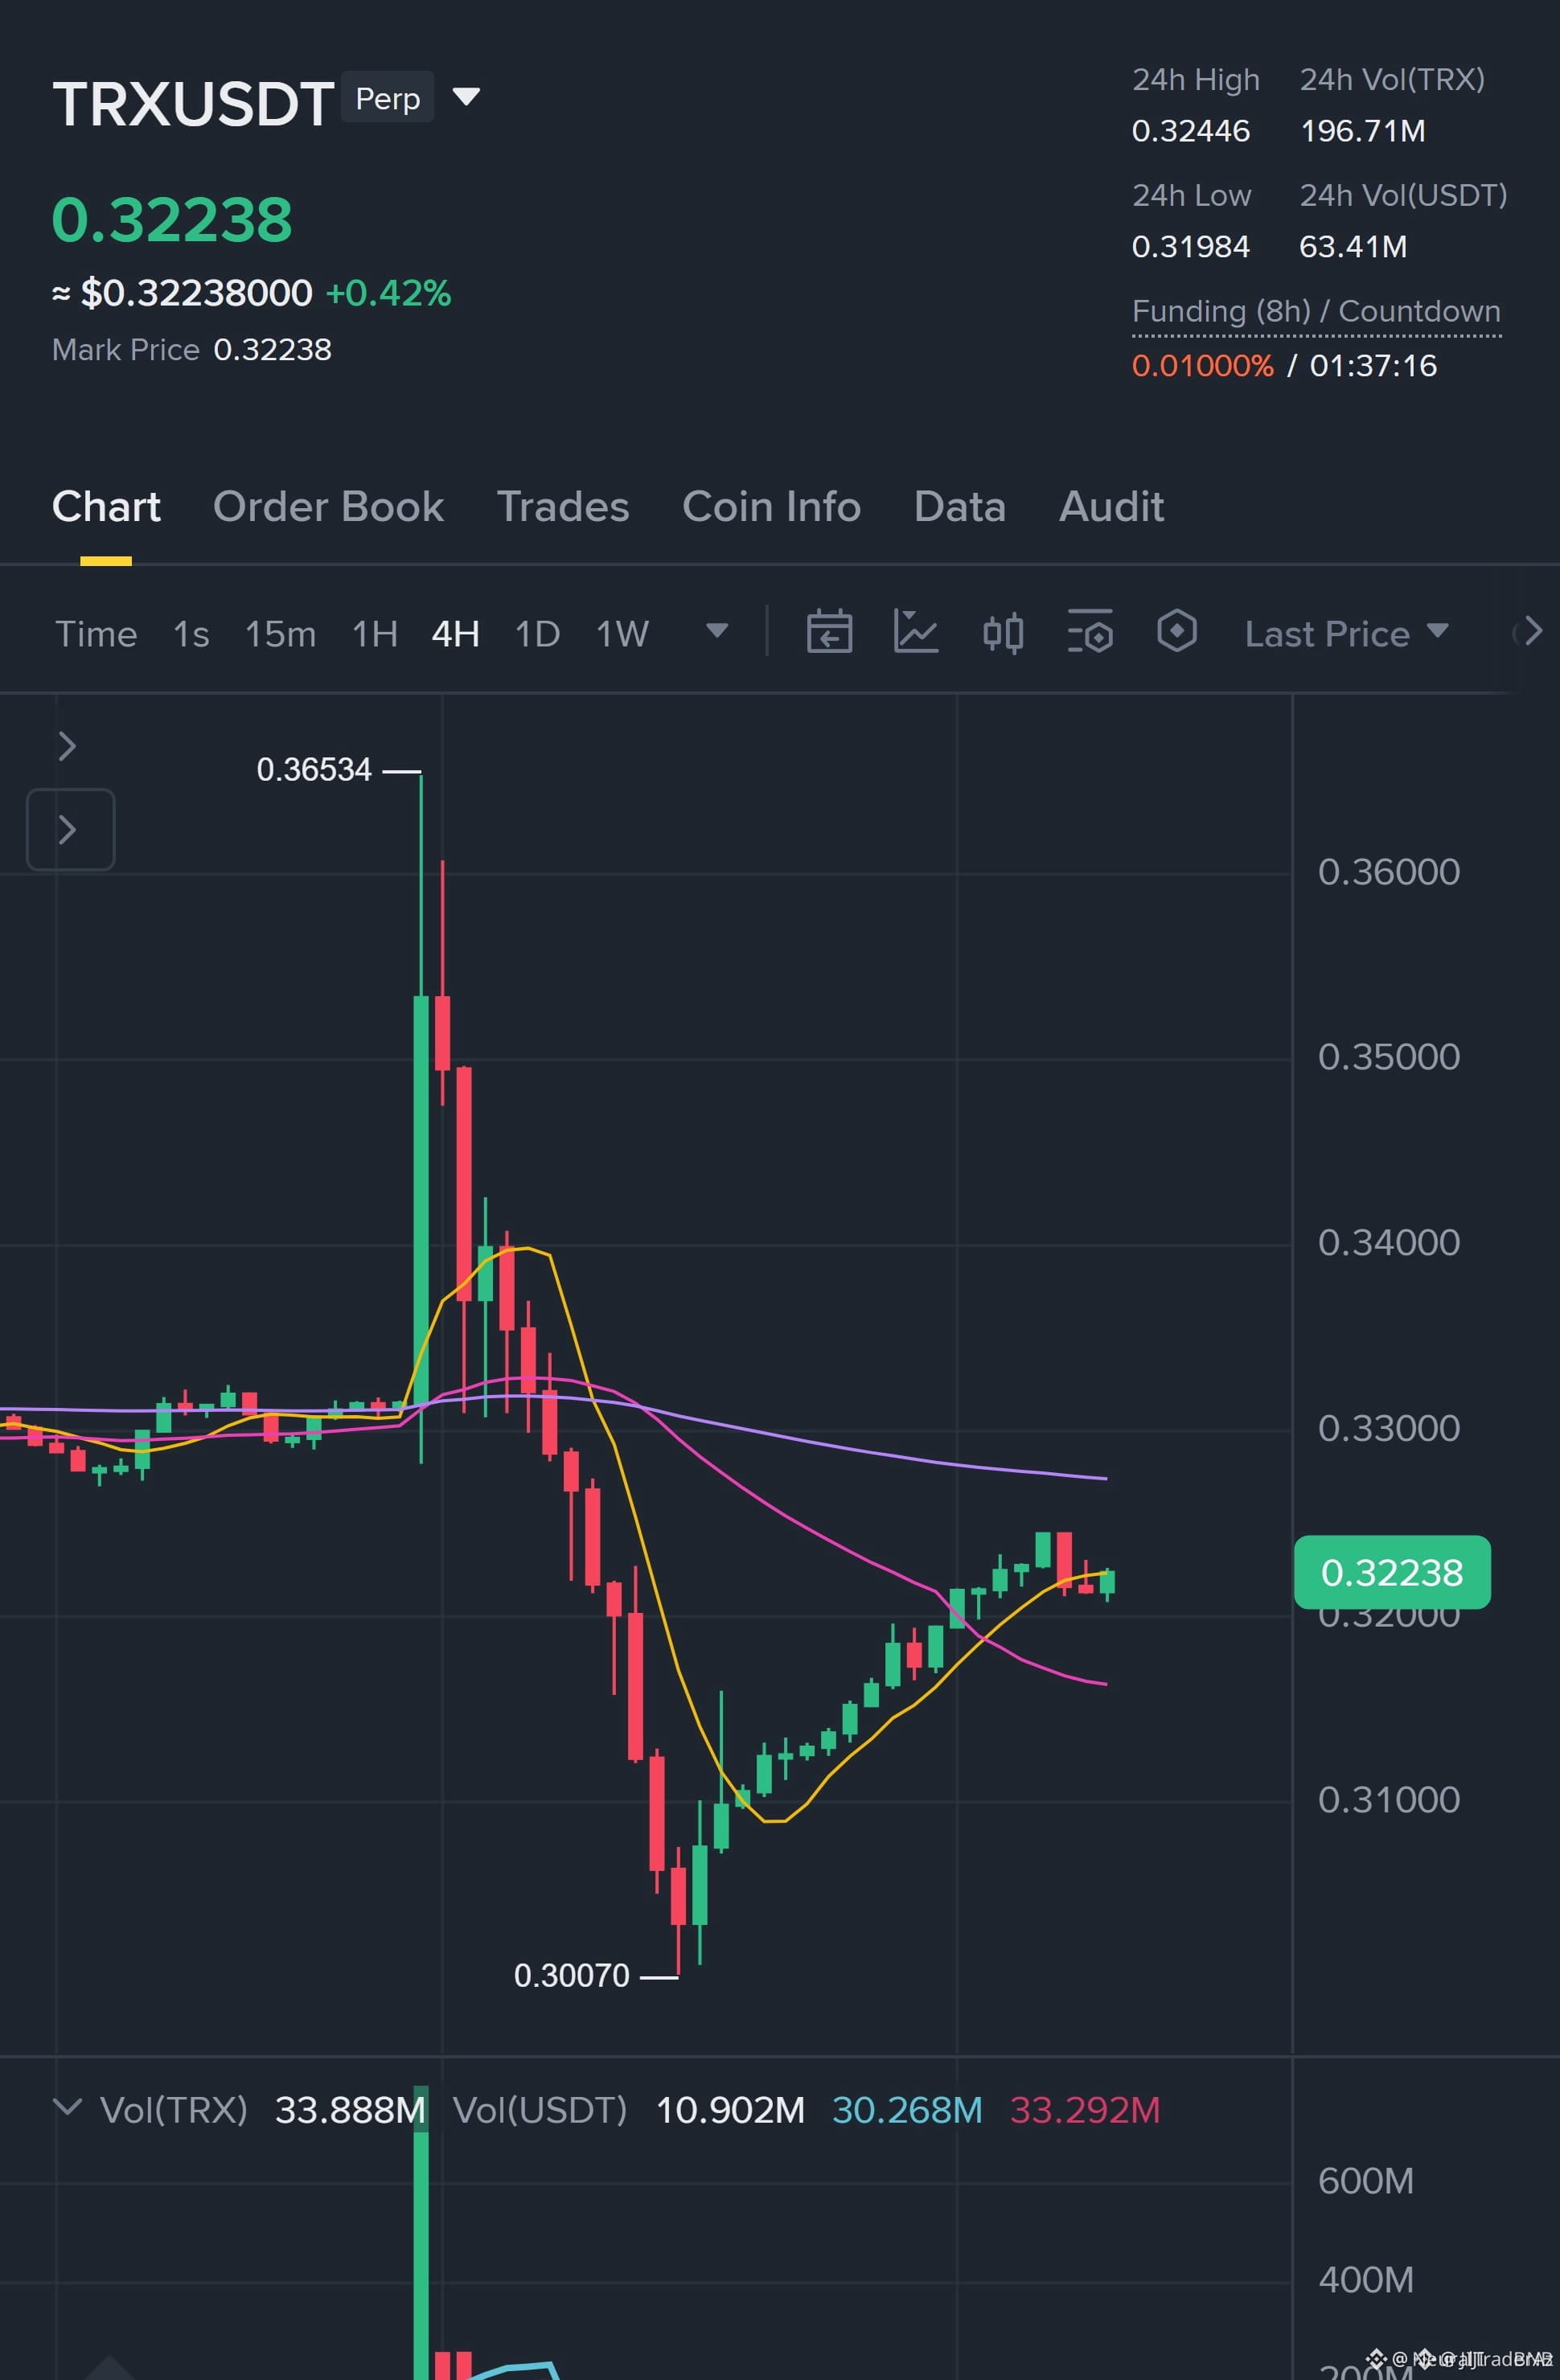
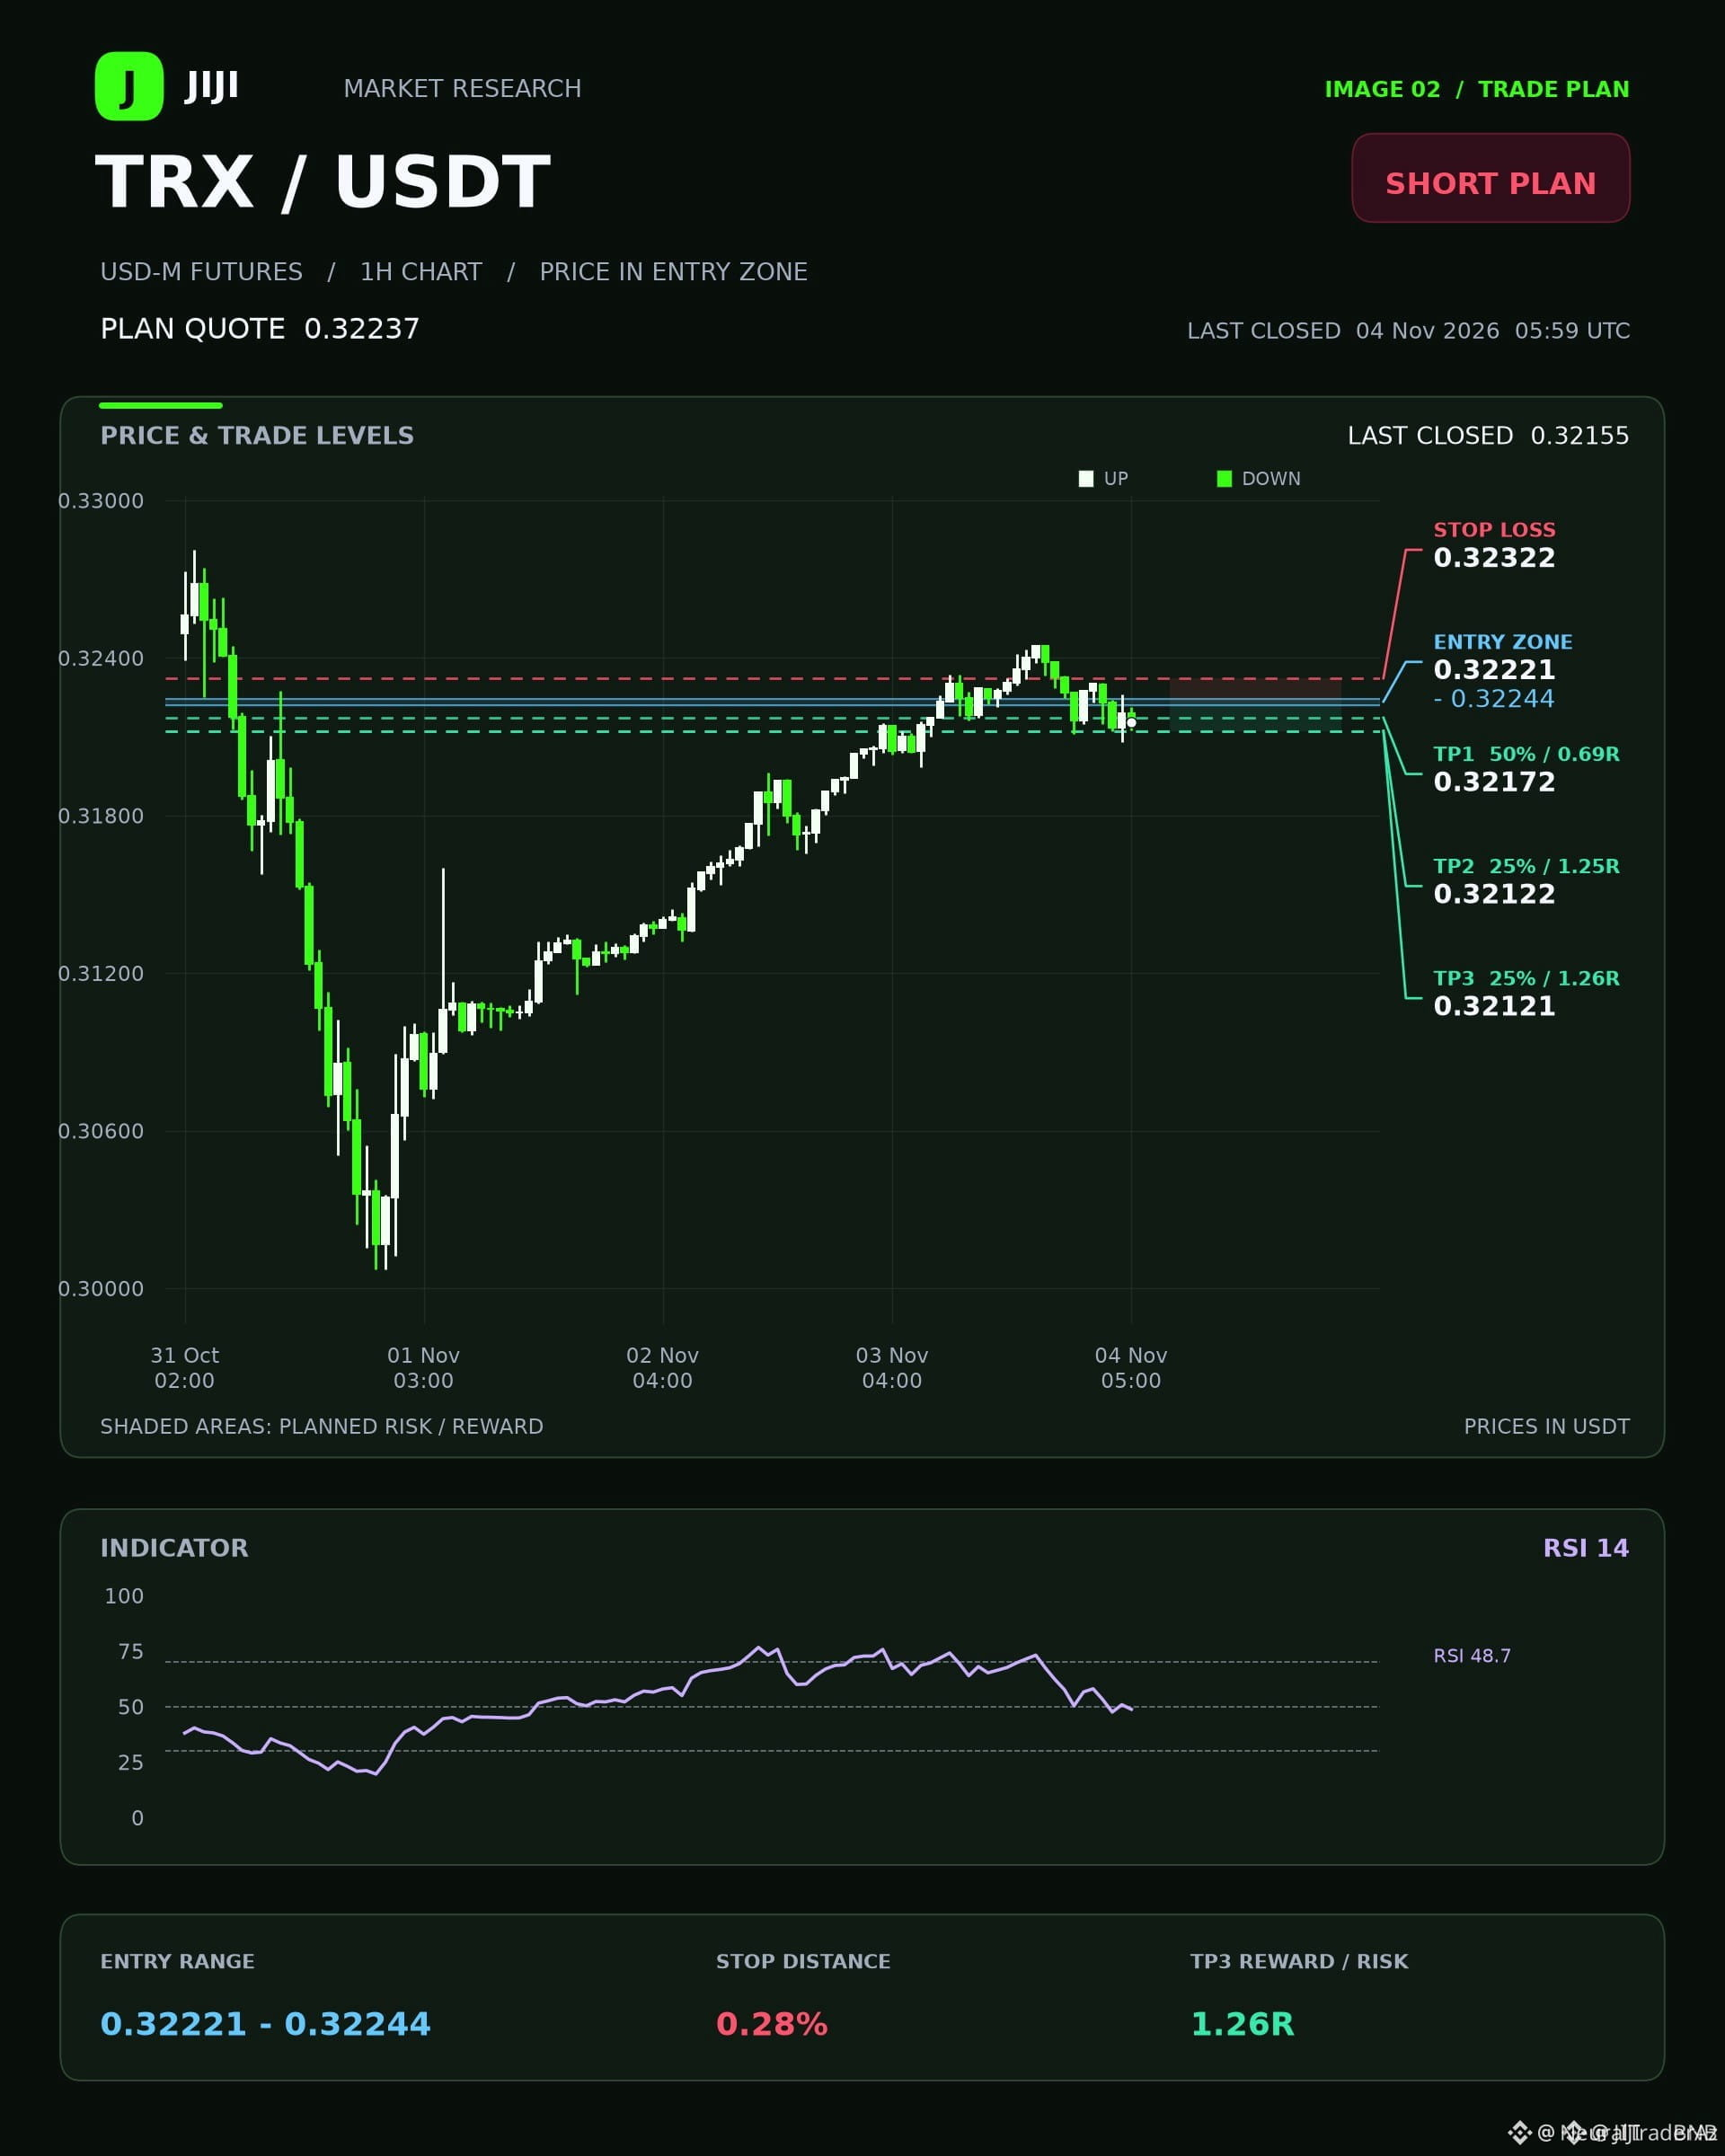
🔴 $TRX SHORT ZONE BREACH: QUICK PULL‑BACK OPPORTUNITY 🚨
Entry: 0.32221-0.32244 ⚡
Target: 0.32172 / 0.32122 / 0.32121 🚀
Stop Loss: 0.32322 ⚠️
📊 The 4H EMA50/200 stack is firmly bearish, while the 1H shows mixed sentiment, hinting that smart‑money liquidity is still being hunted. DI‑ values (DI+ 17.6 / DI‑ 22.7) and an ADX of 28.6 reinforce the short bias, and the RSI hovers at a neutral 48.7, leaving little upside for bulls. 🦈⚡
💡 Entry sits within a tight 15‑minute candle range; however, the immediate support at 0.32161 could absorb the move and truncate later targets. With a modest 0.03R reward after fees, risk management is paramount. 🤔 What’s your plan for the next swing if the support holds?
⚠️ Not financial advice. Always manage your risk. 🛡️
🏷️ #TRX #ShortSetup #Crypto #Futures
🦈 🔥
🔴 $TRX SHORT ZONE BREACH: QUICK PULL‑BACK OPPORTUNITY 🚨
Entry: 0.32221-0.32244 ⚡
Target: 0.32172 / 0.32122 / 0.32121 🚀
Stop Loss: 0.32322 ⚠️
📊 The 4H EMA50/200 stack is firmly bearish, while the 1H shows mixed sentiment, hinting that smart‑money liquidity is still being hunted. DI‑ values (DI+ 17.6 / DI‑ 22.7) and an ADX of 28.6 reinforce the short bias, and the RSI hovers at a neutral 48.7, leaving little upside for bulls. 🦈⚡
💡 Entry sits within a tight 15‑minute candle range; however, the immediate support at 0.32161 could absorb the move and truncate later targets. With a modest 0.03R reward after fees, risk management is paramount. 🤔 What’s your plan for the next swing if the support holds?
⚠️ Not financial advice. Always manage your risk. 🛡️
🏷️ #TRX #ShortSetup #Crypto #Futures
🦈 🔥
Entry: 0.32221-0.32244 ⚡
Target: 0.32172 / 0.32122 / 0.32121 🚀
Stop Loss: 0.32322 ⚠️
📊 The 4H EMA50/200 stack is firmly bearish, while the 1H shows mixed sentiment, hinting that smart‑money liquidity is still being hunted. DI‑ values (DI+ 17.6 / DI‑ 22.7) and an ADX of 28.6 reinforce the short bias, and the RSI hovers at a neutral 48.7, leaving little upside for bulls. 🦈⚡
💡 Entry sits within a tight 15‑minute candle range; however, the immediate support at 0.32161 could absorb the move and truncate later targets. With a modest 0.03R reward after fees, risk management is paramount. 🤔 What’s your plan for the next swing if the support holds?
⚠️ Not financial advice. Always manage your risk. 🛡️
🏷️ #TRX #ShortSetup #Crypto #Futures
🦈 🔥
3

·
--
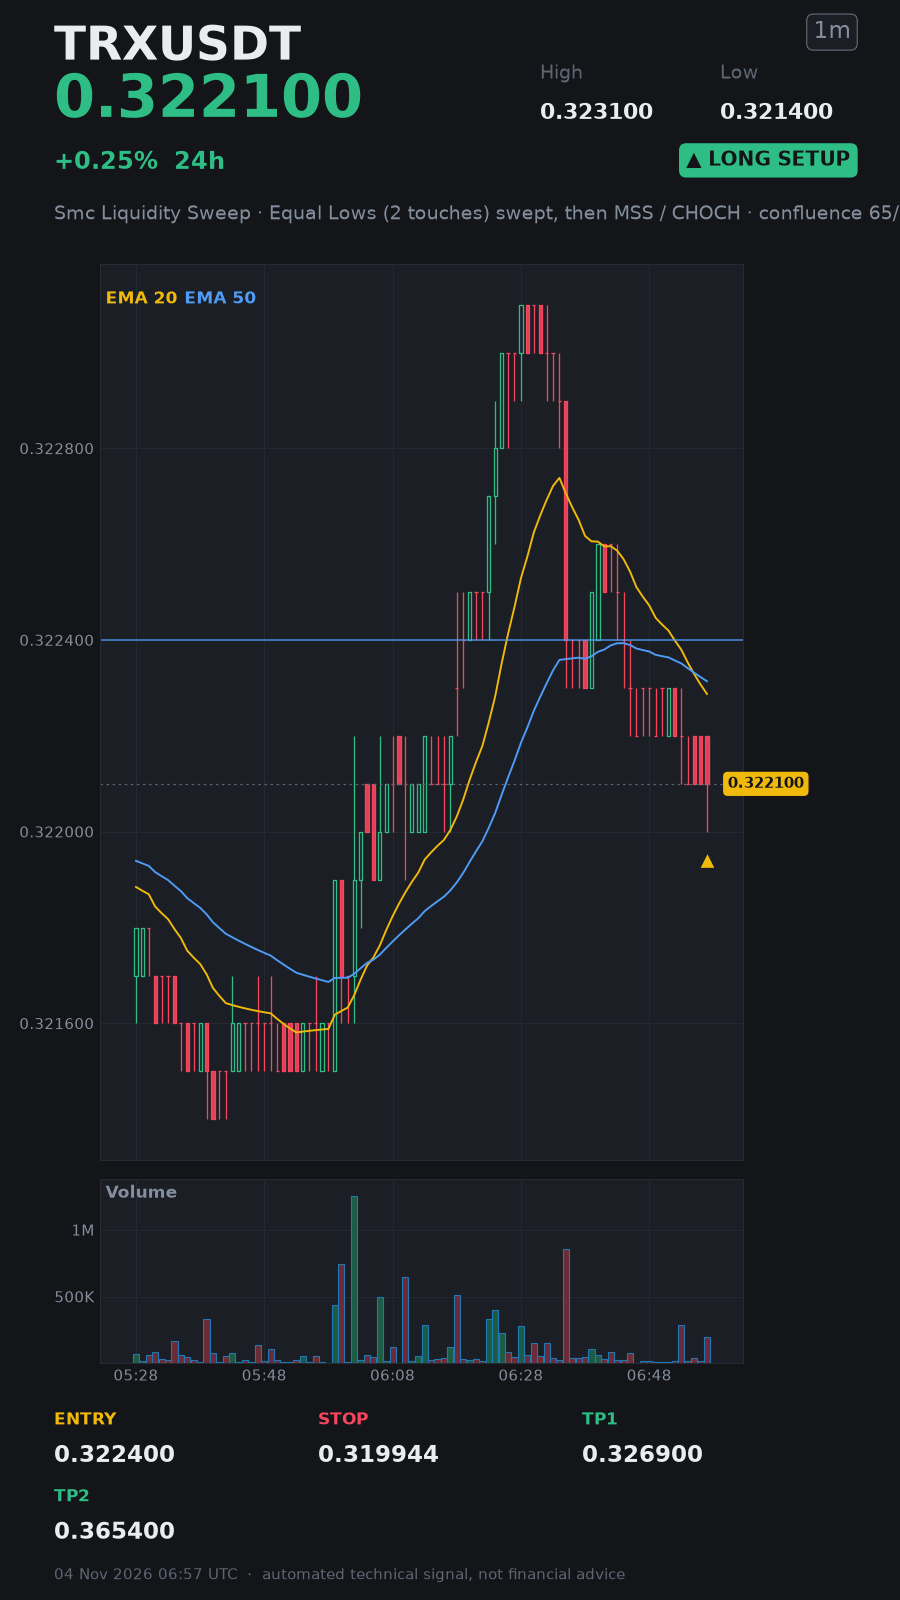
🚨 #TRX SMC Sweep Ignites Massive Bull Run! 🤯⚡
I'm in this long right now $TRX 👇
Long..... Sweep..... Watch the rockets launch.....‼️‼️‼️
Entry: 0.3223 – 0.3224
Stop-loss: 0.3199
🟢 TP1: 0.3269
🟢 TP2: 0.3654
Join me, trade the wave together 👇⬇️⬇️ Long.. With meee...👇⬇️ $TRX
🚨 #TRX SMC Sweep Ignites Massive Bull Run! 🤯⚡
I'm in this long right now $TRX 👇
Long..... Sweep..... Watch the rockets launch.....‼️‼️‼️
Entry: 0.3223 – 0.3224
Stop-loss: 0.3199
🟢 TP1: 0.3269
🟢 TP2: 0.3654
Join me, trade the wave together 👇⬇️⬇️ Long.. With meee...👇⬇️ $TRX
I'm in this long right now $TRX 👇
Long..... Sweep..... Watch the rockets launch.....‼️‼️‼️
Entry: 0.3223 – 0.3224
Stop-loss: 0.3199
🟢 TP1: 0.3269
🟢 TP2: 0.3654
Join me, trade the wave together 👇⬇️⬇️ Long.. With meee...👇⬇️ $TRX
4


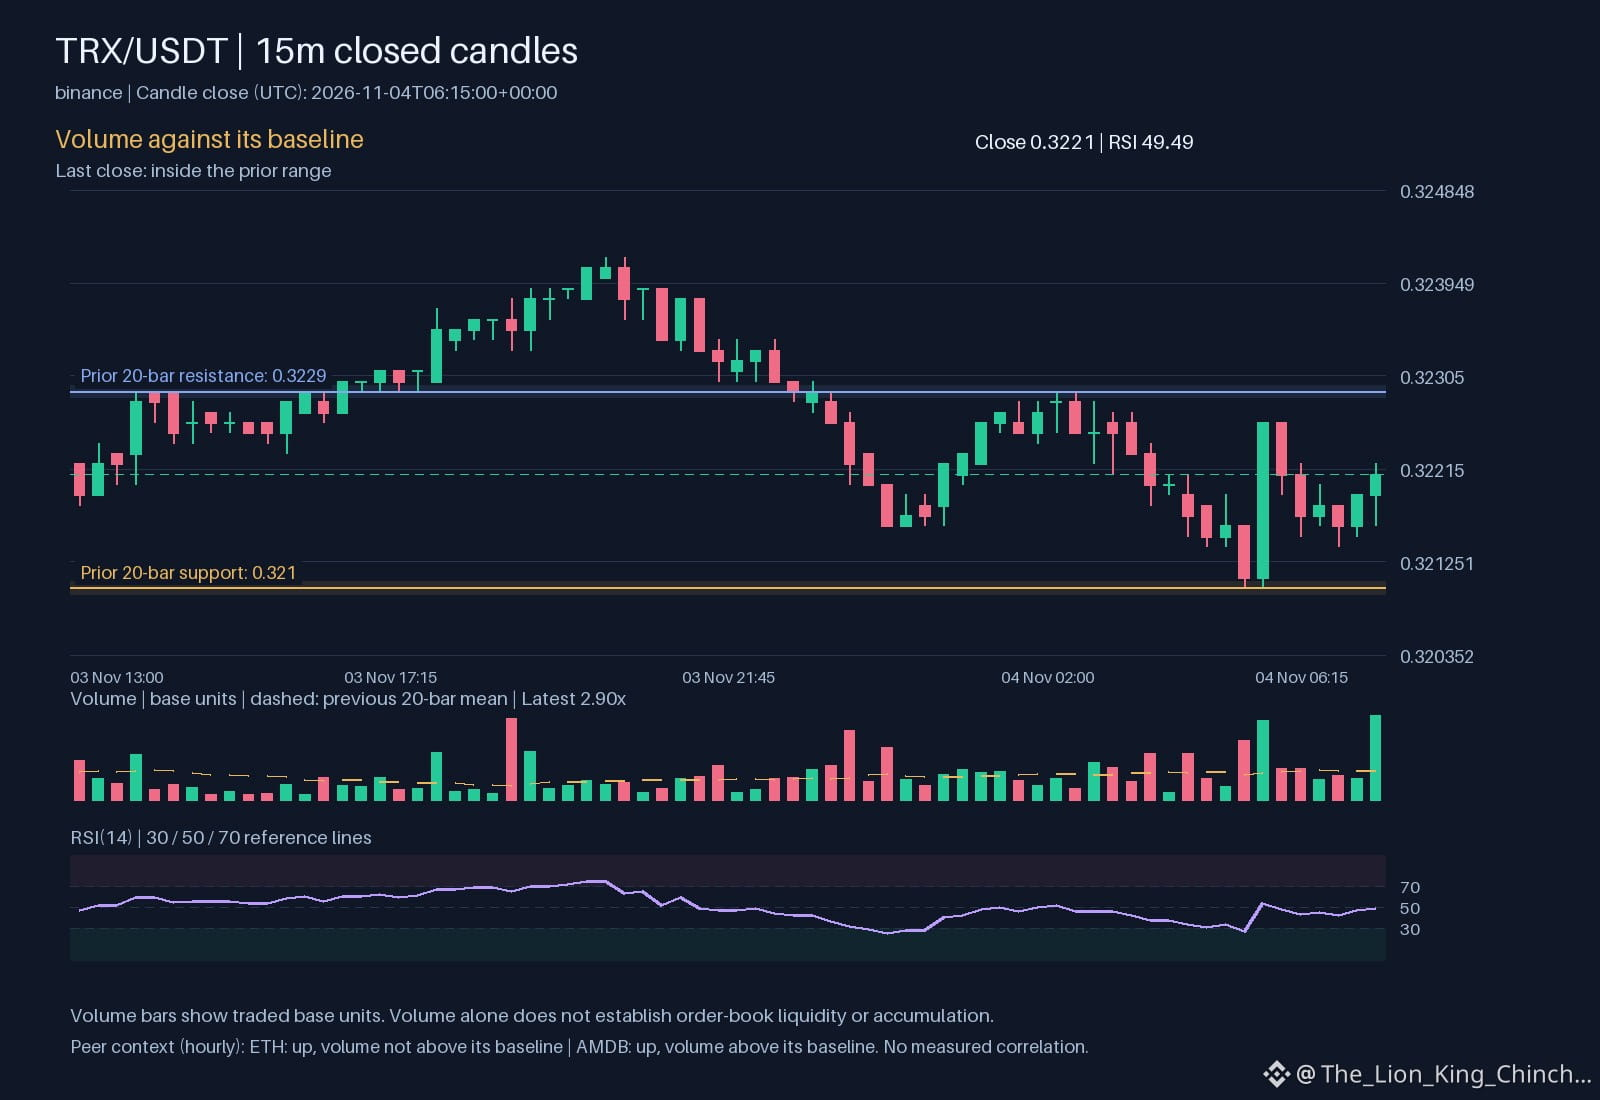
$TRX: Testing Direction Against Provenance
Direction often leads attention, but duration tells the truth. $TRX shows an hourly move up with volume above baseline. This suggests active interest, yet noise remains common.
Context matters. $ETH is also up but trades on ordinary volume. $AMDB is up and active. Three coins sharing a rise proves alignment, not unity. They may react to different drivers on the same venue.
Investors often assume a shared direction implies a shared cause. This is a logical gap. Correlation requires repeated measurement over time, not a single snapshot. A one-hour overlap is a coincidence until data proves otherwise.
Volume baseline is the filter. If $TRX continues rising while volume strengthens, the move holds weight. If volume fades, the rise may be a thin trend. The limit of this comparison is clear: it is a desk check, not a diagnosis. It reveals relative attention, not causal links. Do not treat a leaderboard rank as a signal of market-wide leadership. Verify each asset independently. The question is whether the move holds. Direction starts the story. Consensus volume confirms it. A temporary spike is not a sustainable shift. Check the price action against the baseline again later. If the move persists, the observation gains value. If it reverts, treat the initial rise as a false start. Simplicity reduces error. Focus on how the price interacts with standard supply and demand levels. This approach separates signal from noise. It avoids the trap of pattern matching on a single chart.
Probabilistic market research, not a recommendation or guaranteed return.
The comparison to keep in mind: $ETH has hourly direction up and volume not above its baseline; $AMDB has hourly direction up and volume above its baseline. This alone does not establish correlation.
Which matters more in this comparison: direction or how the move holds?
#TRX #ETH
$TRX : Testing Direction Against Provenance
Direction often leads attention, but duration tells the truth. $TRX shows an hourly move up with volume above baseline. This suggests active interest, yet noise remains common.
Context matters. $ETH is also up but trades on ordinary volume. $AMDB is up and active. Three coins sharing a rise proves alignment, not unity. They may react to different drivers on the same venue.
Investors often assume a shared direction implies a shared cause. This is a logical gap. Correlation requires repeated measurement over time, not a single snapshot. A one-hour overlap is a coincidence until data proves otherwise.
Volume baseline is the filter. If $TRX continues rising while volume strengthens, the move holds weight. If volume fades, the rise may be a thin trend. The limit of this comparison is clear: it is a desk check, not a diagnosis. It reveals relative attention, not causal links. Do not treat a leaderboard rank as a signal of market-wide leadership. Verify each asset independently. The question is whether the move holds. Direction starts the story. Consensus volume confirms it. A temporary spike is not a sustainable shift. Check the price action against the baseline again later. If the move persists, the observation gains value. If it reverts, treat the initial rise as a false start. Simplicity reduces error. Focus on how the price interacts with standard supply and demand levels. This approach separates signal from noise. It avoids the trap of pattern matching on a single chart.
Probabilistic market research, not a recommendation or guaranteed return.
The comparison to keep in mind: $ETH has hourly direction up and volume not above its baseline; $AMDB has hourly direction up and volume above its baseline. This alone does not establish correlation.
Which matters more in this comparison: direction or how the move holds?
#TRX #ETH
Direction often leads attention, but duration tells the truth. $TRX shows an hourly move up with volume above baseline. This suggests active interest, yet noise remains common.
Context matters. $ETH is also up but trades on ordinary volume. $AMDB is up and active. Three coins sharing a rise proves alignment, not unity. They may react to different drivers on the same venue.
Investors often assume a shared direction implies a shared cause. This is a logical gap. Correlation requires repeated measurement over time, not a single snapshot. A one-hour overlap is a coincidence until data proves otherwise.
Volume baseline is the filter. If $TRX continues rising while volume strengthens, the move holds weight. If volume fades, the rise may be a thin trend. The limit of this comparison is clear: it is a desk check, not a diagnosis. It reveals relative attention, not causal links. Do not treat a leaderboard rank as a signal of market-wide leadership. Verify each asset independently. The question is whether the move holds. Direction starts the story. Consensus volume confirms it. A temporary spike is not a sustainable shift. Check the price action against the baseline again later. If the move persists, the observation gains value. If it reverts, treat the initial rise as a false start. Simplicity reduces error. Focus on how the price interacts with standard supply and demand levels. This approach separates signal from noise. It avoids the trap of pattern matching on a single chart.
Probabilistic market research, not a recommendation or guaranteed return.
The comparison to keep in mind: $ETH has hourly direction up and volume not above its baseline; $AMDB has hourly direction up and volume above its baseline. This alone does not establish correlation.
Which matters more in this comparison: direction or how the move holds?
#TRX #ETH
27
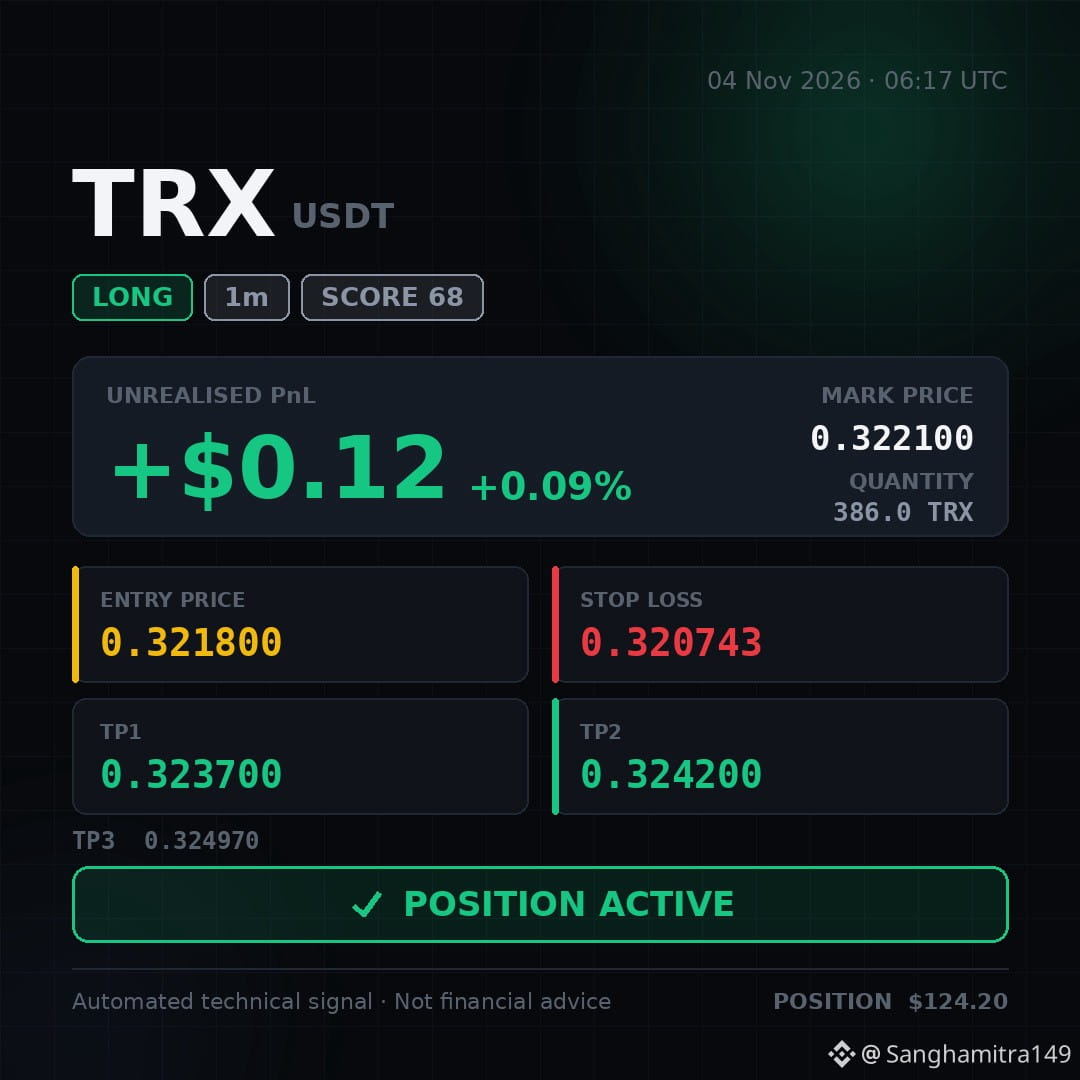
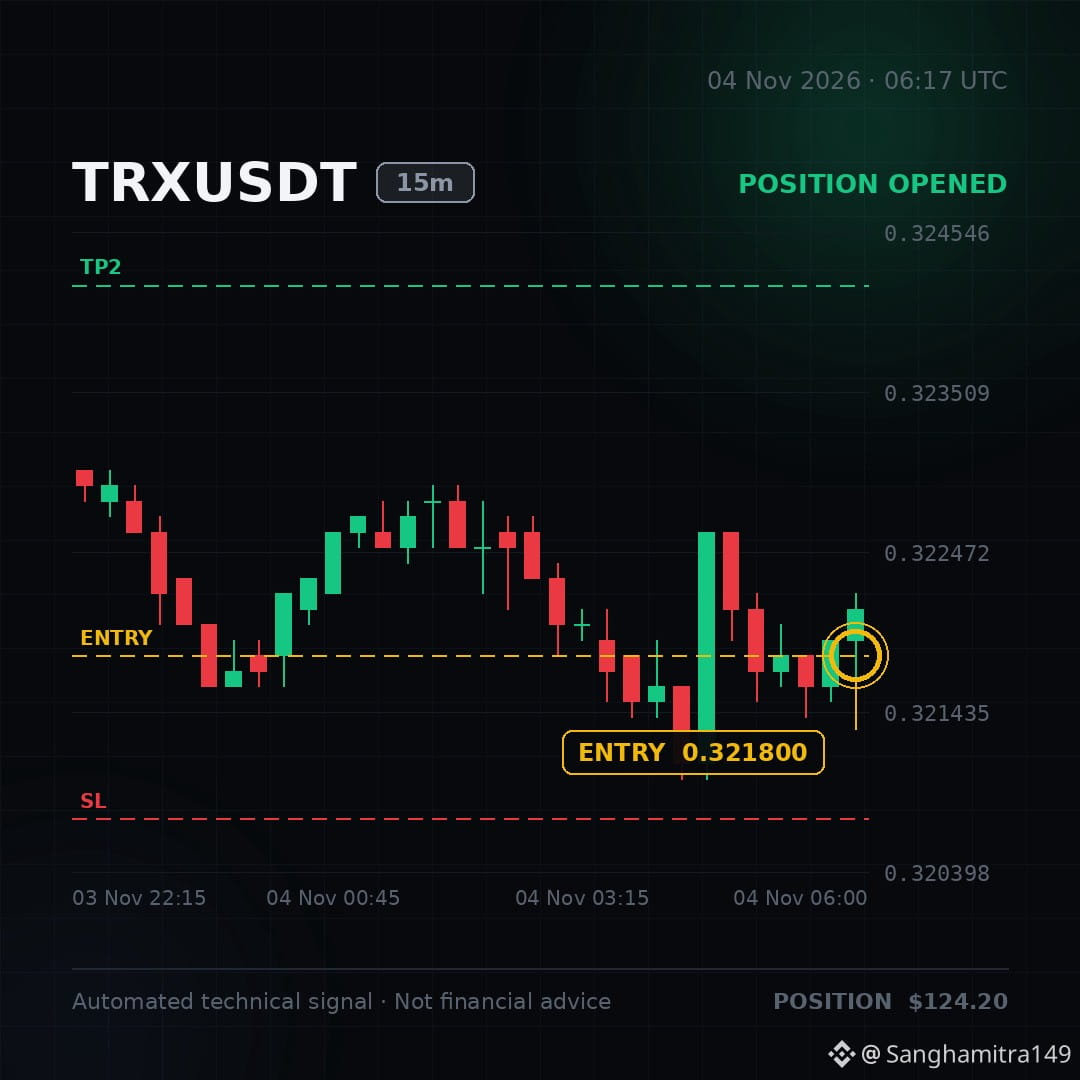
✅ POSITION ACTIVE — I've taken this long. Running at +0.09%.
🚨 #TRX SMC SWEEP BLASTING THE MARKET! 🤯💪
I'm jumping in on this long. $TRX 👇
Long..... Waves..... Ride it..... Now.....‼️‼️‼️
Entry: 0.3217 – 0.3218
Stop-loss: 0.3207
🟢 TP1: 0.3237
🟢 TP2: 0.3242
🟢 TP3: 0.325
Trade alongside me, let’s move! 👇⬇️⬇️ Long.. With meee...👇⬇️ $TRX
✅ POSITION ACTIVE — I've taken this long. Running at +0.09%.
🚨 #TRX SMC SWEEP BLASTING THE MARKET! 🤯💪
I'm jumping in on this long. $TRX 👇
Long..... Waves..... Ride it..... Now.....‼️‼️‼️
Entry: 0.3217 – 0.3218
Stop-loss: 0.3207
🟢 TP1: 0.3237
🟢 TP2: 0.3242
🟢 TP3: 0.325
Trade alongside me, let’s move! 👇⬇️⬇️ Long.. With meee...👇⬇️ $TRX
🚨 #TRX SMC SWEEP BLASTING THE MARKET! 🤯💪
I'm jumping in on this long. $TRX 👇
Long..... Waves..... Ride it..... Now.....‼️‼️‼️
Entry: 0.3217 – 0.3218
Stop-loss: 0.3207
🟢 TP1: 0.3237
🟢 TP2: 0.3242
🟢 TP3: 0.325
Trade alongside me, let’s move! 👇⬇️⬇️ Long.. With meee...👇⬇️ $TRX
5

·
--
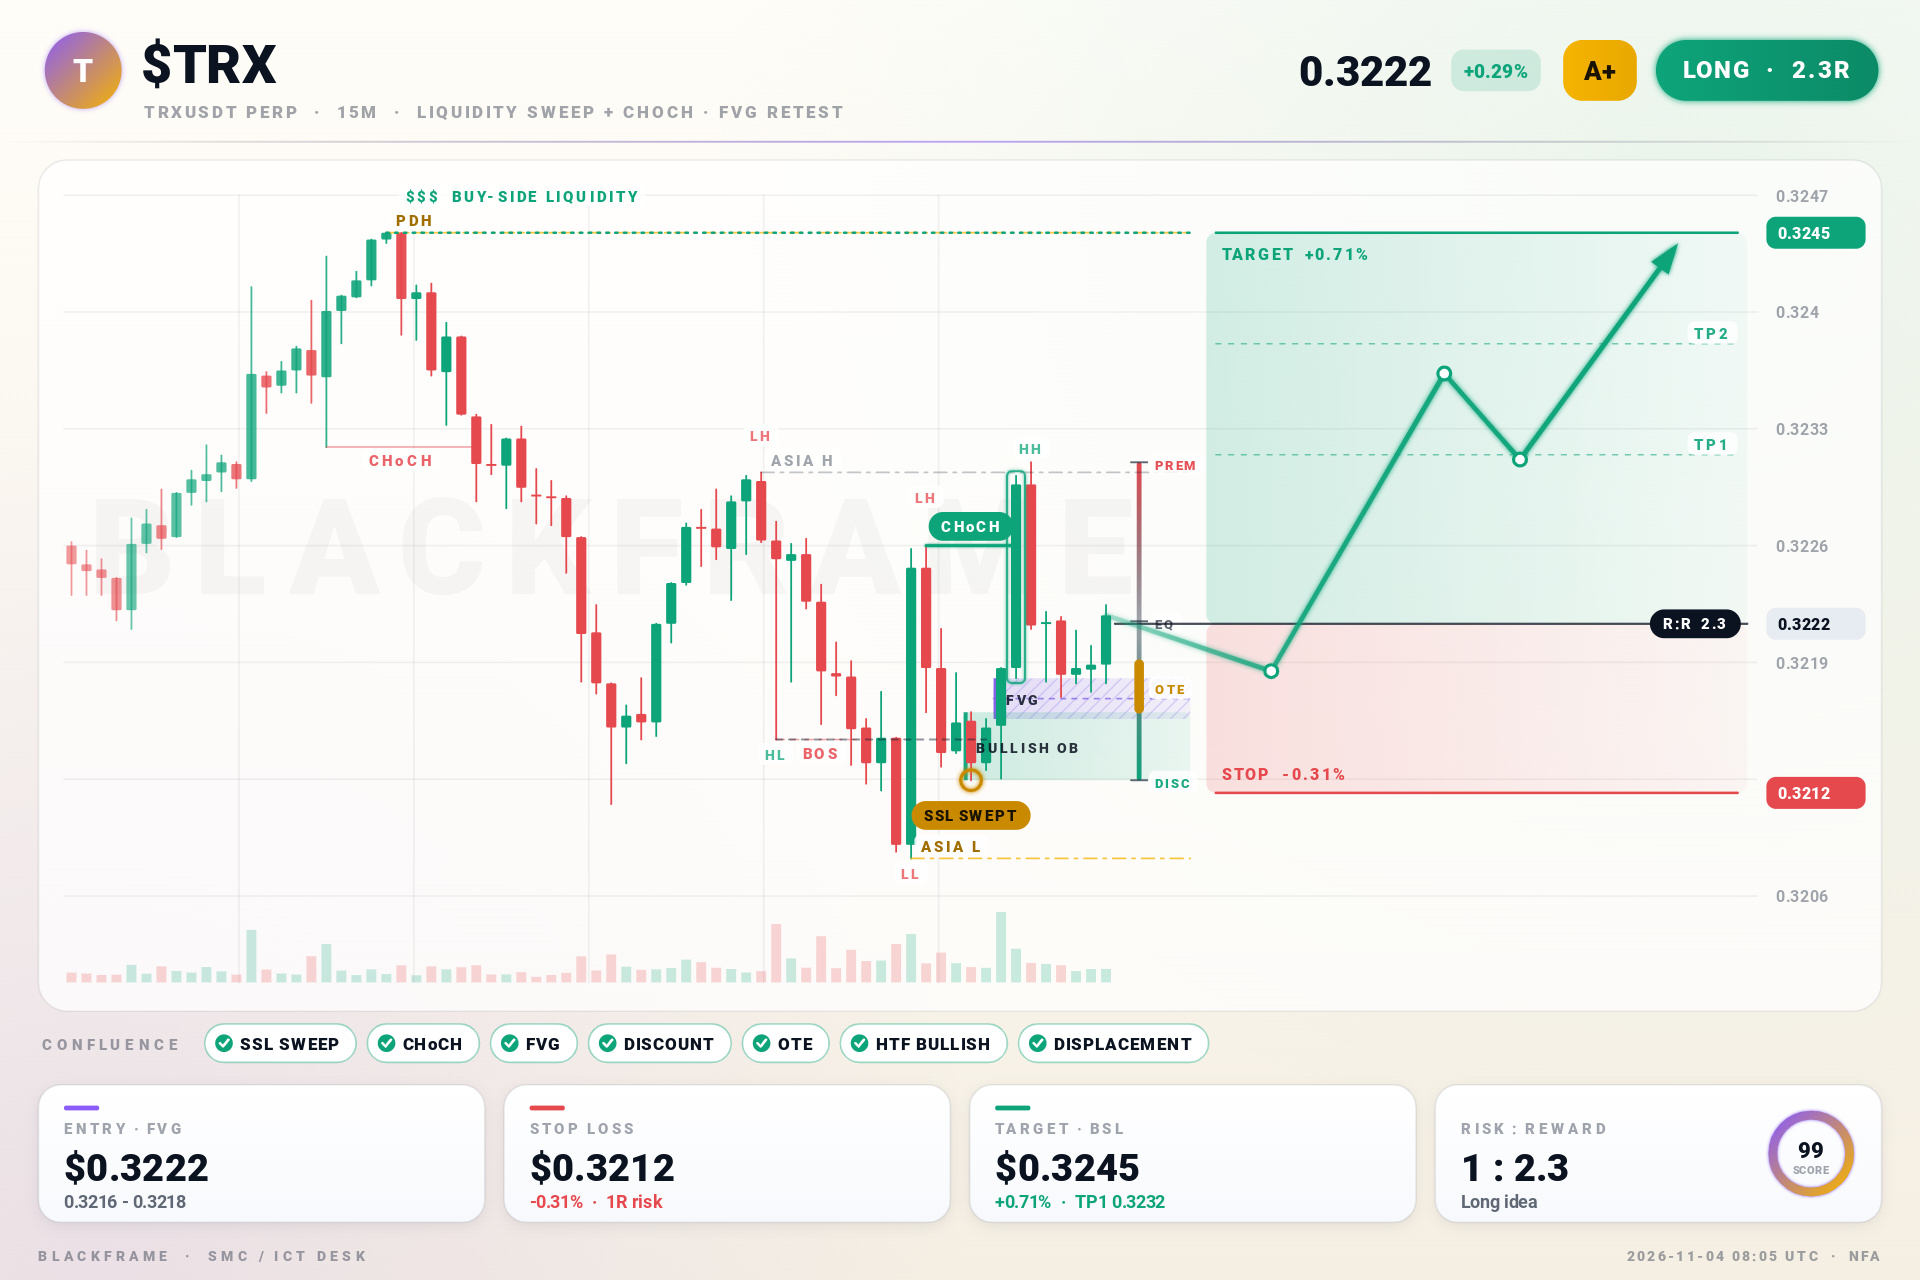
$TRX LONG Ride the wave 🚀
✅ Sell-side liquidity swept
✅ CHoCH confirmed on the 15M
✅ Buying from discount
✅ London killzone
Entry $0.3222 · SL $0.3212 · TP $0.3245
#TRX #PriceAction · NFA
$TRX LONG Ride the wave 🚀
✅ Sell-side liquidity swept
✅ CHoCH confirmed on the 15M
✅ Buying from discount
✅ London killzone
Entry $0.3222 · SL $0.3212 · TP $0.3245
#TRX #PriceAction · NFA
✅ Sell-side liquidity swept
✅ CHoCH confirmed on the 15M
✅ Buying from discount
✅ London killzone
Entry $0.3222 · SL $0.3212 · TP $0.3245
#TRX #PriceAction · NFA
85

·
--
Bullish
🚀 Crypto Spotlight: $TRX & $EVAA
🔥 $TRX – TRON
A blockchain network focused on fast transactions and stablecoin transfers.
💎 $EVAA – EVAA Protocol
A DeFi lending project built on the TON blockchain and integrated with Telegram.
Two different projects bringing innovation to the crypto ecosystem! 🌐
Which project interests you more? 👀
#Binance #TRX #EVAA #Crypto #TRON
{spot}(TRXUSDT)
{future}(EVAAUSDT)
🚀 Crypto Spotlight: $TRX & $EVAA
🔥 $TRX – TRON
A blockchain network focused on fast transactions and stablecoin transfers.
💎 $EVAA – EVAA Protocol
A DeFi lending project built on the TON blockchain and integrated with Telegram.
Two different projects bringing innovation to the crypto ecosystem! 🌐
Which project interests you more? 👀
#Binance #TRX #EVAA #Crypto #TRON
🔥 $TRX – TRON
A blockchain network focused on fast transactions and stablecoin transfers.
💎 $EVAA – EVAA Protocol
A DeFi lending project built on the TON blockchain and integrated with Telegram.
Two different projects bringing innovation to the crypto ecosystem! 🌐
Which project interests you more? 👀
#Binance #TRX #EVAA #Crypto #TRON
331

·
--
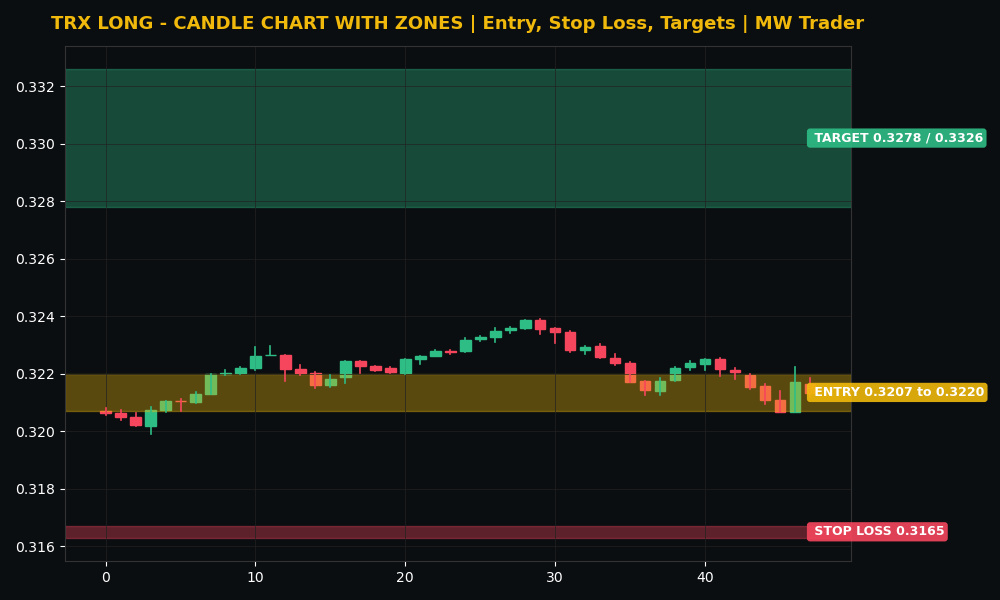
$TRX #TRX 🚀
Direction: LONG
Entry zone: 0.3207 to 0.3220
Stop loss: 0.3165
Target 1: 0.3278
Target 2: 0.3326
Tron is trading near 0.3213 dollars, up 0.17 percent in 24 hours, inside a tight range of 0.3199 to 0.3239 dollars, and the recent closes are almost flat, 0.3211, then 0.3207, then 0.3217, then 0.3213. 📈 My reading is that TRX is the quiet coin in this batch, and quiet tight ranges are where a small continuation long makes sense, because the risk line is close and clear. A long from the current zone, with a stop below 0.3165, targets 0.3278 first and then 0.3326 if buyers push out of the tight range. A fall below 0.3165 kills the idea without debate.
Futures trading is risky. Trade small, use a stop loss, and do your own research. This is my reading, not a guaranteed signal.
Does TRX rise to 0.3278 first, or fall below 0.3165? 🤔
Follow for more trades.
#TRX #Crypto #FuturesTrading #TradingSignals
$TRX #TRX 🚀
Direction: LONG
Entry zone: 0.3207 to 0.3220
Stop loss: 0.3165
Target 1: 0.3278
Target 2: 0.3326
Tron is trading near 0.3213 dollars, up 0.17 percent in 24 hours, inside a tight range of 0.3199 to 0.3239 dollars, and the recent closes are almost flat, 0.3211, then 0.3207, then 0.3217, then 0.3213. 📈 My reading is that TRX is the quiet coin in this batch, and quiet tight ranges are where a small continuation long makes sense, because the risk line is close and clear. A long from the current zone, with a stop below 0.3165, targets 0.3278 first and then 0.3326 if buyers push out of the tight range. A fall below 0.3165 kills the idea without debate.
Futures trading is risky. Trade small, use a stop loss, and do your own research. This is my reading, not a guaranteed signal.
Does TRX rise to 0.3278 first, or fall below 0.3165? 🤔
Follow for more trades.
#TRX #Crypto #FuturesTrading #TradingSignals
Direction: LONG
Entry zone: 0.3207 to 0.3220
Stop loss: 0.3165
Target 1: 0.3278
Target 2: 0.3326
Tron is trading near 0.3213 dollars, up 0.17 percent in 24 hours, inside a tight range of 0.3199 to 0.3239 dollars, and the recent closes are almost flat, 0.3211, then 0.3207, then 0.3217, then 0.3213. 📈 My reading is that TRX is the quiet coin in this batch, and quiet tight ranges are where a small continuation long makes sense, because the risk line is close and clear. A long from the current zone, with a stop below 0.3165, targets 0.3278 first and then 0.3326 if buyers push out of the tight range. A fall below 0.3165 kills the idea without debate.
Futures trading is risky. Trade small, use a stop loss, and do your own research. This is my reading, not a guaranteed signal.
Does TRX rise to 0.3278 first, or fall below 0.3165? 🤔
Follow for more trades.
#TRX #Crypto #FuturesTrading #TradingSignals
2


·
--
Article
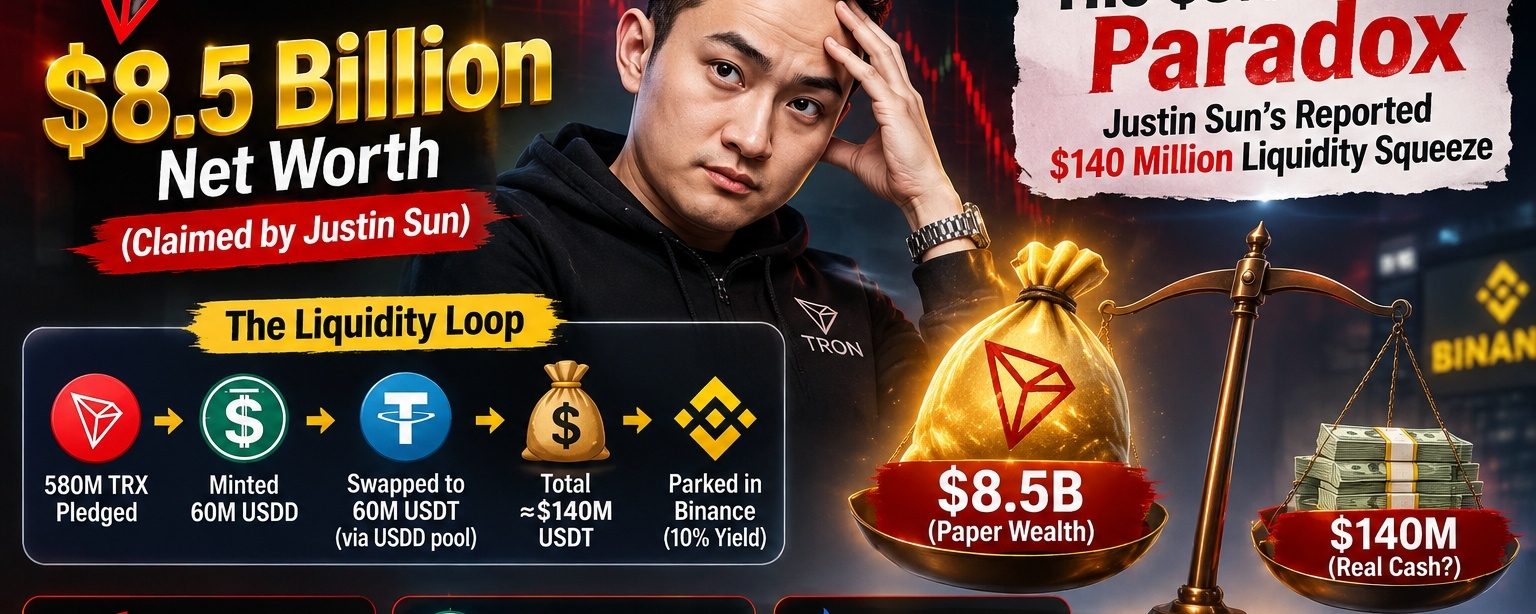
The $8.5 Billion Paradox: Justin Sun’s Reported $140 Million Liquidity SqueezeJustin Sun publicly claims an $8.5 billion** net worth, but a viral on-chain narrative suggests he recently had to assemble just **$140 million through a multi-step liquidity loop—raising questions about paper wealth versus real cash.
According to the report, Sun pledged 580 million #TRX to mint 60 million USDD, swapped it for 60 million #USDT through TRON’s official USDD redemption pool, combined it with earlier swaps to reach $140 million #USDT , and parked it in Binance’s 10% yield product.
The real issue is liquidity, not balance-sheet wealth. Most of Sun’s fortune is tied to concentrated #TRX✅ holdings that cannot be sold at scale without crashing the market. Meanwhile, USDD’s redemption buffer is reportedly thin, and HTX faces an apparent $2.6 billion shortfall between client liabilities and visible assets.
Bottom line: The story is less about bankruptcy and more about the liquidity illusion—an $8.5 billion valuation does not mean $140 million in cash is easy to produce.
The $8.5 Billion Paradox: Justin Sun’s Reported $140 Million Liquidity Squeeze
Justin Sun publicly claims an $8.5 billion** net worth, but a viral on-chain narrative suggests he recently had to assemble just **$140 million through a multi-step liquidity loop—raising questions about paper wealth versus real cash.
According to the report, Sun pledged 580 million #TRX to mint 60 million USDD, swapped it for 60 million #USDT through TRON’s official USDD redemption pool, combined it with earlier swaps to reach $140 million #USDT , and parked it in Binance’s 10% yield product.
The real issue is liquidity, not balance-sheet wealth. Most of Sun’s fortune is tied to concentrated #TRX✅ holdings that cannot be sold at scale without crashing the market. Meanwhile, USDD’s redemption buffer is reportedly thin, and HTX faces an apparent $2.6 billion shortfall between client liabilities and visible assets.
Bottom line: The story is less about bankruptcy and more about the liquidity illusion—an $8.5 billion valuation does not mean $140 million in cash is easy to produce.
According to the report, Sun pledged 580 million #TRX to mint 60 million USDD, swapped it for 60 million #USDT through TRON’s official USDD redemption pool, combined it with earlier swaps to reach $140 million #USDT , and parked it in Binance’s 10% yield product.
The real issue is liquidity, not balance-sheet wealth. Most of Sun’s fortune is tied to concentrated #TRX✅ holdings that cannot be sold at scale without crashing the market. Meanwhile, USDD’s redemption buffer is reportedly thin, and HTX faces an apparent $2.6 billion shortfall between client liabilities and visible assets.
Bottom line: The story is less about bankruptcy and more about the liquidity illusion—an $8.5 billion valuation does not mean $140 million in cash is easy to produce.
88

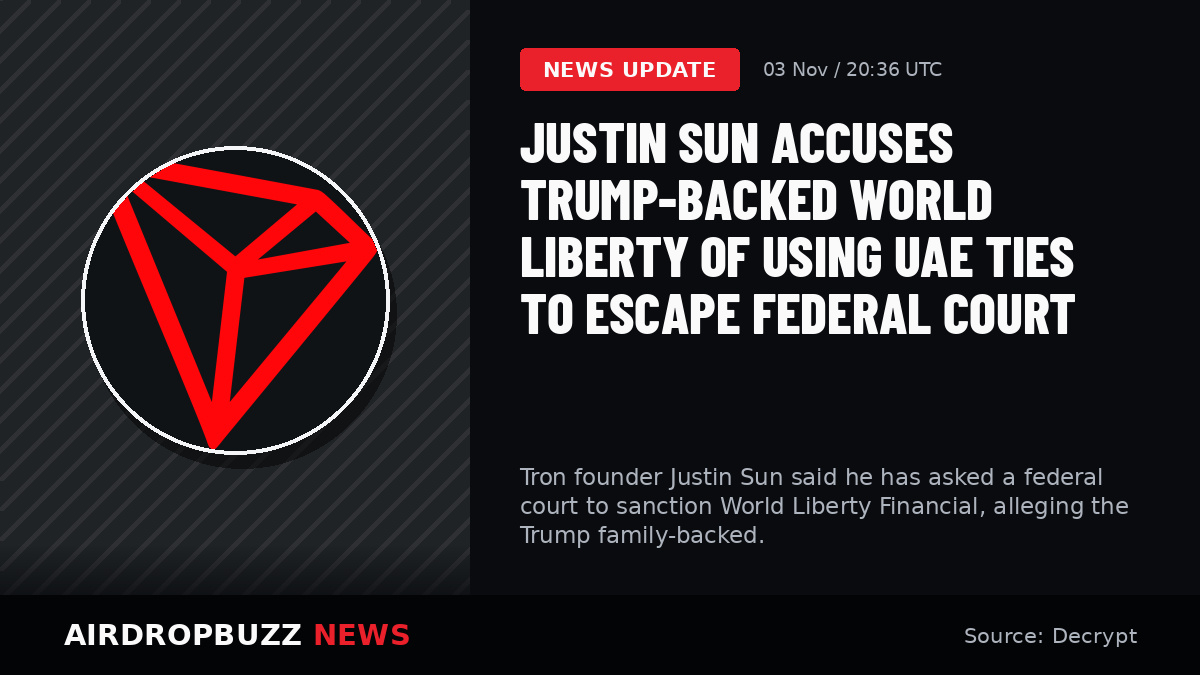
$TRX: Justin Sun Accuses Trump-Backed World Liberty of Using UAE Ties to Escape Federal Court
📰 What happened
Tron founder Justin Sun said he has asked a federal court to sanction World Liberty Financial, alleging the Trump family-backed venture delayed disclosing UAE ties that could defeat federal jurisdiction over his lawsuit.
🔎 Why it matters — our reading
Check the published decision, eligible jurisdictions and effective dates before assuming access has changed.
💬 Your take
Which eligibility rule or implementation date matters most to you?
Source: Decrypt
Source published: 3 Nov 2026, 20:36 UTC
#TRX #CryptoRegulation
$TRX : Justin Sun Accuses Trump-Backed World Liberty of Using UAE Ties to Escape Federal Court
📰 What happened
Tron founder Justin Sun said he has asked a federal court to sanction World Liberty Financial, alleging the Trump family-backed venture delayed disclosing UAE ties that could defeat federal jurisdiction over his lawsuit.
🔎 Why it matters — our reading
Check the published decision, eligible jurisdictions and effective dates before assuming access has changed.
💬 Your take
Which eligibility rule or implementation date matters most to you?
Source: Decrypt
Source published: 3 Nov 2026, 20:36 UTC
#TRX #CryptoRegulation
📰 What happened
Tron founder Justin Sun said he has asked a federal court to sanction World Liberty Financial, alleging the Trump family-backed venture delayed disclosing UAE ties that could defeat federal jurisdiction over his lawsuit.
🔎 Why it matters — our reading
Check the published decision, eligible jurisdictions and effective dates before assuming access has changed.
💬 Your take
Which eligibility rule or implementation date matters most to you?
Source: Decrypt
Source published: 3 Nov 2026, 20:36 UTC
#TRX #CryptoRegulation
37

·
--
Volume spikes on flat candles often trap breakout chasers.
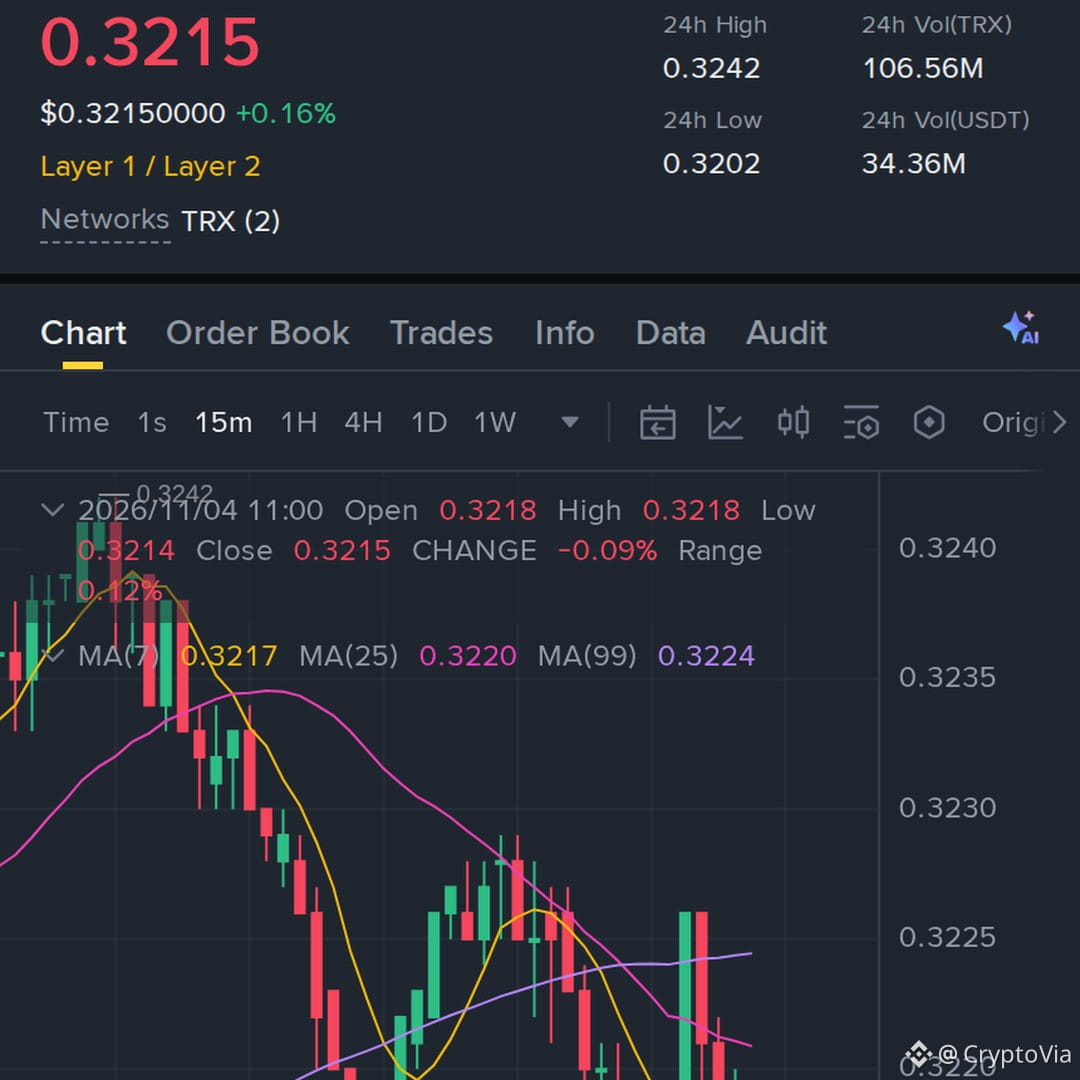
$TRX trades at $0.3224, up 0.56% in 24 hours with a $33.76M quote volume. The last hourly volume reached 1.31x the prior 23-hour average, despite a 0.25% hourly drop inside a 0.3202 to 0.3242 daily range.
Watch the upper boundary near 0.3242 for a momentum confirmation scenario, while a dip toward 0.3202 signals invalidation.
Will you wait for a confirmed hourly close above the daily high, or does entering near current levels carry too much fade risk?
Tap $TRX for the live chart. #TRX #BinanceSquare
Volume spikes on flat candles often trap breakout chasers.
$TRX trades at $0.3224, up 0.56% in 24 hours with a $33.76M quote volume. The last hourly volume reached 1.31x the prior 23-hour average, despite a 0.25% hourly drop inside a 0.3202 to 0.3242 daily range.
Watch the upper boundary near 0.3242 for a momentum confirmation scenario, while a dip toward 0.3202 signals invalidation.
Will you wait for a confirmed hourly close above the daily high, or does entering near current levels carry too much fade risk?
Tap $TRX for the live chart. #TRX #BinanceSquare
$TRX trades at $0.3224, up 0.56% in 24 hours with a $33.76M quote volume. The last hourly volume reached 1.31x the prior 23-hour average, despite a 0.25% hourly drop inside a 0.3202 to 0.3242 daily range.
Watch the upper boundary near 0.3242 for a momentum confirmation scenario, while a dip toward 0.3202 signals invalidation.
Will you wait for a confirmed hourly close above the daily high, or does entering near current levels carry too much fade risk?
Tap $TRX for the live chart. #TRX #BinanceSquare
4
·
--
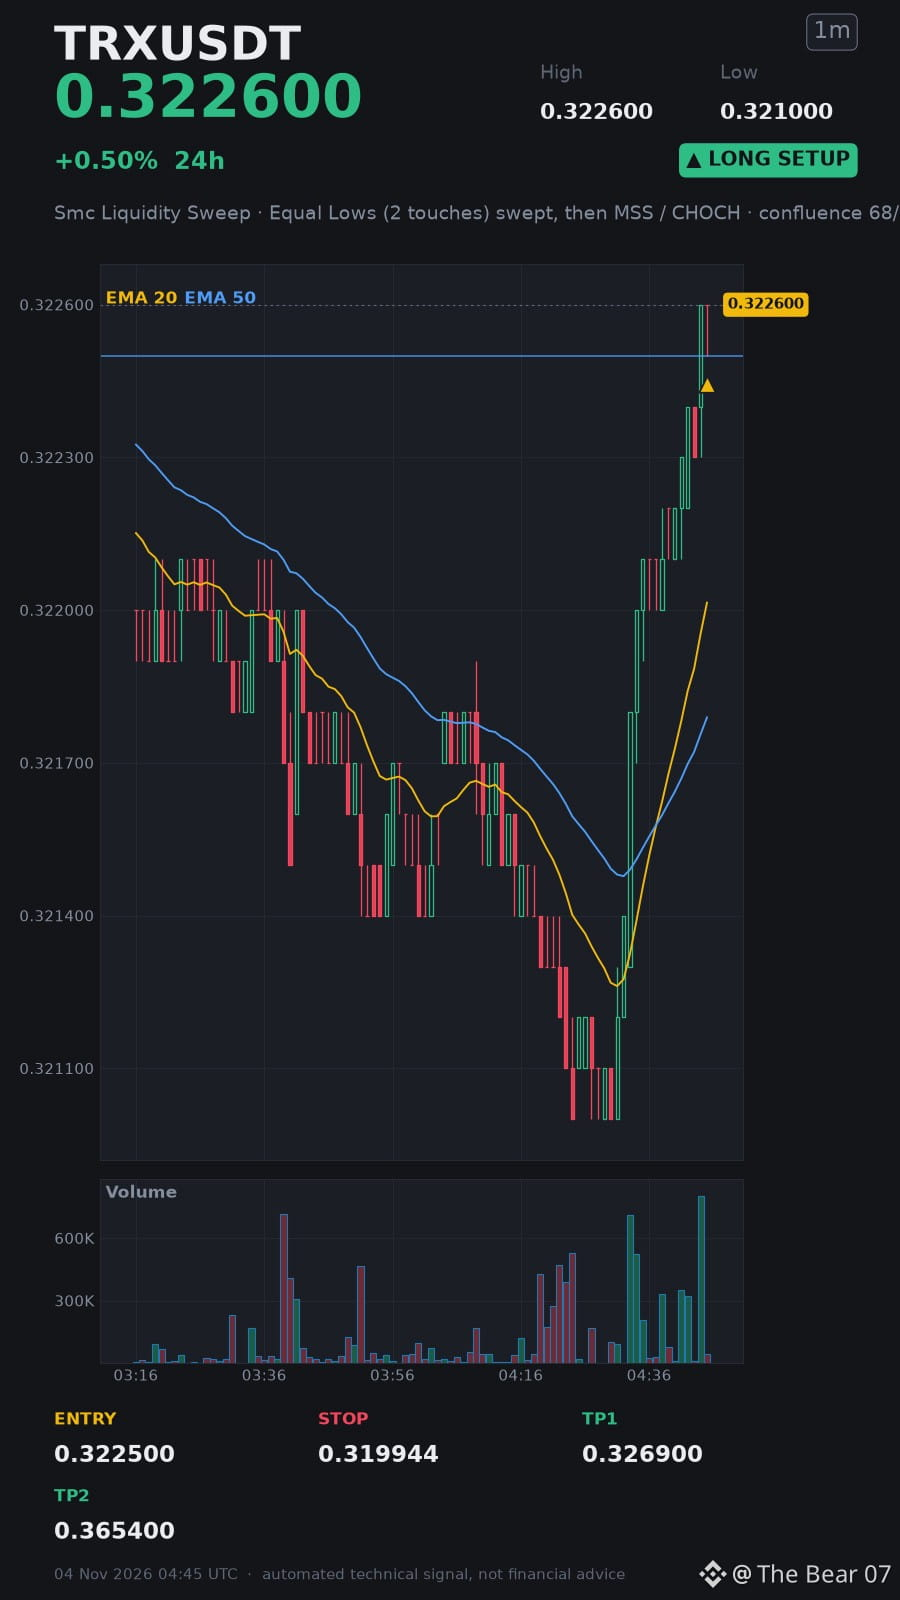
🚨 #TRX SMC SWEEP IGNITES A MAJOR BREAKOUT! 🤯💪
I'm on board with this long. $TRX 👇
Long..... Sweep..... Ride it..... Boom.....‼️‼️‼️
Entry: 0.3224 – 0.3225
Stop-loss: 0.3199
🟢 TP1: 0.3269
🟢 TP2: 0.3654
Join me, trade together now! 👇⬇️⬇️ Long.. With meee...👇⬇️ $TRX
🚨 #TRX SMC SWEEP IGNITES A MAJOR BREAKOUT! 🤯💪
I'm on board with this long. $TRX 👇
Long..... Sweep..... Ride it..... Boom.....‼️‼️‼️
Entry: 0.3224 – 0.3225
Stop-loss: 0.3199
🟢 TP1: 0.3269
🟢 TP2: 0.3654
Join me, trade together now! 👇⬇️⬇️ Long.. With meee...👇⬇️ $TRX
I'm on board with this long. $TRX 👇
Long..... Sweep..... Ride it..... Boom.....‼️‼️‼️
Entry: 0.3224 – 0.3225
Stop-loss: 0.3199
🟢 TP1: 0.3269
🟢 TP2: 0.3654
Join me, trade together now! 👇⬇️⬇️ Long.. With meee...👇⬇️ $TRX
2

🚀 $TRX – Bulls Are Fighting Back! Can TRON Recover? 💚
$TRX is showing early recovery signals after a sharp correction, with buyers stepping in around the $0.3020 support zone.
📊 LONG TRADE SETUP
🟢 Current Price: $0.3225 🎯 Entry Zone: $0.3210 – $0.3230 (with confirmation) 🎯 Target 1: $0.3287 🎯 Target 2: $0.3333 🎯 Target 3: $0.3400
🛡️ Key Support: $0.3128 ⚠️ Stop Loss: Below $0.3120
🔥 Bullish Signals to Watch:
Price is recovering from the $0.3020 low.
Buyers are attempting to regain momentum.
A breakout above $0.3287 could open the way toward $0.3333.
Increasing buying volume would strengthen the bullish case.
💚 My Strategy: Wait for confirmation before entering. Don't chase the pump!
Can $TRX reach $0.3400 in its next bullish move? 🚀
{future}(TRXUSDT)
#TRX #TRON #Binance #longtrade #altcoins
🚀 $TRX – Bulls Are Fighting Back! Can TRON Recover? 💚
$TRX is showing early recovery signals after a sharp correction, with buyers stepping in around the $0.3020 support zone.
📊 LONG TRADE SETUP
🟢 Current Price: $0.3225 🎯 Entry Zone: $0.3210 – $0.3230 (with confirmation) 🎯 Target 1: $0.3287 🎯 Target 2: $0.3333 🎯 Target 3: $0.3400
🛡️ Key Support: $0.3128 ⚠️ Stop Loss: Below $0.3120
🔥 Bullish Signals to Watch:
Price is recovering from the $0.3020 low.
Buyers are attempting to regain momentum.
A breakout above $0.3287 could open the way toward $0.3333.
Increasing buying volume would strengthen the bullish case.
💚 My Strategy: Wait for confirmation before entering. Don't chase the pump!
Can $TRX reach $0.3400 in its next bullish move? 🚀
#TRX #TRON #Binance #longtrade #altcoins
$TRX is showing early recovery signals after a sharp correction, with buyers stepping in around the $0.3020 support zone.
📊 LONG TRADE SETUP
🟢 Current Price: $0.3225 🎯 Entry Zone: $0.3210 – $0.3230 (with confirmation) 🎯 Target 1: $0.3287 🎯 Target 2: $0.3333 🎯 Target 3: $0.3400
🛡️ Key Support: $0.3128 ⚠️ Stop Loss: Below $0.3120
🔥 Bullish Signals to Watch:
Price is recovering from the $0.3020 low.
Buyers are attempting to regain momentum.
A breakout above $0.3287 could open the way toward $0.3333.
Increasing buying volume would strengthen the bullish case.
💚 My Strategy: Wait for confirmation before entering. Don't chase the pump!
Can $TRX reach $0.3400 in its next bullish move? 🚀
#TRX #TRON #Binance #longtrade #altcoins
106

·
--
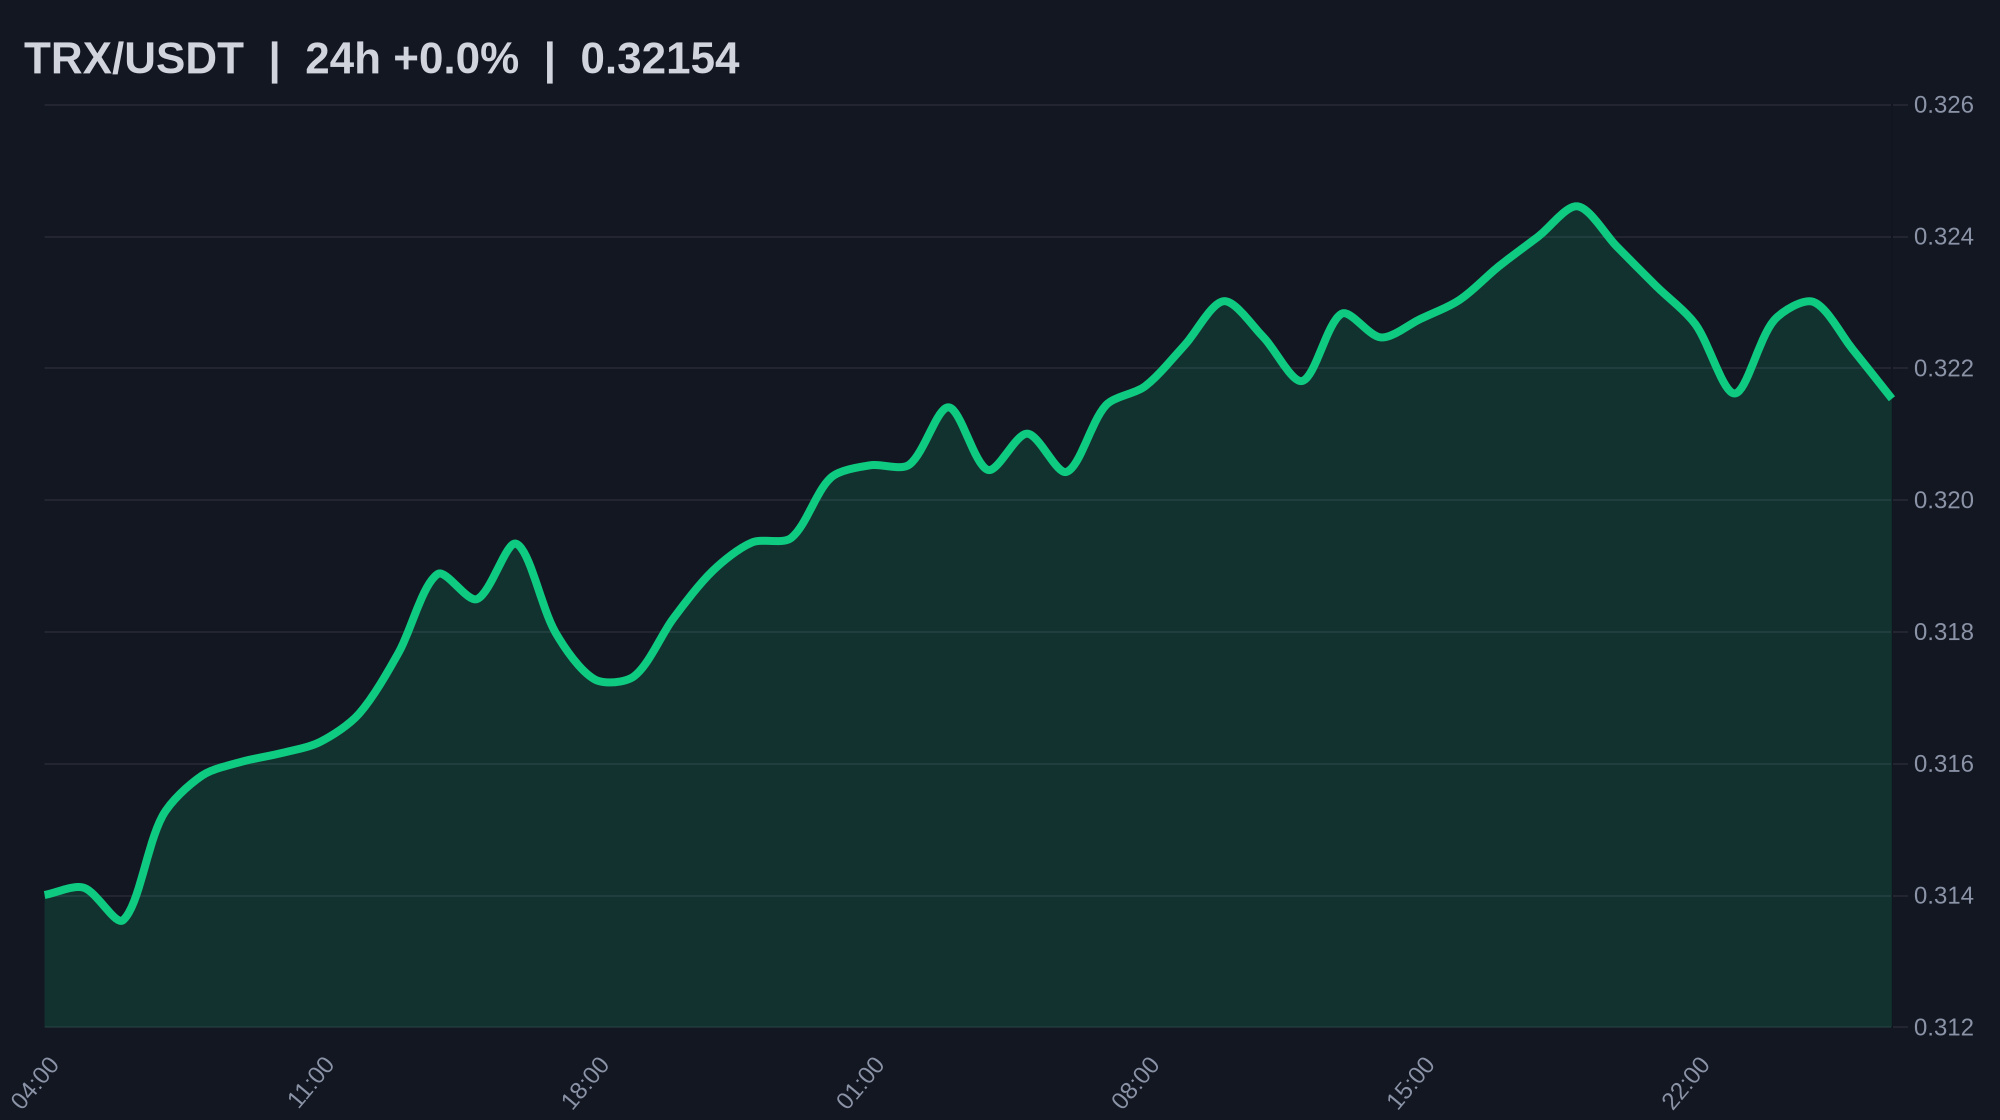
$TRX Justin Sun demands court sanctions over Trump-linked World Liberty Financial's hidden UAE owners. Justin Sun accused the President Donald Trump-backed crypto firm World Liberty Financial of concealing UAE citizenship to escape his federal lawsuit. The Tron founder said on Nov.
⚠️ Trade impact on $TRX: Regulatory and outflow headlines create short-term sell pressure. Expect choppy liquidity sweeps and wait for a confirmed reclaim of support before taking longs.
How are you trading this move? 👇
#TRX #News #Trade
$TRX Justin Sun demands court sanctions over Trump-linked World Liberty Financial's hidden UAE owners. Justin Sun accused the President Donald Trump-backed crypto firm World Liberty Financial of concealing UAE citizenship to escape his federal lawsuit. The Tron founder said on Nov.
⚠️ Trade impact on $TRX : Regulatory and outflow headlines create short-term sell pressure. Expect choppy liquidity sweeps and wait for a confirmed reclaim of support before taking longs.
How are you trading this move? 👇
#TRX #News #Trade
⚠️ Trade impact on $TRX : Regulatory and outflow headlines create short-term sell pressure. Expect choppy liquidity sweeps and wait for a confirmed reclaim of support before taking longs.
How are you trading this move? 👇
#TRX #News #Trade

·
--
$TRX volume sits at $31.64M as price hovers near $0.3228.
Hourly volume recently printed at 1.08x the 23-hour average alongside a mild +0.25% hourly move, showing balanced market participation near the upper boundary of its $0.3201 to $0.3242 range.
If buyers sustain momentum to reclaim the $0.3242 high on rising volume, continuation toward higher liquidity zones becomes a viable scenario. Conversely, a drop below the $0.3201 low would invalidate this outlook and favor the bears.
Will buyers clear the $0.3242 high first, or will fading volume trigger a slide back toward the $0.3201 low?
Tap $TRX for the live chart. #TRX #BinanceSquare
$TRX volume sits at $31.64M as price hovers near $0.3228.
Hourly volume recently printed at 1.08x the 23-hour average alongside a mild +0.25% hourly move, showing balanced market participation near the upper boundary of its $0.3201 to $0.3242 range.
If buyers sustain momentum to reclaim the $0.3242 high on rising volume, continuation toward higher liquidity zones becomes a viable scenario. Conversely, a drop below the $0.3201 low would invalidate this outlook and favor the bears.
Will buyers clear the $0.3242 high first, or will fading volume trigger a slide back toward the $0.3201 low?
Tap $TRX for the live chart. #TRX #BinanceSquare
Hourly volume recently printed at 1.08x the 23-hour average alongside a mild +0.25% hourly move, showing balanced market participation near the upper boundary of its $0.3201 to $0.3242 range.
If buyers sustain momentum to reclaim the $0.3242 high on rising volume, continuation toward higher liquidity zones becomes a viable scenario. Conversely, a drop below the $0.3201 low would invalidate this outlook and favor the bears.
Will buyers clear the $0.3242 high first, or will fading volume trigger a slide back toward the $0.3201 low?
Tap $TRX for the live chart. #TRX #BinanceSquare
45
Log in to explore more content
Join global crypto users on Binance Square
⚡️ Get latest and useful information about crypto.
💬 Trusted by the world’s largest crypto exchange.
👍 Discover real insights from verified creators.
Email / Phone number
Trending Topics
1
#USMidterms-WhatAreMarketsExpecting?
77,209 views
682 Discussing
2
#USOctoberNFP-AreRateCutsStillPossible
240,408 views
1,878 Discussing
3
#AMDBeatsExpectations-AINarrativeContinues
17,962 views
258 Discussing
4
#BinanceIncidentReport
236,922 views
1,315 Discussing
5
#AnthropicIPOPricedDownasInvestorsEye$1.5T
14,349 views
105 Discussing
6
#BinanceReopensWithdrawalsForMoreAssets
353,526 views
2,341 Discussing
7
#HongKongToLicenseVirtualAssetCustodyAndAdvisory
2,357 views
76 Discussing
8
#BinanceHourlyDepositsExceedWithdrawals
149,748 views
1,151 Discussing
9
#SouthKoreaRulingPartyLeaderSeeksCryptoTaxDelay
2,936 views
58 Discussing
10
#MorganStanleyAmongFirstBanksToUseDTCCTokenization
1,936 views
63 Discussing