
#pltr
pltr
88,789 views
1,092 Discussing
Hot
Latest

·
--
🦈 LEGENDARY MACRO MONEY IS ROTATING HEAVY INTO $PLTR WITH A FRESH 13M BLOCK! 💥
When elite macro titans like Druckenmiller step in with an 80,100 share footprint, institutional order flow shifts instantly. Smart money leaves subtle tracks on the tape long before retail catches the wave. 📊
This fresh thirteen million capital deployment signals high-conviction positioning in enterprise AI infrastructure. Tracking where legendary capital flows gives you a front-row seat to the next major market expansion. 🔍
💬 Are you adjusting your portfolio weights to mirror elite institutional accumulation right here? 👇
⚠️ Not financial advice. Always manage your risk. 🛡️
🏷️ #PLTR #SmartMoney #InstitutionalFlow #Macro #Equities
🔥 💎
🦈 LEGENDARY MACRO MONEY IS ROTATING HEAVY INTO $PLTR WITH A FRESH 13M BLOCK! 💥
When elite macro titans like Druckenmiller step in with an 80,100 share footprint, institutional order flow shifts instantly. Smart money leaves subtle tracks on the tape long before retail catches the wave. 📊
This fresh thirteen million capital deployment signals high-conviction positioning in enterprise AI infrastructure. Tracking where legendary capital flows gives you a front-row seat to the next major market expansion. 🔍
💬 Are you adjusting your portfolio weights to mirror elite institutional accumulation right here? 👇
⚠️ Not financial advice. Always manage your risk. 🛡️
🏷️ #PLTR #SmartMoney #InstitutionalFlow #Macro #Equities
🔥 💎
When elite macro titans like Druckenmiller step in with an 80,100 share footprint, institutional order flow shifts instantly. Smart money leaves subtle tracks on the tape long before retail catches the wave. 📊
This fresh thirteen million capital deployment signals high-conviction positioning in enterprise AI infrastructure. Tracking where legendary capital flows gives you a front-row seat to the next major market expansion. 🔍
💬 Are you adjusting your portfolio weights to mirror elite institutional accumulation right here? 👇
⚠️ Not financial advice. Always manage your risk. 🛡️
🏷️ #PLTR #SmartMoney #InstitutionalFlow #Macro #Equities
🔥 💎


5

CONCENTRATING ENTIRE CAPITAL INTO HIGH-CONVICTION PLAYS LIKE $PLTR AND $NBIS INSTEAD OF OVER-DIVERSIFYING! 🦈 ⚡
Spreading capital across twenty different positions waters down your edge and turns your portfolio into dead weight. When institutional momentum locks onto elite setups like $PLTR and $NBIS , holding a concentrated core lets you ride the absolute meat of the trend without distractions. 📊
Mastering market timing means putting your chips where the highest conviction and rawest velocity live. Diversification is for tourists who do not know what they own, while focus is the sharpest weapon in any portfolio. ⚡
💬 Would you rather spread your risk across multiple diverse assets or concentrate your capital into your absolute highest-conviction plays? 👇
⚠️ Not financial advice. Always manage your risk. 🛡️
🏷️ #PLTR #NBIS #Momentum #Portfolio #Trading
🔥 💎
CONCENTRATING ENTIRE CAPITAL INTO HIGH-CONVICTION PLAYS LIKE $PLTR AND $NBIS INSTEAD OF OVER-DIVERSIFYING! 🦈 ⚡
Spreading capital across twenty different positions waters down your edge and turns your portfolio into dead weight. When institutional momentum locks onto elite setups like $PLTR and $NBIS , holding a concentrated core lets you ride the absolute meat of the trend without distractions. 📊
Mastering market timing means putting your chips where the highest conviction and rawest velocity live. Diversification is for tourists who do not know what they own, while focus is the sharpest weapon in any portfolio. ⚡
💬 Would you rather spread your risk across multiple diverse assets or concentrate your capital into your absolute highest-conviction plays? 👇
⚠️ Not financial advice. Always manage your risk. 🛡️
🏷️ #PLTR #NBIS #Momentum #Portfolio #Trading
🔥 💎
Spreading capital across twenty different positions waters down your edge and turns your portfolio into dead weight. When institutional momentum locks onto elite setups like $PLTR and $NBIS , holding a concentrated core lets you ride the absolute meat of the trend without distractions. 📊
Mastering market timing means putting your chips where the highest conviction and rawest velocity live. Diversification is for tourists who do not know what they own, while focus is the sharpest weapon in any portfolio. ⚡
💬 Would you rather spread your risk across multiple diverse assets or concentrate your capital into your absolute highest-conviction plays? 👇
⚠️ Not financial advice. Always manage your risk. 🛡️
🏷️ #PLTR #NBIS #Momentum #Portfolio #Trading
🔥 💎
7

·
--
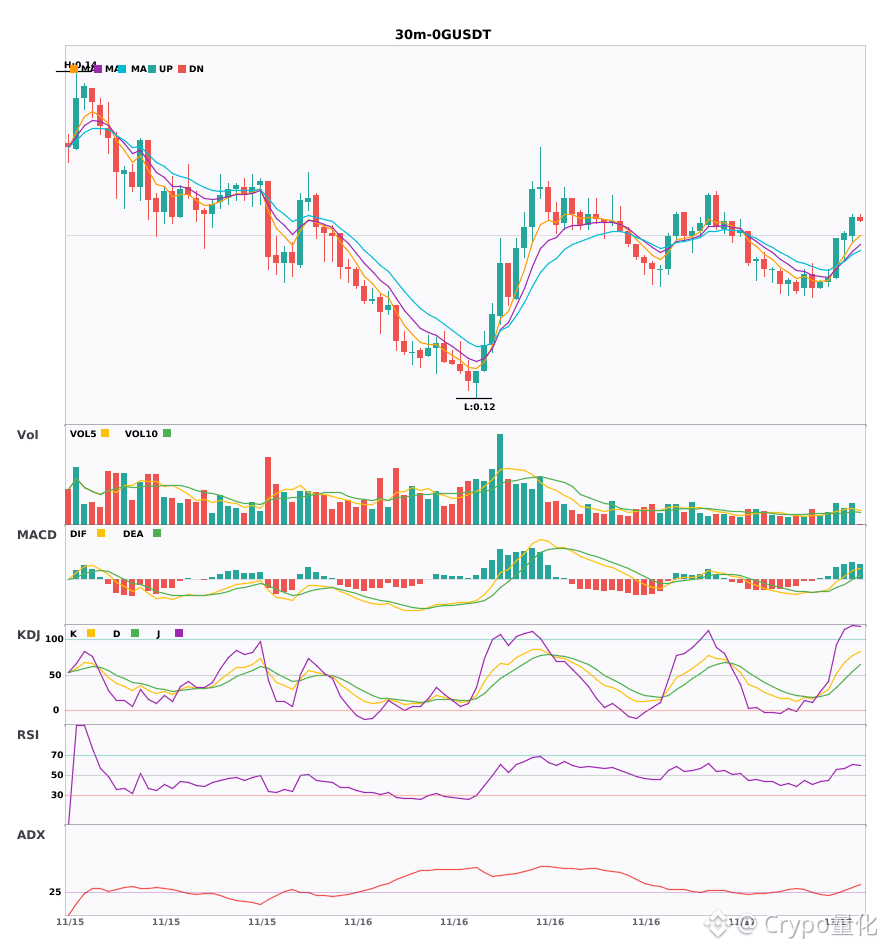
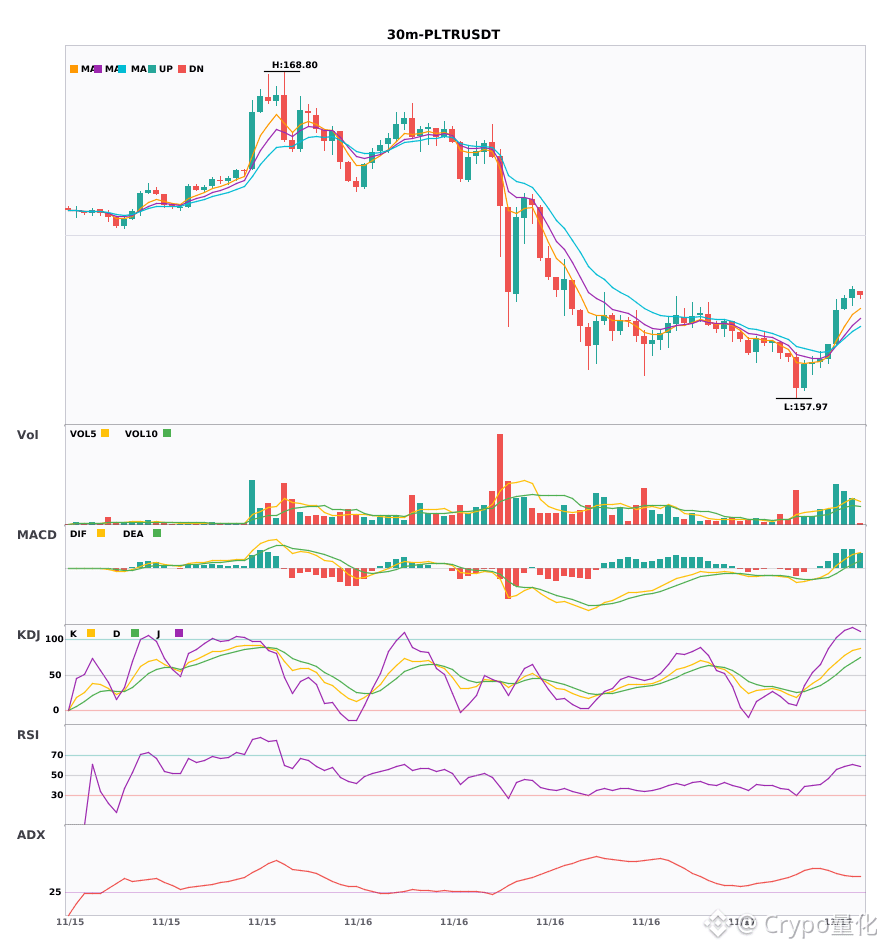
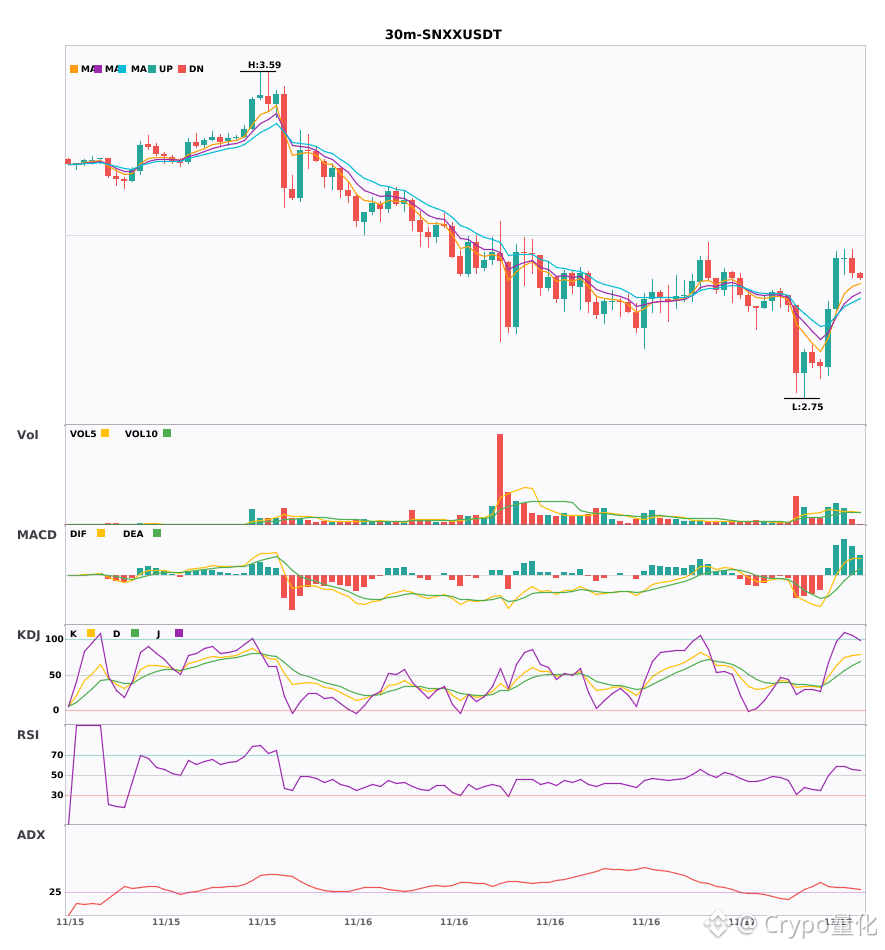
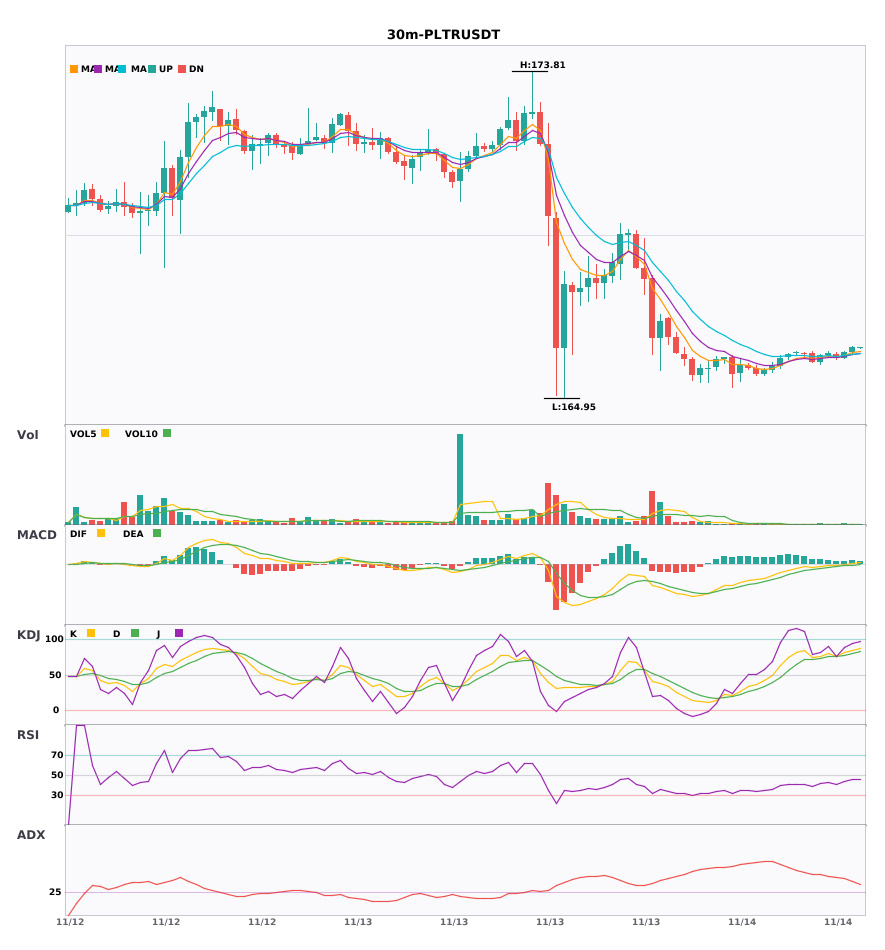
$0G $PLTR $SNXX 30 minutes resonance turned upward, multiple bullish signals firing🔥
════════════════════
🔴 $0G 30-minute bullish signal
⚠️Technical analysis: ADX is strengthening and the trend is obvious, MACD has formed a golden cross and DIF has moved above the zero axis to turn bullish, moving averages are in a bullish alignment and diverging upward, trading volume has increased to nearly 2x, momentum is good.
════════════════════
🔴 $PLTR 30-minute bullish signal
⚠️Technical analysis: ADX(46) trend is extremely strong, beware of overheating pullback | MACD golden cross with increased volume, red bars continue to expand | Moving averages are in a bullish alignment and diverging upward | KDJ K crosses above D and has not entered the overbought zone, bulls have the upper hand | Trading volume has surged to nearly 3x
════════════════════
🔴 $SNXX 30-minute bullish signal
⚠️Technical analysis: ADX shows a clear trending market, MACD golden cross followed by continuously expanding red bars, moving averages have just formed a bullish alignment and are diverging upward, K crosses above D and has not entered the overbought zone, trading volume has increased 2x, bulls have the upper hand.
════════════════════
🔔 Follow to get the latest market moves first hand 🔔
#技术分析 #0G #PLTR #SNXX
📌 When trading, pay attention to whether the candlestick pattern matches
$0G $PLTR $SNXX 30 minutes resonance turned upward, multiple bullish signals firing🔥
════════════════════
🔴 $0G 30-minute bullish signal
⚠️Technical analysis: ADX is strengthening and the trend is obvious, MACD has formed a golden cross and DIF has moved above the zero axis to turn bullish, moving averages are in a bullish alignment and diverging upward, trading volume has increased to nearly 2x, momentum is good.
════════════════════
🔴 $PLTR 30-minute bullish signal
⚠️Technical analysis: ADX(46) trend is extremely strong, beware of overheating pullback | MACD golden cross with increased volume, red bars continue to expand | Moving averages are in a bullish alignment and diverging upward | KDJ K crosses above D and has not entered the overbought zone, bulls have the upper hand | Trading volume has surged to nearly 3x
════════════════════
🔴 $SNXX 30-minute bullish signal
⚠️Technical analysis: ADX shows a clear trending market, MACD golden cross followed by continuously expanding red bars, moving averages have just formed a bullish alignment and are diverging upward, K crosses above D and has not entered the overbought zone, trading volume has increased 2x, bulls have the upper hand.
════════════════════
🔔 Follow to get the latest market moves first hand 🔔
#技术分析 #0G #PLTR #SNXX
📌 When trading, pay attention to whether the candlestick pattern matches
════════════════════
🔴 $0G 30-minute bullish signal
⚠️Technical analysis: ADX is strengthening and the trend is obvious, MACD has formed a golden cross and DIF has moved above the zero axis to turn bullish, moving averages are in a bullish alignment and diverging upward, trading volume has increased to nearly 2x, momentum is good.
════════════════════
🔴 $PLTR 30-minute bullish signal
⚠️Technical analysis: ADX(46) trend is extremely strong, beware of overheating pullback | MACD golden cross with increased volume, red bars continue to expand | Moving averages are in a bullish alignment and diverging upward | KDJ K crosses above D and has not entered the overbought zone, bulls have the upper hand | Trading volume has surged to nearly 3x
════════════════════
🔴 $SNXX 30-minute bullish signal
⚠️Technical analysis: ADX shows a clear trending market, MACD golden cross followed by continuously expanding red bars, moving averages have just formed a bullish alignment and are diverging upward, K crosses above D and has not entered the overbought zone, trading volume has increased 2x, bulls have the upper hand.
════════════════════
🔔 Follow to get the latest market moves first hand 🔔
#技术分析 #0G #PLTR #SNXX
📌 When trading, pay attention to whether the candlestick pattern matches
14
·
--
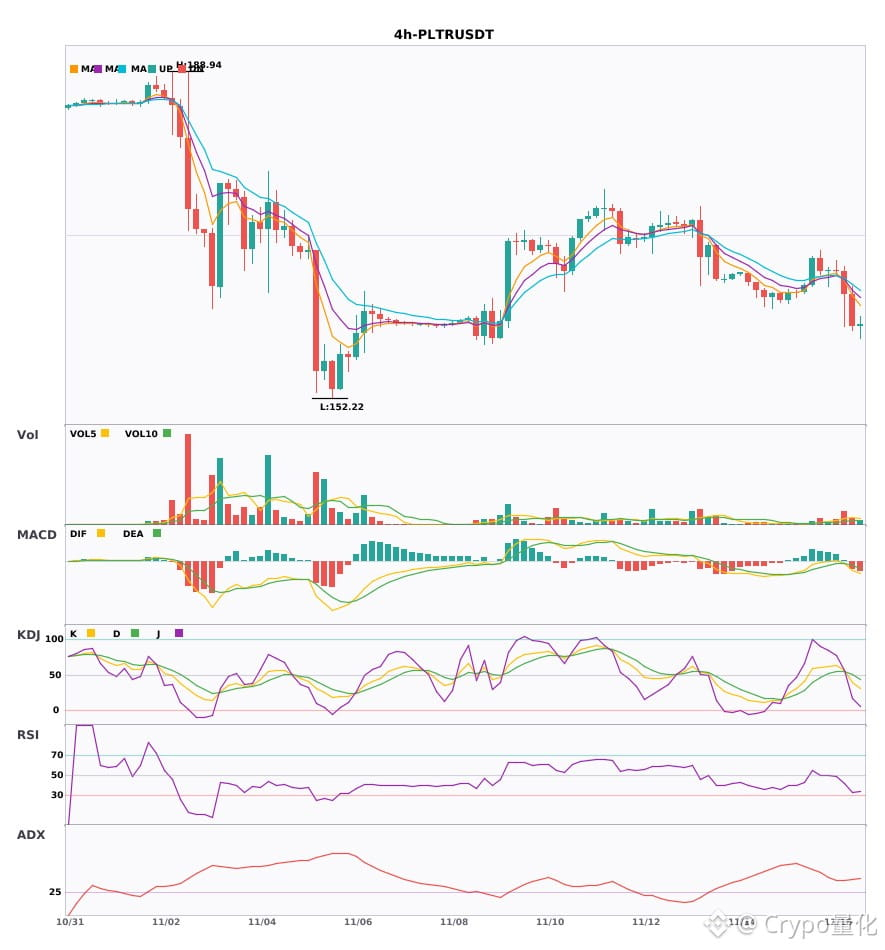
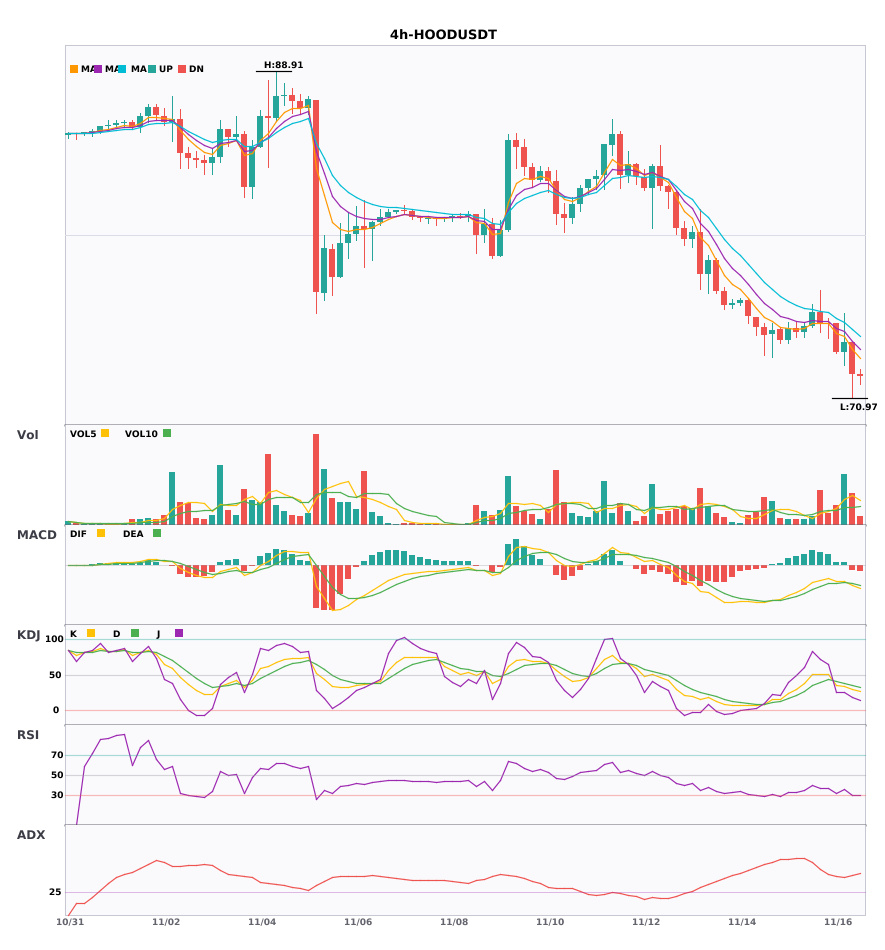
$PLTR $HOOD 4 hours bearish, under short-term pressure—don't rush to get in 🔥
════════════════════
🟢 $PLTR 4-hour bearish signal
⚠️Technical analysis: ADX (42) shows a clear trend; MACD has a bearish cross below zero, with bears gaining strength; moving averages are in bearish alignment; KDJ has a bearish cross, with K crossing below D and not yet oversold; volume is up 3.5x, a bearish sign
════════════════════
🟢 $HOOD 4-hour bearish signal
⚠️Technical analysis: ADX has surged to 43, indicating a very strong trend; MACD has a bearish cross below zero, accelerating bearish momentum; moving averages are trending downward in bearish alignment; KDJ is weak, with bears in control; volume has exploded to 2.9x, with heavy selling pressure.
════════════════════
🔔 Follow for first-hand market updates 🔔
#技术分析 #PLTR #HOOD
📌 When trading, pay attention to whether the candlestick pattern confirms the setup
$PLTR $HOOD 4 hours bearish, under short-term pressure—don't rush to get in 🔥
════════════════════
🟢 $PLTR 4-hour bearish signal
⚠️Technical analysis: ADX (42) shows a clear trend; MACD has a bearish cross below zero, with bears gaining strength; moving averages are in bearish alignment; KDJ has a bearish cross, with K crossing below D and not yet oversold; volume is up 3.5x, a bearish sign
════════════════════
🟢 $HOOD 4-hour bearish signal
⚠️Technical analysis: ADX has surged to 43, indicating a very strong trend; MACD has a bearish cross below zero, accelerating bearish momentum; moving averages are trending downward in bearish alignment; KDJ is weak, with bears in control; volume has exploded to 2.9x, with heavy selling pressure.
════════════════════
🔔 Follow for first-hand market updates 🔔
#技术分析 #PLTR #HOOD
📌 When trading, pay attention to whether the candlestick pattern confirms the setup
════════════════════
🟢 $PLTR 4-hour bearish signal
⚠️Technical analysis: ADX (42) shows a clear trend; MACD has a bearish cross below zero, with bears gaining strength; moving averages are in bearish alignment; KDJ has a bearish cross, with K crossing below D and not yet oversold; volume is up 3.5x, a bearish sign
════════════════════
🟢 $HOOD 4-hour bearish signal
⚠️Technical analysis: ADX has surged to 43, indicating a very strong trend; MACD has a bearish cross below zero, accelerating bearish momentum; moving averages are trending downward in bearish alignment; KDJ is weak, with bears in control; volume has exploded to 2.9x, with heavy selling pressure.
════════════════════
🔔 Follow for first-hand market updates 🔔
#技术分析 #PLTR #HOOD
📌 When trading, pay attention to whether the candlestick pattern confirms the setup
2

·
--
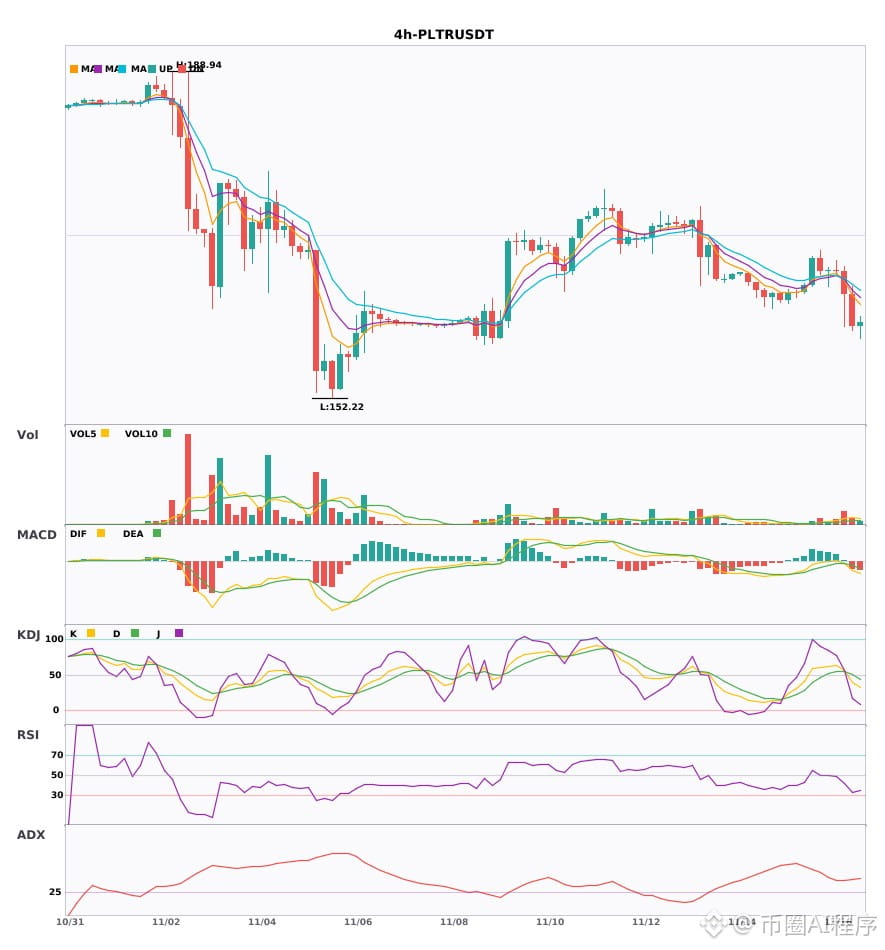
$PLTR 4-hour multi-timeframe outlook is bearish; the daily downtrend has just been confirmed 🔥
════════════════════
🟢 $PLTR 4-hour bearish signal
⚠️ Technicals: Bearish entry signal on the 4-hour chart, confirmed by bearish confluence on the daily chart. MACD has formed a bearish crossover below zero, with expanding green bars; moving averages are bearishly aligned and spreading downward; KDJ has formed a bearish crossover but is not yet oversold; volume has surged to 3.5 times its usual level. Short-term outlook is bearish.
════════════════════
🔔 Follow for first-hand updates on market movements 🔔
#多周期共振 #PLTR
📌 When trading, watch whether the candlestick pattern matches
$PLTR 4-hour multi-timeframe outlook is bearish; the daily downtrend has just been confirmed 🔥
════════════════════
🟢 $PLTR 4-hour bearish signal
⚠️ Technicals: Bearish entry signal on the 4-hour chart, confirmed by bearish confluence on the daily chart. MACD has formed a bearish crossover below zero, with expanding green bars; moving averages are bearishly aligned and spreading downward; KDJ has formed a bearish crossover but is not yet oversold; volume has surged to 3.5 times its usual level. Short-term outlook is bearish.
════════════════════
🔔 Follow for first-hand updates on market movements 🔔
#多周期共振 #PLTR
📌 When trading, watch whether the candlestick pattern matches
════════════════════
🟢 $PLTR 4-hour bearish signal
⚠️ Technicals: Bearish entry signal on the 4-hour chart, confirmed by bearish confluence on the daily chart. MACD has formed a bearish crossover below zero, with expanding green bars; moving averages are bearishly aligned and spreading downward; KDJ has formed a bearish crossover but is not yet oversold; volume has surged to 3.5 times its usual level. Short-term outlook is bearish.
════════════════════
🔔 Follow for first-hand updates on market movements 🔔
#多周期共振 #PLTR
📌 When trading, watch whether the candlestick pattern matches
2
·
--
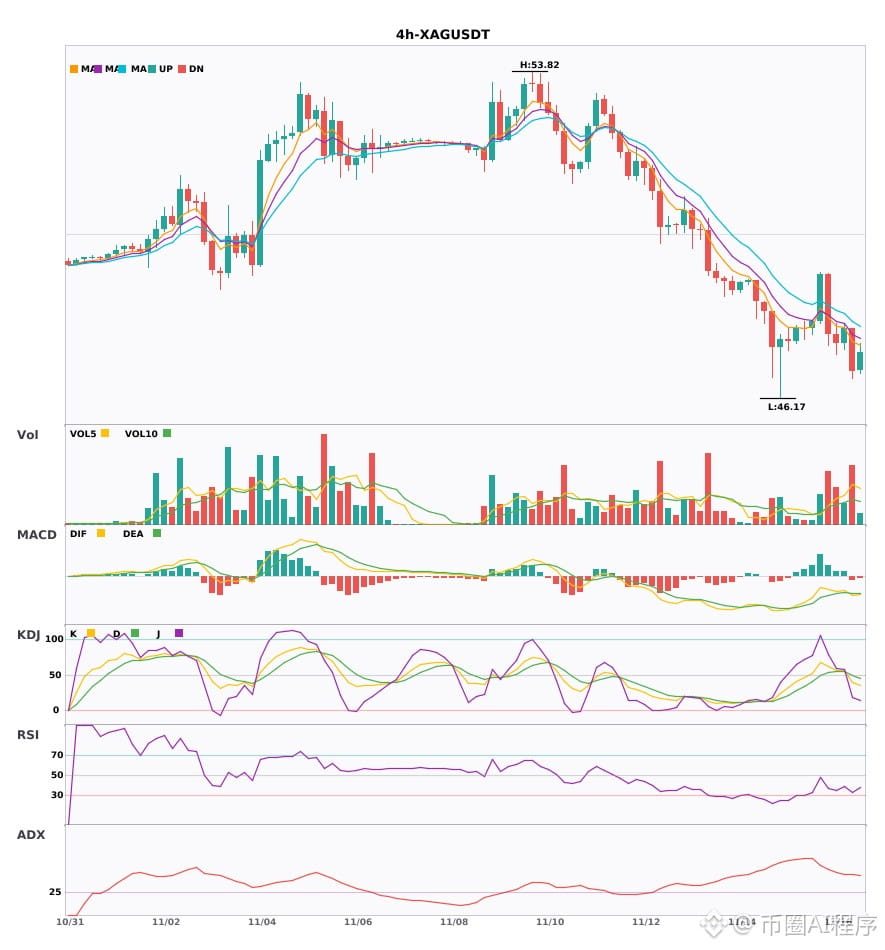
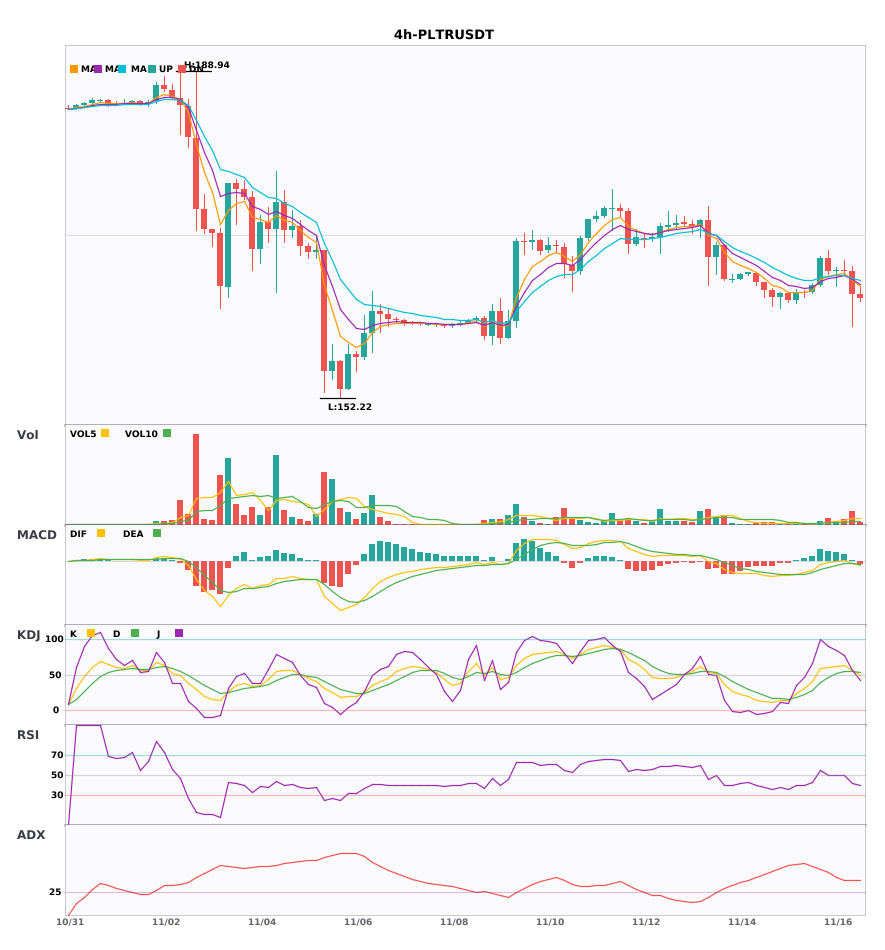
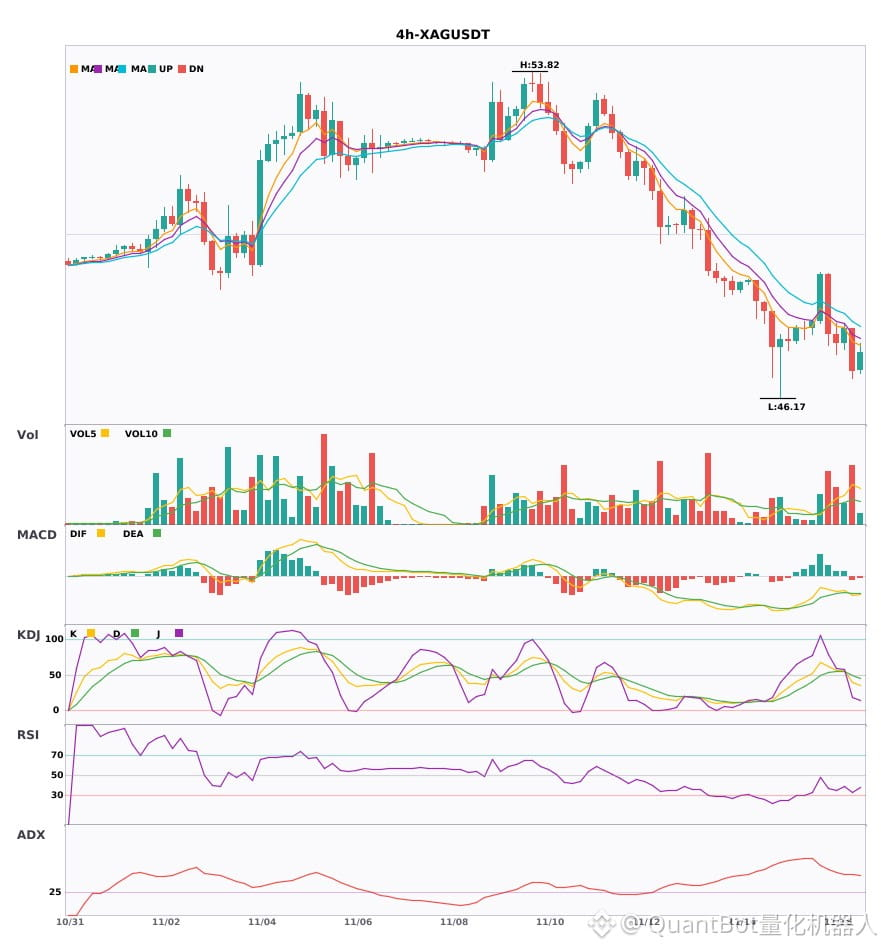
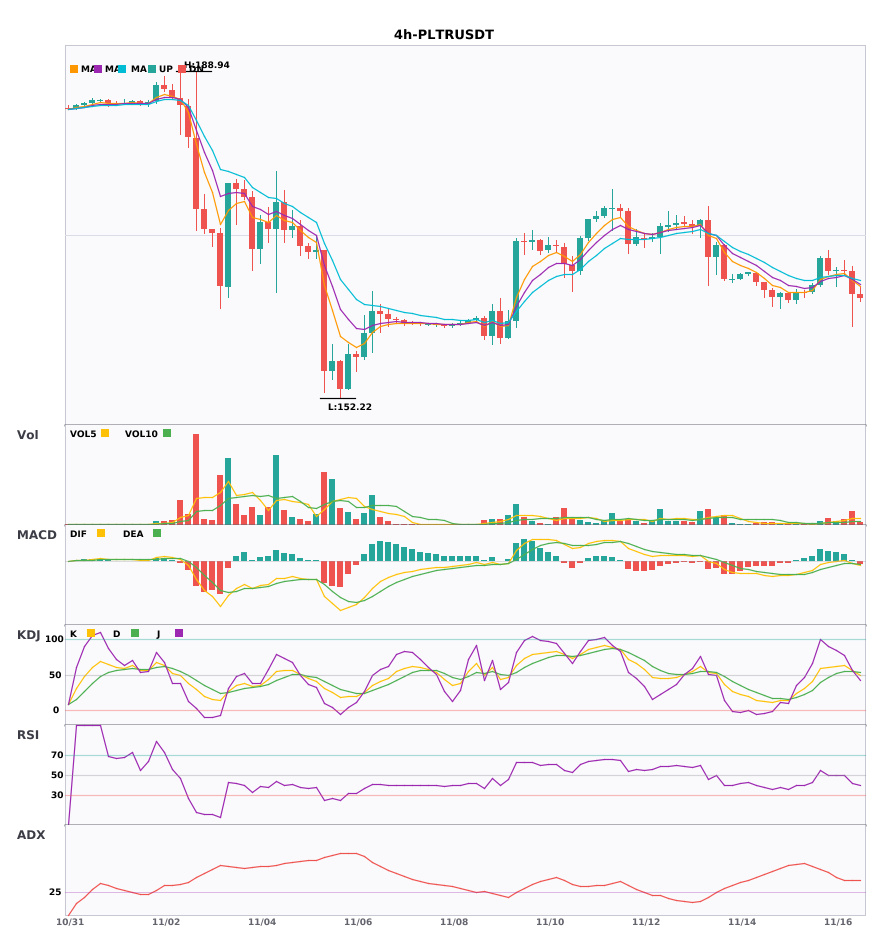
$XAG $ASTS $PLTR 4-hour and daily-chart confluence weakening—don't rush to buy the dip 🔥
════════════════════
🟢 $XAG 4-hour bearish signal
⚠️ Technical analysis: Daily bearish trend + 4-hour entry; multi-timeframe confluence! MACD bearish crossover accelerating, moving averages in bearish alignment and trending down, KDJ bearish crossover (K39.6/D49.9), trading volume up 2.3x
════════════════════
🟢 $ASTS 4-hour bearish signal
⚠️ Technical analysis: 4-hour and daily bearish confluence confirmed! MACD bearish crossover below zero with expanding green bars, moving averages in a diverging bearish alignment, KDJ weak as K crosses below D, volume up 2.5x.
════════════════════
🟢 $PLTR 4-hour bearish signal
⚠️ Technical analysis: 4-hour and daily bearish confluence confirmed! MACD crosses below the zero line and turns bearish, EMA5 crosses below EMA8, KDJ bearish crossover, volume up 3.5x—favoring the prevailing downtrend.
════════════════════
🔔 Follow for first-hand market alerts 🔔
#多周期共振 #XAG #ASTS #PLTR
📌 When trading, check whether the candlestick patterns align
$XAG $ASTS $PLTR 4-hour and daily-chart confluence weakening—don't rush to buy the dip 🔥
════════════════════
🟢 $XAG 4-hour bearish signal
⚠️ Technical analysis: Daily bearish trend + 4-hour entry; multi-timeframe confluence! MACD bearish crossover accelerating, moving averages in bearish alignment and trending down, KDJ bearish crossover (K39.6/D49.9), trading volume up 2.3x
════════════════════
🟢 $ASTS 4-hour bearish signal
⚠️ Technical analysis: 4-hour and daily bearish confluence confirmed! MACD bearish crossover below zero with expanding green bars, moving averages in a diverging bearish alignment, KDJ weak as K crosses below D, volume up 2.5x.
════════════════════
🟢 $PLTR 4-hour bearish signal
⚠️ Technical analysis: 4-hour and daily bearish confluence confirmed! MACD crosses below the zero line and turns bearish, EMA5 crosses below EMA8, KDJ bearish crossover, volume up 3.5x—favoring the prevailing downtrend.
════════════════════
🔔 Follow for first-hand market alerts 🔔
#多周期共振 #XAG #ASTS #PLTR
📌 When trading, check whether the candlestick patterns align
════════════════════
🟢 $XAG 4-hour bearish signal
⚠️ Technical analysis: Daily bearish trend + 4-hour entry; multi-timeframe confluence! MACD bearish crossover accelerating, moving averages in bearish alignment and trending down, KDJ bearish crossover (K39.6/D49.9), trading volume up 2.3x
════════════════════
🟢 $ASTS 4-hour bearish signal
⚠️ Technical analysis: 4-hour and daily bearish confluence confirmed! MACD bearish crossover below zero with expanding green bars, moving averages in a diverging bearish alignment, KDJ weak as K crosses below D, volume up 2.5x.
════════════════════
🟢 $PLTR 4-hour bearish signal
⚠️ Technical analysis: 4-hour and daily bearish confluence confirmed! MACD crosses below the zero line and turns bearish, EMA5 crosses below EMA8, KDJ bearish crossover, volume up 3.5x—favoring the prevailing downtrend.
════════════════════
🔔 Follow for first-hand market alerts 🔔
#多周期共振 #XAG #ASTS #PLTR
📌 When trading, check whether the candlestick patterns align
2

$XAG $ASTS $PLTR 4H Bearish signal confluence confirmed
📉 $XAG | 4-hour bearish signal
━━━━━━━━━━━━━━━━━━
Technical analysis: ADX(43) indicates a clear trend; MACD bearish crossover below zero, bearish momentum accelerating; EMA5<EMA8<EMA13 bearish alignment; KDJ bearish crossover (K39.6/D49.9), short-term outlook is bearish; trading volume up 2.3x.
Price change: -2.0700%
📉 $ASTS | 4-hour bearish signal
━━━━━━━━━━━━━━━━━━
Technical analysis: ADX(36) indicates a clear trend; MACD bearish crossover below zero, bearish momentum accelerating; EMA5<EMA8<EMA13 bearish alignment; KDJ weak (K31.3/D37.9); trading volume up 2.5x.
Price change: -3.0900%
📉 $PLTR | 4-hour bearish signal
━━━━━━━━━━━━━━━━━━
Technical analysis: ADX41 confirms a trending market; MACD DIF breaks below the zero line, turning bearish; EMA5/8 bearish crossover; KDJ strong (K56/D55.6); trading volume up 3.5x
Price change: -1.4900%
━━━━━━━━━━━━━━━━━━
#技术分析 #XAG #ASTS #PLTR
📌 The above is for reference only and does not constitute investment advice
$XAG $ASTS $PLTR 4H Bearish signal confluence confirmed
📉 $XAG | 4-hour bearish signal
━━━━━━━━━━━━━━━━━━
Technical analysis: ADX(43) indicates a clear trend; MACD bearish crossover below zero, bearish momentum accelerating; EMA5<EMA8<EMA13 bearish alignment; KDJ bearish crossover (K39.6/D49.9), short-term outlook is bearish; trading volume up 2.3x.
Price change: -2.0700%
📉 $ASTS | 4-hour bearish signal
━━━━━━━━━━━━━━━━━━
Technical analysis: ADX(36) indicates a clear trend; MACD bearish crossover below zero, bearish momentum accelerating; EMA5<EMA8<EMA13 bearish alignment; KDJ weak (K31.3/D37.9); trading volume up 2.5x.
Price change: -3.0900%
📉 $PLTR | 4-hour bearish signal
━━━━━━━━━━━━━━━━━━
Technical analysis: ADX41 confirms a trending market; MACD DIF breaks below the zero line, turning bearish; EMA5/8 bearish crossover; KDJ strong (K56/D55.6); trading volume up 3.5x
Price change: -1.4900%
━━━━━━━━━━━━━━━━━━
#技术分析 #XAG #ASTS #PLTR
📌 The above is for reference only and does not constitute investment advice
📉 $XAG | 4-hour bearish signal
━━━━━━━━━━━━━━━━━━
Technical analysis: ADX(43) indicates a clear trend; MACD bearish crossover below zero, bearish momentum accelerating; EMA5<EMA8<EMA13 bearish alignment; KDJ bearish crossover (K39.6/D49.9), short-term outlook is bearish; trading volume up 2.3x.
Price change: -2.0700%
📉 $ASTS | 4-hour bearish signal
━━━━━━━━━━━━━━━━━━
Technical analysis: ADX(36) indicates a clear trend; MACD bearish crossover below zero, bearish momentum accelerating; EMA5<EMA8<EMA13 bearish alignment; KDJ weak (K31.3/D37.9); trading volume up 2.5x.
Price change: -3.0900%
📉 $PLTR | 4-hour bearish signal
━━━━━━━━━━━━━━━━━━
Technical analysis: ADX41 confirms a trending market; MACD DIF breaks below the zero line, turning bearish; EMA5/8 bearish crossover; KDJ strong (K56/D55.6); trading volume up 3.5x
Price change: -1.4900%
━━━━━━━━━━━━━━━━━━
#技术分析 #XAG #ASTS #PLTR
📌 The above is for reference only and does not constitute investment advice
11
·
--
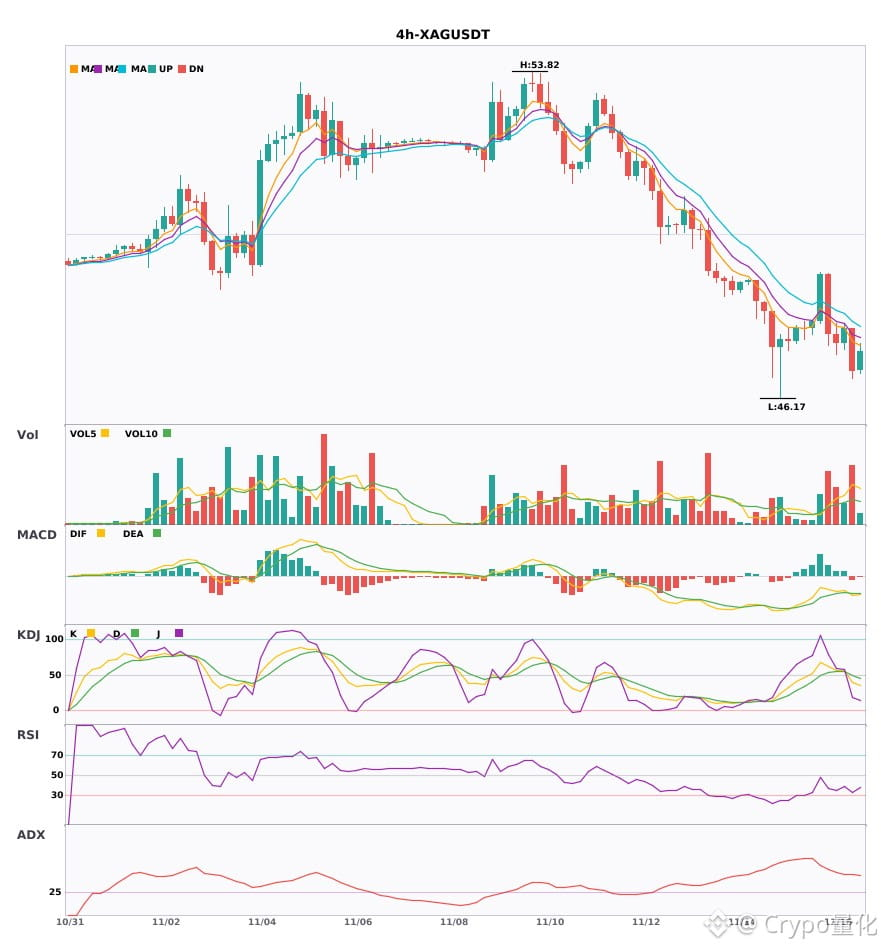
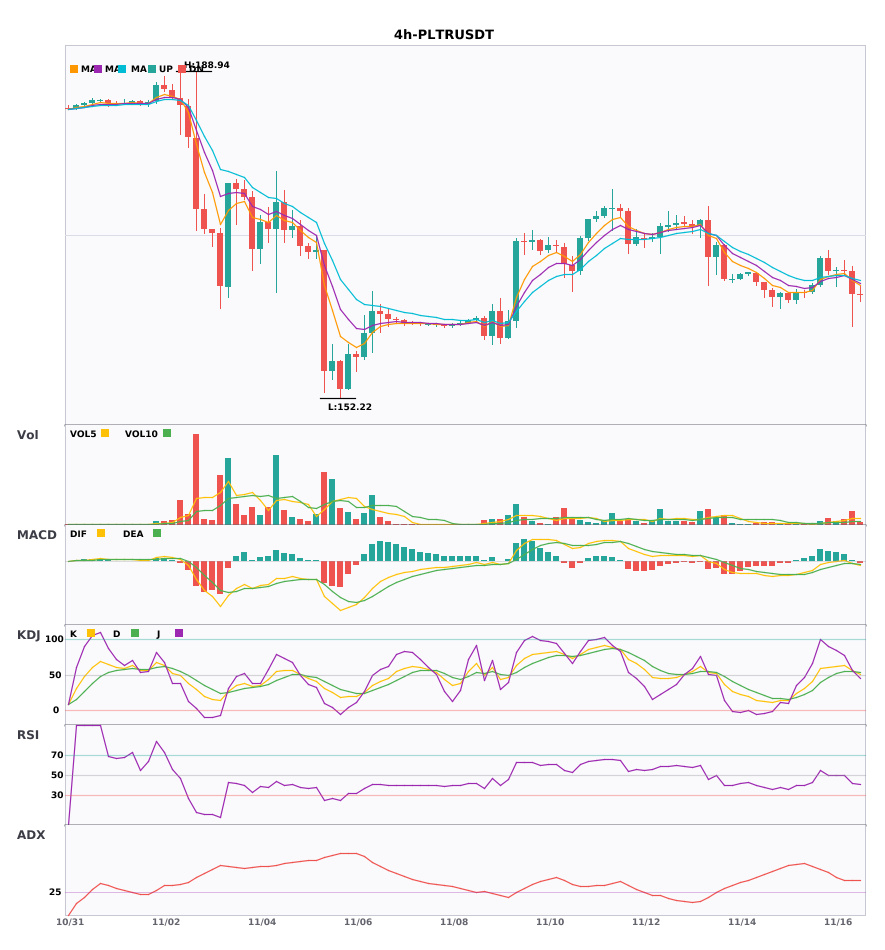
$XAG/$ASTS/$PLTR 4-hour trend starts weakening, under short-term pressure🔥
════════════════════
🟢 $XAG 4-hour bearish signal
⚠️Technical analysis: ADX (43) shows a clear trend; the MACD bearish death cross below zero is accelerating; moving averages are bearishly aligned and trending downward; KDJ has formed a death cross but is not yet oversold, suggesting a short-term bearish bias. Trading volume is up 2.3x.
════════════════════
🟢 $ASTS 4-hour bearish signal
⚠️Technical analysis: ADX shows a clear trend; the MACD bearish death cross below zero is accelerating; moving averages are diverging bearishly; KDJ is weak (K31.3 D37.9), with volume surging 2.5x.
════════════════════
🟢 $PLTR 4-hour bearish signal
⚠️Technical analysis: ADX (41) shows a very strong trend; the MACD green bars are growing; short-term moving averages have formed a bearish death cross, but K in KDJ has just crossed above D and is not overbought. Volume is up 3.5x.
════════════════════
🔔 Follow for first-hand market updates 🔔
#技术分析 #XAG #ASTS #PLTR
📌 When trading, pay attention to whether the candlestick pattern aligns with expectations.
$XAG /$ASTS /$PLTR 4-hour trend starts weakening, under short-term pressure🔥
════════════════════
🟢 $XAG 4-hour bearish signal
⚠️Technical analysis: ADX (43) shows a clear trend; the MACD bearish death cross below zero is accelerating; moving averages are bearishly aligned and trending downward; KDJ has formed a death cross but is not yet oversold, suggesting a short-term bearish bias. Trading volume is up 2.3x.
════════════════════
🟢 $ASTS 4-hour bearish signal
⚠️Technical analysis: ADX shows a clear trend; the MACD bearish death cross below zero is accelerating; moving averages are diverging bearishly; KDJ is weak (K31.3 D37.9), with volume surging 2.5x.
════════════════════
🟢 $PLTR 4-hour bearish signal
⚠️Technical analysis: ADX (41) shows a very strong trend; the MACD green bars are growing; short-term moving averages have formed a bearish death cross, but K in KDJ has just crossed above D and is not overbought. Volume is up 3.5x.
════════════════════
🔔 Follow for first-hand market updates 🔔
#技术分析 #XAG #ASTS #PLTR
📌 When trading, pay attention to whether the candlestick pattern aligns with expectations.
════════════════════
🟢 $XAG 4-hour bearish signal
⚠️Technical analysis: ADX (43) shows a clear trend; the MACD bearish death cross below zero is accelerating; moving averages are bearishly aligned and trending downward; KDJ has formed a death cross but is not yet oversold, suggesting a short-term bearish bias. Trading volume is up 2.3x.
════════════════════
🟢 $ASTS 4-hour bearish signal
⚠️Technical analysis: ADX shows a clear trend; the MACD bearish death cross below zero is accelerating; moving averages are diverging bearishly; KDJ is weak (K31.3 D37.9), with volume surging 2.5x.
════════════════════
🟢 $PLTR 4-hour bearish signal
⚠️Technical analysis: ADX (41) shows a very strong trend; the MACD green bars are growing; short-term moving averages have formed a bearish death cross, but K in KDJ has just crossed above D and is not overbought. Volume is up 3.5x.
════════════════════
🔔 Follow for first-hand market updates 🔔
#技术分析 #XAG #ASTS #PLTR
📌 When trading, pay attention to whether the candlestick pattern aligns with expectations.
2

·
--
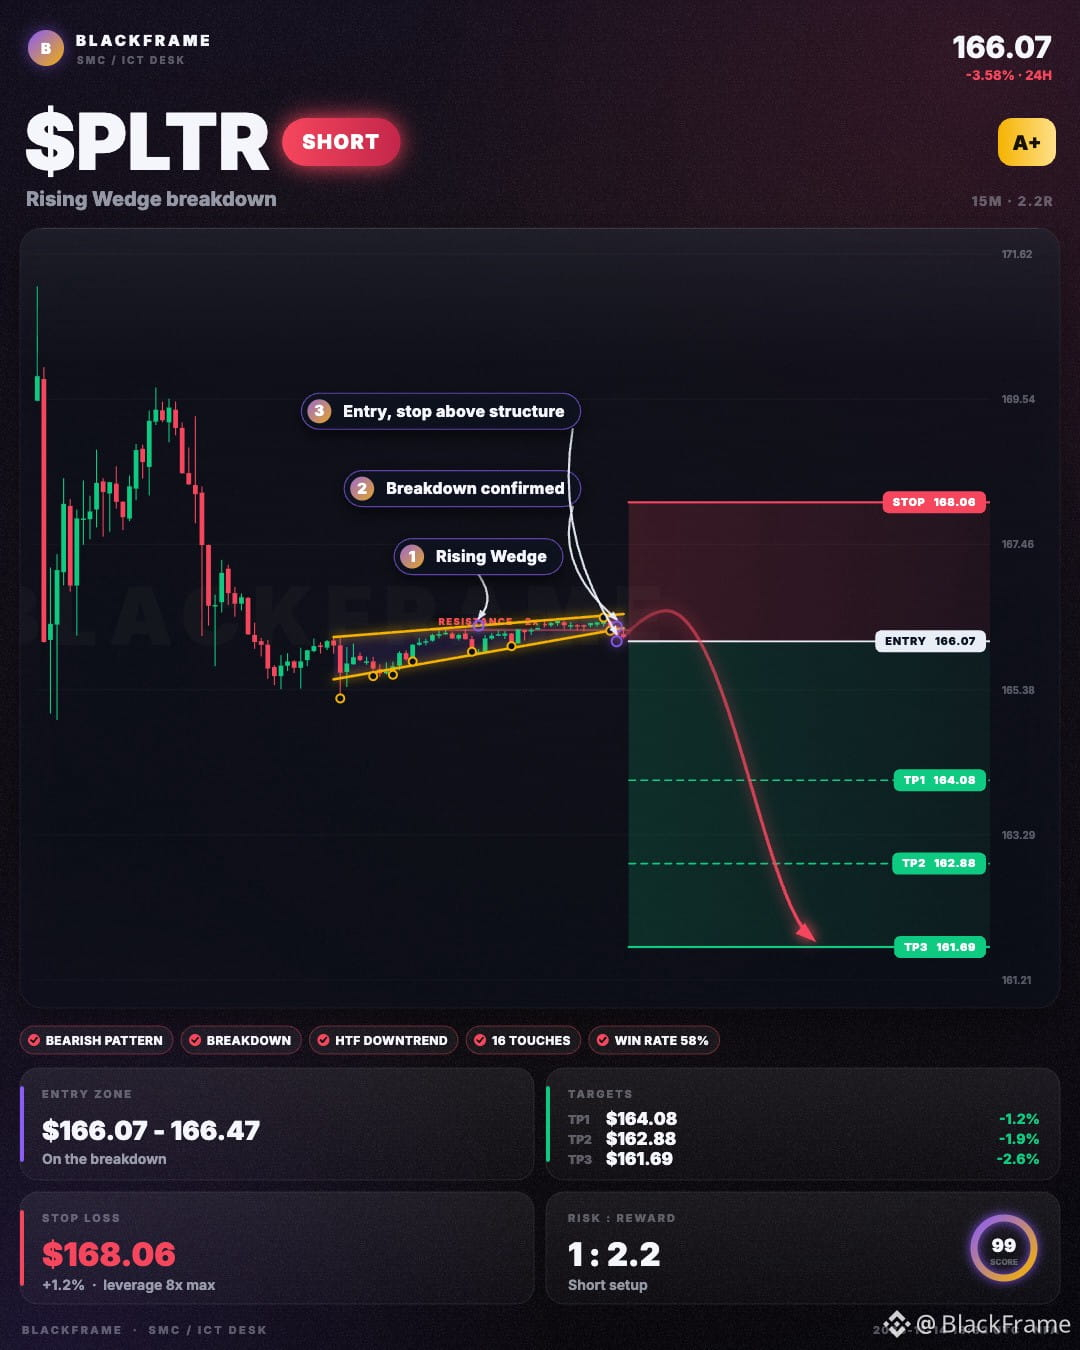
🩸 $PLTR just lost the floor
SHORT · 15M
Entry: $166.07 - $166.57
TP1: $164.08
TP2: $162.88
TP3: $161.69
SL: $168.06
A rising wedge has formed on the 15M, tested 16 times on its lines. Price broke down below the pattern and is holding. The higher timeframe trend agrees, and the target is the measured move of the pattern.
#PLTR #CryptoTrading #Trading · NFA
🩸 $PLTR just lost the floor
SHORT · 15M
Entry: $166.07 - $166.57
TP1: $164.08
TP2: $162.88
TP3: $161.69
SL: $168.06
A rising wedge has formed on the 15M, tested 16 times on its lines. Price broke down below the pattern and is holding. The higher timeframe trend agrees, and the target is the measured move of the pattern.
#PLTR #CryptoTrading #Trading · NFA
SHORT · 15M
Entry: $166.07 - $166.57
TP1: $164.08
TP2: $162.88
TP3: $161.69
SL: $168.06
A rising wedge has formed on the 15M, tested 16 times on its lines. Price broke down below the pattern and is holding. The higher timeframe trend agrees, and the target is the measured move of the pattern.
#PLTR #CryptoTrading #Trading · NFA
45
·
--
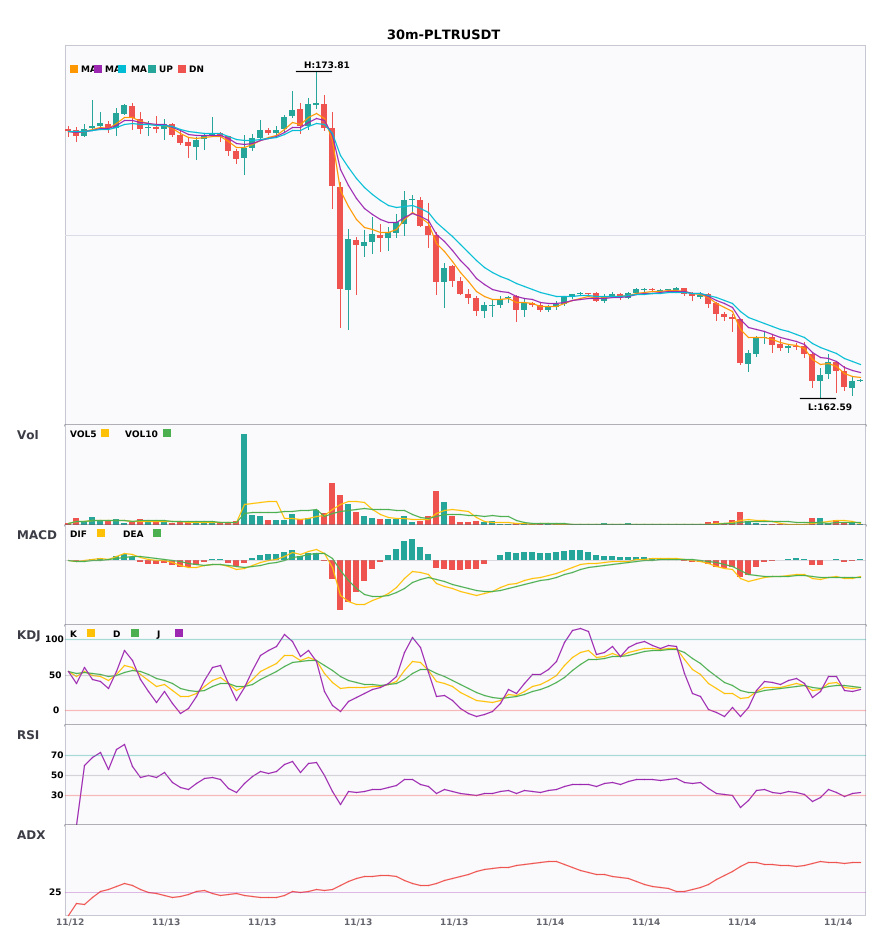
$PLTR / $BULLA 30-minute weakness, with 4-hour bearish confluence 🔥
════════════════════
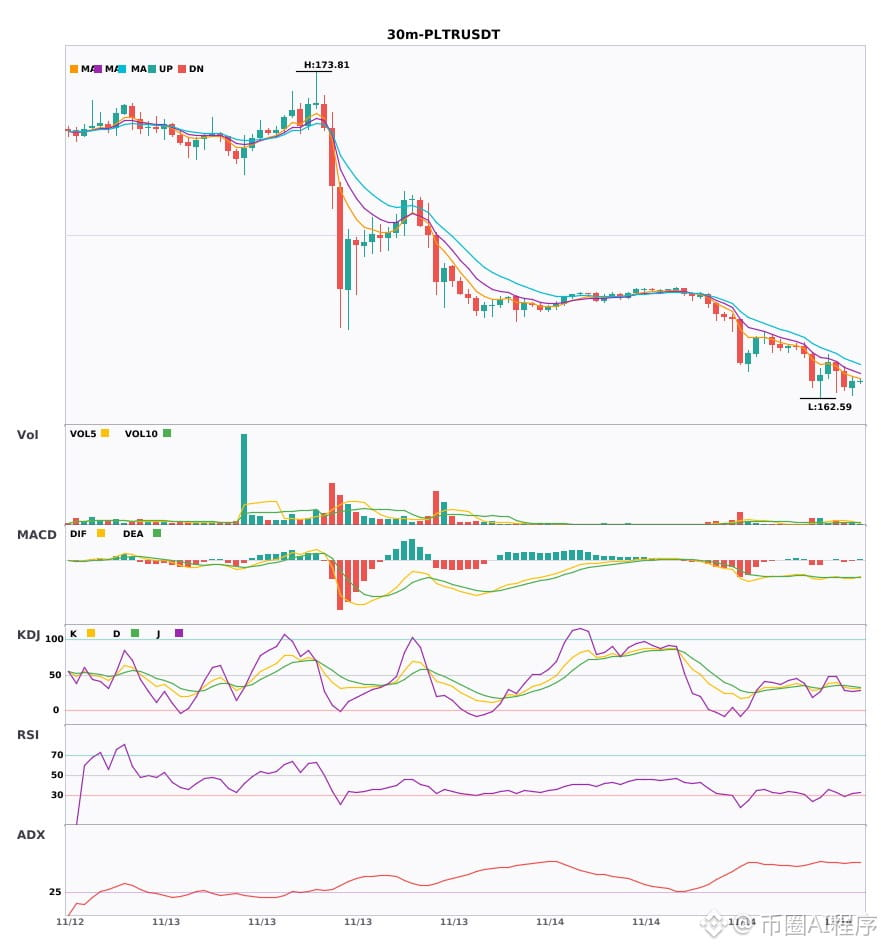
🟢 $PLTR 30-minute bearish signal
⚠️ Technical analysis: 4-hour and 30-minute bearish confluence confirmed! The 30-minute MACD has formed a bearish crossover with rising volume, and bearish momentum is accelerating. The moving averages are bearishly aligned and spreading downward. KDJ has just formed a bearish crossover and is not yet oversold. Volume has increased 2.1x.
════════════════════
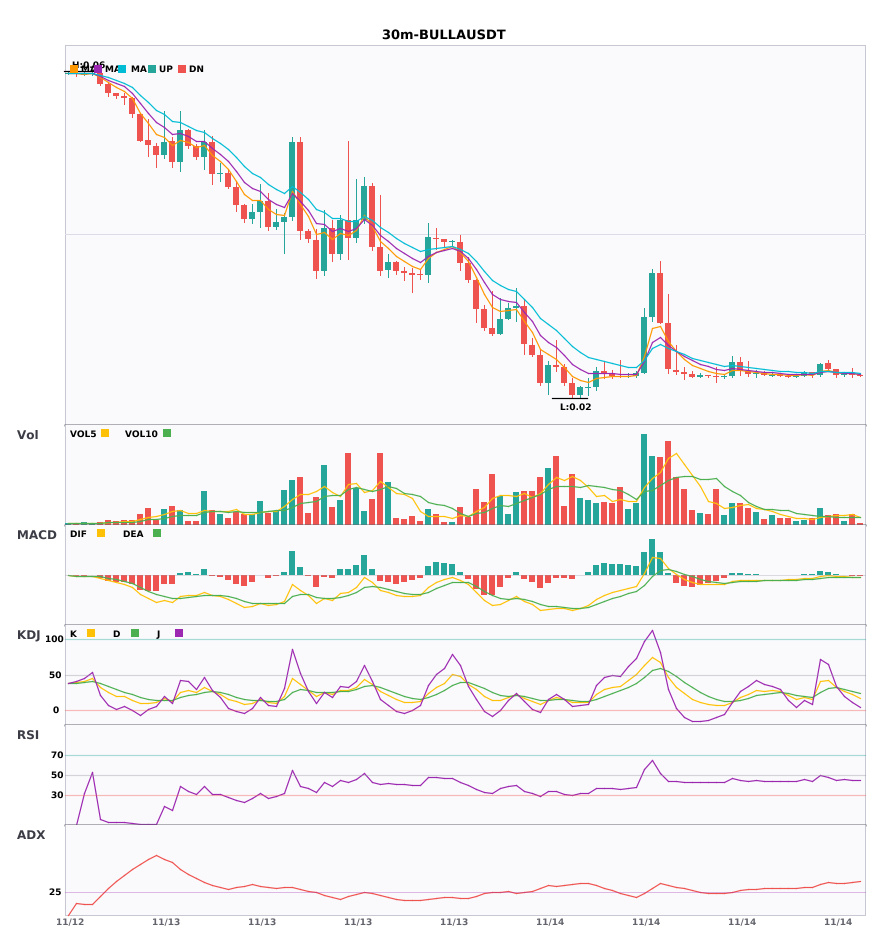
🟢 $BULLA 30-minute bearish signal
⚠️ Technical analysis: 4-hour and 30-minute bearish confluence confirmed! The 30-minute MACD has formed a bearish crossover, with bearish momentum accelerating. The moving averages are bearishly aligned and spreading downward. KDJ is moving weakly, with K crossing below D. Volume is normal at 1.3x.
════════════════════
🔔 Follow to get first-hand market movement alerts 🔔
#多周期共振 #PLTR #BULLA
📌 When trading, pay attention to whether the candlestick patterns match
$PLTR / $BULLA 30-minute weakness, with 4-hour bearish confluence 🔥
════════════════════
🟢 $PLTR 30-minute bearish signal
⚠️ Technical analysis: 4-hour and 30-minute bearish confluence confirmed! The 30-minute MACD has formed a bearish crossover with rising volume, and bearish momentum is accelerating. The moving averages are bearishly aligned and spreading downward. KDJ has just formed a bearish crossover and is not yet oversold. Volume has increased 2.1x.
════════════════════
🟢 $BULLA 30-minute bearish signal
⚠️ Technical analysis: 4-hour and 30-minute bearish confluence confirmed! The 30-minute MACD has formed a bearish crossover, with bearish momentum accelerating. The moving averages are bearishly aligned and spreading downward. KDJ is moving weakly, with K crossing below D. Volume is normal at 1.3x.
════════════════════
🔔 Follow to get first-hand market movement alerts 🔔
#多周期共振 #PLTR #BULLA
📌 When trading, pay attention to whether the candlestick patterns match
════════════════════
🟢 $PLTR 30-minute bearish signal
⚠️ Technical analysis: 4-hour and 30-minute bearish confluence confirmed! The 30-minute MACD has formed a bearish crossover with rising volume, and bearish momentum is accelerating. The moving averages are bearishly aligned and spreading downward. KDJ has just formed a bearish crossover and is not yet oversold. Volume has increased 2.1x.
════════════════════
🟢 $BULLA 30-minute bearish signal
⚠️ Technical analysis: 4-hour and 30-minute bearish confluence confirmed! The 30-minute MACD has formed a bearish crossover, with bearish momentum accelerating. The moving averages are bearishly aligned and spreading downward. KDJ is moving weakly, with K crossing below D. Volume is normal at 1.3x.
════════════════════
🔔 Follow to get first-hand market movement alerts 🔔
#多周期共振 #PLTR #BULLA
📌 When trading, pay attention to whether the candlestick patterns match
12
$PLTR 30-minute bearish warning signal issued
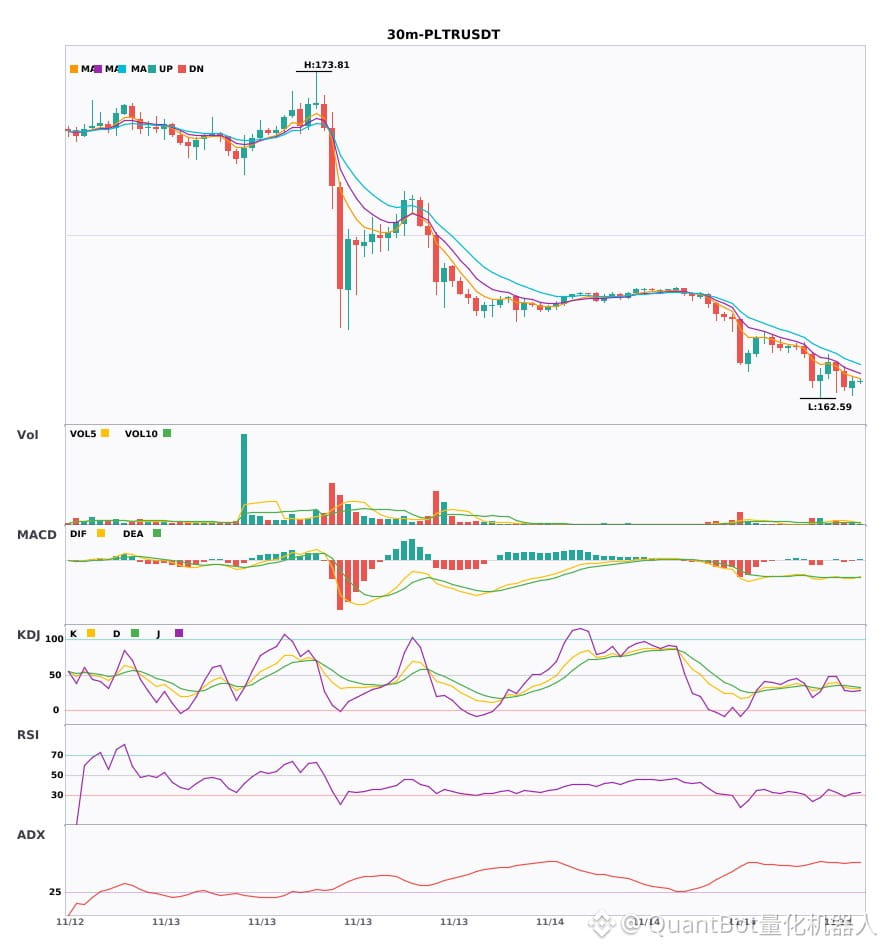
📉 $PLTR | 30-minute bearish signal
━━━━━━━━━━━━━━━━━━
Technical analysis: ADX (57) indicates an extremely strong trend; beware of an overbought pullback. MACD has formed a death cross below zero, accelerating bearish momentum. EMA5<EMA8<EMA13 are bearishly aligned. KDJ has formed a death cross, indicating a short-term bearish bias (K32.6, D34.8). Trading volume increased 2.1 times.
Price change: -0.3400%
━━━━━━━━━━━━━━━━━━
#技术分析 #PLTR
📌 The above content is for reference only and does not constitute investment advice
$PLTR 30-minute bearish warning signal issued
📉 $PLTR | 30-minute bearish signal
━━━━━━━━━━━━━━━━━━
Technical analysis: ADX (57) indicates an extremely strong trend; beware of an overbought pullback. MACD has formed a death cross below zero, accelerating bearish momentum. EMA5<EMA8<EMA13 are bearishly aligned. KDJ has formed a death cross, indicating a short-term bearish bias (K32.6, D34.8). Trading volume increased 2.1 times.
Price change: -0.3400%
━━━━━━━━━━━━━━━━━━
#技术分析 #PLTR
📌 The above content is for reference only and does not constitute investment advice
📉 $PLTR | 30-minute bearish signal
━━━━━━━━━━━━━━━━━━
Technical analysis: ADX (57) indicates an extremely strong trend; beware of an overbought pullback. MACD has formed a death cross below zero, accelerating bearish momentum. EMA5<EMA8<EMA13 are bearishly aligned. KDJ has formed a death cross, indicating a short-term bearish bias (K32.6, D34.8). Trading volume increased 2.1 times.
Price change: -0.3400%
━━━━━━━━━━━━━━━━━━
#技术分析 #PLTR
📌 The above content is for reference only and does not constitute investment advice
11
·
--
$PLTR 30-minute bearish outlook; short-term pressure—don't rush to buy the dip 🔥
════════════════════
🟢 $PLTR 30-minute bearish signal
⚠️ Technicals: ADX 57—the trend is very strong, but don't chase; beware of a pullback after overheating. MACD has formed a death cross below zero, and bearish momentum is accelerating. All moving averages are in bearish alignment and trending downward. KDJ has formed a downward death cross, indicating a short-term bearish outlook. Trading volume has more than doubled.
════════════════════
🔔 Follow for first-hand market updates 🔔
#技术分析 #PLTR
📌 When trading, pay attention to whether the candlestick pattern confirms the setup.
$PLTR 30-minute bearish outlook; short-term pressure—don't rush to buy the dip 🔥
════════════════════
🟢 $PLTR 30-minute bearish signal
⚠️ Technicals: ADX 57—the trend is very strong, but don't chase; beware of a pullback after overheating. MACD has formed a death cross below zero, and bearish momentum is accelerating. All moving averages are in bearish alignment and trending downward. KDJ has formed a downward death cross, indicating a short-term bearish outlook. Trading volume has more than doubled.
════════════════════
🔔 Follow for first-hand market updates 🔔
#技术分析 #PLTR
📌 When trading, pay attention to whether the candlestick pattern confirms the setup.
════════════════════
🟢 $PLTR 30-minute bearish signal
⚠️ Technicals: ADX 57—the trend is very strong, but don't chase; beware of a pullback after overheating. MACD has formed a death cross below zero, and bearish momentum is accelerating. All moving averages are in bearish alignment and trending downward. KDJ has formed a downward death cross, indicating a short-term bearish outlook. Trading volume has more than doubled.
════════════════════
🔔 Follow for first-hand market updates 🔔
#技术分析 #PLTR
📌 When trading, pay attention to whether the candlestick pattern confirms the setup.
6
·
--
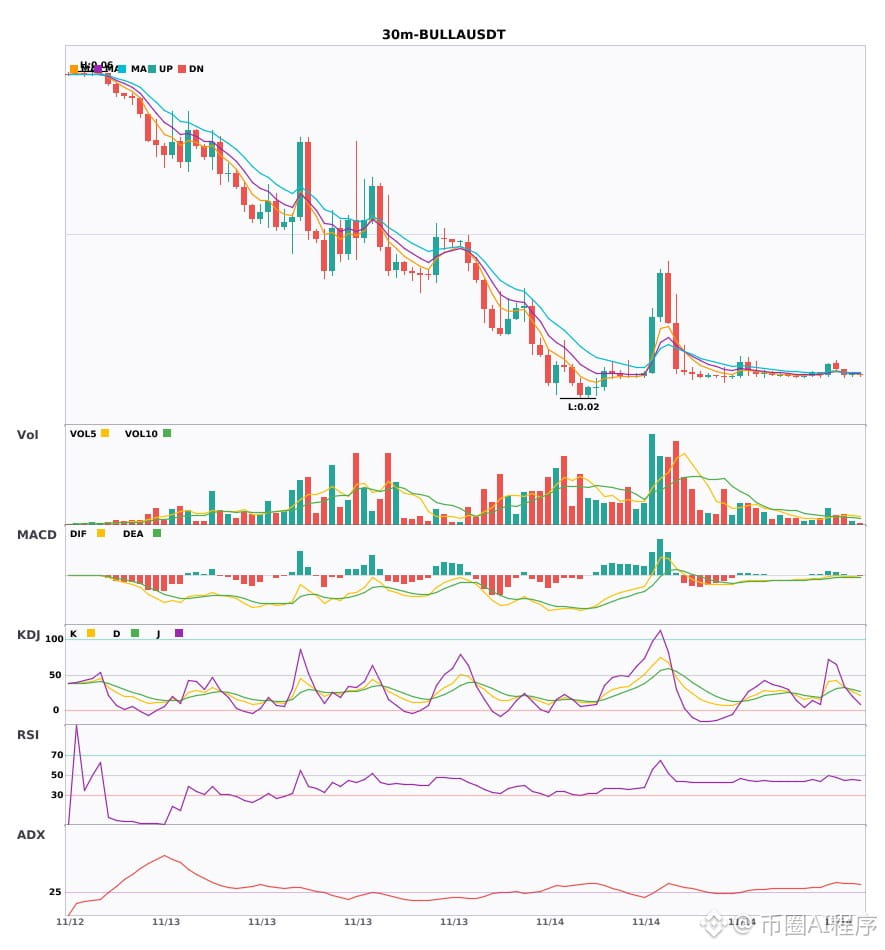
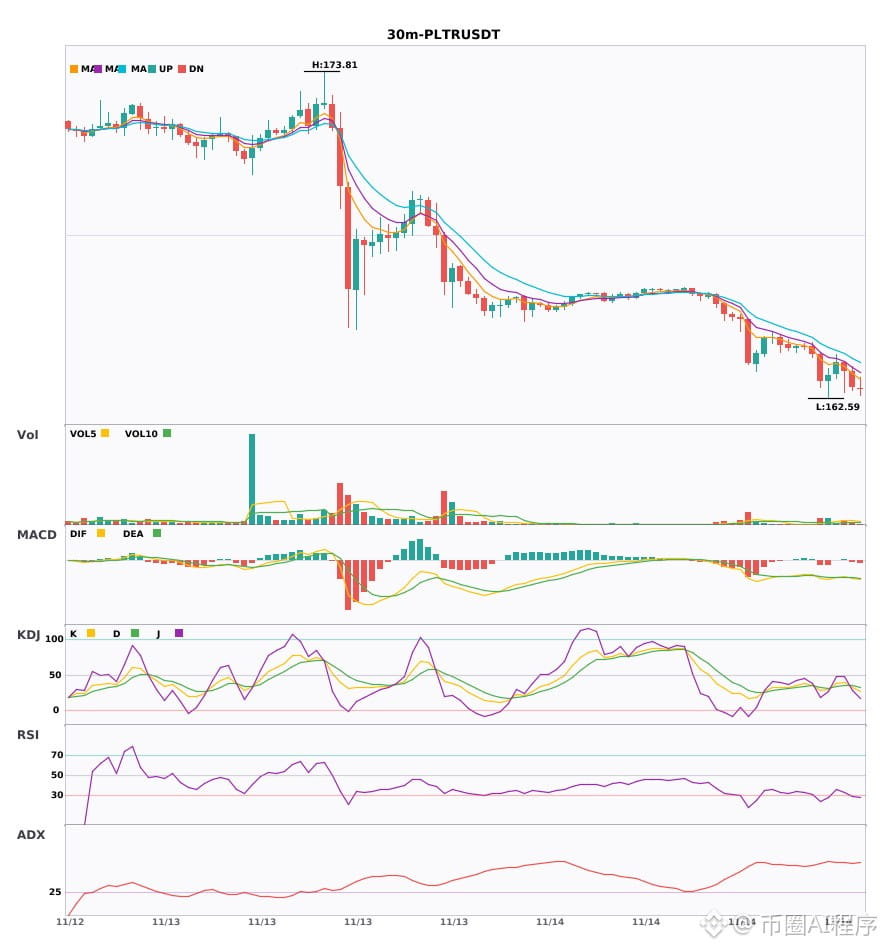
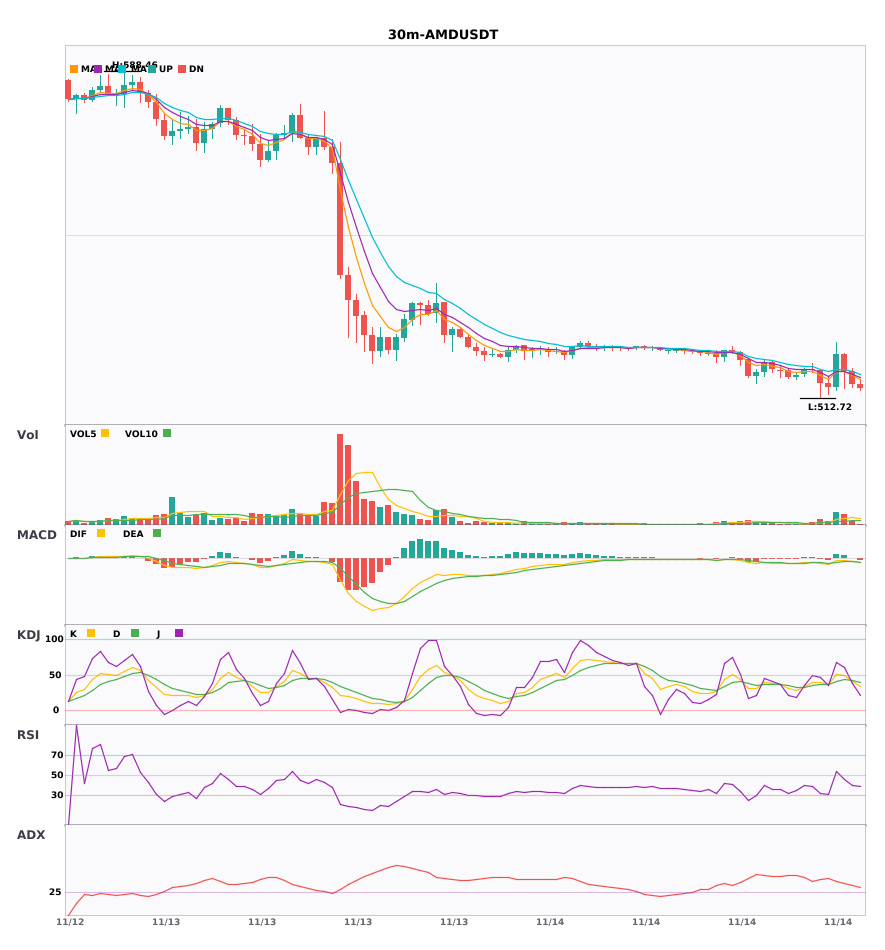
Multi-timeframe confluence across 3 currencies—both the 30-minute and 4-hour charts are bearish 🔥
════════════════════
🟢 $BULLA 30-minute bearish signal
⚠️Technical analysis: 30-minute + 4-hour multi-timeframe confluence for a short: On the 30-minute chart, EMA5 crosses below EMA8, forming a bearish crossover; KDJ also crosses bearishly, with the K and D lines trending down. Volume expands by 1.3x, and the 4-hour bearish confluence is confirmed.
════════════════════
🟢 $PLTR 30-minute bearish signal
⚠️Technical analysis: 4-hour bearish trend + 30-minute confluence confirmed! MACD forms a bearish crossover with expanding volume and larger green bars; moving averages are bearishly aligned; KDJ has crossed bearishly but is not oversold. Short-term outlook is bearish.
════════════════════
🟢 $AMD 30-minute bearish signal
⚠️Multi-timeframe confluence! The 30-minute MACD forms a bearish crossover below zero with expanding volume + the 4-hour bearish trend is confirmed. Moving averages are bearishly aligned; KDJ has crossed down but is not in oversold territory. Volume surges by 2.6x. Bearish outlook.
════════════════════
🔔 Follow for first-hand market updates 🔔
#多周期共振 #BULLA #PLTR #AMD
📌 When trading, pay attention to whether the candlestick patterns align.
Multi-timeframe confluence across 3 currencies—both the 30-minute and 4-hour charts are bearish 🔥
════════════════════
🟢 $BULLA 30-minute bearish signal
⚠️Technical analysis: 30-minute + 4-hour multi-timeframe confluence for a short: On the 30-minute chart, EMA5 crosses below EMA8, forming a bearish crossover; KDJ also crosses bearishly, with the K and D lines trending down. Volume expands by 1.3x, and the 4-hour bearish confluence is confirmed.
════════════════════
🟢 $PLTR 30-minute bearish signal
⚠️Technical analysis: 4-hour bearish trend + 30-minute confluence confirmed! MACD forms a bearish crossover with expanding volume and larger green bars; moving averages are bearishly aligned; KDJ has crossed bearishly but is not oversold. Short-term outlook is bearish.
════════════════════
🟢 $AMD 30-minute bearish signal
⚠️Multi-timeframe confluence! The 30-minute MACD forms a bearish crossover below zero with expanding volume + the 4-hour bearish trend is confirmed. Moving averages are bearishly aligned; KDJ has crossed down but is not in oversold territory. Volume surges by 2.6x. Bearish outlook.
════════════════════
🔔 Follow for first-hand market updates 🔔
#多周期共振 #BULLA #PLTR #AMD
📌 When trading, pay attention to whether the candlestick patterns align.
════════════════════
🟢 $BULLA 30-minute bearish signal
⚠️Technical analysis: 30-minute + 4-hour multi-timeframe confluence for a short: On the 30-minute chart, EMA5 crosses below EMA8, forming a bearish crossover; KDJ also crosses bearishly, with the K and D lines trending down. Volume expands by 1.3x, and the 4-hour bearish confluence is confirmed.
════════════════════
🟢 $PLTR 30-minute bearish signal
⚠️Technical analysis: 4-hour bearish trend + 30-minute confluence confirmed! MACD forms a bearish crossover with expanding volume and larger green bars; moving averages are bearishly aligned; KDJ has crossed bearishly but is not oversold. Short-term outlook is bearish.
════════════════════
🟢 $AMD 30-minute bearish signal
⚠️Multi-timeframe confluence! The 30-minute MACD forms a bearish crossover below zero with expanding volume + the 4-hour bearish trend is confirmed. Moving averages are bearishly aligned; KDJ has crossed down but is not in oversold territory. Volume surges by 2.6x. Bearish outlook.
════════════════════
🔔 Follow for first-hand market updates 🔔
#多周期共振 #BULLA #PLTR #AMD
📌 When trading, pay attention to whether the candlestick patterns align.
7
·
--
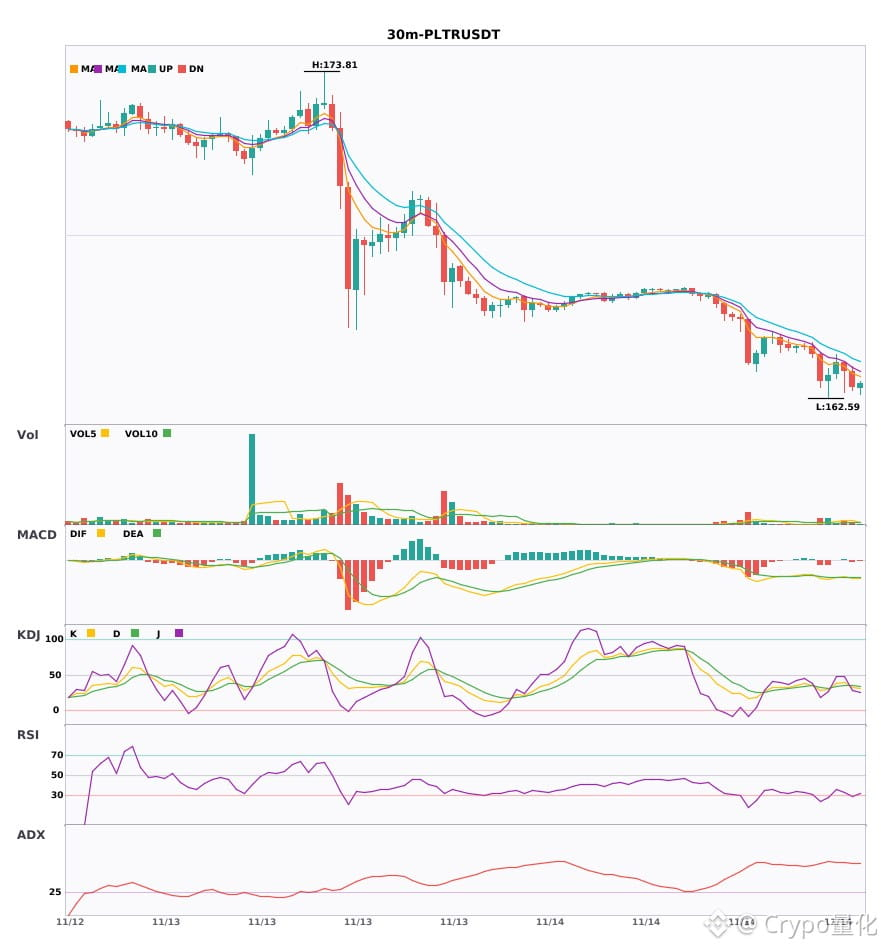
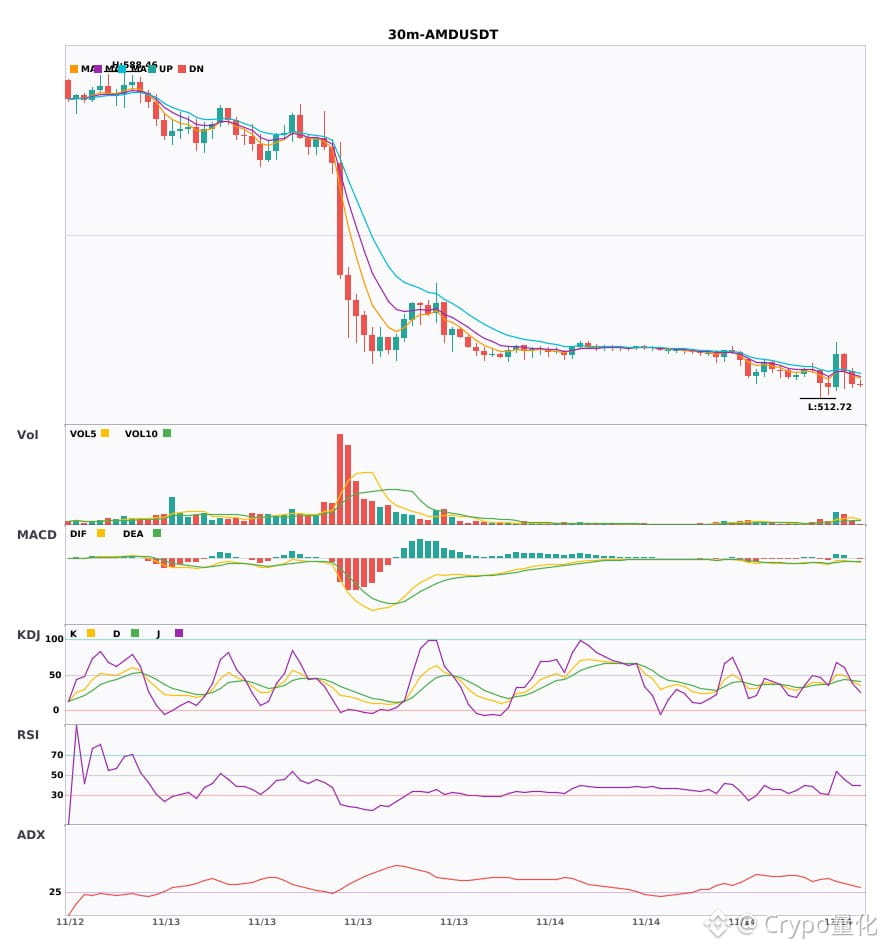
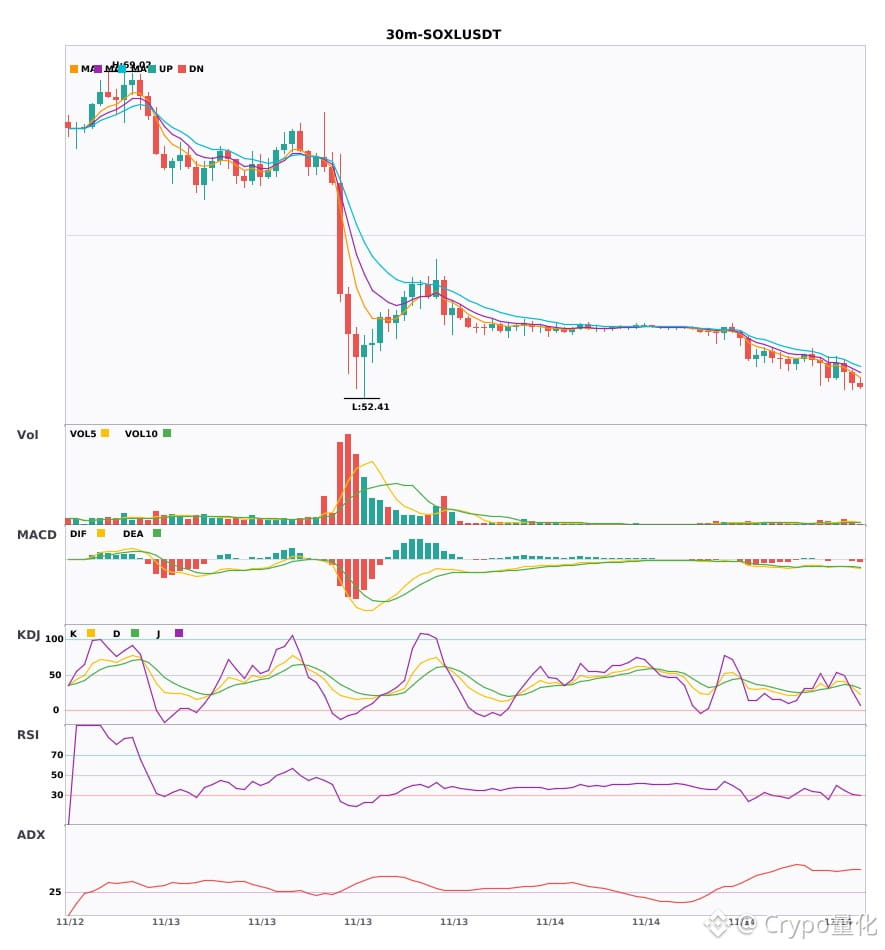
$PLTR $AMD $SOXL 30-minute death cross, expanding green bars; the moving averages have just formed a bearish alignment in unison 🔥
════════════════════
🟢 $PLTR 30-minute bearish signal
⚠️Technical analysis: ADX 57, very strong trend, but beware of overheating and a pullback | MACD death cross with rising volume and expanding green bars | Bearish moving-average alignment | KDJ death cross | Volume up 2.1x
════════════════════
🟢 $AMD 30-minute bearish signal
⚠️Technical analysis: ADX 33, clear trend; MACD death cross below zero with rising volume, bearish momentum accelerating. Moving averages have just formed a bearish alignment; KDJ death cross, not yet oversold. No chance of K crossing above D. Trading volume up 2.6x; bearish in the short term.
════════════════════
🟢 $SOXL 30-minute bearish signal
⚠️Technical analysis: ADX indicates a very strong trend, but beware of a pullback. MACD death cross; bearish momentum is accelerating. Moving averages are bearishly aligned and pointing down. KDJ death cross, not yet oversold. Volume up 2.4x; bearish bias in the short term.
════════════════════
🔔 Follow for first-hand market movement updates 🔔
#技术分析 #PLTR #AMD #SOXL
📌 When trading, pay attention to whether the candlestick pattern confirms the signal.
$PLTR $AMD $SOXL 30-minute death cross, expanding green bars; the moving averages have just formed a bearish alignment in unison 🔥
════════════════════
🟢 $PLTR 30-minute bearish signal
⚠️Technical analysis: ADX 57, very strong trend, but beware of overheating and a pullback | MACD death cross with rising volume and expanding green bars | Bearish moving-average alignment | KDJ death cross | Volume up 2.1x
════════════════════
🟢 $AMD 30-minute bearish signal
⚠️Technical analysis: ADX 33, clear trend; MACD death cross below zero with rising volume, bearish momentum accelerating. Moving averages have just formed a bearish alignment; KDJ death cross, not yet oversold. No chance of K crossing above D. Trading volume up 2.6x; bearish in the short term.
════════════════════
🟢 $SOXL 30-minute bearish signal
⚠️Technical analysis: ADX indicates a very strong trend, but beware of a pullback. MACD death cross; bearish momentum is accelerating. Moving averages are bearishly aligned and pointing down. KDJ death cross, not yet oversold. Volume up 2.4x; bearish bias in the short term.
════════════════════
🔔 Follow for first-hand market movement updates 🔔
#技术分析 #PLTR #AMD #SOXL
📌 When trading, pay attention to whether the candlestick pattern confirms the signal.
════════════════════
🟢 $PLTR 30-minute bearish signal
⚠️Technical analysis: ADX 57, very strong trend, but beware of overheating and a pullback | MACD death cross with rising volume and expanding green bars | Bearish moving-average alignment | KDJ death cross | Volume up 2.1x
════════════════════
🟢 $AMD 30-minute bearish signal
⚠️Technical analysis: ADX 33, clear trend; MACD death cross below zero with rising volume, bearish momentum accelerating. Moving averages have just formed a bearish alignment; KDJ death cross, not yet oversold. No chance of K crossing above D. Trading volume up 2.6x; bearish in the short term.
════════════════════
🟢 $SOXL 30-minute bearish signal
⚠️Technical analysis: ADX indicates a very strong trend, but beware of a pullback. MACD death cross; bearish momentum is accelerating. Moving averages are bearishly aligned and pointing down. KDJ death cross, not yet oversold. Volume up 2.4x; bearish bias in the short term.
════════════════════
🔔 Follow for first-hand market movement updates 🔔
#技术分析 #PLTR #AMD #SOXL
📌 When trading, pay attention to whether the candlestick pattern confirms the signal.
20
·
--
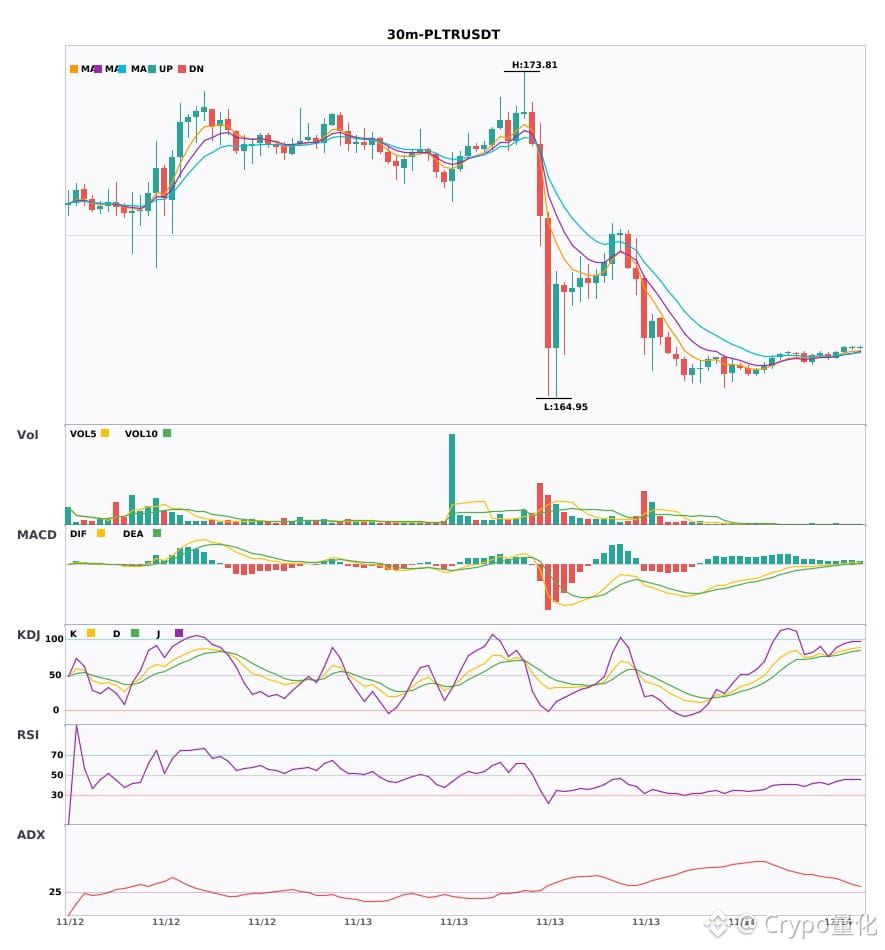
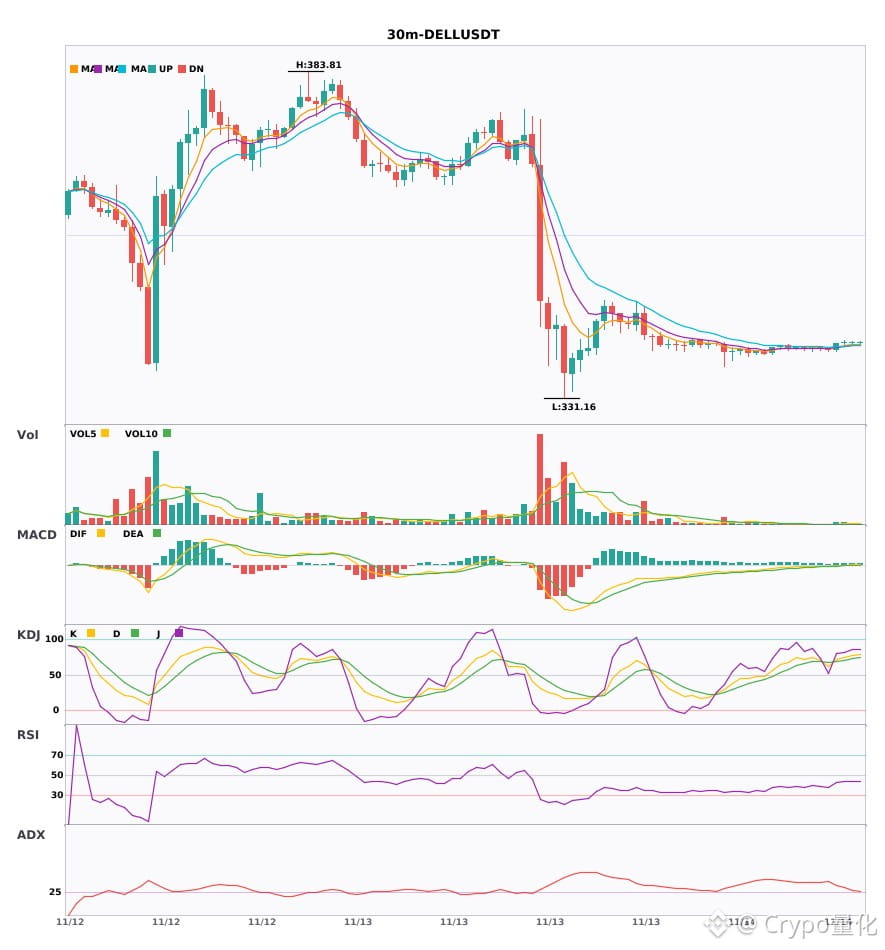
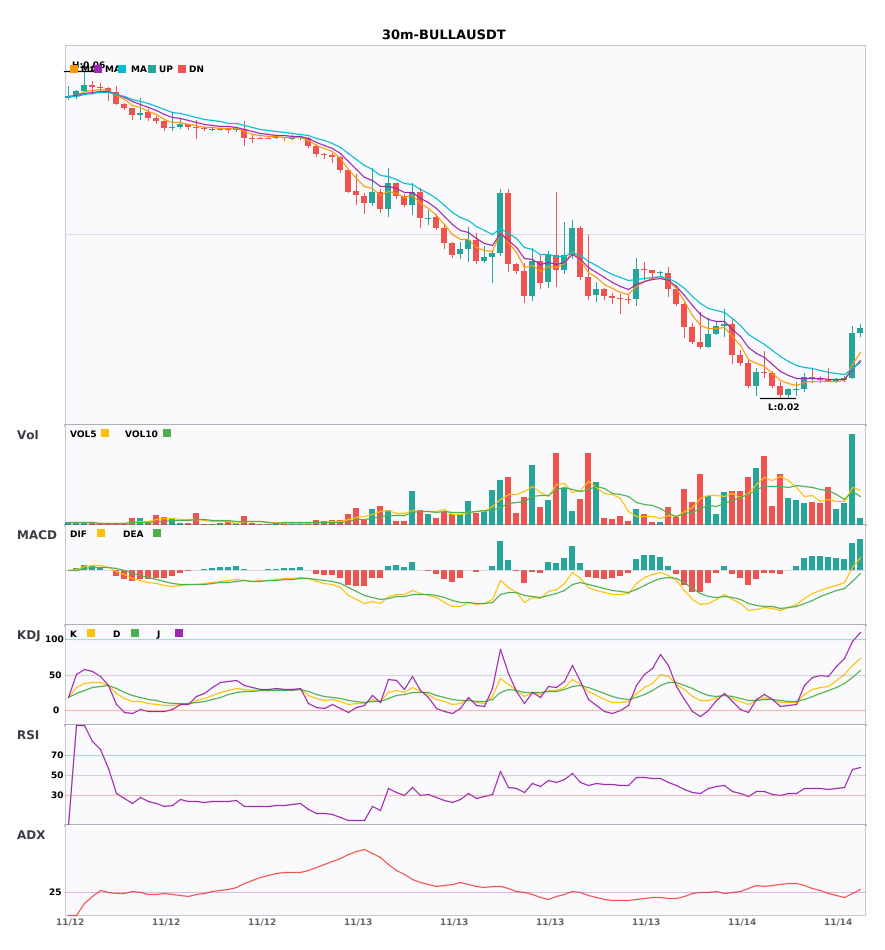
30-minute bullish signals firing across the board: $PLTR $DELL $BULLA🔥
════════════════════
🔴 $PLTR 30-minute bullish signal
⚠️Technical analysis: ADX 32, very strong trend | MACD bullish crossover followed by rising volume | Moving averages are converging and about to fan out upward | KDJ in overbought territory—watch for a pullback (K84.7 D80.1) | Trading volume up 1.8x
════════════════════
🔴 $DELL 30-minute bullish signal
⚠️Technical analysis: ADX is as high as 32, and the trend is very clear; after the MACD bullish crossover, DIF moved above the zero line, signaling a bullish turn; moving averages are converging and about to fan out; in KDJ, K has crossed above D and is not yet overbought; trading volume suddenly surged 3.2x.
════════════════════
🔴 $BULLA 30-minute bullish signal
⚠️Technical analysis: The ADX trend is taking shape—an opportunity to participate; MACD bullish crossover with rising volume, breaking above the zero line and turning bullish; short-term moving averages have crossed upward; trading volume surged 2.7x.
════════════════════
🔔 Follow for first-hand market alerts 🔔
#技术分析 #PLTR #DELL #BULLA
📌 When trading, pay attention to whether the candlestick pattern aligns
30-minute bullish signals firing across the board: $PLTR $DELL $BULLA 🔥
════════════════════
🔴 $PLTR 30-minute bullish signal
⚠️Technical analysis: ADX 32, very strong trend | MACD bullish crossover followed by rising volume | Moving averages are converging and about to fan out upward | KDJ in overbought territory—watch for a pullback (K84.7 D80.1) | Trading volume up 1.8x
════════════════════
🔴 $DELL 30-minute bullish signal
⚠️Technical analysis: ADX is as high as 32, and the trend is very clear; after the MACD bullish crossover, DIF moved above the zero line, signaling a bullish turn; moving averages are converging and about to fan out; in KDJ, K has crossed above D and is not yet overbought; trading volume suddenly surged 3.2x.
════════════════════
🔴 $BULLA 30-minute bullish signal
⚠️Technical analysis: The ADX trend is taking shape—an opportunity to participate; MACD bullish crossover with rising volume, breaking above the zero line and turning bullish; short-term moving averages have crossed upward; trading volume surged 2.7x.
════════════════════
🔔 Follow for first-hand market alerts 🔔
#技术分析 #PLTR #DELL #BULLA
📌 When trading, pay attention to whether the candlestick pattern aligns
════════════════════
🔴 $PLTR 30-minute bullish signal
⚠️Technical analysis: ADX 32, very strong trend | MACD bullish crossover followed by rising volume | Moving averages are converging and about to fan out upward | KDJ in overbought territory—watch for a pullback (K84.7 D80.1) | Trading volume up 1.8x
════════════════════
🔴 $DELL 30-minute bullish signal
⚠️Technical analysis: ADX is as high as 32, and the trend is very clear; after the MACD bullish crossover, DIF moved above the zero line, signaling a bullish turn; moving averages are converging and about to fan out; in KDJ, K has crossed above D and is not yet overbought; trading volume suddenly surged 3.2x.
════════════════════
🔴 $BULLA 30-minute bullish signal
⚠️Technical analysis: The ADX trend is taking shape—an opportunity to participate; MACD bullish crossover with rising volume, breaking above the zero line and turning bullish; short-term moving averages have crossed upward; trading volume surged 2.7x.
════════════════════
🔔 Follow for first-hand market alerts 🔔
#技术分析 #PLTR #DELL #BULLA
📌 When trading, pay attention to whether the candlestick pattern aligns
2
·
--
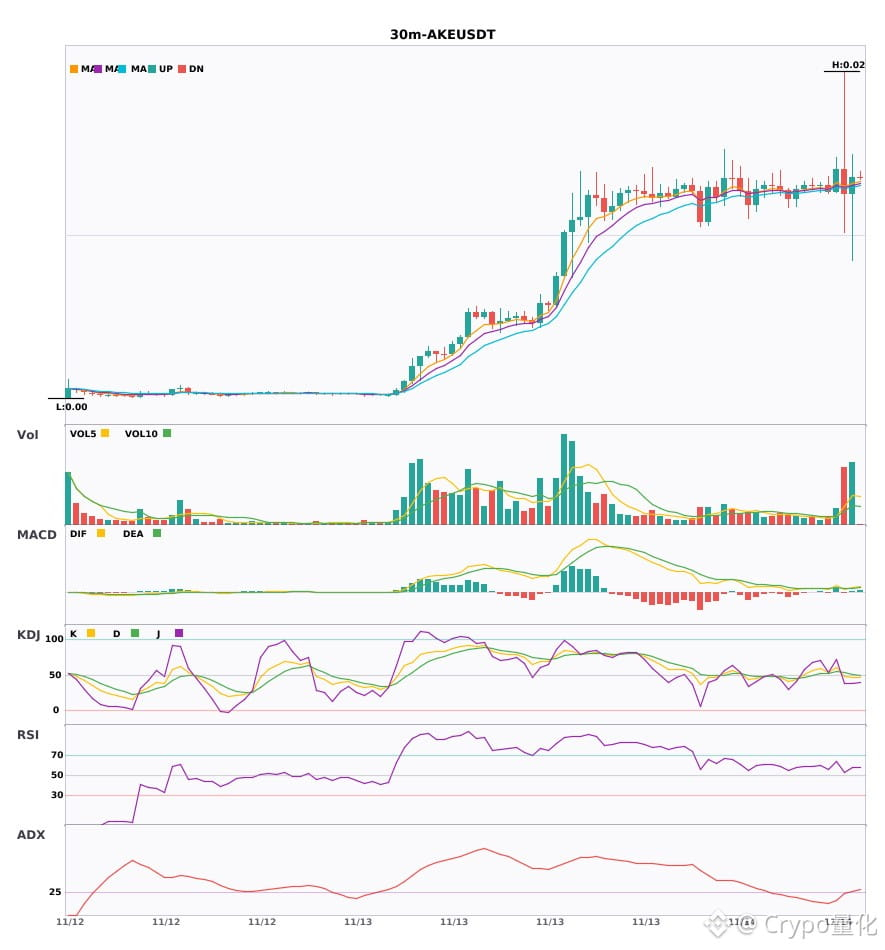
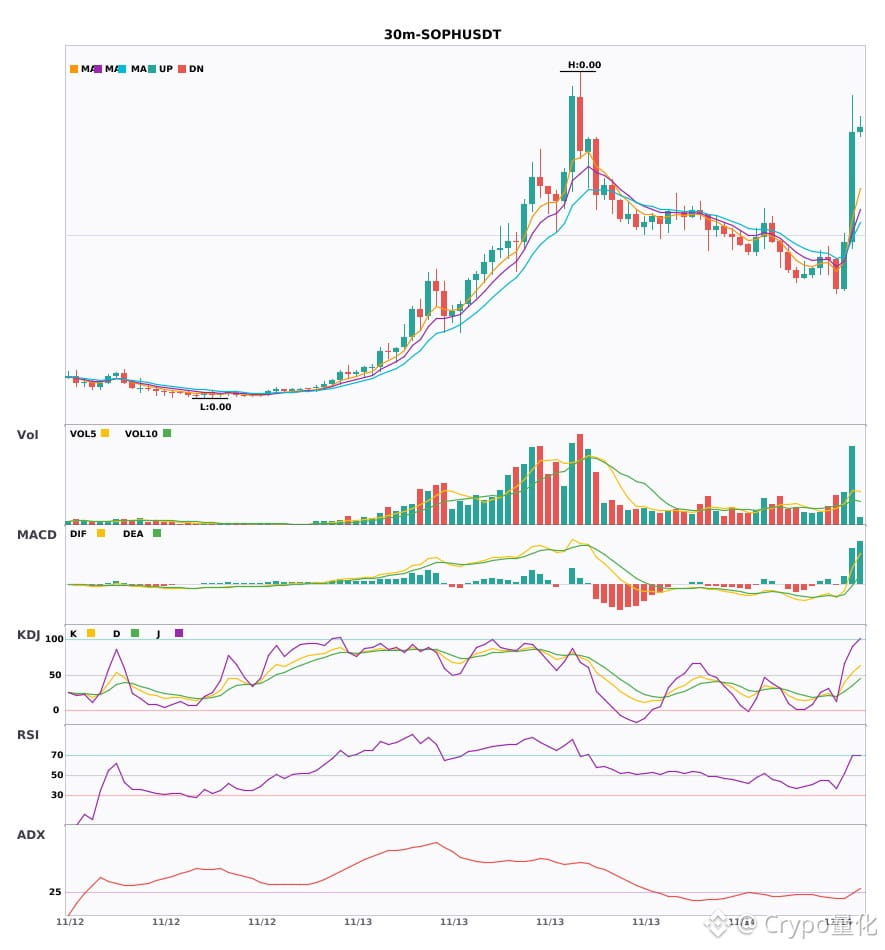
$AKE $SOPH $PLTR 30-minute confluence signals bullish; all the bullish signals are in! 🔥
════════════════════
🔴 $AKE 30-minute bullish signal
⚠️Technical analysis: ADX trend is established; entry is possible. MACD shows increased volume after a golden cross, with growing red bars. Moving averages are aligned bullishly and trending upward; volume surged 4.2x.
════════════════════
🔴 $SOPH 30-minute bullish signal
⚠️Technical analysis: ADX (27) trend is just starting; entry is possible | Volume increased after the MACD golden cross, with larger red bars; trend has turned bullish | Moving averages have just formed a bullish alignment; short-term outlook is bullish | Volume surged 3.1x
════════════════════
🔴 $PLTR 30-minute bullish signal
⚠️Technical analysis: ADX 32, strong trend | After the MACD golden cross, DIF crossed above the zero line, turning bullish | Moving averages are converging and building momentum; waiting for a breakout | KDJ is overbought (K84.7/D80.1); beware of a pullback | Volume increased 1.8x
════════════════════
🔔 Follow for first-hand market updates 🔔
#技术分析 #AKE #SOPH #PLTR
📌 When trading, pay attention to whether the candlestick pattern aligns
$AKE $SOPH $PLTR 30-minute confluence signals bullish; all the bullish signals are in! 🔥
════════════════════
🔴 $AKE 30-minute bullish signal
⚠️Technical analysis: ADX trend is established; entry is possible. MACD shows increased volume after a golden cross, with growing red bars. Moving averages are aligned bullishly and trending upward; volume surged 4.2x.
════════════════════
🔴 $SOPH 30-minute bullish signal
⚠️Technical analysis: ADX (27) trend is just starting; entry is possible | Volume increased after the MACD golden cross, with larger red bars; trend has turned bullish | Moving averages have just formed a bullish alignment; short-term outlook is bullish | Volume surged 3.1x
════════════════════
🔴 $PLTR 30-minute bullish signal
⚠️Technical analysis: ADX 32, strong trend | After the MACD golden cross, DIF crossed above the zero line, turning bullish | Moving averages are converging and building momentum; waiting for a breakout | KDJ is overbought (K84.7/D80.1); beware of a pullback | Volume increased 1.8x
════════════════════
🔔 Follow for first-hand market updates 🔔
#技术分析 #AKE #SOPH #PLTR
📌 When trading, pay attention to whether the candlestick pattern aligns
════════════════════
🔴 $AKE 30-minute bullish signal
⚠️Technical analysis: ADX trend is established; entry is possible. MACD shows increased volume after a golden cross, with growing red bars. Moving averages are aligned bullishly and trending upward; volume surged 4.2x.
════════════════════
🔴 $SOPH 30-minute bullish signal
⚠️Technical analysis: ADX (27) trend is just starting; entry is possible | Volume increased after the MACD golden cross, with larger red bars; trend has turned bullish | Moving averages have just formed a bullish alignment; short-term outlook is bullish | Volume surged 3.1x
════════════════════
🔴 $PLTR 30-minute bullish signal
⚠️Technical analysis: ADX 32, strong trend | After the MACD golden cross, DIF crossed above the zero line, turning bullish | Moving averages are converging and building momentum; waiting for a breakout | KDJ is overbought (K84.7/D80.1); beware of a pullback | Volume increased 1.8x
════════════════════
🔔 Follow for first-hand market updates 🔔
#技术分析 #AKE #SOPH #PLTR
📌 When trading, pay attention to whether the candlestick pattern aligns
6
·
--
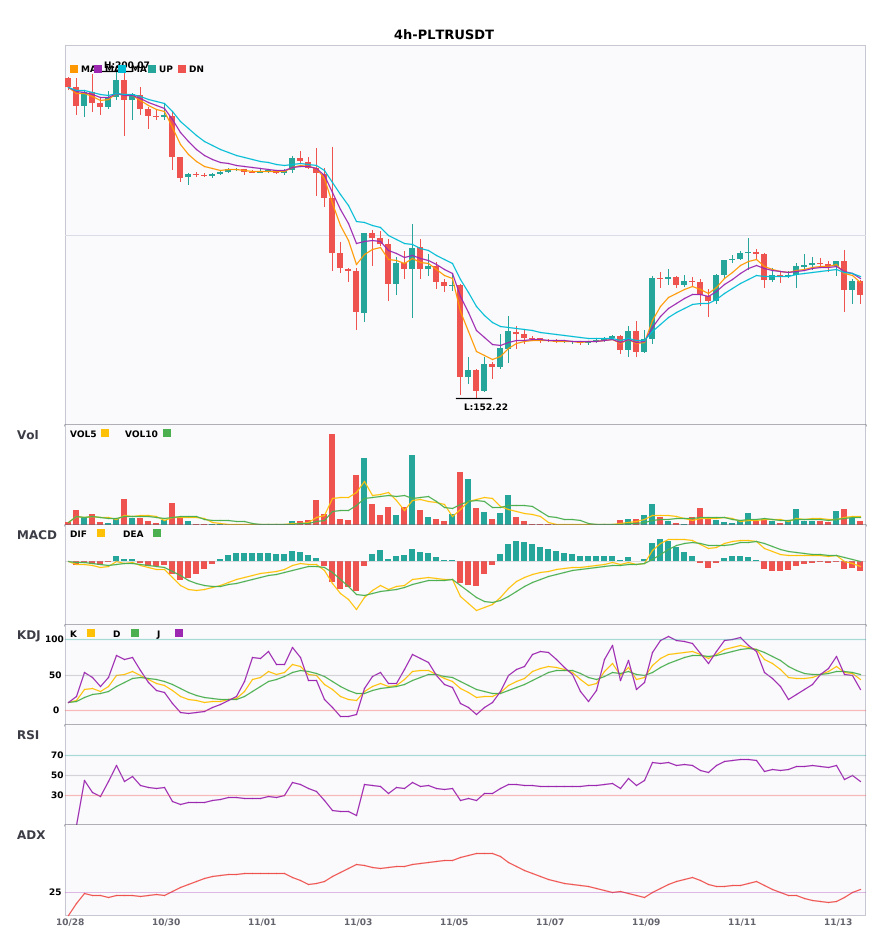
$PLTR 4-hour and daily charts are bearish; multiple timeframes align, favoring a trend-following short 🔥
════════════════════
🟢 $PLTR 4-hour bearish signal
⚠️ Technical analysis: Multiple timeframes align for a short: the 4-hour entry signal is confirmed by the daily bearish trend. The MACD green bars continue, moving averages are bearishly aligned and diverging downward, and trading volume has increased 2.3 times. Short with the trend.
════════════════════
🔔 Follow to get first-hand updates on market movements 🔔
#多周期共振 #PLTR
📌 When trading, check whether the candlestick pattern is consistent
$PLTR 4-hour and daily charts are bearish; multiple timeframes align, favoring a trend-following short 🔥
════════════════════
🟢 $PLTR 4-hour bearish signal
⚠️ Technical analysis: Multiple timeframes align for a short: the 4-hour entry signal is confirmed by the daily bearish trend. The MACD green bars continue, moving averages are bearishly aligned and diverging downward, and trading volume has increased 2.3 times. Short with the trend.
════════════════════
🔔 Follow to get first-hand updates on market movements 🔔
#多周期共振 #PLTR
📌 When trading, check whether the candlestick pattern is consistent
════════════════════
🟢 $PLTR 4-hour bearish signal
⚠️ Technical analysis: Multiple timeframes align for a short: the 4-hour entry signal is confirmed by the daily bearish trend. The MACD green bars continue, moving averages are bearishly aligned and diverging downward, and trading volume has increased 2.3 times. Short with the trend.
════════════════════
🔔 Follow to get first-hand updates on market movements 🔔
#多周期共振 #PLTR
📌 When trading, check whether the candlestick pattern is consistent
2
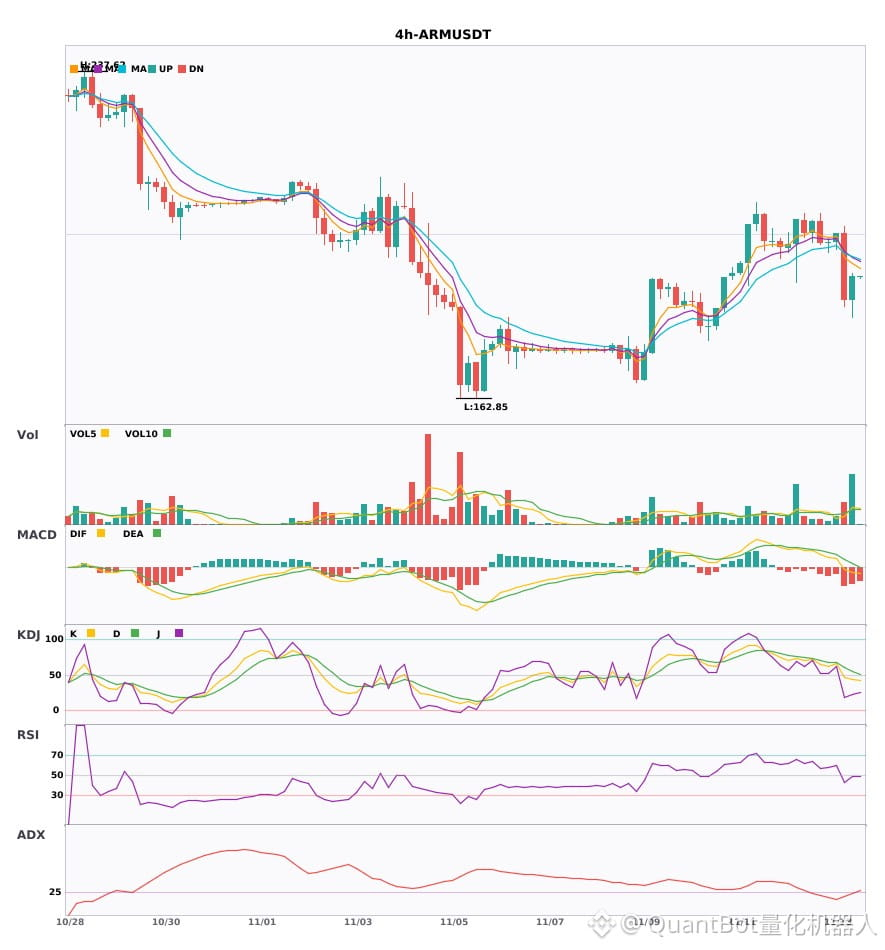
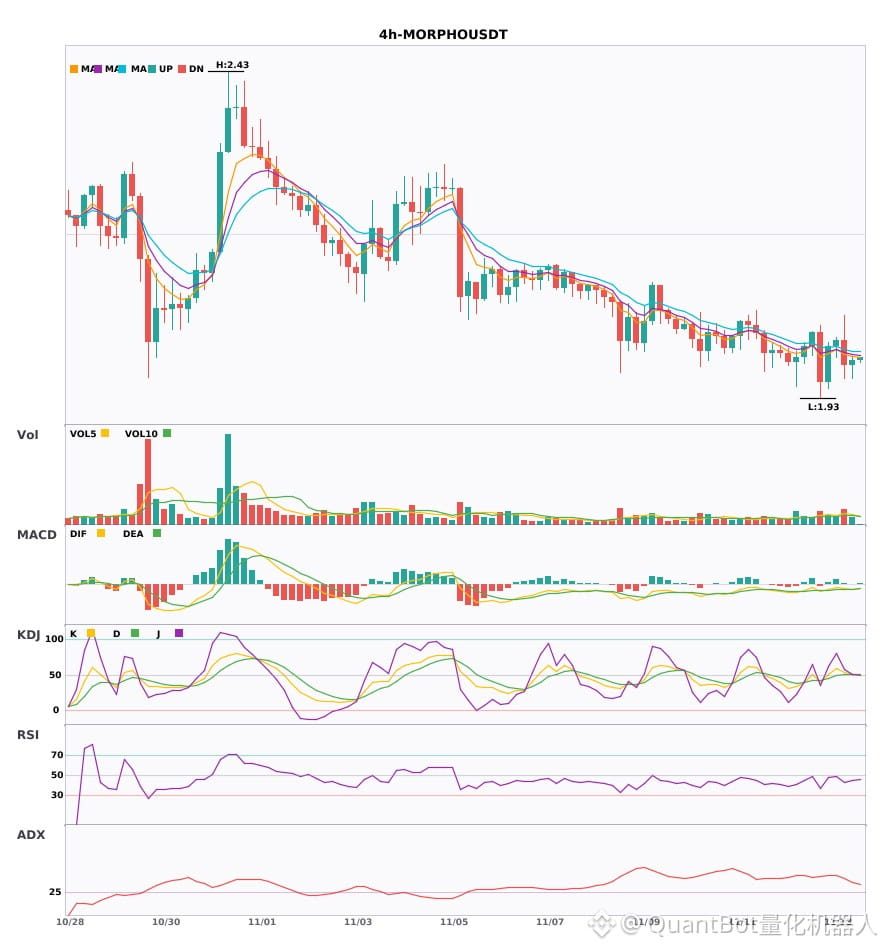
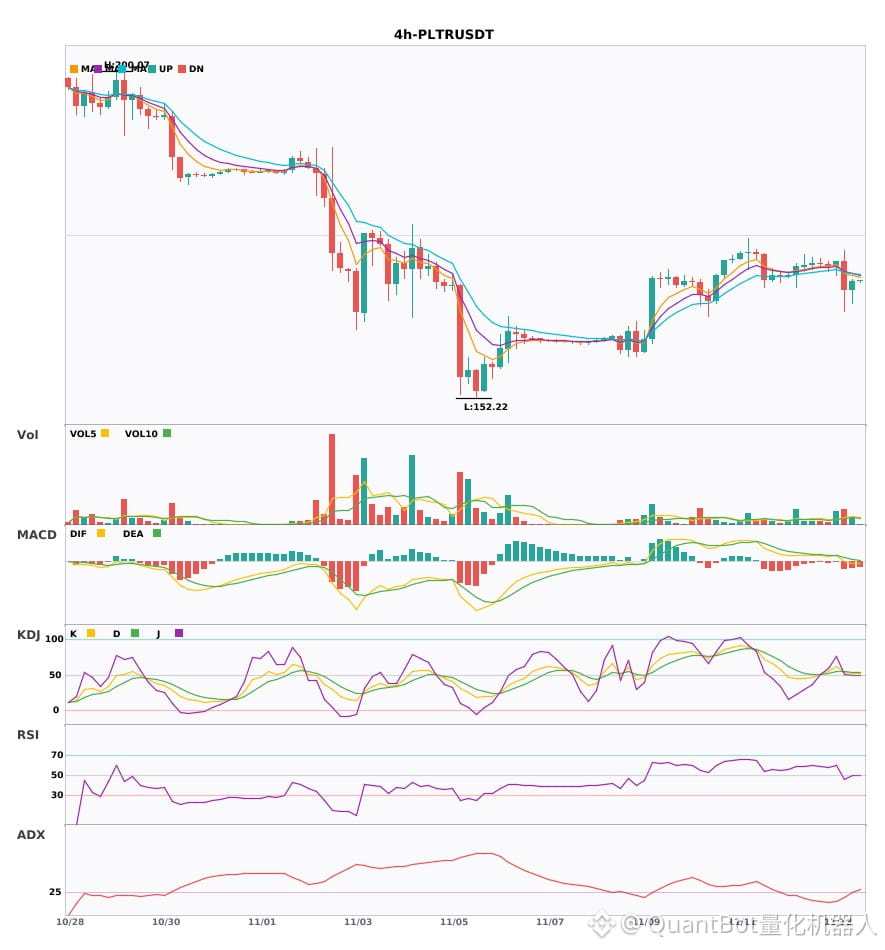
$ARM/$MORPHO/$PLTR 4-hour timeframe bearish confluence signal
📉 $ARM | 4-hour bearish signal
━━━━━━━━━━━━━━━━━━
Technical analysis: ADX(26) indicates a trend is developing, with conditions suitable for participation|MACD is bearish, with the trend under pressure and momentum weakening|EMA5/8/13 are bearishly aligned|Trading volume increased significantly by 3.2x
Price change: 2.9000%
📉 $MORPHO | 4-hour bearish signal
━━━━━━━━━━━━━━━━━━
Technical analysis: ADX(34) indicates a clear trend. The MACD bearish cross below zero confirms strengthening bearish momentum. EMA5\u0026lt;EMA8\u0026lt;EMA13 are bearishly aligned. The KDJ bearish cross (K:50.6,D:50.7) supports a short-term bearish outlook, and trading volume increased by 1.6x.
Price change: 0.3800%
📉 $PLTR | 4-hour bearish signal
━━━━━━━━━━━━━━━━━━
Technical analysis: ADX(28) confirms the trend; conditions are suitable for participation | MACD is bearish, with momentum declining | EMA5\u0026lt;8\u0026lt;13 are bearishly aligned | KDJ favors the bulls (K52.2 D53.8) | Trading volume increased by 2.3x
Price change: 0.8200%
━━━━━━━━━━━━━━━━━━
#技术分析 #ARM #MORPHO #PLTR
📌 The above content is for reference only and does not constitute investment advice
$ARM /$MORPHO /$PLTR 4-hour timeframe bearish confluence signal
📉 $ARM | 4-hour bearish signal
━━━━━━━━━━━━━━━━━━
Technical analysis: ADX(26) indicates a trend is developing, with conditions suitable for participation|MACD is bearish, with the trend under pressure and momentum weakening|EMA5/8/13 are bearishly aligned|Trading volume increased significantly by 3.2x
Price change: 2.9000%
📉 $MORPHO | 4-hour bearish signal
━━━━━━━━━━━━━━━━━━
Technical analysis: ADX(34) indicates a clear trend. The MACD bearish cross below zero confirms strengthening bearish momentum. EMA5\u0026lt;EMA8\u0026lt;EMA13 are bearishly aligned. The KDJ bearish cross (K:50.6,D:50.7) supports a short-term bearish outlook, and trading volume increased by 1.6x.
Price change: 0.3800%
📉 $PLTR | 4-hour bearish signal
━━━━━━━━━━━━━━━━━━
Technical analysis: ADX(28) confirms the trend; conditions are suitable for participation | MACD is bearish, with momentum declining | EMA5\u0026lt;8\u0026lt;13 are bearishly aligned | KDJ favors the bulls (K52.2 D53.8) | Trading volume increased by 2.3x
Price change: 0.8200%
━━━━━━━━━━━━━━━━━━
#技术分析 #ARM #MORPHO #PLTR
📌 The above content is for reference only and does not constitute investment advice
📉 $ARM | 4-hour bearish signal
━━━━━━━━━━━━━━━━━━
Technical analysis: ADX(26) indicates a trend is developing, with conditions suitable for participation|MACD is bearish, with the trend under pressure and momentum weakening|EMA5/8/13 are bearishly aligned|Trading volume increased significantly by 3.2x
Price change: 2.9000%
📉 $MORPHO | 4-hour bearish signal
━━━━━━━━━━━━━━━━━━
Technical analysis: ADX(34) indicates a clear trend. The MACD bearish cross below zero confirms strengthening bearish momentum. EMA5\u0026lt;EMA8\u0026lt;EMA13 are bearishly aligned. The KDJ bearish cross (K:50.6,D:50.7) supports a short-term bearish outlook, and trading volume increased by 1.6x.
Price change: 0.3800%
📉 $PLTR | 4-hour bearish signal
━━━━━━━━━━━━━━━━━━
Technical analysis: ADX(28) confirms the trend; conditions are suitable for participation | MACD is bearish, with momentum declining | EMA5\u0026lt;8\u0026lt;13 are bearishly aligned | KDJ favors the bulls (K52.2 D53.8) | Trading volume increased by 2.3x
Price change: 0.8200%
━━━━━━━━━━━━━━━━━━
#技术分析 #ARM #MORPHO #PLTR
📌 The above content is for reference only and does not constitute investment advice
2
·
--
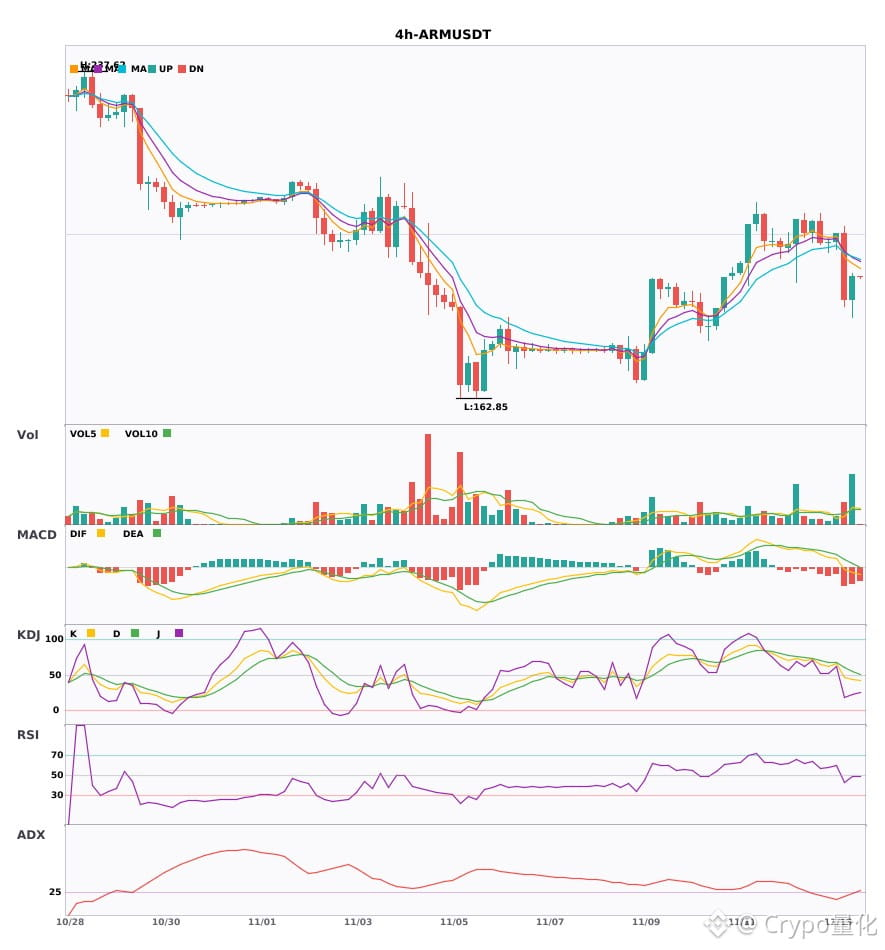
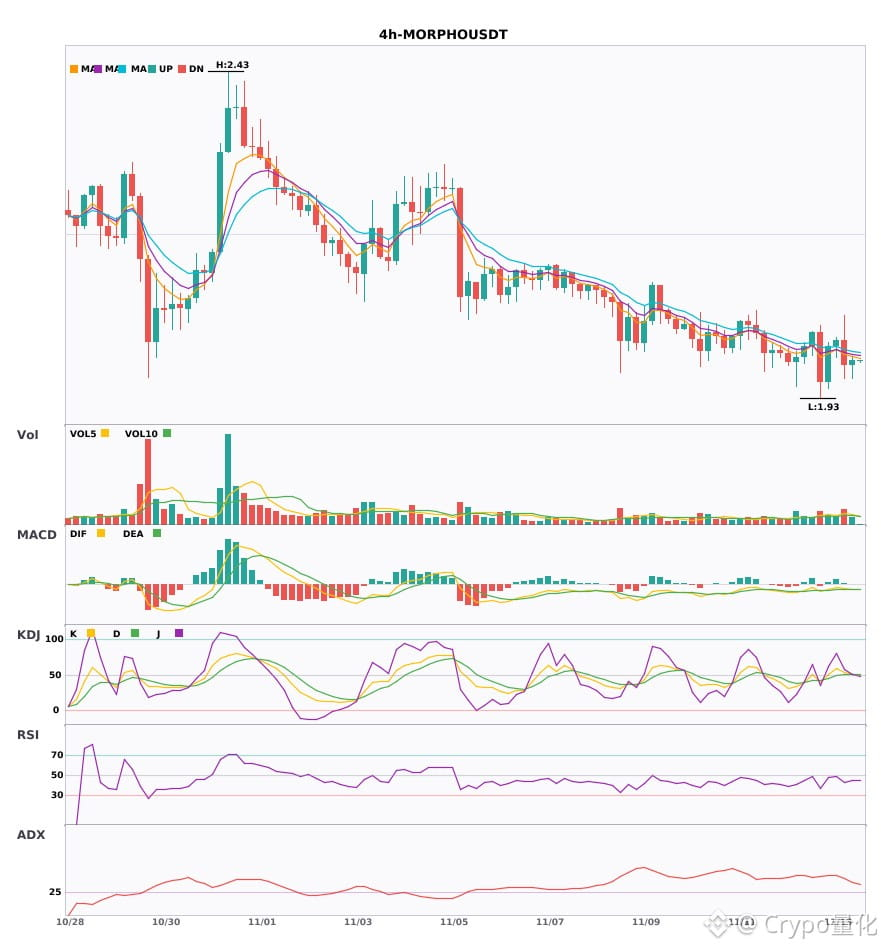
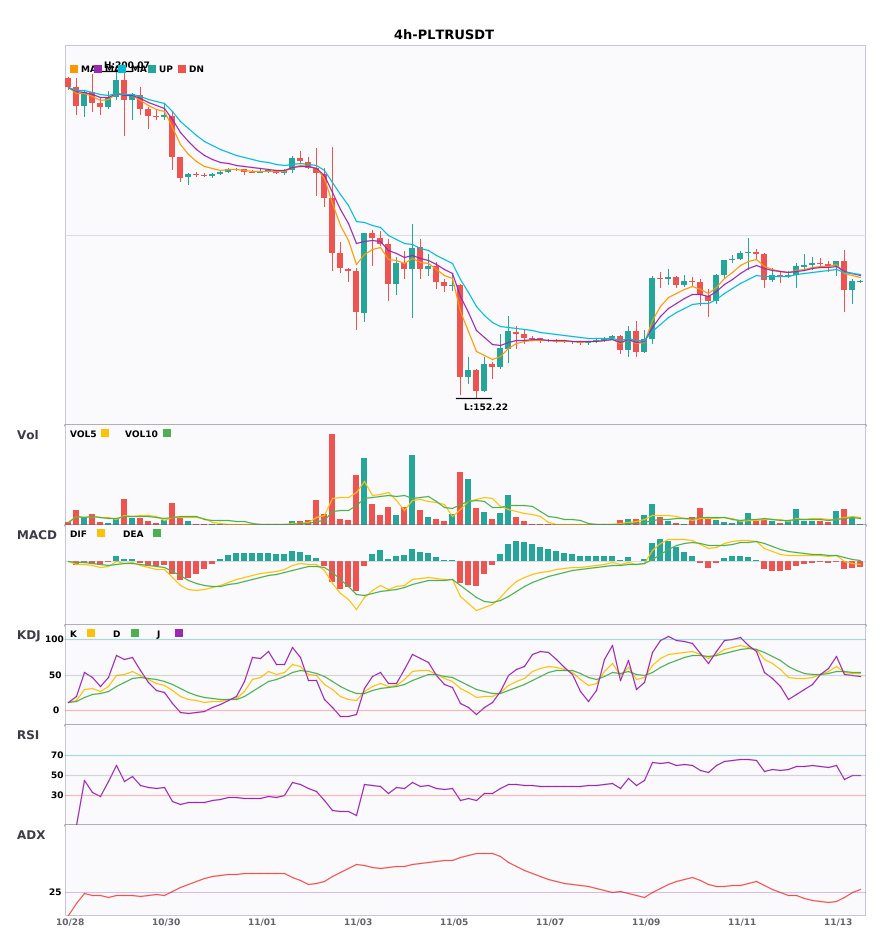
$ARM $MORPHO $PLTR 4 hours weakening; likely to fall in the short term 🔥
════════════════════
🟢 $ARM 4 hours bearish signal
⚠️ Technicals: ADX trend emerging, potential entry | MACD bearish, red bars shrinking and momentum weakening | moving averages in bearish alignment, trending down | volume surged 3.2x
════════════════════
🟢 $MORPHO 4 hours bearish signal
⚠️ Technicals: ADX is at 34, so the trend is quite clear. MACD has formed a death cross below zero with rising volume; bearish momentum is accelerating. Moving averages have just formed a bearish alignment and are trending down. KDJ has formed a death cross but is not yet oversold, suggesting a short-term bearish outlook; volume is also up 1.6x.
════════════════════
🟢 $PLTR 4 hours bearish signal
⚠️ Technicals: ADX trend just starting, potential entry; MACD green bars are shrinking, so bearish momentum is weakening. Moving averages are in bearish alignment, but KDJ's K line has crossed above D and is not overbought, indicating relative strength. Volume is up more than 2x.
════════════════════
🔔 Follow for first-hand market updates 🔔
#技术分析 #ARM #MORPHO #PLTR
📌 When trading, pay attention to whether the candlestick pattern confirms the signal
$ARM $MORPHO $PLTR 4 hours weakening; likely to fall in the short term 🔥
════════════════════
🟢 $ARM 4 hours bearish signal
⚠️ Technicals: ADX trend emerging, potential entry | MACD bearish, red bars shrinking and momentum weakening | moving averages in bearish alignment, trending down | volume surged 3.2x
════════════════════
🟢 $MORPHO 4 hours bearish signal
⚠️ Technicals: ADX is at 34, so the trend is quite clear. MACD has formed a death cross below zero with rising volume; bearish momentum is accelerating. Moving averages have just formed a bearish alignment and are trending down. KDJ has formed a death cross but is not yet oversold, suggesting a short-term bearish outlook; volume is also up 1.6x.
════════════════════
🟢 $PLTR 4 hours bearish signal
⚠️ Technicals: ADX trend just starting, potential entry; MACD green bars are shrinking, so bearish momentum is weakening. Moving averages are in bearish alignment, but KDJ's K line has crossed above D and is not overbought, indicating relative strength. Volume is up more than 2x.
════════════════════
🔔 Follow for first-hand market updates 🔔
#技术分析 #ARM #MORPHO #PLTR
📌 When trading, pay attention to whether the candlestick pattern confirms the signal
════════════════════
🟢 $ARM 4 hours bearish signal
⚠️ Technicals: ADX trend emerging, potential entry | MACD bearish, red bars shrinking and momentum weakening | moving averages in bearish alignment, trending down | volume surged 3.2x
════════════════════
🟢 $MORPHO 4 hours bearish signal
⚠️ Technicals: ADX is at 34, so the trend is quite clear. MACD has formed a death cross below zero with rising volume; bearish momentum is accelerating. Moving averages have just formed a bearish alignment and are trending down. KDJ has formed a death cross but is not yet oversold, suggesting a short-term bearish outlook; volume is also up 1.6x.
════════════════════
🟢 $PLTR 4 hours bearish signal
⚠️ Technicals: ADX trend just starting, potential entry; MACD green bars are shrinking, so bearish momentum is weakening. Moving averages are in bearish alignment, but KDJ's K line has crossed above D and is not overbought, indicating relative strength. Volume is up more than 2x.
════════════════════
🔔 Follow for first-hand market updates 🔔
#技术分析 #ARM #MORPHO #PLTR
📌 When trading, pay attention to whether the candlestick pattern confirms the signal
5
·
--
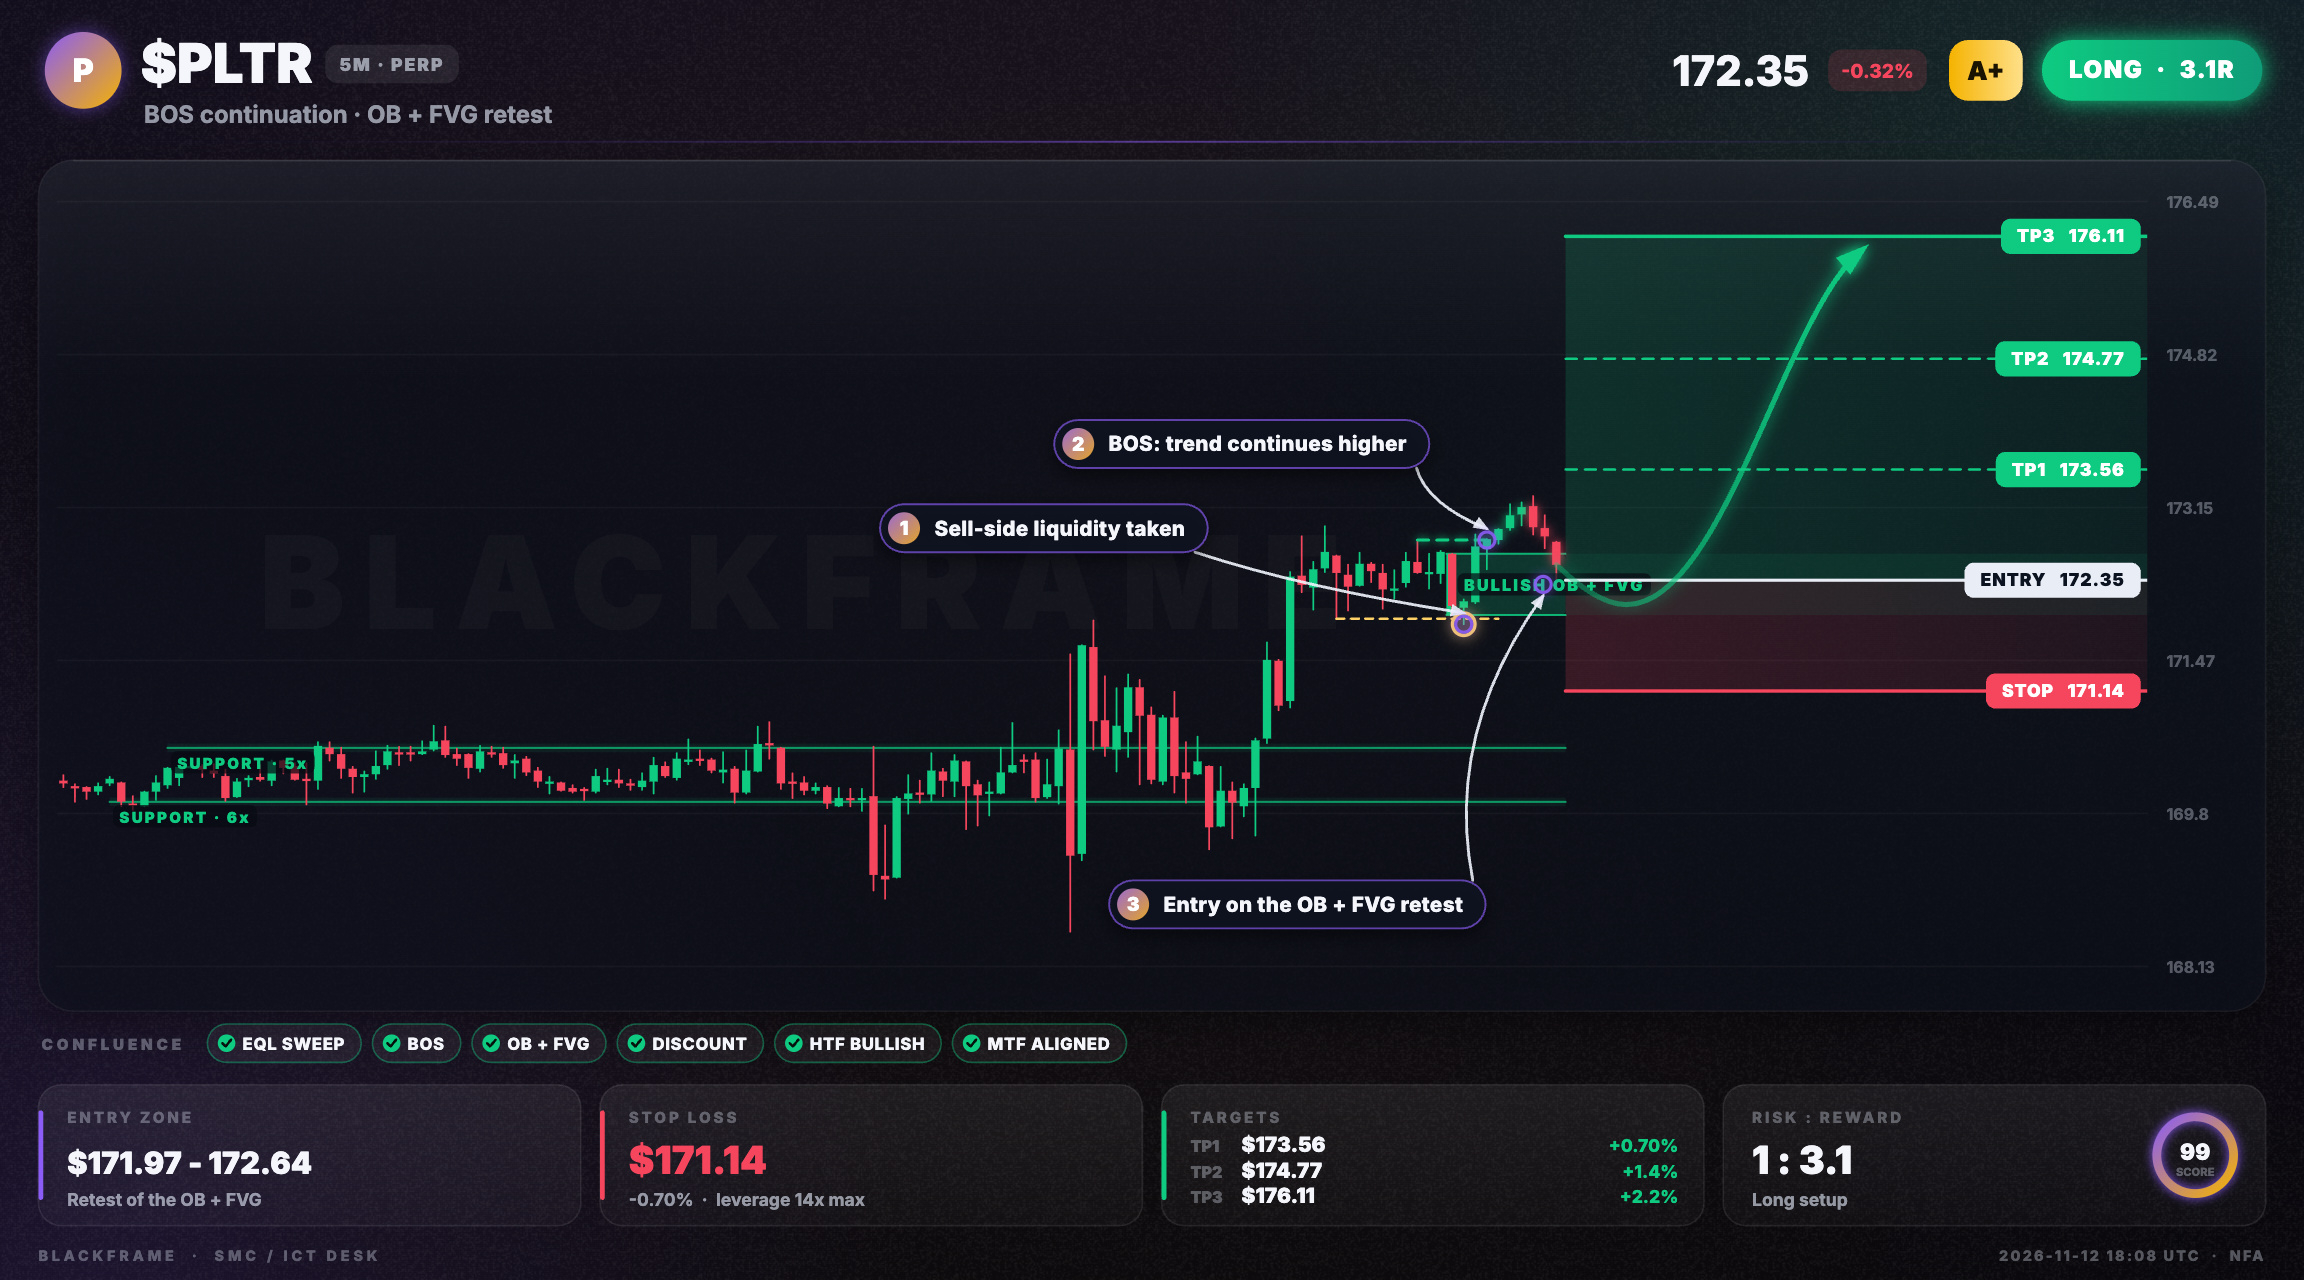
🌟 $PLTR finds bullish order block surge
LONG · 5M
Entry: $172.35 - $172.64
TP1: $173.56
TP2: $174.77
TP3: $176.11
SL: $171.14
Equal lows swept, BOS on 5M confirms uptrend. OB+FVG stacked at $171.97-172.64 offers discount entry at $172.35. Target buy-side liquidity at $176.11; stop at $171.14.
#PLTR #SmartMoney · NFA
🌟 $PLTR finds bullish order block surge
LONG · 5M
Entry: $172.35 - $172.64
TP1: $173.56
TP2: $174.77
TP3: $176.11
SL: $171.14
Equal lows swept, BOS on 5M confirms uptrend. OB+FVG stacked at $171.97-172.64 offers discount entry at $172.35. Target buy-side liquidity at $176.11; stop at $171.14.
#PLTR #SmartMoney · NFA
LONG · 5M
Entry: $172.35 - $172.64
TP1: $173.56
TP2: $174.77
TP3: $176.11
SL: $171.14
Equal lows swept, BOS on 5M confirms uptrend. OB+FVG stacked at $171.97-172.64 offers discount entry at $172.35. Target buy-side liquidity at $176.11; stop at $171.14.
#PLTR #SmartMoney · NFA
22
Log in to explore more content
Join global crypto users on Binance Square
⚡️ Get latest and useful information about crypto.
💬 Trusted by the world’s largest crypto exchange.
👍 Discover real insights from verified creators.
Email / Phone number
Trending Topics
1
#NvidiaBeatsEstimatesAICloudStocksRiseAfterHours
4,298 views
69 Discussing
2
#A Packed Week of Earnings and Data Tests Markets
152,216 views
667 Discussing
3
#AnthropicIPOTestsInvestorAppetiteForAI
336,205 views
2,924 Discussing
4
#NvidiaBoardNotConsideringHuang’sReturnasCEO
127,633 views
997 Discussing
5
#KOSPIFalls2.59%ToLowestCloseSinceFebruary
33,315 views
338 Discussing
6
#AnthropicClearedToListOnNasdaqAsANT
27,913 views
279 Discussing
7
#WhatInvestmentSignalsDo13FFilingsReveal?
69,726 views
679 Discussing
8
#TetherCapitalMakesStrategicInvestmentInStables
15,892 views
121 Discussing
9
#EvernorthRecords$505MImpairmentOnPreListingXRP
1,955 views
21 Discussing
10
#GoldmanSachsReports$1.22BInEtherETFHoldings
1,390 views
17 Discussing