
#etfflows
etfflows
77,638 views
871 Discussing
Hot
Latest

·
--
🚨 INSTITUTIONS ARE BLEEDING CAPITAL OUT OF $BTC WHILE TRADITIONAL STOCKS SURGE 📉
While traditional equities just vacuumed up thirty-seven billion in fresh capital, spot crypto vehicles took a heavy fourteen hundred million hit over five sessions. $BTC bore the brunt with over a billion walking out the door, showing that institutional desks are playing strict defense for now. 📊
True market momentum will only validate once a price bounce aligns with actual net inflows returning to spot funds. Until institutional bid volume confirms the move, every recovery attempt is simply testing seller absorption at local resistance. 💡
💬 Are you positioning ahead of the ETF flows or waiting for institutional confirmation to cross the tape? 👇
⚠️ Not financial advice. Always manage your risk. 🛡️
🏷️ #BTC #Crypto #MarketDynamics #ETFFlows
🔥 💎
🚨 INSTITUTIONS ARE BLEEDING CAPITAL OUT OF $BTC WHILE TRADITIONAL STOCKS SURGE 📉
While traditional equities just vacuumed up thirty-seven billion in fresh capital, spot crypto vehicles took a heavy fourteen hundred million hit over five sessions. $BTC bore the brunt with over a billion walking out the door, showing that institutional desks are playing strict defense for now. 📊
True market momentum will only validate once a price bounce aligns with actual net inflows returning to spot funds. Until institutional bid volume confirms the move, every recovery attempt is simply testing seller absorption at local resistance. 💡
💬 Are you positioning ahead of the ETF flows or waiting for institutional confirmation to cross the tape? 👇
⚠️ Not financial advice. Always manage your risk. 🛡️
🏷️ #BTC #Crypto #MarketDynamics #ETFFlows
🔥 💎
While traditional equities just vacuumed up thirty-seven billion in fresh capital, spot crypto vehicles took a heavy fourteen hundred million hit over five sessions. $BTC bore the brunt with over a billion walking out the door, showing that institutional desks are playing strict defense for now. 📊
True market momentum will only validate once a price bounce aligns with actual net inflows returning to spot funds. Until institutional bid volume confirms the move, every recovery attempt is simply testing seller absorption at local resistance. 💡
💬 Are you positioning ahead of the ETF flows or waiting for institutional confirmation to cross the tape? 👇
⚠️ Not financial advice. Always manage your risk. 🛡️
🏷️ #BTC #Crypto #MarketDynamics #ETFFlows
🔥 💎

9

·
--
#USCryptoETFsLose$1.48BInFiveDays
$1.48B left US crypto ETFs in 5 days. Rotation into stocks? 🔍
SoSoValue (Nov 4–10): all six spot crypto ETF groups saw outflows. Bitcoin funds lost $1.06B, Ethereum $326M, and SOL/XRP/HYPE/ZEC funds $89.4M combined, while 10 major US stock ETFs drew $37.5B.
Cross-check:
• Farside: BTC ETFs shed $1.44B over five straight sessions to Nov 11, led by IBIT
• BTC ETFs are about -$1.42B YTD, versus +$25.2B a year ago
• Altcoin ETFs still hold ~$1.75B net inflows in 2026
My take: sources use different windows, so figures differ but don't conflict. "Money moved to stocks" is an inference, not stock ETF inflows are routine and far larger. This looks like risk-off demand fading, with BTC near $69K.
Watch: whether daily BTC ETF flows turn positive and IBIT's outflow streak ends.
Cause or symptom of this dip? 👇
$BTC
{future}(BTCUSDT)
$ETH
{future}(ETHUSDT)
$IBIT.ETF
{etf_us}(IBIT.ETF)
#BitcoinETF #ETFFlows #CryptoMarket
#USCryptoETFsLose$1.48BInFiveDays
$1.48B left US crypto ETFs in 5 days. Rotation into stocks? 🔍
SoSoValue (Nov 4–10): all six spot crypto ETF groups saw outflows. Bitcoin funds lost $1.06B, Ethereum $326M, and SOL/XRP/HYPE/ZEC funds $89.4M combined, while 10 major US stock ETFs drew $37.5B.
Cross-check:
• Farside: BTC ETFs shed $1.44B over five straight sessions to Nov 11, led by IBIT
• BTC ETFs are about -$1.42B YTD, versus +$25.2B a year ago
• Altcoin ETFs still hold ~$1.75B net inflows in 2026
My take: sources use different windows, so figures differ but don't conflict. "Money moved to stocks" is an inference, not stock ETF inflows are routine and far larger. This looks like risk-off demand fading, with BTC near $69K.
Watch: whether daily BTC ETF flows turn positive and IBIT's outflow streak ends.
Cause or symptom of this dip? 👇
$BTC
$ETH
$IBIT.ETF
#BitcoinETF #ETFFlows #CryptoMarket
$1.48B left US crypto ETFs in 5 days. Rotation into stocks? 🔍
SoSoValue (Nov 4–10): all six spot crypto ETF groups saw outflows. Bitcoin funds lost $1.06B, Ethereum $326M, and SOL/XRP/HYPE/ZEC funds $89.4M combined, while 10 major US stock ETFs drew $37.5B.
Cross-check:
• Farside: BTC ETFs shed $1.44B over five straight sessions to Nov 11, led by IBIT
• BTC ETFs are about -$1.42B YTD, versus +$25.2B a year ago
• Altcoin ETFs still hold ~$1.75B net inflows in 2026
My take: sources use different windows, so figures differ but don't conflict. "Money moved to stocks" is an inference, not stock ETF inflows are routine and far larger. This looks like risk-off demand fading, with BTC near $69K.
Watch: whether daily BTC ETF flows turn positive and IBIT's outflow streak ends.
Cause or symptom of this dip? 👇
$BTC
$ETH
$IBIT.ETF
#BitcoinETF #ETFFlows #CryptoMarket

27

·
--
$BTC | US spot Bitcoin ETFs posted a US$47.7 million net outflow on 12 November 2026, led by BITB and ARKB, not IBIT or FBTC. On the desk I check which issuer moved before trusting a headline total. The smaller of the eleven tracked funds carry thin books, so two mid-tier redemptions can print net negative while IBIT sits flat. IBIT has pulled in over US$60 billion since its January 2024 launch against GBTC's roughly US$28 billion bled out, a rotation SatoshiMacro's flow tracker calls the largest in ETF history. My read: that US$47.7 million tells an AUD investor on Independent Reserve or CoinSpot far less than the same print from IBIT or FBTC, which correlate near 0.85. One day proves no trend.
https://satoshimacro.com/tools/crypto/etf-flows/daily-spot-etf-flows/?utm_source=binance_square&utm_medium=social&utm_campaign=autopilot_short-1
#SatoshiMacro #BitcoinETF #ETFFlows #Bitcoin
$BTC | US spot Bitcoin ETFs posted a US$47.7 million net outflow on 12 November 2026, led by BITB and ARKB, not IBIT or FBTC. On the desk I check which issuer moved before trusting a headline total. The smaller of the eleven tracked funds carry thin books, so two mid-tier redemptions can print net negative while IBIT sits flat. IBIT has pulled in over US$60 billion since its January 2024 launch against GBTC's roughly US$28 billion bled out, a rotation SatoshiMacro's flow tracker calls the largest in ETF history. My read: that US$47.7 million tells an AUD investor on Independent Reserve or CoinSpot far less than the same print from IBIT or FBTC, which correlate near 0.85. One day proves no trend.
https://satoshimacro.com/tools/crypto/etf-flows/daily-spot-etf-flows/?utm_source=binance_square&utm_medium=social&utm_campaign=autopilot_short-1
#SatoshiMacro #BitcoinETF #ETFFlows #Bitcoin
https://satoshimacro.com/tools/crypto/etf-flows/daily-spot-etf-flows/?utm_source=binance_square&utm_medium=social&utm_campaign=autopilot_short-1
#SatoshiMacro #BitcoinETF #ETFFlows #Bitcoin
77

·
--
Bullish
📉 $BTC
{future}(BTCUSDT)
ETF UPDATE
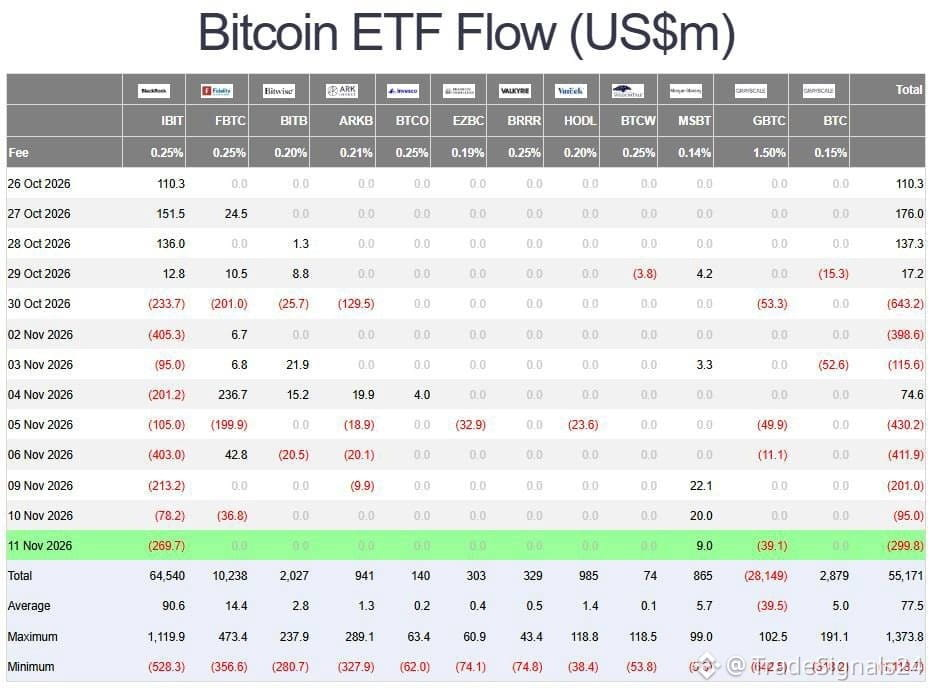
Spot Bitcoin ETFs saw $299.8M in net outflows on November 11.
🔻 BlackRock's IBIT: -$269.7M
🔻 Grayscale's GBTC: -$39.1M
🟢 Morgan Stanley's MSBT: +$9M
ETF outflows are still heavy.
#BTC #Bitcoin #BitcoinETF #ETFFlows
📉 $BTC
ETF UPDATE
Spot Bitcoin ETFs saw $299.8M in net outflows on November 11.
🔻 BlackRock's IBIT: -$269.7M
🔻 Grayscale's GBTC: -$39.1M
🟢 Morgan Stanley's MSBT: +$9M
ETF outflows are still heavy.
#BTC #Bitcoin #BitcoinETF #ETFFlows
ETF UPDATE
Spot Bitcoin ETFs saw $299.8M in net outflows on November 11.
🔻 BlackRock's IBIT: -$269.7M
🔻 Grayscale's GBTC: -$39.1M
🟢 Morgan Stanley's MSBT: +$9M
ETF outflows are still heavy.
#BTC #Bitcoin #BitcoinETF #ETFFlows
37

·
--
Bitcoin's sellers are tiring, but the buyers haven't shown up yet.
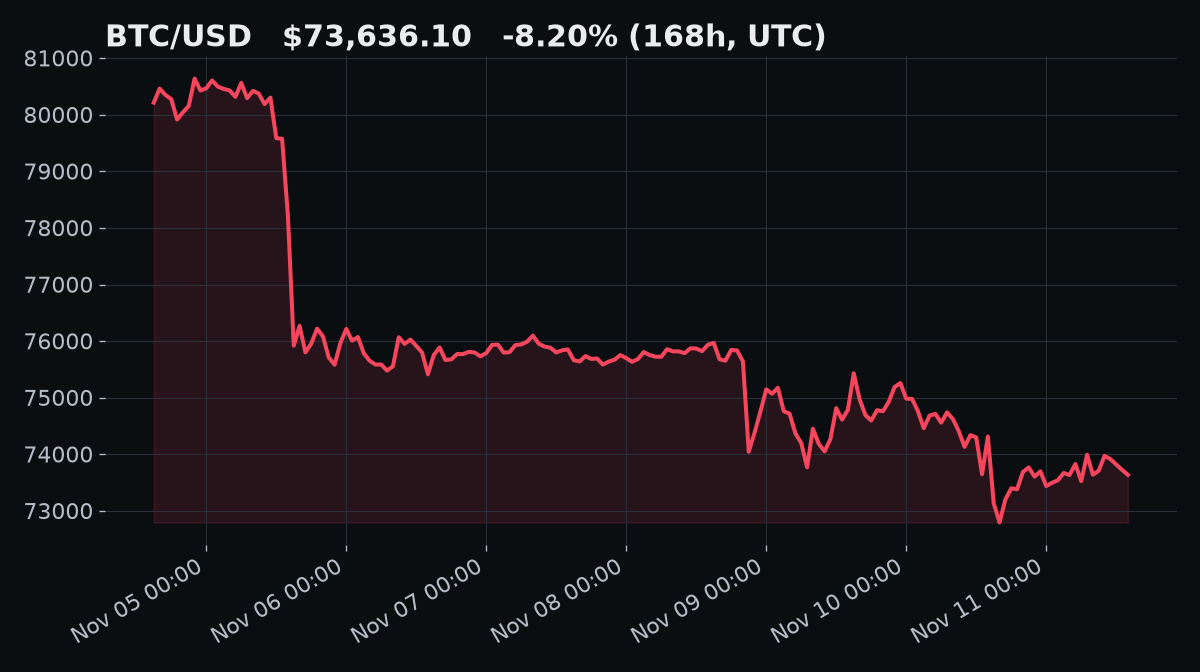
US spot ETF net outflows, daily (SoSoValue):
Thu: $430M
Fri: $412M
Mon: $201M
Tue: $95M, a fourth straight outflow day
Meanwhile (CryptoQuant): USDT supply is down $6.6B in 60 days, the biggest 60-day drop in its data since 2022, and the Coinbase Premium has been negative 30 days running.
$BTC sits at $73,636 after -8.2% over 7 days, right on the 200-day average (~$73,200). My read: slower selling stops the bleeding, but a recovery needs fresh stablecoin money. Reclaiming the 365-day average (~$76,400) would be the first sign. Not financial advice.
Disclosure: Write to Earn may pay me a commission on cashtag trades.
#Bitcoin #ETFFlows
Bitcoin's sellers are tiring, but the buyers haven't shown up yet.
US spot ETF net outflows, daily (SoSoValue):
Thu: $430M
Fri: $412M
Mon: $201M
Tue: $95M, a fourth straight outflow day
Meanwhile (CryptoQuant): USDT supply is down $6.6B in 60 days, the biggest 60-day drop in its data since 2022, and the Coinbase Premium has been negative 30 days running.
$BTC sits at $73,636 after -8.2% over 7 days, right on the 200-day average (~$73,200). My read: slower selling stops the bleeding, but a recovery needs fresh stablecoin money. Reclaiming the 365-day average (~$76,400) would be the first sign. Not financial advice.
Disclosure: Write to Earn may pay me a commission on cashtag trades.
#Bitcoin #ETFFlows
US spot ETF net outflows, daily (SoSoValue):
Thu: $430M
Fri: $412M
Mon: $201M
Tue: $95M, a fourth straight outflow day
Meanwhile (CryptoQuant): USDT supply is down $6.6B in 60 days, the biggest 60-day drop in its data since 2022, and the Coinbase Premium has been negative 30 days running.
$BTC sits at $73,636 after -8.2% over 7 days, right on the 200-day average (~$73,200). My read: slower selling stops the bleeding, but a recovery needs fresh stablecoin money. Reclaiming the 365-day average (~$76,400) would be the first sign. Not financial advice.
Disclosure: Write to Earn may pay me a commission on cashtag trades.
#Bitcoin #ETFFlows
1

🦈 INSTITUTIONAL CAPITAL EVAPORATES AS $BTC LEADS $103M ACROSS-THE-BOARD ETF WITHDRAWALS! 📉
Smart money is adjusting its risk parameters as spot vehicle redemptions peak, with $BTC taking the heavy blow of $95 million in net outflows. 📊
While total withdrawals hit $103.94 million across $BTC , $ETH , and $XRP , institutional footprint analysis shows this is routine portfolio rebalancing rather than a structural breakdown of trend support. 💡
Monitoring subsequent sessions will reveal if traditional market participants resume accumulation or extend distribution. 💬 Are you reading this single-session liquidity flush as a dip-buying window or a warning sign? 👇
⚠️ Not financial advice. Always manage your risk. 🛡️
🏷️ #BTC #ETFFlows #Crypto #MarketStructure
🦈 🌊
🦈 INSTITUTIONAL CAPITAL EVAPORATES AS $BTC LEADS $103M ACROSS-THE-BOARD ETF WITHDRAWALS! 📉
Smart money is adjusting its risk parameters as spot vehicle redemptions peak, with $BTC taking the heavy blow of $95 million in net outflows. 📊
While total withdrawals hit $103.94 million across $BTC , $ETH , and $XRP , institutional footprint analysis shows this is routine portfolio rebalancing rather than a structural breakdown of trend support. 💡
Monitoring subsequent sessions will reveal if traditional market participants resume accumulation or extend distribution. 💬 Are you reading this single-session liquidity flush as a dip-buying window or a warning sign? 👇
⚠️ Not financial advice. Always manage your risk. 🛡️
🏷️ #BTC #ETFFlows #Crypto #MarketStructure
🦈 🌊
Smart money is adjusting its risk parameters as spot vehicle redemptions peak, with $BTC taking the heavy blow of $95 million in net outflows. 📊
While total withdrawals hit $103.94 million across $BTC , $ETH , and $XRP , institutional footprint analysis shows this is routine portfolio rebalancing rather than a structural breakdown of trend support. 💡
Monitoring subsequent sessions will reveal if traditional market participants resume accumulation or extend distribution. 💬 Are you reading this single-session liquidity flush as a dip-buying window or a warning sign? 👇
⚠️ Not financial advice. Always manage your risk. 🛡️
🏷️ #BTC #ETFFlows #Crypto #MarketStructure
🦈 🌊
·
--
$ETH has three signals pointing different ways today. Here's how I read them:
1. Fund money is leaving. U.S. spot ether ETFs lost $184.6M on Monday (Farside Investors).
2. Options traders are leaning the other way. The most-traded ETH contract is the $2,600 call expiring Dec. 25, though puts still carry about an 11% skew premium over one week (CoinDesk).
3. Derivatives got hurt. ETH liquidations hit $505M in 24 hours, more than BTC's $318M (CoinGlass via Coin Edition).
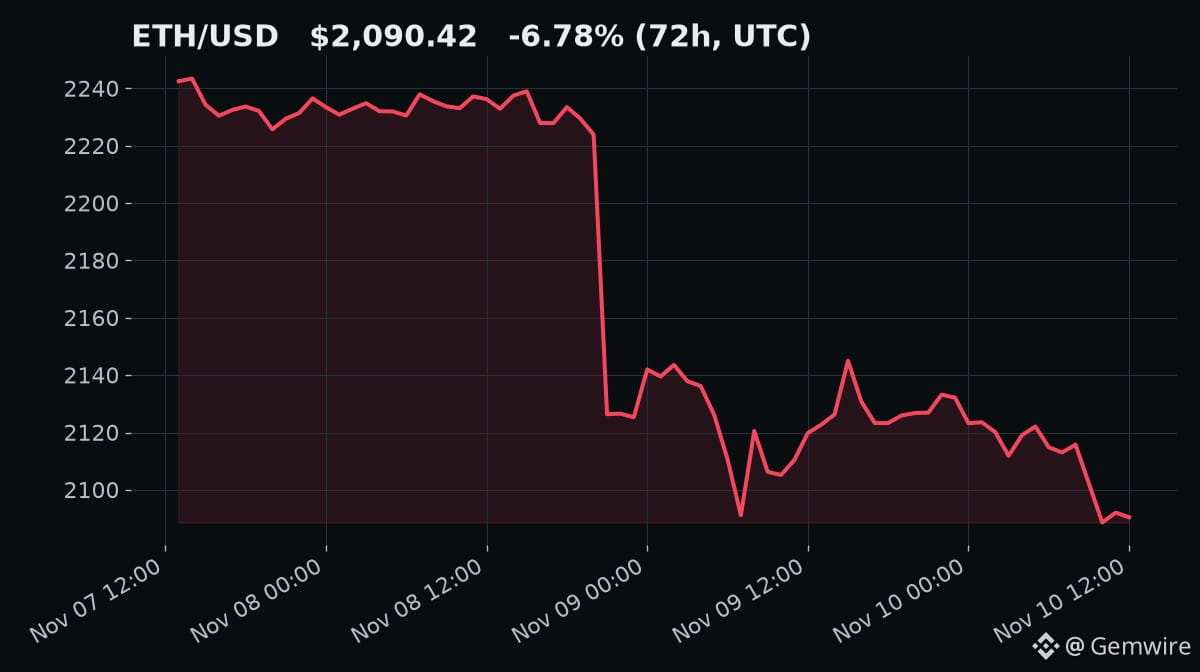
The chart shows ETH about 6.8% lower over 72 hours, near $2,090.
My take: ETF selling is a slow tide, while call buying is a bet on a bounce. Both can be true until the CPI print at 13:30 UTC shows which one is louder. Watch whether ETF outflows slow before price reclaims the recent range.
Which signal do you trust more, flows or options? Not financial advice.
Disclosure: Write to Earn may pay me a commission on cashtag trades.
#ETH #ETFFlows #CPI
$ETH has three signals pointing different ways today. Here's how I read them:
1. Fund money is leaving. U.S. spot ether ETFs lost $184.6M on Monday (Farside Investors).
2. Options traders are leaning the other way. The most-traded ETH contract is the $2,600 call expiring Dec. 25, though puts still carry about an 11% skew premium over one week (CoinDesk).
3. Derivatives got hurt. ETH liquidations hit $505M in 24 hours, more than BTC's $318M (CoinGlass via Coin Edition).
The chart shows ETH about 6.8% lower over 72 hours, near $2,090.
My take: ETF selling is a slow tide, while call buying is a bet on a bounce. Both can be true until the CPI print at 13:30 UTC shows which one is louder. Watch whether ETF outflows slow before price reclaims the recent range.
Which signal do you trust more, flows or options? Not financial advice.
Disclosure: Write to Earn may pay me a commission on cashtag trades.
#ETH #ETFFlows #CPI
1. Fund money is leaving. U.S. spot ether ETFs lost $184.6M on Monday (Farside Investors).
2. Options traders are leaning the other way. The most-traded ETH contract is the $2,600 call expiring Dec. 25, though puts still carry about an 11% skew premium over one week (CoinDesk).
3. Derivatives got hurt. ETH liquidations hit $505M in 24 hours, more than BTC's $318M (CoinGlass via Coin Edition).
The chart shows ETH about 6.8% lower over 72 hours, near $2,090.
My take: ETF selling is a slow tide, while call buying is a bet on a bounce. Both can be true until the CPI print at 13:30 UTC shows which one is louder. Watch whether ETF outflows slow before price reclaims the recent range.
Which signal do you trust more, flows or options? Not financial advice.
Disclosure: Write to Earn may pay me a commission on cashtag trades.
#ETH #ETFFlows #CPI
2

·
--
Jane Street Nearly 8x Its Fidelity Bitcoin ETF Holdings While Cutting IBIT, as Institutions Reallocate Between ETFs
Market maker Jane Street’s Q3 holdings disclosure offers a clear window into how institutions are shifting allocations between Bitcoin ETFs.
According to Cointelegraph, by the end of the third quarter, Jane Street had reduced its holdings of BlackRock’s Bitcoin ETF (IBIT) by 19%, while increasing its holdings of Fidelity’s Bitcoin ETF to nearly eight times their previous level. It’s worth noting that some of the decline in IBIT holdings may be due to the share price rising and increasing the value of each share, rather than being purely the result of selling. Still, the relative change in overall positions is worth watching.
Why this matters is that it reflects a market maker reallocating between similar assets, rather than simply money flowing in or out. As the largest Bitcoin ETF, changes in IBIT’s holdings are often seen as one indicator of institutional allocation preferences. Jane Street’s appearance on the lists of firms increasing Fidelity holdings and reducing IBIT holdings suggests that capital may be shifting from the leading product to other offerings.
The data show a contrast between the two figures: nearly eightfold growth on the Fidelity side and a 19% reduction on the IBIT side. But keep in mind that the decline in IBIT holdings does not necessarily mean net outflows—a rising share price can increase the market value of the holdings, creating the appearance of a reduction in the figures. Therefore, rebalancing by a single market maker is not enough to determine the overall direction of capital flows.
To assess how the market may react, it’s important to distinguish short-term sentiment from medium-term trends. A decline in IBIT holdings could signal pressure on its short-term fund flow data, but the actions of one market maker do not necessarily reflect the direction of net inflows or outflows across the entire Bitcoin ETF sector.
One counterpoint is that a single market maker’s rebalancing represents too small a sample, and price effects may have influenced the decline in IBIT holdings. Confirming a trend requires looking at full-week ETF net inflow and outflow data as a whole to avoid overinterpreting the figures.
What to watch next: from a trading perspective, it’s more important to wait for market confirmation. If you’re watching $IBIT, it’s more useful in the short term to look for corresponding changes in trading volume and funding rates than to draw conclusions based solely on one market maker’s holdings.
$IBIT #BitcoinETF #ETFFlows
The above is a compilation of information and personal analysis, and does not constitute investment advice.
Follow me for ongoing coverage of key market developments and data.
Jane Street Nearly 8x Its Fidelity Bitcoin ETF Holdings While Cutting IBIT, as Institutions Reallocate Between ETFs
Market maker Jane Street’s Q3 holdings disclosure offers a clear window into how institutions are shifting allocations between Bitcoin ETFs.
According to Cointelegraph, by the end of the third quarter, Jane Street had reduced its holdings of BlackRock’s Bitcoin ETF (IBIT) by 19%, while increasing its holdings of Fidelity’s Bitcoin ETF to nearly eight times their previous level. It’s worth noting that some of the decline in IBIT holdings may be due to the share price rising and increasing the value of each share, rather than being purely the result of selling. Still, the relative change in overall positions is worth watching.
Why this matters is that it reflects a market maker reallocating between similar assets, rather than simply money flowing in or out. As the largest Bitcoin ETF, changes in IBIT’s holdings are often seen as one indicator of institutional allocation preferences. Jane Street’s appearance on the lists of firms increasing Fidelity holdings and reducing IBIT holdings suggests that capital may be shifting from the leading product to other offerings.
The data show a contrast between the two figures: nearly eightfold growth on the Fidelity side and a 19% reduction on the IBIT side. But keep in mind that the decline in IBIT holdings does not necessarily mean net outflows—a rising share price can increase the market value of the holdings, creating the appearance of a reduction in the figures. Therefore, rebalancing by a single market maker is not enough to determine the overall direction of capital flows.
To assess how the market may react, it’s important to distinguish short-term sentiment from medium-term trends. A decline in IBIT holdings could signal pressure on its short-term fund flow data, but the actions of one market maker do not necessarily reflect the direction of net inflows or outflows across the entire Bitcoin ETF sector.
One counterpoint is that a single market maker’s rebalancing represents too small a sample, and price effects may have influenced the decline in IBIT holdings. Confirming a trend requires looking at full-week ETF net inflow and outflow data as a whole to avoid overinterpreting the figures.
What to watch next: from a trading perspective, it’s more important to wait for market confirmation. If you’re watching $IBIT, it’s more useful in the short term to look for corresponding changes in trading volume and funding rates than to draw conclusions based solely on one market maker’s holdings.
$IBIT #BitcoinETF #ETFFlows
The above is a compilation of information and personal analysis, and does not constitute investment advice.
Follow me for ongoing coverage of key market developments and data.
Market maker Jane Street’s Q3 holdings disclosure offers a clear window into how institutions are shifting allocations between Bitcoin ETFs.
According to Cointelegraph, by the end of the third quarter, Jane Street had reduced its holdings of BlackRock’s Bitcoin ETF (IBIT) by 19%, while increasing its holdings of Fidelity’s Bitcoin ETF to nearly eight times their previous level. It’s worth noting that some of the decline in IBIT holdings may be due to the share price rising and increasing the value of each share, rather than being purely the result of selling. Still, the relative change in overall positions is worth watching.
Why this matters is that it reflects a market maker reallocating between similar assets, rather than simply money flowing in or out. As the largest Bitcoin ETF, changes in IBIT’s holdings are often seen as one indicator of institutional allocation preferences. Jane Street’s appearance on the lists of firms increasing Fidelity holdings and reducing IBIT holdings suggests that capital may be shifting from the leading product to other offerings.
The data show a contrast between the two figures: nearly eightfold growth on the Fidelity side and a 19% reduction on the IBIT side. But keep in mind that the decline in IBIT holdings does not necessarily mean net outflows—a rising share price can increase the market value of the holdings, creating the appearance of a reduction in the figures. Therefore, rebalancing by a single market maker is not enough to determine the overall direction of capital flows.
To assess how the market may react, it’s important to distinguish short-term sentiment from medium-term trends. A decline in IBIT holdings could signal pressure on its short-term fund flow data, but the actions of one market maker do not necessarily reflect the direction of net inflows or outflows across the entire Bitcoin ETF sector.
One counterpoint is that a single market maker’s rebalancing represents too small a sample, and price effects may have influenced the decline in IBIT holdings. Confirming a trend requires looking at full-week ETF net inflow and outflow data as a whole to avoid overinterpreting the figures.
What to watch next: from a trading perspective, it’s more important to wait for market confirmation. If you’re watching $IBIT, it’s more useful in the short term to look for corresponding changes in trading volume and funding rates than to draw conclusions based solely on one market maker’s holdings.
$IBIT #BitcoinETF #ETFFlows
The above is a compilation of information and personal analysis, and does not constitute investment advice.
Follow me for ongoing coverage of key market developments and data.
IBITETF-3.95%

💠 ETH’s institutional picture — two fresh data points:
1️⃣ ETH ETFs: third consecutive day of outflows — total of 184.5M (CoinMarketCap)
2️⃣ BitMine (ETH treasury company): reported a fiscal 2026 net loss of 6.3B — impact of the ETH price slide (Cointelegraph)
Spot ETH is around 2,070, up 1% in 24 hours — the price is slightly in the green, but flows are still in exit mode.
This kind of divergence is common around bottoms: the price stabilizes first, and flows follow later. If ETH holds above 2,010, this divergence becomes meaningful. 📏
$ETH
#Ethereum #ETFFlows #CryptoMarkets
💠 ETH’s institutional picture — two fresh data points:
1️⃣ ETH ETFs: third consecutive day of outflows — total of 184.5M (CoinMarketCap)
2️⃣ BitMine (ETH treasury company): reported a fiscal 2026 net loss of 6.3B — impact of the ETH price slide (Cointelegraph)
Spot ETH is around 2,070, up 1% in 24 hours — the price is slightly in the green, but flows are still in exit mode.
This kind of divergence is common around bottoms: the price stabilizes first, and flows follow later. If ETH holds above 2,010, this divergence becomes meaningful. 📏
$ETH
#Ethereum #ETFFlows #CryptoMarkets
1️⃣ ETH ETFs: third consecutive day of outflows — total of 184.5M (CoinMarketCap)
2️⃣ BitMine (ETH treasury company): reported a fiscal 2026 net loss of 6.3B — impact of the ETH price slide (Cointelegraph)
Spot ETH is around 2,070, up 1% in 24 hours — the price is slightly in the green, but flows are still in exit mode.
This kind of divergence is common around bottoms: the price stabilizes first, and flows follow later. If ETH holds above 2,010, this divergence becomes meaningful. 📏
$ETH
#Ethereum #ETFFlows #CryptoMarkets
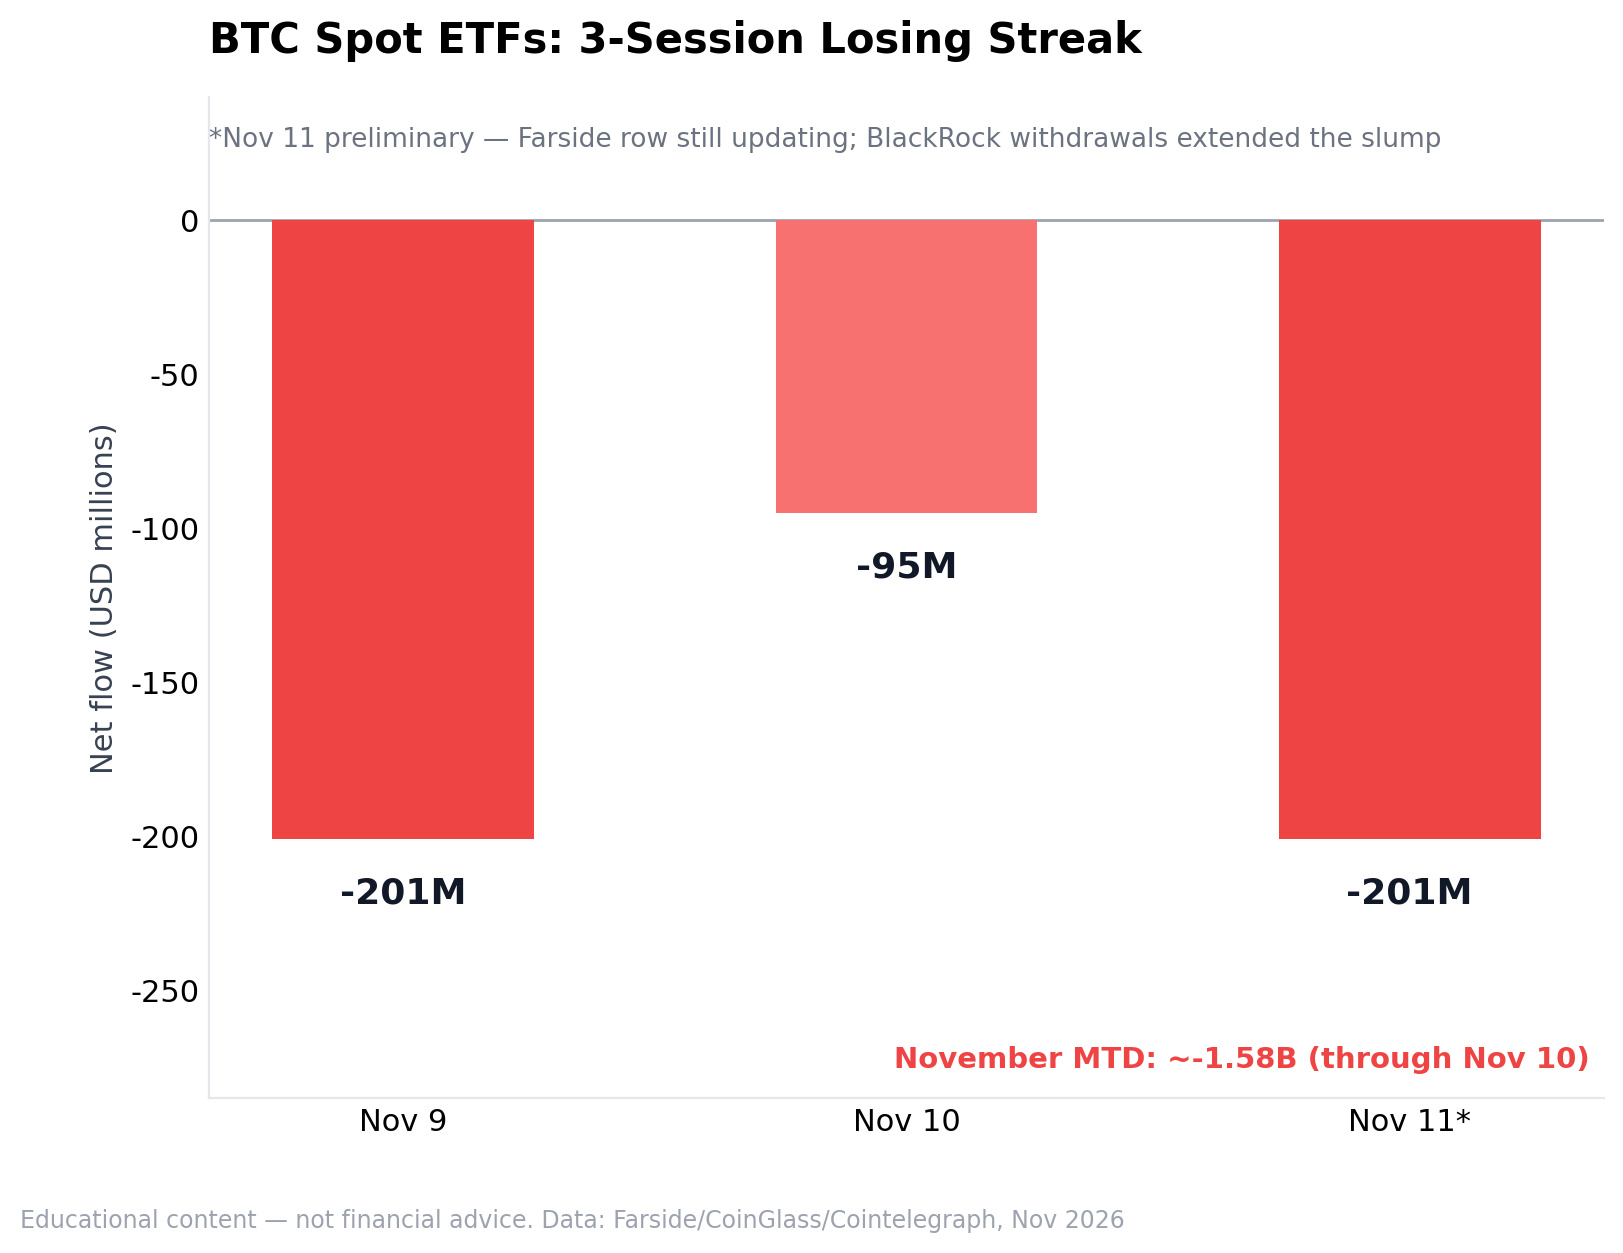
📊 Bitcoin ETFs’ losing streak has now reached 3 sessions.
Farside’s numbers:
1️⃣ Nov 9: -201M net outflow
2️⃣ Nov 10: -95M (completed row)
3️⃣ Nov 11: ~-201M (preliminary) — BlackRock withdrawals extended the slump
November month-to-date now stands at ~1.58B in outflows — the biggest supply pressure this month.
All three days at a glance in the chart. The directional message is clear: institutions aren’t yet becoming consistent buyers. 🧭
$BTC
#BitcoinETF #ETFFlows #CryptoMarkets
📊 Bitcoin ETFs’ losing streak has now reached 3 sessions.
Farside’s numbers:
1️⃣ Nov 9: -201M net outflow
2️⃣ Nov 10: -95M (completed row)
3️⃣ Nov 11: ~-201M (preliminary) — BlackRock withdrawals extended the slump
November month-to-date now stands at ~1.58B in outflows — the biggest supply pressure this month.
All three days at a glance in the chart. The directional message is clear: institutions aren’t yet becoming consistent buyers. 🧭
$BTC
#BitcoinETF #ETFFlows #CryptoMarkets
Farside’s numbers:
1️⃣ Nov 9: -201M net outflow
2️⃣ Nov 10: -95M (completed row)
3️⃣ Nov 11: ~-201M (preliminary) — BlackRock withdrawals extended the slump
November month-to-date now stands at ~1.58B in outflows — the biggest supply pressure this month.
All three days at a glance in the chart. The directional message is clear: institutions aren’t yet becoming consistent buyers. 🧭
$BTC
#BitcoinETF #ETFFlows #CryptoMarkets
52

·
--
Spot Bitcoin ETFs just had their worst week since June, and 2026 flows are now in the red.
• US spot BTC ETFs saw about $1.28B in net outflows last week, the most since late June
• Year-to-date 2026 flows flipped to roughly $914M in net outflows
• Four of five trading days were negative
Why it matters: ETF flows are a widely watched gauge of institutional demand, and that demand turned negative for the year.
Source: CoinDesk
Not financial advice.
💬 Is the ETF bid fading for good, or is this a pause before year-end?
$BTC #Bitcoin #BitcoinETF #ETFflows
Spot Bitcoin ETFs just had their worst week since June, and 2026 flows are now in the red.
• US spot BTC ETFs saw about $1.28B in net outflows last week, the most since late June
• Year-to-date 2026 flows flipped to roughly $914M in net outflows
• Four of five trading days were negative
Why it matters: ETF flows are a widely watched gauge of institutional demand, and that demand turned negative for the year.
Source: CoinDesk
Not financial advice.
💬 Is the ETF bid fading for good, or is this a pause before year-end?
$BTC #Bitcoin #BitcoinETF #ETFflows
• US spot BTC ETFs saw about $1.28B in net outflows last week, the most since late June
• Year-to-date 2026 flows flipped to roughly $914M in net outflows
• Four of five trading days were negative
Why it matters: ETF flows are a widely watched gauge of institutional demand, and that demand turned negative for the year.
Source: CoinDesk
Not financial advice.
💬 Is the ETF bid fading for good, or is this a pause before year-end?
$BTC #Bitcoin #BitcoinETF #ETFflows
61

The Heavy ETF Drain That’s Deepening Crypto Caution😕
U.S. spot Bitcoin ETFs recorded $1.28 billion in net outflows, adding to the pressure already weighing on digital assets. Crypto sentiment stayed firmly cautious, with the Fear & Greed Index slipping to 28 as traders continued to reduce risk.
In contrast, traditional markets showed selective strength. The Nasdaq 100 rose 1.35%, leading a mixed session for U.S. equities and highlighting a clear divergence between resilient large-cap tech and the ongoing outflow-driven weakness in Bitcoin-related products.
$BTC $QQQB $QQQ #CoinVahini #Bitcoin #ETFFlows #CryptoSentiment
The Heavy ETF Drain That’s Deepening Crypto Caution😕
U.S. spot Bitcoin ETFs recorded $1.28 billion in net outflows, adding to the pressure already weighing on digital assets. Crypto sentiment stayed firmly cautious, with the Fear & Greed Index slipping to 28 as traders continued to reduce risk.
In contrast, traditional markets showed selective strength. The Nasdaq 100 rose 1.35%, leading a mixed session for U.S. equities and highlighting a clear divergence between resilient large-cap tech and the ongoing outflow-driven weakness in Bitcoin-related products.
$BTC $QQQB $QQQ #CoinVahini #Bitcoin #ETFFlows #CryptoSentiment
U.S. spot Bitcoin ETFs recorded $1.28 billion in net outflows, adding to the pressure already weighing on digital assets. Crypto sentiment stayed firmly cautious, with the Fear & Greed Index slipping to 28 as traders continued to reduce risk.
In contrast, traditional markets showed selective strength. The Nasdaq 100 rose 1.35%, leading a mixed session for U.S. equities and highlighting a clear divergence between resilient large-cap tech and the ongoing outflow-driven weakness in Bitcoin-related products.
$BTC $QQQB $QQQ #CoinVahini #Bitcoin #ETFFlows #CryptoSentiment
7
·
--
Saylor is teasing another buy while ETFs bleed.
Strategy's last filing (Nov 2): 811 $BTC for $65.5M.
Sunday's chart post hints at one more.
Meanwhile US spot Bitcoin ETFs lost $1.28B last week, the worst since late June (SoSoValue).
Takeaway: one big corporate buyer is leaning in as funds lean out. Small next to the outflows, but it shows who's still accumulating near $76K.
Does Strategy's buying matter more than ETF flows right now, or is it just noise?
Not financial advice.
#Bitcoin #Strategy #BTC #ETFFlows
Saylor is teasing another buy while ETFs bleed.
Strategy's last filing (Nov 2): 811 $BTC for $65.5M.
Sunday's chart post hints at one more.
Meanwhile US spot Bitcoin ETFs lost $1.28B last week, the worst since late June (SoSoValue).
Takeaway: one big corporate buyer is leaning in as funds lean out. Small next to the outflows, but it shows who's still accumulating near $76K.
Does Strategy's buying matter more than ETF flows right now, or is it just noise?
Not financial advice.
#Bitcoin #Strategy #BTC #ETFFlows
Strategy's last filing (Nov 2): 811 $BTC for $65.5M.
Sunday's chart post hints at one more.
Meanwhile US spot Bitcoin ETFs lost $1.28B last week, the worst since late June (SoSoValue).
Takeaway: one big corporate buyer is leaning in as funds lean out. Small next to the outflows, but it shows who's still accumulating near $76K.
Does Strategy's buying matter more than ETF flows right now, or is it just noise?
Not financial advice.
#Bitcoin #Strategy #BTC #ETFFlows
3

·
--
Nearly $2 Billion Flees Bitcoin ETFs: Where Is the Pressure Coming From?The flow of institutional capital through Bitcoin ETFs is under significant pressure amid market volatility:
Net outflows: As of early November 2026, Bitcoin ETFs had recorded net outflows of around $1.84 billion year to date. During the three sessions from October 30 to November 3, amid the Binance hack, outflows surged to $1.16 billion, with BlackRock accounting for the bulk. A further $412 million flowed out on November 6, leaving total net assets at around $95.9 billion.
Nearly $2 Billion Flees Bitcoin ETFs: Where Is the Pressure Coming From?
The flow of institutional capital through Bitcoin ETFs is under significant pressure amid market volatility:
Net outflows: As of early November 2026, Bitcoin ETFs had recorded net outflows of around $1.84 billion year to date. During the three sessions from October 30 to November 3, amid the Binance hack, outflows surged to $1.16 billion, with BlackRock accounting for the bulk. A further $412 million flowed out on November 6, leaving total net assets at around $95.9 billion.
Net outflows: As of early November 2026, Bitcoin ETFs had recorded net outflows of around $1.84 billion year to date. During the three sessions from October 30 to November 3, amid the Binance hack, outflows surged to $1.16 billion, with BlackRock accounting for the bulk. A further $412 million flowed out on November 6, leaving total net assets at around $95.9 billion.
65
·
--
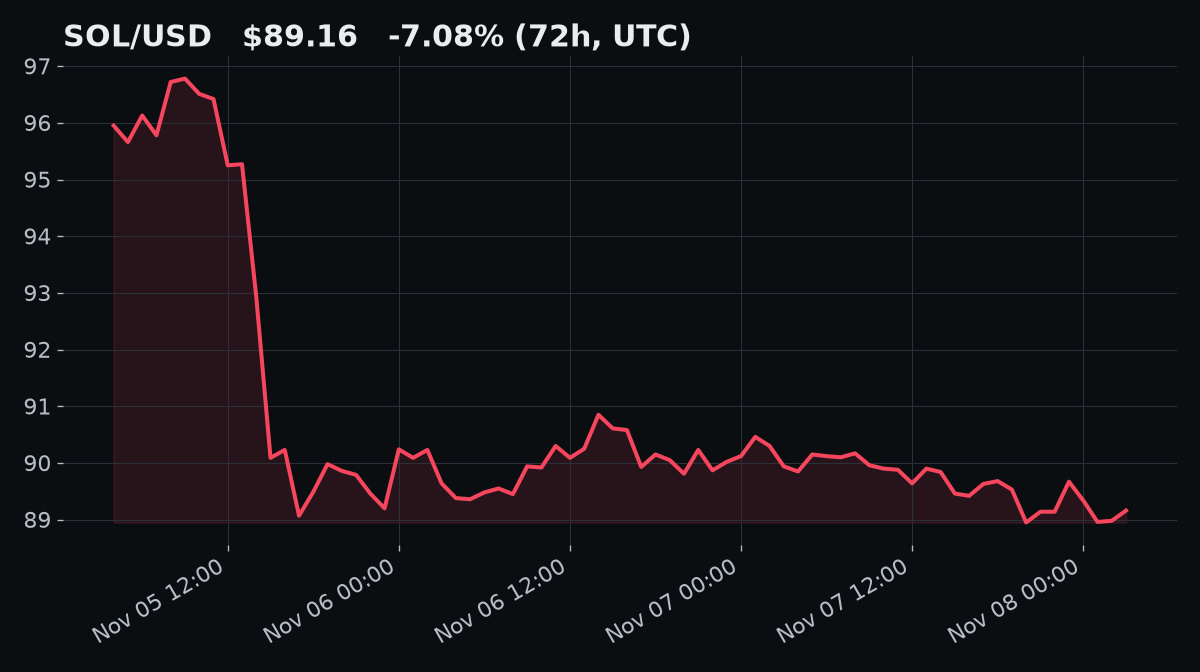
$SOL slipped under $90 and the ETF bid has vanished.
• US spot Solana ETFs: 12 straight sessions with no net inflows, ~$25M withdrawn in the latest one (KCEX News)
• SOL is -7.08% over 72h, now around $89
• RSI is rising while price makes lower lows: a bullish divergence, but unconfirmed
My take: divergence hints at seller exhaustion, yet without fresh spot demand it often just fades. Watch ETF flows turning positive and SOL reclaiming short-term moving averages.
Does $SOL hold $85 through next week, or do we see lower first?
Not financial advice.
#Solana #SOL #ETFFlows #Crypto
$SOL slipped under $90 and the ETF bid has vanished.
• US spot Solana ETFs: 12 straight sessions with no net inflows, ~$25M withdrawn in the latest one (KCEX News)
• SOL is -7.08% over 72h, now around $89
• RSI is rising while price makes lower lows: a bullish divergence, but unconfirmed
My take: divergence hints at seller exhaustion, yet without fresh spot demand it often just fades. Watch ETF flows turning positive and SOL reclaiming short-term moving averages.
Does $SOL hold $85 through next week, or do we see lower first?
Not financial advice.
#Solana #SOL #ETFFlows #Crypto
• US spot Solana ETFs: 12 straight sessions with no net inflows, ~$25M withdrawn in the latest one (KCEX News)
• SOL is -7.08% over 72h, now around $89
• RSI is rising while price makes lower lows: a bullish divergence, but unconfirmed
My take: divergence hints at seller exhaustion, yet without fresh spot demand it often just fades. Watch ETF flows turning positive and SOL reclaiming short-term moving averages.
Does $SOL hold $85 through next week, or do we see lower first?
Not financial advice.
#Solana #SOL #ETFFlows #Crypto
5
·
--
Ethereum ETFs just logged a sixth straight week of outflows. One whale is buying anyway.
• Spot ETH ETFs: $365.3M net out this week (The Block)
• Whale 0x4AB7 accumulated 13,100 ETH in one week (AiCoin)
• ETH trades near $2,232 after the Nov 5 sell-off
Institutions are trimming while a single large wallet adds. That split usually resolves when flows turn, so the next ETF print matters more than any one whale.
Who's right: the ETF sellers or the whale? Does $ETH hold $2,200 through Friday, yes or no?
Not financial advice.
#Ethereum #ETFFlows #CryptoNews $BTC
Ethereum ETFs just logged a sixth straight week of outflows. One whale is buying anyway.
• Spot ETH ETFs: $365.3M net out this week (The Block)
• Whale 0x4AB7 accumulated 13,100 ETH in one week (AiCoin)
• ETH trades near $2,232 after the Nov 5 sell-off
Institutions are trimming while a single large wallet adds. That split usually resolves when flows turn, so the next ETF print matters more than any one whale.
Who's right: the ETF sellers or the whale? Does $ETH hold $2,200 through Friday, yes or no?
Not financial advice.
#Ethereum #ETFFlows #CryptoNews $BTC
• Spot ETH ETFs: $365.3M net out this week (The Block)
• Whale 0x4AB7 accumulated 13,100 ETH in one week (AiCoin)
• ETH trades near $2,232 after the Nov 5 sell-off
Institutions are trimming while a single large wallet adds. That split usually resolves when flows turn, so the next ETF print matters more than any one whale.
Who's right: the ETF sellers or the whale? Does $ETH hold $2,200 through Friday, yes or no?
Not financial advice.
#Ethereum #ETFFlows #CryptoNews $BTC
44
·
--
BlackRock's IBIT has now bled six sessions in a row: $1.44B out in total.
Weekly flow check (Nov 2-6):
• US spot Bitcoin ETFs: -$1.28B, worst week since at least early October
• IBIT: -$1.21B of that
• Fidelity's FBTC: +$93.1M, the only big fund in green
• Ethereum ETFs: -$365.2M, a sixth losing week
(Base Camp, Farside data)
$BTC is holding just above $75K support while institutions step back. Spot volume is thin, so a bounce without ETF buyers looks fragile. Watch Monday's flow print.
Will Monday's Bitcoin ETF flows turn positive: yes or no?
$ETH #BitcoinETF #ETFFlows #Bitcoin
Not financial advice.
BlackRock's IBIT has now bled six sessions in a row: $1.44B out in total.
Weekly flow check (Nov 2-6):
• US spot Bitcoin ETFs: -$1.28B, worst week since at least early October
• IBIT: -$1.21B of that
• Fidelity's FBTC: +$93.1M, the only big fund in green
• Ethereum ETFs: -$365.2M, a sixth losing week
(Base Camp, Farside data)
$BTC is holding just above $75K support while institutions step back. Spot volume is thin, so a bounce without ETF buyers looks fragile. Watch Monday's flow print.
Will Monday's Bitcoin ETF flows turn positive: yes or no?
$ETH #BitcoinETF #ETFFlows #Bitcoin
Not financial advice.
Weekly flow check (Nov 2-6):
• US spot Bitcoin ETFs: -$1.28B, worst week since at least early October
• IBIT: -$1.21B of that
• Fidelity's FBTC: +$93.1M, the only big fund in green
• Ethereum ETFs: -$365.2M, a sixth losing week
(Base Camp, Farside data)
$BTC is holding just above $75K support while institutions step back. Spot volume is thin, so a bounce without ETF buyers looks fragile. Watch Monday's flow print.
Will Monday's Bitcoin ETF flows turn positive: yes or no?
$ETH #BitcoinETF #ETFFlows #Bitcoin
Not financial advice.
3

·
--
Spot ETFs on $BTC lost about $1.28 billion during the week of November 2–6, including $411.9 million in a single day on Wednesday. After a strong jobs report, the likelihood of a Fed rate hike in December rose from around 67% to 77%, while crypto failed to join the stock market rebound. Regulatory uncertainty and miner selling are adding further pressure. As long as ETF outflows continue, a recovery without institutional support looks difficult. Not financial advice.
Will ETFs see inflows again, or will outflows continue? 👇
#ETFFlows
Spot ETFs on $BTC lost about $1.28 billion during the week of November 2–6, including $411.9 million in a single day on Wednesday. After a strong jobs report, the likelihood of a Fed rate hike in December rose from around 67% to 77%, while crypto failed to join the stock market rebound. Regulatory uncertainty and miner selling are adding further pressure. As long as ETF outflows continue, a recovery without institutional support looks difficult. Not financial advice.
Will ETFs see inflows again, or will outflows continue? 👇
#ETFFlows
Will ETFs see inflows again, or will outflows continue? 👇
#ETFFlows
3
134
·
--
Fidelity's FBTC pulled in $236.7M in a single session, more than offsetting a $201.2M exit from BlackRock's IBIT.
• Spot bitcoin ETFs: +$74.6M on Nov. 4, ending three straight days of outflows
• FBTC led with +$236.7M; IBIT was the only fund in the red at -$201.2M
• Spot ether ETFs: +$53.0M, their first inflow day since an outflow run that began Oct. 26
Why it matters: ETF flows are a daily read on institutional demand for BTC and ETH.
Source: Farside Investors
Not financial advice.
💬 Is this the start of a new inflow run, or just a one-day bounce? Share your view below.
$BTC $ETH #BitcoinETF #ETFFlows
Fidelity's FBTC pulled in $236.7M in a single session, more than offsetting a $201.2M exit from BlackRock's IBIT.
• Spot bitcoin ETFs: +$74.6M on Nov. 4, ending three straight days of outflows
• FBTC led with +$236.7M; IBIT was the only fund in the red at -$201.2M
• Spot ether ETFs: +$53.0M, their first inflow day since an outflow run that began Oct. 26
Why it matters: ETF flows are a daily read on institutional demand for BTC and ETH.
Source: Farside Investors
Not financial advice.
💬 Is this the start of a new inflow run, or just a one-day bounce? Share your view below.
$BTC $ETH #BitcoinETF #ETFFlows
• Spot bitcoin ETFs: +$74.6M on Nov. 4, ending three straight days of outflows
• FBTC led with +$236.7M; IBIT was the only fund in the red at -$201.2M
• Spot ether ETFs: +$53.0M, their first inflow day since an outflow run that began Oct. 26
Why it matters: ETF flows are a daily read on institutional demand for BTC and ETH.
Source: Farside Investors
Not financial advice.
💬 Is this the start of a new inflow run, or just a one-day bounce? Share your view below.
$BTC $ETH #BitcoinETF #ETFFlows
20

·
--
#BTCRebounds80K
🔄 Bitcoin ETFs Flip to +$74.6M After $1.16B Walked Out
BTC is holding above $80K, and US spot ETFs just posted their first inflow after three straight outflow days.
📈 Nov 4: +$74.6M, after ~$1.16B left Oct 30 to Nov 3 (Farside)
📊 Fidelity FBTC took in $236.7M while BlackRock IBIT lost $201.2M
📉 BTC dipped to ~$75,700 Wednesday, now ~$80,500 (+5.7% in 24h)
⚠️ Resistance sits at $80K-$82K; Ether is up 8% to about $2,425
Zoom out: One inflow day is a pause, not a trend; ETF outflows are still the near-term risk.
BTC holds $80K into Friday's jobs report, or retests $75.7K? 👇
$BTC $ETH
#Bitcoin #ETFFlows #BTCRebounds80K
#BTCRebounds80K
🔄 Bitcoin ETFs Flip to +$74.6M After $1.16B Walked Out
BTC is holding above $80K, and US spot ETFs just posted their first inflow after three straight outflow days.
📈 Nov 4: +$74.6M, after ~$1.16B left Oct 30 to Nov 3 (Farside)
📊 Fidelity FBTC took in $236.7M while BlackRock IBIT lost $201.2M
📉 BTC dipped to ~$75,700 Wednesday, now ~$80,500 (+5.7% in 24h)
⚠️ Resistance sits at $80K-$82K; Ether is up 8% to about $2,425
Zoom out: One inflow day is a pause, not a trend; ETF outflows are still the near-term risk.
BTC holds $80K into Friday's jobs report, or retests $75.7K? 👇
$BTC $ETH
#Bitcoin #ETFFlows #BTCRebounds80K
🔄 Bitcoin ETFs Flip to +$74.6M After $1.16B Walked Out
BTC is holding above $80K, and US spot ETFs just posted their first inflow after three straight outflow days.
📈 Nov 4: +$74.6M, after ~$1.16B left Oct 30 to Nov 3 (Farside)
📊 Fidelity FBTC took in $236.7M while BlackRock IBIT lost $201.2M
📉 BTC dipped to ~$75,700 Wednesday, now ~$80,500 (+5.7% in 24h)
⚠️ Resistance sits at $80K-$82K; Ether is up 8% to about $2,425
Zoom out: One inflow day is a pause, not a trend; ETF outflows are still the near-term risk.
BTC holds $80K into Friday's jobs report, or retests $75.7K? 👇
$BTC $ETH
#Bitcoin #ETFFlows #BTCRebounds80K

29
Log in to explore more content
Join global crypto users on Binance Square
⚡️ Get latest and useful information about crypto.
💬 Trusted by the world’s largest crypto exchange.
👍 Discover real insights from verified creators.
Email / Phone number
Trending Topics
1
#USPPIMissMayEaseBTCPressure
2,692 views
179 Discussing
2
#BitcoinCoreDisclosesTorTrafficVulnerability
0 views
0 Discussing
3
#WhatWillDriveCryptoandStocks’NextRebound?
88,888 views
1,201 Discussing
4
#BitcoinBreaksBelow200WeekMovingAverage
11,807 views
234 Discussing
5
#SpaceXTeslaMergerTalksWouldCombine30220BTC
4,301 views
111 Discussing
6
#Anthropic’s6xIPODemandSignalsPotentialRecordRaise
28,931 views
560 Discussing
7
#USCryptoETFsLose$1.48BInFiveDays
1,017 views
28 Discussing
8
#KoreaDigitalAssetBasicActFinalDraftExpectedEarlyJanuary
2,526 views
15 Discussing
9
#RippleRLUSDMarketCapSurpassesPayPalPYUSD
1,868 views
74 Discussing
10
#JaneStreetNearlyOctuplesFidelityBitcoinETFHoldings
10,346 views
178 Discussing