
#shell
shell
3M views
5,612 Discussing
Hot
Latest

SHELL: A Snapshot Is Not a Complete Market Story
A chart screenshot captures one moment, not the entire history of a market.
On November 4, the displayed SHELL price was $0.02267. The reported 24-hour high and low were $0.02359 and $0.02215.
These figures provide a compact view of recent trading activity, but they do not explain every movement or identify the reason behind a price change.
Good analysis separates observed facts from possible explanations.
#SHELL #MarketResearch #MyShell
SHELL: A Snapshot Is Not a Complete Market Story
A chart screenshot captures one moment, not the entire history of a market.
On November 4, the displayed SHELL price was $0.02267. The reported 24-hour high and low were $0.02359 and $0.02215.
These figures provide a compact view of recent trading activity, but they do not explain every movement or identify the reason behind a price change.
Good analysis separates observed facts from possible explanations.
#SHELL #MarketResearch #MyShell
A chart screenshot captures one moment, not the entire history of a market.
On November 4, the displayed SHELL price was $0.02267. The reported 24-hour high and low were $0.02359 and $0.02215.
These figures provide a compact view of recent trading activity, but they do not explain every movement or identify the reason behind a price change.
Good analysis separates observed facts from possible explanations.
#SHELL #MarketResearch #MyShell
29
Bollinger Bands: Understanding the Weekly SHELL Chart
The weekly SHELL screenshot showed Bollinger Bands at approximately:
- Upper band: $0.02600
- Middle band: $0.02218
- Lower band: $0.01835
Bollinger Bands describe price dispersion around a moving average. They are not guaranteed price targets or predictions.
The indicator is most useful when interpreted alongside price action and market conditions rather than treated as a standalone trading signal.
#SHELL #BollingerBands #TechnicalAnalysis
Bollinger Bands: Understanding the Weekly SHELL Chart
The weekly SHELL screenshot showed Bollinger Bands at approximately:
- Upper band: $0.02600
- Middle band: $0.02218
- Lower band: $0.01835
Bollinger Bands describe price dispersion around a moving average. They are not guaranteed price targets or predictions.
The indicator is most useful when interpreted alongside price action and market conditions rather than treated as a standalone trading signal.
#SHELL #BollingerBands #TechnicalAnalysis
The weekly SHELL screenshot showed Bollinger Bands at approximately:
- Upper band: $0.02600
- Middle band: $0.02218
- Lower band: $0.01835
Bollinger Bands describe price dispersion around a moving average. They are not guaranteed price targets or predictions.
The indicator is most useful when interpreted alongside price action and market conditions rather than treated as a standalone trading signal.
#SHELL #BollingerBands #TechnicalAnalysis
2
MyShell and the Broader AI Creator Ecosystem
MyShell belongs to a broader ecosystem where AI agents and creative workflows are part of the conversation.
When following a project, market data is only one dimension. Product development, creator activity, ecosystem tools and official communication also matter.
These areas should be tracked separately. A change in token price does not automatically confirm a change in product adoption, and community activity alone does not establish market demand.
#MyShell #SHELL #AIAgents
MyShell and the Broader AI Creator Ecosystem
MyShell belongs to a broader ecosystem where AI agents and creative workflows are part of the conversation.
When following a project, market data is only one dimension. Product development, creator activity, ecosystem tools and official communication also matter.
These areas should be tracked separately. A change in token price does not automatically confirm a change in product adoption, and community activity alone does not establish market demand.
#MyShell #SHELL #AIAgents
MyShell belongs to a broader ecosystem where AI agents and creative workflows are part of the conversation.
When following a project, market data is only one dimension. Product development, creator activity, ecosystem tools and official communication also matter.
These areas should be tracked separately. A change in token price does not automatically confirm a change in product adoption, and community activity alone does not establish market demand.
#MyShell #SHELL #AIAgents
5
SHELL Trading Volume: Why Exchange Scope Matters
The November 4 Binance Spot screenshot recorded approximately 7.33 million SHELL in 24-hour volume, equivalent to about 168,005.52 USDT.
This figure represents activity on the displayed Binance Spot market. It is not the same as aggregated volume across multiple exchanges.
Comparing volume figures without checking their source can lead to misleading conclusions about liquidity and market participation.
Clear data labels matter just as much as the numbers themselves.
#SHELL #BinanceSpot #CryptoData
SHELL Trading Volume: Why Exchange Scope Matters
The November 4 Binance Spot screenshot recorded approximately 7.33 million SHELL in 24-hour volume, equivalent to about 168,005.52 USDT.
This figure represents activity on the displayed Binance Spot market. It is not the same as aggregated volume across multiple exchanges.
Comparing volume figures without checking their source can lead to misleading conclusions about liquidity and market participation.
Clear data labels matter just as much as the numbers themselves.
#SHELL #BinanceSpot #CryptoData
The November 4 Binance Spot screenshot recorded approximately 7.33 million SHELL in 24-hour volume, equivalent to about 168,005.52 USDT.
This figure represents activity on the displayed Binance Spot market. It is not the same as aggregated volume across multiple exchanges.
Comparing volume figures without checking their source can lead to misleading conclusions about liquidity and market participation.
Clear data labels matter just as much as the numbers themselves.
#SHELL #BinanceSpot #CryptoData
49
SHELL and the Importance of Historical Context
The chart set shows a historical low around $0.01740. At the displayed price of $0.02267, SHELL was approximately 30% above that recorded low.
Historical comparisons can help describe how far price has moved from a previous extreme.
However, being above a historical low does not automatically indicate that an asset is undervalued or that a recovery will continue. Context is important when interpreting long-term price data.
#SHELL #CryptoHistory #MyShellAI
SHELL and the Importance of Historical Context
The chart set shows a historical low around $0.01740. At the displayed price of $0.02267, SHELL was approximately 30% above that recorded low.
Historical comparisons can help describe how far price has moved from a previous extreme.
However, being above a historical low does not automatically indicate that an asset is undervalued or that a recovery will continue. Context is important when interpreting long-term price data.
#SHELL #CryptoHistory #MyShellAI
The chart set shows a historical low around $0.01740. At the displayed price of $0.02267, SHELL was approximately 30% above that recorded low.
Historical comparisons can help describe how far price has moved from a previous extreme.
However, being above a historical low does not automatically indicate that an asset is undervalued or that a recovery will continue. Context is important when interpreting long-term price data.
#SHELL #CryptoHistory #MyShellAI
5
$SHELL: Reading Market Data Without Mixing Timeframes
A useful market review starts with understanding what each timeframe actually measures.
In the November 4 snapshot, SHELL traded around $0.02267, with a reported 24-hour change of -1.69%. The daily RSI(6) was 42.80, while the weekly RSI(6) stood at 47.81.
These indicators describe different periods of price behavior. They should not be treated as interchangeable signals.
For anyone following SHELL, separating short-term movement from broader market structure is more useful than relying on a single indicator.
#SHELL #MyShell #CryptoAnalysis
$SHELL : Reading Market Data Without Mixing Timeframes
A useful market review starts with understanding what each timeframe actually measures.
In the November 4 snapshot, SHELL traded around $0.02267, with a reported 24-hour change of -1.69%. The daily RSI(6) was 42.80, while the weekly RSI(6) stood at 47.81.
These indicators describe different periods of price behavior. They should not be treated as interchangeable signals.
For anyone following SHELL, separating short-term movement from broader market structure is more useful than relying on a single indicator.
#SHELL #MyShell #CryptoAnalysis
A useful market review starts with understanding what each timeframe actually measures.
In the November 4 snapshot, SHELL traded around $0.02267, with a reported 24-hour change of -1.69%. The daily RSI(6) was 42.80, while the weekly RSI(6) stood at 47.81.
These indicators describe different periods of price behavior. They should not be treated as interchangeable signals.
For anyone following SHELL, separating short-term movement from broader market structure is more useful than relying on a single indicator.
#SHELL #MyShell #CryptoAnalysis
65
Why Timestamp Consistency Matters in Crypto Analysis
Crypto markets operate continuously, so two screenshots taken at different times may show slightly different 24-hour statistics.
In the November 4 SHELL chart set, most screenshots recorded approximately 7.33 million SHELL in volume, while the weekly screenshots showed around 7.35 million.
The difference is consistent with a rolling 24-hour measurement window changing over time.
When comparing market snapshots, timestamps are part of the data, not just extra information.
#SHELL #CryptoData #MarketAnalysis
Why Timestamp Consistency Matters in Crypto Analysis
Crypto markets operate continuously, so two screenshots taken at different times may show slightly different 24-hour statistics.
In the November 4 SHELL chart set, most screenshots recorded approximately 7.33 million SHELL in volume, while the weekly screenshots showed around 7.35 million.
The difference is consistent with a rolling 24-hour measurement window changing over time.
When comparing market snapshots, timestamps are part of the data, not just extra information.
#SHELL #CryptoData #MarketAnalysis
Crypto markets operate continuously, so two screenshots taken at different times may show slightly different 24-hour statistics.
In the November 4 SHELL chart set, most screenshots recorded approximately 7.33 million SHELL in volume, while the weekly screenshots showed around 7.35 million.
The difference is consistent with a rolling 24-hour measurement window changing over time.
When comparing market snapshots, timestamps are part of the data, not just extra information.
#SHELL #CryptoData #MarketAnalysis
22
Don't confuse one exchange's trading volume with the entire market
A Binance Spot screenshot from November 4 showed a volume of about 7.33 million SHELL, equivalent to 168,005.52 USDT over the displayed 24-hour period.
Meanwhile, aggregators may combine data from multiple exchanges. Because their reporting scopes differ, the two figures cannot be directly compared without first identifying their sources.
When tracking SHELL, specifying the exchange and market type helps make the data more transparent.
#SHELL #Binance #DuLieuThiTruong
Don't confuse one exchange's trading volume with the entire market
A Binance Spot screenshot from November 4 showed a volume of about 7.33 million SHELL, equivalent to 168,005.52 USDT over the displayed 24-hour period.
Meanwhile, aggregators may combine data from multiple exchanges. Because their reporting scopes differ, the two figures cannot be directly compared without first identifying their sources.
When tracking SHELL, specifying the exchange and market type helps make the data more transparent.
#SHELL #Binance #DuLieuThiTruong
A Binance Spot screenshot from November 4 showed a volume of about 7.33 million SHELL, equivalent to 168,005.52 USDT over the displayed 24-hour period.
Meanwhile, aggregators may combine data from multiple exchanges. Because their reporting scopes differ, the two figures cannot be directly compared without first identifying their sources.
When tracking SHELL, specifying the exchange and market type helps make the data more transparent.
#SHELL #Binance #DuLieuThiTruong
189
Reading SHELL’s RSI requires paying attention to the time frame
In the daily chart dated 4/11, SHELL’s RSI(6) is 42.80 on the daily time frame, while the weekly time frame shows 47.81.
These two figures reflect movements over different periods. The short-term RSI can change more quickly, while the weekly RSI generally reflects longer-term movement.
Therefore, when analyzing SHELL, specify the time frame rather than simply saying that the RSI is at a certain level.
#SHELL #MyShellAI #CryptoAnalysis
Reading SHELL’s RSI requires paying attention to the time frame
In the daily chart dated 4/11, SHELL’s RSI(6) is 42.80 on the daily time frame, while the weekly time frame shows 47.81.
These two figures reflect movements over different periods. The short-term RSI can change more quickly, while the weekly RSI generally reflects longer-term movement.
Therefore, when analyzing SHELL, specify the time frame rather than simply saying that the RSI is at a certain level.
#SHELL #MyShellAI #CryptoAnalysis
In the daily chart dated 4/11, SHELL’s RSI(6) is 42.80 on the daily time frame, while the weekly time frame shows 47.81.
These two figures reflect movements over different periods. The short-term RSI can change more quickly, while the weekly RSI generally reflects longer-term movement.
Therefore, when analyzing SHELL, specify the time frame rather than simply saying that the RSI is at a certain level.
#SHELL #MyShellAI #CryptoAnalysis
73
Bollinger Bands are an observation tool, not a price prediction
In the weekly chart image of SHELL on 4/11, the Bollinger Bands were recorded as:
- Upper band: 0.02600 USD
- Middle band: 0.02218 USD
- Lower band: 0.01835 USD
These bands describe how prices are dispersed around the moving average. They do not guarantee that the price will reach a specific level.
When using Bollinger Bands, combine them with actual price movements rather than treating each band as a price target.
#SHELL #BollingerBands #CryptoAnalysis
Bollinger Bands are an observation tool, not a price prediction
In the weekly chart image of SHELL on 4/11, the Bollinger Bands were recorded as:
- Upper band: 0.02600 USD
- Middle band: 0.02218 USD
- Lower band: 0.01835 USD
These bands describe how prices are dispersed around the moving average. They do not guarantee that the price will reach a specific level.
When using Bollinger Bands, combine them with actual price movements rather than treating each band as a price target.
#SHELL #BollingerBands #CryptoAnalysis
In the weekly chart image of SHELL on 4/11, the Bollinger Bands were recorded as:
- Upper band: 0.02600 USD
- Middle band: 0.02218 USD
- Lower band: 0.01835 USD
These bands describe how prices are dispersed around the moving average. They do not guarantee that the price will reach a specific level.
When using Bollinger Bands, combine them with actual price movements rather than treating each band as a price target.
#SHELL #BollingerBands #CryptoAnalysis
6
Distinguishing verified data from personal opinions
A market report often contains many types of information: chart data, exchange trading volumes, derivatives statistics, community sentiment, and the writer’s own analysis.
Each category has a different level of verifiability.
For example, RSI(6) and the price shown in an image can be checked directly. By contrast, OI, funding rates, and market sentiment require separate statistical sources.
Clear classification helps prevent SHELL analysis from creating an impression of excessive certainty.
#SHELL #DataTransparency #MarketAnalysis
Distinguishing verified data from personal opinions
A market report often contains many types of information: chart data, exchange trading volumes, derivatives statistics, community sentiment, and the writer’s own analysis.
Each category has a different level of verifiability.
For example, RSI(6) and the price shown in an image can be checked directly. By contrast, OI, funding rates, and market sentiment require separate statistical sources.
Clear classification helps prevent SHELL analysis from creating an impression of excessive certainty.
#SHELL #DataTransparency #MarketAnalysis
A market report often contains many types of information: chart data, exchange trading volumes, derivatives statistics, community sentiment, and the writer’s own analysis.
Each category has a different level of verifiability.
For example, RSI(6) and the price shown in an image can be checked directly. By contrast, OI, funding rates, and market sentiment require separate statistical sources.
Clear classification helps prevent SHELL analysis from creating an impression of excessive certainty.
#SHELL #DataTransparency #MarketAnalysis
6
A chart snapshot cannot tell the whole market story
The SHELL price in the image set dated 4/11 was recorded at 0.02267 USD. The 24-hour range shown is from 0.02215 to 0.02359 USD.
This is data observed at the time the snapshot was taken, not an explanation of the causes of the price movement.
Understanding the market requires combining price history, volume, derivatives data, and project information. Each source should be recorded separately to avoid drawing conclusions from a single chart.
#SHELL #MyShellAI #CryptoMarket
A chart snapshot cannot tell the whole market story
The SHELL price in the image set dated 4/11 was recorded at 0.02267 USD. The 24-hour range shown is from 0.02215 to 0.02359 USD.
This is data observed at the time the snapshot was taken, not an explanation of the causes of the price movement.
Understanding the market requires combining price history, volume, derivatives data, and project information. Each source should be recorded separately to avoid drawing conclusions from a single chart.
#SHELL #MyShellAI #CryptoMarket
The SHELL price in the image set dated 4/11 was recorded at 0.02267 USD. The 24-hour range shown is from 0.02215 to 0.02359 USD.
This is data observed at the time the snapshot was taken, not an explanation of the causes of the price movement.
Understanding the market requires combining price history, volume, derivatives data, and project information. Each source should be recorded separately to avoid drawing conclusions from a single chart.
#SHELL #MyShellAI #CryptoMarket
7
The current price being higher than the historical low does not mean the trend has recovered
In the chart provided, SHELL’s previous low price area is recorded at around 0.01740 USD. At the reference price of 0.02267 USD shown in the image dated 4/11, the current price is about 30% higher than that low.
This is only a comparison between two historical price levels.
The gap from the previous low cannot, by itself, prove that the long-term trend has reversed. Price movements and market data across multiple periods need to be assessed as well.
#SHELL #MyShell #CryptoResearch
The current price being higher than the historical low does not mean the trend has recovered
In the chart provided, SHELL’s previous low price area is recorded at around 0.01740 USD. At the reference price of 0.02267 USD shown in the image dated 4/11, the current price is about 30% higher than that low.
This is only a comparison between two historical price levels.
The gap from the previous low cannot, by itself, prove that the long-term trend has reversed. Price movements and market data across multiple periods need to be assessed as well.
#SHELL #MyShell #CryptoResearch
In the chart provided, SHELL’s previous low price area is recorded at around 0.01740 USD. At the reference price of 0.02267 USD shown in the image dated 4/11, the current price is about 30% higher than that low.
This is only a comparison between two historical price levels.
The gap from the previous low cannot, by itself, prove that the long-term trend has reversed. Price movements and market data across multiple periods need to be assessed as well.
#SHELL #MyShell #CryptoResearch
14
Liquidity should be viewed within the scope of the data
A token’s trading volume can vary significantly across exchanges and trading pairs.
Therefore, figures shown in a Binance Spot screenshot do not represent SHELL’s overall liquidity across all platforms.
Especially for assets with a small market capitalization, readers should check the data source, trading pair, and measurement period before drawing conclusions.
#SHELL #CryptoLiquidity #MyShellAI
Liquidity should be viewed within the scope of the data
A token’s trading volume can vary significantly across exchanges and trading pairs.
Therefore, figures shown in a Binance Spot screenshot do not represent SHELL’s overall liquidity across all platforms.
Especially for assets with a small market capitalization, readers should check the data source, trading pair, and measurement period before drawing conclusions.
#SHELL #CryptoLiquidity #MyShellAI
A token’s trading volume can vary significantly across exchanges and trading pairs.
Therefore, figures shown in a Binance Spot screenshot do not represent SHELL’s overall liquidity across all platforms.
Especially for assets with a small market capitalization, readers should check the data source, trading pair, and measurement period before drawing conclusions.
#SHELL #CryptoLiquidity #MyShellAI
14
Why record when the data was captured?
The crypto market operates continuously, so two snapshots taken at different times may show slightly different 24-hour volumes.
In the SHELL snapshot set from 4/11, most snapshots recorded around 7.33 million SHELL, while two weekly snapshots showed around 7.35 million SHELL.
This is a small difference that can occur as the rolling 24-hour statistics window shifts.
Recording when the snapshots were taken makes data comparisons more accurate and transparent.
#SHELL #MyShell #CryptoAnalysis
Why record when the data was captured?
The crypto market operates continuously, so two snapshots taken at different times may show slightly different 24-hour volumes.
In the SHELL snapshot set from 4/11, most snapshots recorded around 7.33 million SHELL, while two weekly snapshots showed around 7.35 million SHELL.
This is a small difference that can occur as the rolling 24-hour statistics window shifts.
Recording when the snapshots were taken makes data comparisons more accurate and transparent.
#SHELL #MyShell #CryptoAnalysis
The crypto market operates continuously, so two snapshots taken at different times may show slightly different 24-hour volumes.
In the SHELL snapshot set from 4/11, most snapshots recorded around 7.33 million SHELL, while two weekly snapshots showed around 7.35 million SHELL.
This is a small difference that can occur as the rolling 24-hour statistics window shifts.
Recording when the snapshots were taken makes data comparisons more accurate and transparent.
#SHELL #MyShell #CryptoAnalysis
217
Following MyShell shouldn’t mean looking only at the token price
An AI ecosystem needs to be viewed from multiple angles: its products, creative tools, developer activity, community, and official updates.
The price of SHELL is one part of the picture, but it can’t represent the full state of MyShell’s development.
Conversely, a new feature doesn’t automatically prove that demand for the token is increasing. These two aspects need to be assessed independently.
#MyShellAI #SHELL #AIAgent
Following MyShell shouldn’t mean looking only at the token price
An AI ecosystem needs to be viewed from multiple angles: its products, creative tools, developer activity, community, and official updates.
The price of SHELL is one part of the picture, but it can’t represent the full state of MyShell’s development.
Conversely, a new feature doesn’t automatically prove that demand for the token is increasing. These two aspects need to be assessed independently.
#MyShellAI #SHELL #AIAgent
An AI ecosystem needs to be viewed from multiple angles: its products, creative tools, developer activity, community, and official updates.
The price of SHELL is one part of the picture, but it can’t represent the full state of MyShell’s development.
Conversely, a new feature doesn’t automatically prove that demand for the token is increasing. These two aspects need to be assessed independently.
#MyShellAI #SHELL #AIAgent
75

·
--
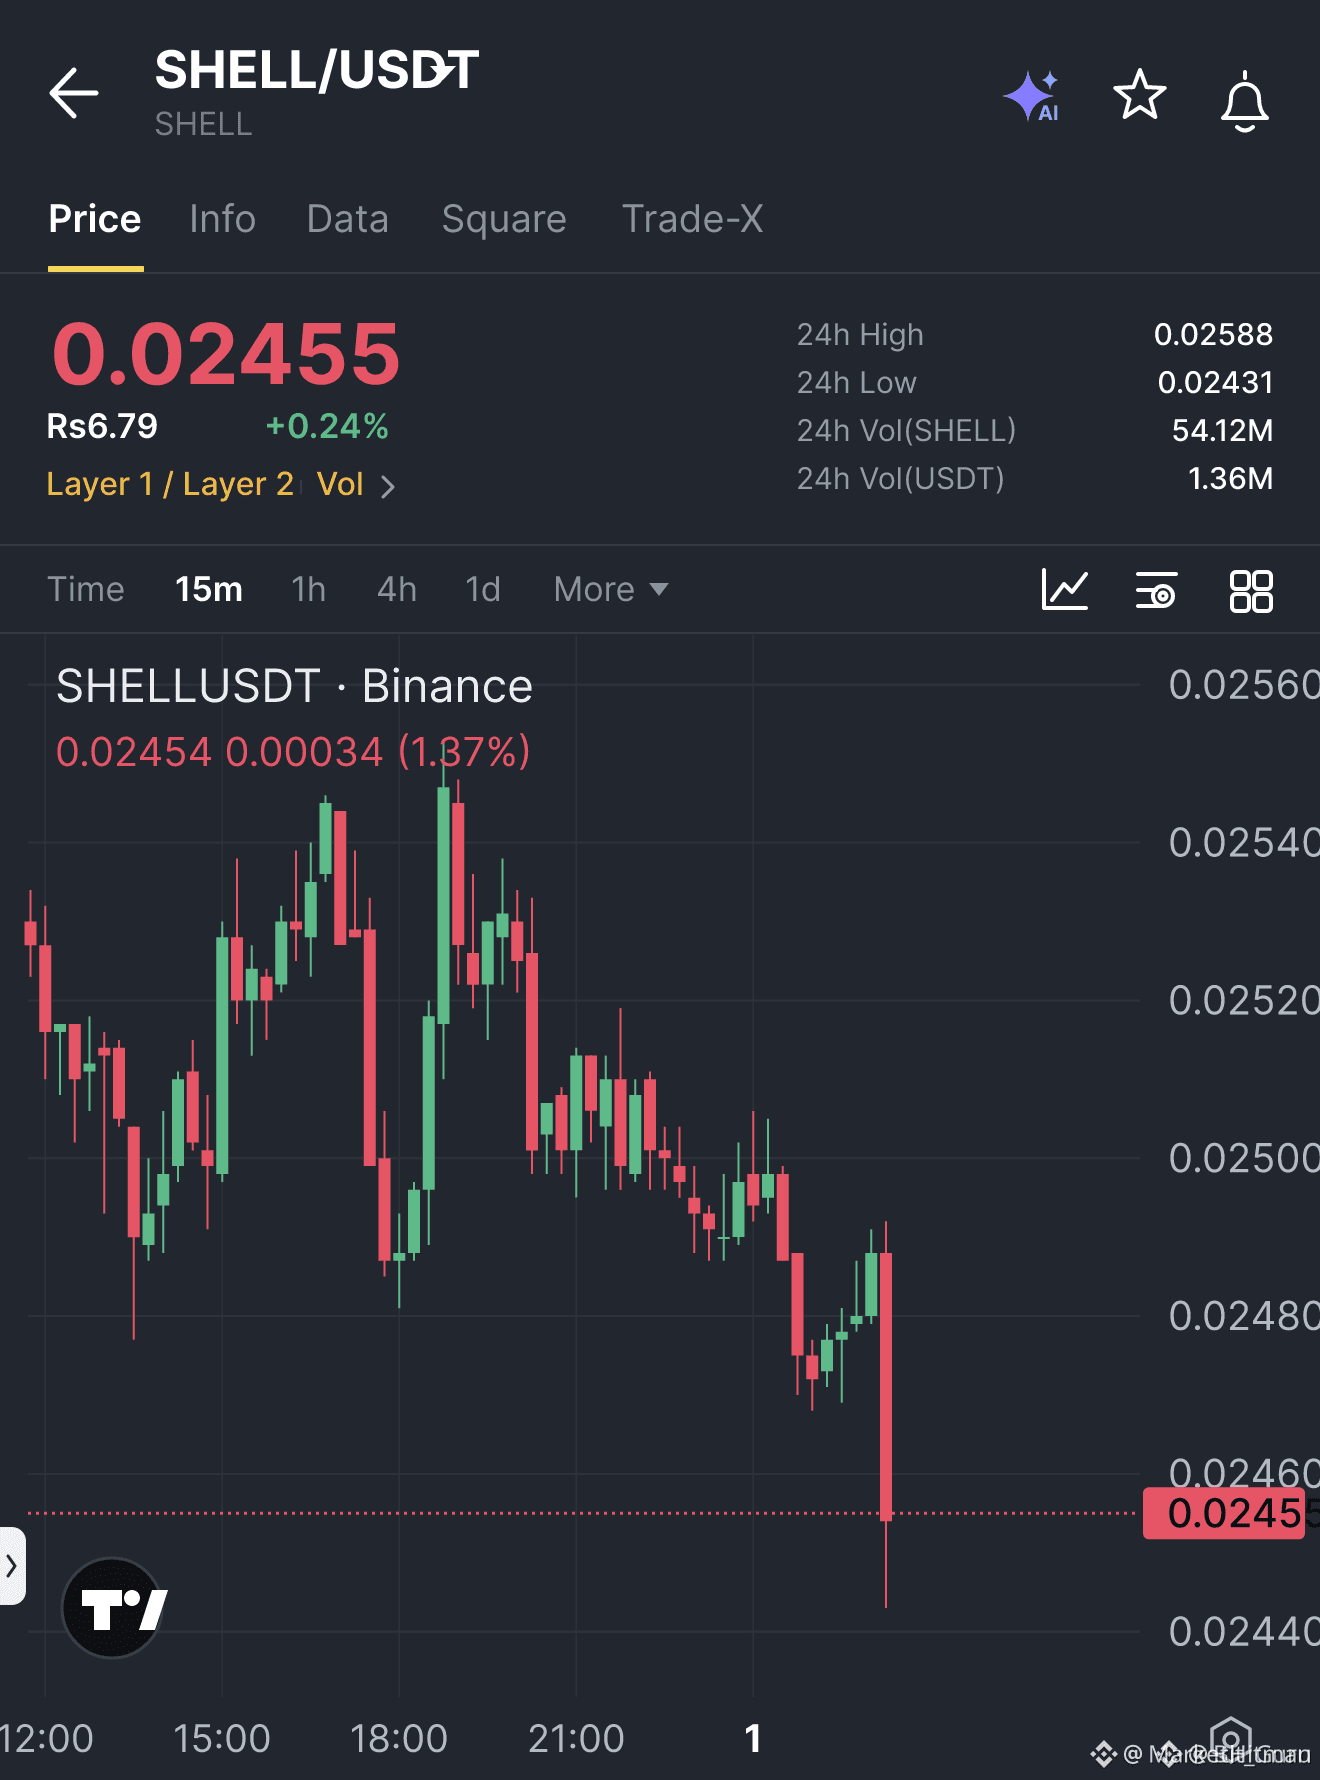
🚨 $SHELL BREAKS MARKET STRUCTURE AS BUYERS FALTER AFTER EXTENDED RALLY! 📉
Entry: 0.02455 ⚡
Target: 0.02396 / 0.02357 / 0.02299 🎯
Stop Loss: 0.02494 🛑
📌 The bid finally ran dry after a relentless run upward, and aggressive sellers wasted zero time punishing buyer exhaustion. 🌊 Smashing clean through the prior candle low flipped the immediate order flow and validated a textbook momentum rejection.
💡 With overhead supply capping further expansion, the path of least resistance tilts directly into resting liquidity below. 📊 Are you riding this breakdown straight into the targets, or hunting for a quick relief wick to fade? 👇
⚠️ Not financial advice. Always manage your risk. 🛡️
🏷️ #SHELL #ShortSetup #Bearish #PriceAction #Crypto
🎯 📉
🚨 $SHELL BREAKS MARKET STRUCTURE AS BUYERS FALTER AFTER EXTENDED RALLY! 📉
Entry: 0.02455 ⚡
Target: 0.02396 / 0.02357 / 0.02299 🎯
Stop Loss: 0.02494 🛑
📌 The bid finally ran dry after a relentless run upward, and aggressive sellers wasted zero time punishing buyer exhaustion. 🌊 Smashing clean through the prior candle low flipped the immediate order flow and validated a textbook momentum rejection.
💡 With overhead supply capping further expansion, the path of least resistance tilts directly into resting liquidity below. 📊 Are you riding this breakdown straight into the targets, or hunting for a quick relief wick to fade? 👇
⚠️ Not financial advice. Always manage your risk. 🛡️
🏷️ #SHELL #ShortSetup #Bearish #PriceAction #Crypto
🎯 📉
Entry: 0.02455 ⚡
Target: 0.02396 / 0.02357 / 0.02299 🎯
Stop Loss: 0.02494 🛑
📌 The bid finally ran dry after a relentless run upward, and aggressive sellers wasted zero time punishing buyer exhaustion. 🌊 Smashing clean through the prior candle low flipped the immediate order flow and validated a textbook momentum rejection.
💡 With overhead supply capping further expansion, the path of least resistance tilts directly into resting liquidity below. 📊 Are you riding this breakdown straight into the targets, or hunting for a quick relief wick to fade? 👇
⚠️ Not financial advice. Always manage your risk. 🛡️
🏷️ #SHELL #ShortSetup #Bearish #PriceAction #Crypto
🎯 📉
2

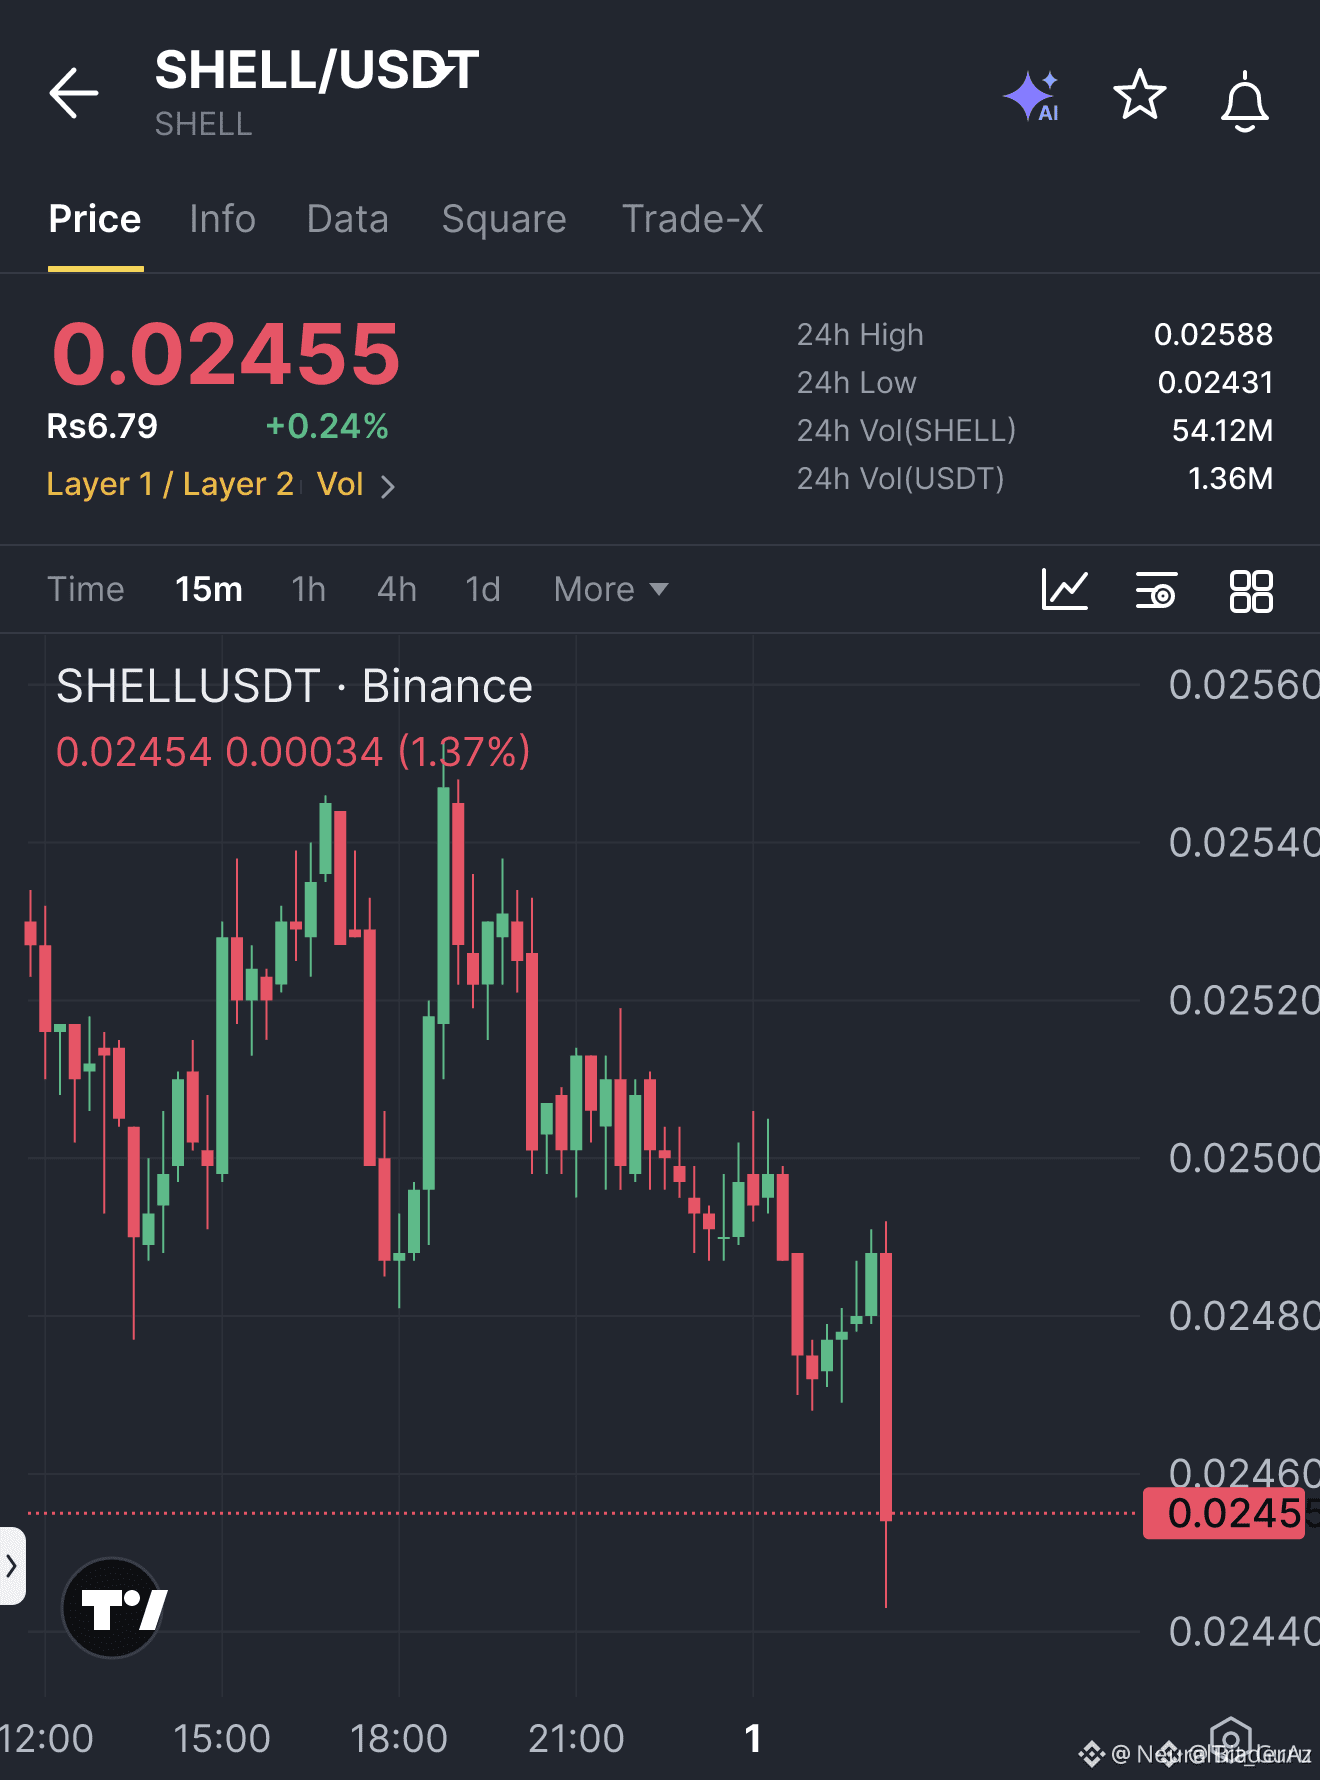
🚨 $SHELL PRINTS CLEAN STRUCTURAL SHIFT AFTER BUY-SIDE LIQUIDITY ABSORPTION 📉
Entry: 0.02455 🔥
Target: 0.02396, 0.02357, 0.02299 🎯
Stop Loss: 0.02494 🛑
📌 After an extended upward expansion, seller flow has breached the previous candle low, validating an immediate change of character on the lower timeframe. 🌊 The sweep of resting liquidity into the local highs was swiftly met with institutional distribution rather than continuation.
🔍 Structural invalidation remains well-defined above 0.02494, leaving downside liquidity pools ripe for retesting toward 0.02299 as order books thin out. 💡 Precision execution here yields an asymmetric risk-to-reward ratio without needing to chase momentum.
💬 Are you targeting the initial discount level at 0.02396 or letting this position run toward final structural demand? 👇
⚠️ Not financial advice. Always manage your risk. 🛡️
🏷️ #SHELL #ShortSetup #PriceAction #CryptoTrading
🎯 🦈
🚨 $SHELL PRINTS CLEAN STRUCTURAL SHIFT AFTER BUY-SIDE LIQUIDITY ABSORPTION 📉
Entry: 0.02455 🔥
Target: 0.02396, 0.02357, 0.02299 🎯
Stop Loss: 0.02494 🛑
📌 After an extended upward expansion, seller flow has breached the previous candle low, validating an immediate change of character on the lower timeframe. 🌊 The sweep of resting liquidity into the local highs was swiftly met with institutional distribution rather than continuation.
🔍 Structural invalidation remains well-defined above 0.02494, leaving downside liquidity pools ripe for retesting toward 0.02299 as order books thin out. 💡 Precision execution here yields an asymmetric risk-to-reward ratio without needing to chase momentum.
💬 Are you targeting the initial discount level at 0.02396 or letting this position run toward final structural demand? 👇
⚠️ Not financial advice. Always manage your risk. 🛡️
🏷️ #SHELL #ShortSetup #PriceAction #CryptoTrading
🎯 🦈
Entry: 0.02455 🔥
Target: 0.02396, 0.02357, 0.02299 🎯
Stop Loss: 0.02494 🛑
📌 After an extended upward expansion, seller flow has breached the previous candle low, validating an immediate change of character on the lower timeframe. 🌊 The sweep of resting liquidity into the local highs was swiftly met with institutional distribution rather than continuation.
🔍 Structural invalidation remains well-defined above 0.02494, leaving downside liquidity pools ripe for retesting toward 0.02299 as order books thin out. 💡 Precision execution here yields an asymmetric risk-to-reward ratio without needing to chase momentum.
💬 Are you targeting the initial discount level at 0.02396 or letting this position run toward final structural demand? 👇
⚠️ Not financial advice. Always manage your risk. 🛡️
🏷️ #SHELL #ShortSetup #PriceAction #CryptoTrading
🎯 🦈
4

·
--
SHELL is currently at 0.0253, up 14.34% over 24 hours and 8.55% over 7 days. The intraday range is 0.0215–0.0261, with an amplitude of 21.2%.
【Market】
A cross-coin signal in common: major coins are moving more and more in sync.
Among these major coins, SHELL is one of the stronger performers.
SHELL has stayed in the green over the past 24 hours even as the broader market consolidates near its lows, suggesting independent buyers are supporting it.
The 0.0215 area was the starting point of this rally, so a pullback to that level could offer decent value.
Compared with BTC’s +1.69%, SHELL has stronger relative performance. Assets like this are usually among the first to rebound.
【Macro】 U.S. stocks rose overnight: Nasdaq +0.82%, S&P 500 +0.70% (close on 2026-10-27). BTC ETFs saw net outflows of about $45.2 billion this month. U.S. CPI came in at 3.7% year over year, above expectations. The probability of a rate hike at the 2026-10-27/28 policy meeting is around 47%.
The short-term outlook leans bullish.
【Bullish Case】
With the same range width, SHELL’s 21.2% amplitude is the widest among major coins.
Its one-day gain of 14.34% is ahead of its 7-day gain of 8.55%, indicating a sharp, momentum-driven surge. Be cautious about chasing the rally.
Buying support on pullbacks and volume on advances make this pattern more sustainable than a one-way rally.
Stay patient until the direction becomes clear; the outlier is often the first to turn.
Fast gains also mean fast pullbacks, so leaving some room in your position is more comfortable than going all in.
$SHELL #SHELL
SHELL is currently at 0.0253, up 14.34% over 24 hours and 8.55% over 7 days. The intraday range is 0.0215–0.0261, with an amplitude of 21.2%.
【Market】
A cross-coin signal in common: major coins are moving more and more in sync.
Among these major coins, SHELL is one of the stronger performers.
SHELL has stayed in the green over the past 24 hours even as the broader market consolidates near its lows, suggesting independent buyers are supporting it.
The 0.0215 area was the starting point of this rally, so a pullback to that level could offer decent value.
Compared with BTC’s +1.69%, SHELL has stronger relative performance. Assets like this are usually among the first to rebound.
【Macro】 U.S. stocks rose overnight: Nasdaq +0.82%, S&P 500 +0.70% (close on 2026-10-27). BTC ETFs saw net outflows of about $45.2 billion this month. U.S. CPI came in at 3.7% year over year, above expectations. The probability of a rate hike at the 2026-10-27/28 policy meeting is around 47%.
The short-term outlook leans bullish.
【Bullish Case】
With the same range width, SHELL’s 21.2% amplitude is the widest among major coins.
Its one-day gain of 14.34% is ahead of its 7-day gain of 8.55%, indicating a sharp, momentum-driven surge. Be cautious about chasing the rally.
Buying support on pullbacks and volume on advances make this pattern more sustainable than a one-way rally.
Stay patient until the direction becomes clear; the outlier is often the first to turn.
Fast gains also mean fast pullbacks, so leaving some room in your position is more comfortable than going all in.
$SHELL #SHELL
【Market】
A cross-coin signal in common: major coins are moving more and more in sync.
Among these major coins, SHELL is one of the stronger performers.
SHELL has stayed in the green over the past 24 hours even as the broader market consolidates near its lows, suggesting independent buyers are supporting it.
The 0.0215 area was the starting point of this rally, so a pullback to that level could offer decent value.
Compared with BTC’s +1.69%, SHELL has stronger relative performance. Assets like this are usually among the first to rebound.
【Macro】 U.S. stocks rose overnight: Nasdaq +0.82%, S&P 500 +0.70% (close on 2026-10-27). BTC ETFs saw net outflows of about $45.2 billion this month. U.S. CPI came in at 3.7% year over year, above expectations. The probability of a rate hike at the 2026-10-27/28 policy meeting is around 47%.
The short-term outlook leans bullish.
【Bullish Case】
With the same range width, SHELL’s 21.2% amplitude is the widest among major coins.
Its one-day gain of 14.34% is ahead of its 7-day gain of 8.55%, indicating a sharp, momentum-driven surge. Be cautious about chasing the rally.
Buying support on pullbacks and volume on advances make this pattern more sustainable than a one-way rally.
Stay patient until the direction becomes clear; the outlier is often the first to turn.
Fast gains also mean fast pullbacks, so leaving some room in your position is more comfortable than going all in.
$SHELL #SHELL
5

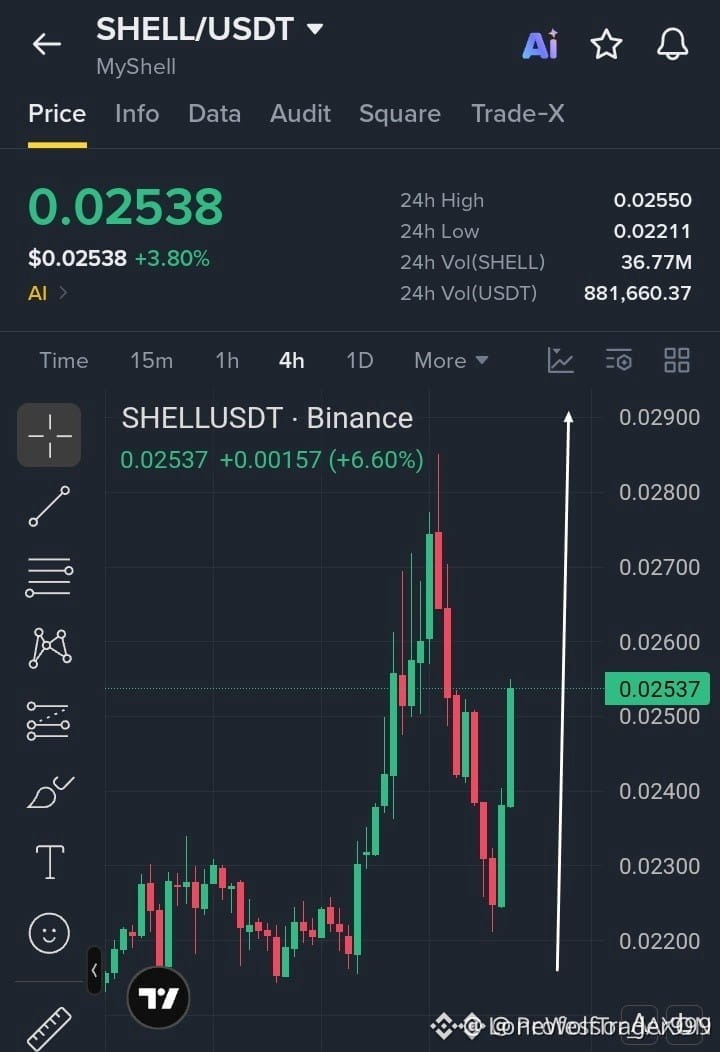
⚡ $SHELL IGNITES AGGRESSIVE RECOVERY AS BUYERS SLAM THE BID OFF KEY SUPPORT! 🐂
Entry: 0.02500 - 0.02540 ⚡
Target: 0.02620 - 0.02850 🚀
Stop Loss: 0.02420 ⚠️
📌 The defensive stand at 0.02250 paid off swiftly, triggering sharp demand absorption that flipped order flow back into buyer control. A commanding 4H expansion candle signals real intent, setting up an explosive challenge against the 0.02550 local resistance.
📊 Once sellers exhaust their inventory above 0.02550, the overhead liquidity pocket up to 0.02850 becomes an open corridor. Momentum is aligning cleanly for continuation as bids stack up on pullbacks.
💬 Are you riding this recovery into the upper targets, or waiting for a clean breakout confirmation above 0.02550? 👇
⚠️ Not financial advice. Always manage your risk. 🛡️
🏷️ #SHELL #LongSetup #Breakout #CryptoTrading
🔥 💎
⚡ $SHELL IGNITES AGGRESSIVE RECOVERY AS BUYERS SLAM THE BID OFF KEY SUPPORT! 🐂
Entry: 0.02500 - 0.02540 ⚡
Target: 0.02620 - 0.02850 🚀
Stop Loss: 0.02420 ⚠️
📌 The defensive stand at 0.02250 paid off swiftly, triggering sharp demand absorption that flipped order flow back into buyer control. A commanding 4H expansion candle signals real intent, setting up an explosive challenge against the 0.02550 local resistance.
📊 Once sellers exhaust their inventory above 0.02550, the overhead liquidity pocket up to 0.02850 becomes an open corridor. Momentum is aligning cleanly for continuation as bids stack up on pullbacks.
💬 Are you riding this recovery into the upper targets, or waiting for a clean breakout confirmation above 0.02550? 👇
⚠️ Not financial advice. Always manage your risk. 🛡️
🏷️ #SHELL #LongSetup #Breakout #CryptoTrading
🔥 💎
Entry: 0.02500 - 0.02540 ⚡
Target: 0.02620 - 0.02850 🚀
Stop Loss: 0.02420 ⚠️
📌 The defensive stand at 0.02250 paid off swiftly, triggering sharp demand absorption that flipped order flow back into buyer control. A commanding 4H expansion candle signals real intent, setting up an explosive challenge against the 0.02550 local resistance.
📊 Once sellers exhaust their inventory above 0.02550, the overhead liquidity pocket up to 0.02850 becomes an open corridor. Momentum is aligning cleanly for continuation as bids stack up on pullbacks.
💬 Are you riding this recovery into the upper targets, or waiting for a clean breakout confirmation above 0.02550? 👇
⚠️ Not financial advice. Always manage your risk. 🛡️
🏷️ #SHELL #LongSetup #Breakout #CryptoTrading
🔥 💎
7
Log in to explore more content
Join global crypto users on Binance Square
⚡️ Get latest and useful information about crypto.
💬 Trusted by the world’s largest crypto exchange.
👍 Discover real insights from verified creators.
Email / Phone number
Trending Topics
1
#BTCRebounds80K
0 views
44 Discussing
2
#Binance98PercentReplenished
1,010 views
162 Discussing
3
#USMidterms-WhatAreMarketsExpecting?
201,602 views
1,597 Discussing
4
#USOctoberNFP-AreRateCutsStillPossible
314,795 views
2,502 Discussing
5
#AMDBeatsExpectations-AINarrativeContinues
54,188 views
594 Discussing
6
#CircleQ3Revenue865M
9,874 views
289 Discussing
7
#BinanceIncidentReport
376,991 views
1,878 Discussing
8
#USStocksOpenHigherAsDowGains1.9%
422 views
37 Discussing
9
#ADPUSPrivateEmployersAdd86000JobsInOctober
162 views
17 Discussing
10
#FrenchAssemblyPassesSelfCustodiedCryptoReportingAmendment
282 views
12 Discussing