
#cryptodata
cryptodata
126,477 views
4,243 Discussing
Hot
Latest

Why Timestamp Consistency Matters in Crypto Analysis
Crypto markets operate continuously, so two screenshots taken at different times may show slightly different 24-hour statistics.
In the November 4 SHELL chart set, most screenshots recorded approximately 7.33 million SHELL in volume, while the weekly screenshots showed around 7.35 million.
The difference is consistent with a rolling 24-hour measurement window changing over time.
When comparing market snapshots, timestamps are part of the data, not just extra information.
#SHELL #CryptoData #MarketAnalysis
Why Timestamp Consistency Matters in Crypto Analysis
Crypto markets operate continuously, so two screenshots taken at different times may show slightly different 24-hour statistics.
In the November 4 SHELL chart set, most screenshots recorded approximately 7.33 million SHELL in volume, while the weekly screenshots showed around 7.35 million.
The difference is consistent with a rolling 24-hour measurement window changing over time.
When comparing market snapshots, timestamps are part of the data, not just extra information.
#SHELL #CryptoData #MarketAnalysis
Crypto markets operate continuously, so two screenshots taken at different times may show slightly different 24-hour statistics.
In the November 4 SHELL chart set, most screenshots recorded approximately 7.33 million SHELL in volume, while the weekly screenshots showed around 7.35 million.
The difference is consistent with a rolling 24-hour measurement window changing over time.
When comparing market snapshots, timestamps are part of the data, not just extra information.
#SHELL #CryptoData #MarketAnalysis
96

·
--
📊 [MARKET SENTIMENT DIGEST] — Fact Sheet ⚡
No hype, no opinions — just raw market metrics and key industry commentary. 💡
1️⃣ Crypto Fear & Greed Index
Current Score: 26 / 100 (Fear)
Status: Dropped sharply into lower fear territory as macro anxiety, exchange security headlines, and US midterm jitters weigh on market confidence.
2️⃣ Derivatives & Funding Rates
BTC Perpetual 8h Funding Rate: +0.0082% (OI-Weighted)
Market Condition: Longs continue to pay a modest premium, though overall leverage is cooling down as traders de-risk.
3️⃣ Institutional ETF Net Daily Inflows
US Spot BTC ETFs: -$399.0 Million (Net Outflow)
Trend: Wall Street products registered substantial consecutive net outflows, highlighting institutional caution during current price tests around $77K.
4️⃣ 24-Hour Liquidation Heatmap
Total Wiped Volume: ~$298.0 Million
Ratio: ~91% Longs ($271M) / ~9% Shorts ($27M)
Market Impact: Overwhelming long-heavy liquidation flush as intraday downward pressure caught aggressive leverage off guard.
5️⃣ Social Sentiment & Leader Spotlight
Leader Spotlight: Market Analyst Consensus (US Midterms & Liquidity Focus)
Key Commentary: "Markets are pricing in macro political uncertainty ahead of the US midterms, while on-chain participants monitor exchange reserve health closely."
Impact: Short-term narrative driven by risk-off positioning and political macro factors rather than network fundamentals.
6️⃣ Bitcoin Dominance (BTC.D)
Current Level: ~60.1%
Capital Flow: BTC dominance stays firm near multi-year highs, proving capital is seeking safety in Bitcoin while altcoins remain under pressure.
Subscribe to get daily updates
#CryptoData $BTC #CryptoMetrics
(Data source: Public market indicators. Provided for informational purposes only. Not financial advice.)
📊 [MARKET SENTIMENT DIGEST] — Fact Sheet ⚡
No hype, no opinions — just raw market metrics and key industry commentary. 💡
1️⃣ Crypto Fear & Greed Index
Current Score: 26 / 100 (Fear)
Status: Dropped sharply into lower fear territory as macro anxiety, exchange security headlines, and US midterm jitters weigh on market confidence.
2️⃣ Derivatives & Funding Rates
BTC Perpetual 8h Funding Rate: +0.0082% (OI-Weighted)
Market Condition: Longs continue to pay a modest premium, though overall leverage is cooling down as traders de-risk.
3️⃣ Institutional ETF Net Daily Inflows
US Spot BTC ETFs: -$399.0 Million (Net Outflow)
Trend: Wall Street products registered substantial consecutive net outflows, highlighting institutional caution during current price tests around $77K.
4️⃣ 24-Hour Liquidation Heatmap
Total Wiped Volume: ~$298.0 Million
Ratio: ~91% Longs ($271M) / ~9% Shorts ($27M)
Market Impact: Overwhelming long-heavy liquidation flush as intraday downward pressure caught aggressive leverage off guard.
5️⃣ Social Sentiment & Leader Spotlight
Leader Spotlight: Market Analyst Consensus (US Midterms & Liquidity Focus)
Key Commentary: "Markets are pricing in macro political uncertainty ahead of the US midterms, while on-chain participants monitor exchange reserve health closely."
Impact: Short-term narrative driven by risk-off positioning and political macro factors rather than network fundamentals.
6️⃣ Bitcoin Dominance (BTC.D)
Current Level: ~60.1%
Capital Flow: BTC dominance stays firm near multi-year highs, proving capital is seeking safety in Bitcoin while altcoins remain under pressure.
Subscribe to get daily updates
#CryptoData $BTC #CryptoMetrics
(Data source: Public market indicators. Provided for informational purposes only. Not financial advice.)
No hype, no opinions — just raw market metrics and key industry commentary. 💡
1️⃣ Crypto Fear & Greed Index
Current Score: 26 / 100 (Fear)
Status: Dropped sharply into lower fear territory as macro anxiety, exchange security headlines, and US midterm jitters weigh on market confidence.
2️⃣ Derivatives & Funding Rates
BTC Perpetual 8h Funding Rate: +0.0082% (OI-Weighted)
Market Condition: Longs continue to pay a modest premium, though overall leverage is cooling down as traders de-risk.
3️⃣ Institutional ETF Net Daily Inflows
US Spot BTC ETFs: -$399.0 Million (Net Outflow)
Trend: Wall Street products registered substantial consecutive net outflows, highlighting institutional caution during current price tests around $77K.
4️⃣ 24-Hour Liquidation Heatmap
Total Wiped Volume: ~$298.0 Million
Ratio: ~91% Longs ($271M) / ~9% Shorts ($27M)
Market Impact: Overwhelming long-heavy liquidation flush as intraday downward pressure caught aggressive leverage off guard.
5️⃣ Social Sentiment & Leader Spotlight
Leader Spotlight: Market Analyst Consensus (US Midterms & Liquidity Focus)
Key Commentary: "Markets are pricing in macro political uncertainty ahead of the US midterms, while on-chain participants monitor exchange reserve health closely."
Impact: Short-term narrative driven by risk-off positioning and political macro factors rather than network fundamentals.
6️⃣ Bitcoin Dominance (BTC.D)
Current Level: ~60.1%
Capital Flow: BTC dominance stays firm near multi-year highs, proving capital is seeking safety in Bitcoin while altcoins remain under pressure.
Subscribe to get daily updates
#CryptoData $BTC #CryptoMetrics
(Data source: Public market indicators. Provided for informational purposes only. Not financial advice.)
81
·
--
📊 [MARKET SENTIMENT DIGEST] — Fact Sheet ⚡
No hype, no opinions — just raw market metrics and key industry commentary. 💡
1️⃣ Crypto Fear & Greed Index
Current Score: 45 / 100 (Neutral)
Status: Sitting firmly in neutral/cautious territory as the market holds position around the $80K–$83K BTC structural consolidation zone.
2️⃣ Derivatives & Funding Rates
BTC Perpetual 8h Funding Rate: +0.0085% (OI-Weighted)
Market Condition: Funding rates remain balanced with a minimal long bias, reflecting quiet position building rather than aggressive retail leverage.
3️⃣ Institutional ETF Net Daily Inflows
US Spot BTC ETFs: +$102.7 Million (Net Inflow)
Trend: Net positive capital flows persist across spot products, confirming sustained institutional bid during local range consolidation.
4️⃣ 24-Hour Liquidation Heatmap
Total Wiped Volume: ~$142.8 Million
Ratio: 61% Longs ($87.1M) / 39% Shorts ($55.7M)
Market Impact: Subdued volatility flushed out tight overleveraged positions on intraday dips, leaving order books clean ahead of weekend liquidity shifts.
5️⃣ Social Sentiment & Leader Spotlight
Leader Spotlight: Larry Fink
Key Commentary: "Bitcoin is an asset class that provides an alternative store of value against systemic currency debasement."
Impact: Institutional focus remains locked on macro capital preservation and long-term treasury allocation over short-term speculative rotations.
6️⃣ Bitcoin Dominance (BTC.D)
Current Level: ~59.8%
Capital Flow: BTC.D holds near multi-year highs, indicating capital concentration in Bitcoin remains steady while altcoins await a macro liquidity signal.
💬 How are you interpreting these numbers today? Are you holding cash or deploying capital? Drop your thoughts below! 👇
#MarketSentimentToday #CryptoData #BinanceSquare #CryptoMetrics $BTC
(Data source: Public market indicators. Provided for informational purposes only. Not financial advice.
📊 [MARKET SENTIMENT DIGEST] — Fact Sheet ⚡
No hype, no opinions — just raw market metrics and key industry commentary. 💡
1️⃣ Crypto Fear & Greed Index
Current Score: 45 / 100 (Neutral)
Status: Sitting firmly in neutral/cautious territory as the market holds position around the $80K–$83K BTC structural consolidation zone.
2️⃣ Derivatives & Funding Rates
BTC Perpetual 8h Funding Rate: +0.0085% (OI-Weighted)
Market Condition: Funding rates remain balanced with a minimal long bias, reflecting quiet position building rather than aggressive retail leverage.
3️⃣ Institutional ETF Net Daily Inflows
US Spot BTC ETFs: +$102.7 Million (Net Inflow)
Trend: Net positive capital flows persist across spot products, confirming sustained institutional bid during local range consolidation.
4️⃣ 24-Hour Liquidation Heatmap
Total Wiped Volume: ~$142.8 Million
Ratio: 61% Longs ($87.1M) / 39% Shorts ($55.7M)
Market Impact: Subdued volatility flushed out tight overleveraged positions on intraday dips, leaving order books clean ahead of weekend liquidity shifts.
5️⃣ Social Sentiment & Leader Spotlight
Leader Spotlight: Larry Fink
Key Commentary: "Bitcoin is an asset class that provides an alternative store of value against systemic currency debasement."
Impact: Institutional focus remains locked on macro capital preservation and long-term treasury allocation over short-term speculative rotations.
6️⃣ Bitcoin Dominance (BTC.D)
Current Level: ~59.8%
Capital Flow: BTC.D holds near multi-year highs, indicating capital concentration in Bitcoin remains steady while altcoins await a macro liquidity signal.
💬 How are you interpreting these numbers today? Are you holding cash or deploying capital? Drop your thoughts below! 👇
#MarketSentimentToday #CryptoData #BinanceSquare #CryptoMetrics $BTC
(Data source: Public market indicators. Provided for informational purposes only. Not financial advice.
No hype, no opinions — just raw market metrics and key industry commentary. 💡
1️⃣ Crypto Fear & Greed Index
Current Score: 45 / 100 (Neutral)
Status: Sitting firmly in neutral/cautious territory as the market holds position around the $80K–$83K BTC structural consolidation zone.
2️⃣ Derivatives & Funding Rates
BTC Perpetual 8h Funding Rate: +0.0085% (OI-Weighted)
Market Condition: Funding rates remain balanced with a minimal long bias, reflecting quiet position building rather than aggressive retail leverage.
3️⃣ Institutional ETF Net Daily Inflows
US Spot BTC ETFs: +$102.7 Million (Net Inflow)
Trend: Net positive capital flows persist across spot products, confirming sustained institutional bid during local range consolidation.
4️⃣ 24-Hour Liquidation Heatmap
Total Wiped Volume: ~$142.8 Million
Ratio: 61% Longs ($87.1M) / 39% Shorts ($55.7M)
Market Impact: Subdued volatility flushed out tight overleveraged positions on intraday dips, leaving order books clean ahead of weekend liquidity shifts.
5️⃣ Social Sentiment & Leader Spotlight
Leader Spotlight: Larry Fink
Key Commentary: "Bitcoin is an asset class that provides an alternative store of value against systemic currency debasement."
Impact: Institutional focus remains locked on macro capital preservation and long-term treasury allocation over short-term speculative rotations.
6️⃣ Bitcoin Dominance (BTC.D)
Current Level: ~59.8%
Capital Flow: BTC.D holds near multi-year highs, indicating capital concentration in Bitcoin remains steady while altcoins await a macro liquidity signal.
💬 How are you interpreting these numbers today? Are you holding cash or deploying capital? Drop your thoughts below! 👇
#MarketSentimentToday #CryptoData #BinanceSquare #CryptoMetrics $BTC
(Data source: Public market indicators. Provided for informational purposes only. Not financial advice.
59
·
--
📊 [MARKET SENTIMENT DIGEST] — Fact Sheet ⚡
No hype, no opinions — just raw market metrics and key industry commentary. 💡
1️⃣ Crypto Fear & Greed Index
Current Score: 48 / 100 (Neutral)
Status: Moving slightly up from yesterday's 47, but the market remains caught in a tight consolidation range.
2️⃣ Derivatives & Funding Rates
BTC Perpetual 8h Funding Rate: +0.0092% (OI-Weighted)
Market Condition: Funding ticks slightly greener as aggressive buyers attempt to establish control.
3️⃣ Institutional ETF Net Daily Inflows
US Spot BTC ETFs: +$142.5 Million (Net Inflow)
Trend: Wall Street inflows accelerating compared to yesterday, confirming institutional accumulation is actively absorbing local dips.
4️⃣ 24-Hour Liquidation Heatmap
Total Wiped Volume: ~$184.1 Million
Ratio: 58% Longs ($106.8M) / 42% Shorts ($77.3M)
Market Impact: Mild volatility swept out overleveraged early longs, keeping the slate relatively clean before the next leg.
5️⃣ Social Sentiment & Leader Spotlight
Leader Spotlight: Arthur Hayes
Key Commentary: "Liquidity injections are lagging, but global fiat debasement guarantees the structural bid for hard assets remains unbroken."
Impact: Focus shifting back to macro liquidity trends and how central bank maneuvers will trigger the next crypto expansion wave.
6️⃣ Bitcoin Dominance (BTC.D)
Current Level: ~59.8%
Capital Flow: BTC.D cooling off by a fraction of a percent, signaling early microscopic interest trickling into high-beta plays, but Bitcoin remains the undisputed anchor.
7️⃣ Stablecoin Dominance (USDT.D + USDC.D)
Current Level: ~10.8% (Total Stablecoin Market Cap ~$301B)
💬 How are you interpreting these numbers today? Are you holding cash or deploying capital? Drop your thoughts below! 👇
#CryptoData #BTC
(Data source: Public market indicators. Provided for informational purposes only. Not financial advice.)
📊 [MARKET SENTIMENT DIGEST] — Fact Sheet ⚡
No hype, no opinions — just raw market metrics and key industry commentary. 💡
1️⃣ Crypto Fear & Greed Index
Current Score: 48 / 100 (Neutral)
Status: Moving slightly up from yesterday's 47, but the market remains caught in a tight consolidation range.
2️⃣ Derivatives & Funding Rates
BTC Perpetual 8h Funding Rate: +0.0092% (OI-Weighted)
Market Condition: Funding ticks slightly greener as aggressive buyers attempt to establish control.
3️⃣ Institutional ETF Net Daily Inflows
US Spot BTC ETFs: +$142.5 Million (Net Inflow)
Trend: Wall Street inflows accelerating compared to yesterday, confirming institutional accumulation is actively absorbing local dips.
4️⃣ 24-Hour Liquidation Heatmap
Total Wiped Volume: ~$184.1 Million
Ratio: 58% Longs ($106.8M) / 42% Shorts ($77.3M)
Market Impact: Mild volatility swept out overleveraged early longs, keeping the slate relatively clean before the next leg.
5️⃣ Social Sentiment & Leader Spotlight
Leader Spotlight: Arthur Hayes
Key Commentary: "Liquidity injections are lagging, but global fiat debasement guarantees the structural bid for hard assets remains unbroken."
Impact: Focus shifting back to macro liquidity trends and how central bank maneuvers will trigger the next crypto expansion wave.
6️⃣ Bitcoin Dominance (BTC.D)
Current Level: ~59.8%
Capital Flow: BTC.D cooling off by a fraction of a percent, signaling early microscopic interest trickling into high-beta plays, but Bitcoin remains the undisputed anchor.
7️⃣ Stablecoin Dominance (USDT.D + USDC.D)
Current Level: ~10.8% (Total Stablecoin Market Cap ~$301B)
💬 How are you interpreting these numbers today? Are you holding cash or deploying capital? Drop your thoughts below! 👇
#CryptoData #BTC
(Data source: Public market indicators. Provided for informational purposes only. Not financial advice.)
No hype, no opinions — just raw market metrics and key industry commentary. 💡
1️⃣ Crypto Fear & Greed Index
Current Score: 48 / 100 (Neutral)
Status: Moving slightly up from yesterday's 47, but the market remains caught in a tight consolidation range.
2️⃣ Derivatives & Funding Rates
BTC Perpetual 8h Funding Rate: +0.0092% (OI-Weighted)
Market Condition: Funding ticks slightly greener as aggressive buyers attempt to establish control.
3️⃣ Institutional ETF Net Daily Inflows
US Spot BTC ETFs: +$142.5 Million (Net Inflow)
Trend: Wall Street inflows accelerating compared to yesterday, confirming institutional accumulation is actively absorbing local dips.
4️⃣ 24-Hour Liquidation Heatmap
Total Wiped Volume: ~$184.1 Million
Ratio: 58% Longs ($106.8M) / 42% Shorts ($77.3M)
Market Impact: Mild volatility swept out overleveraged early longs, keeping the slate relatively clean before the next leg.
5️⃣ Social Sentiment & Leader Spotlight
Leader Spotlight: Arthur Hayes
Key Commentary: "Liquidity injections are lagging, but global fiat debasement guarantees the structural bid for hard assets remains unbroken."
Impact: Focus shifting back to macro liquidity trends and how central bank maneuvers will trigger the next crypto expansion wave.
6️⃣ Bitcoin Dominance (BTC.D)
Current Level: ~59.8%
Capital Flow: BTC.D cooling off by a fraction of a percent, signaling early microscopic interest trickling into high-beta plays, but Bitcoin remains the undisputed anchor.
7️⃣ Stablecoin Dominance (USDT.D + USDC.D)
Current Level: ~10.8% (Total Stablecoin Market Cap ~$301B)
💬 How are you interpreting these numbers today? Are you holding cash or deploying capital? Drop your thoughts below! 👇
#CryptoData #BTC
(Data source: Public market indicators. Provided for informational purposes only. Not financial advice.)
1
66

·
--
{spot}(BTCUSDT)
$BTC
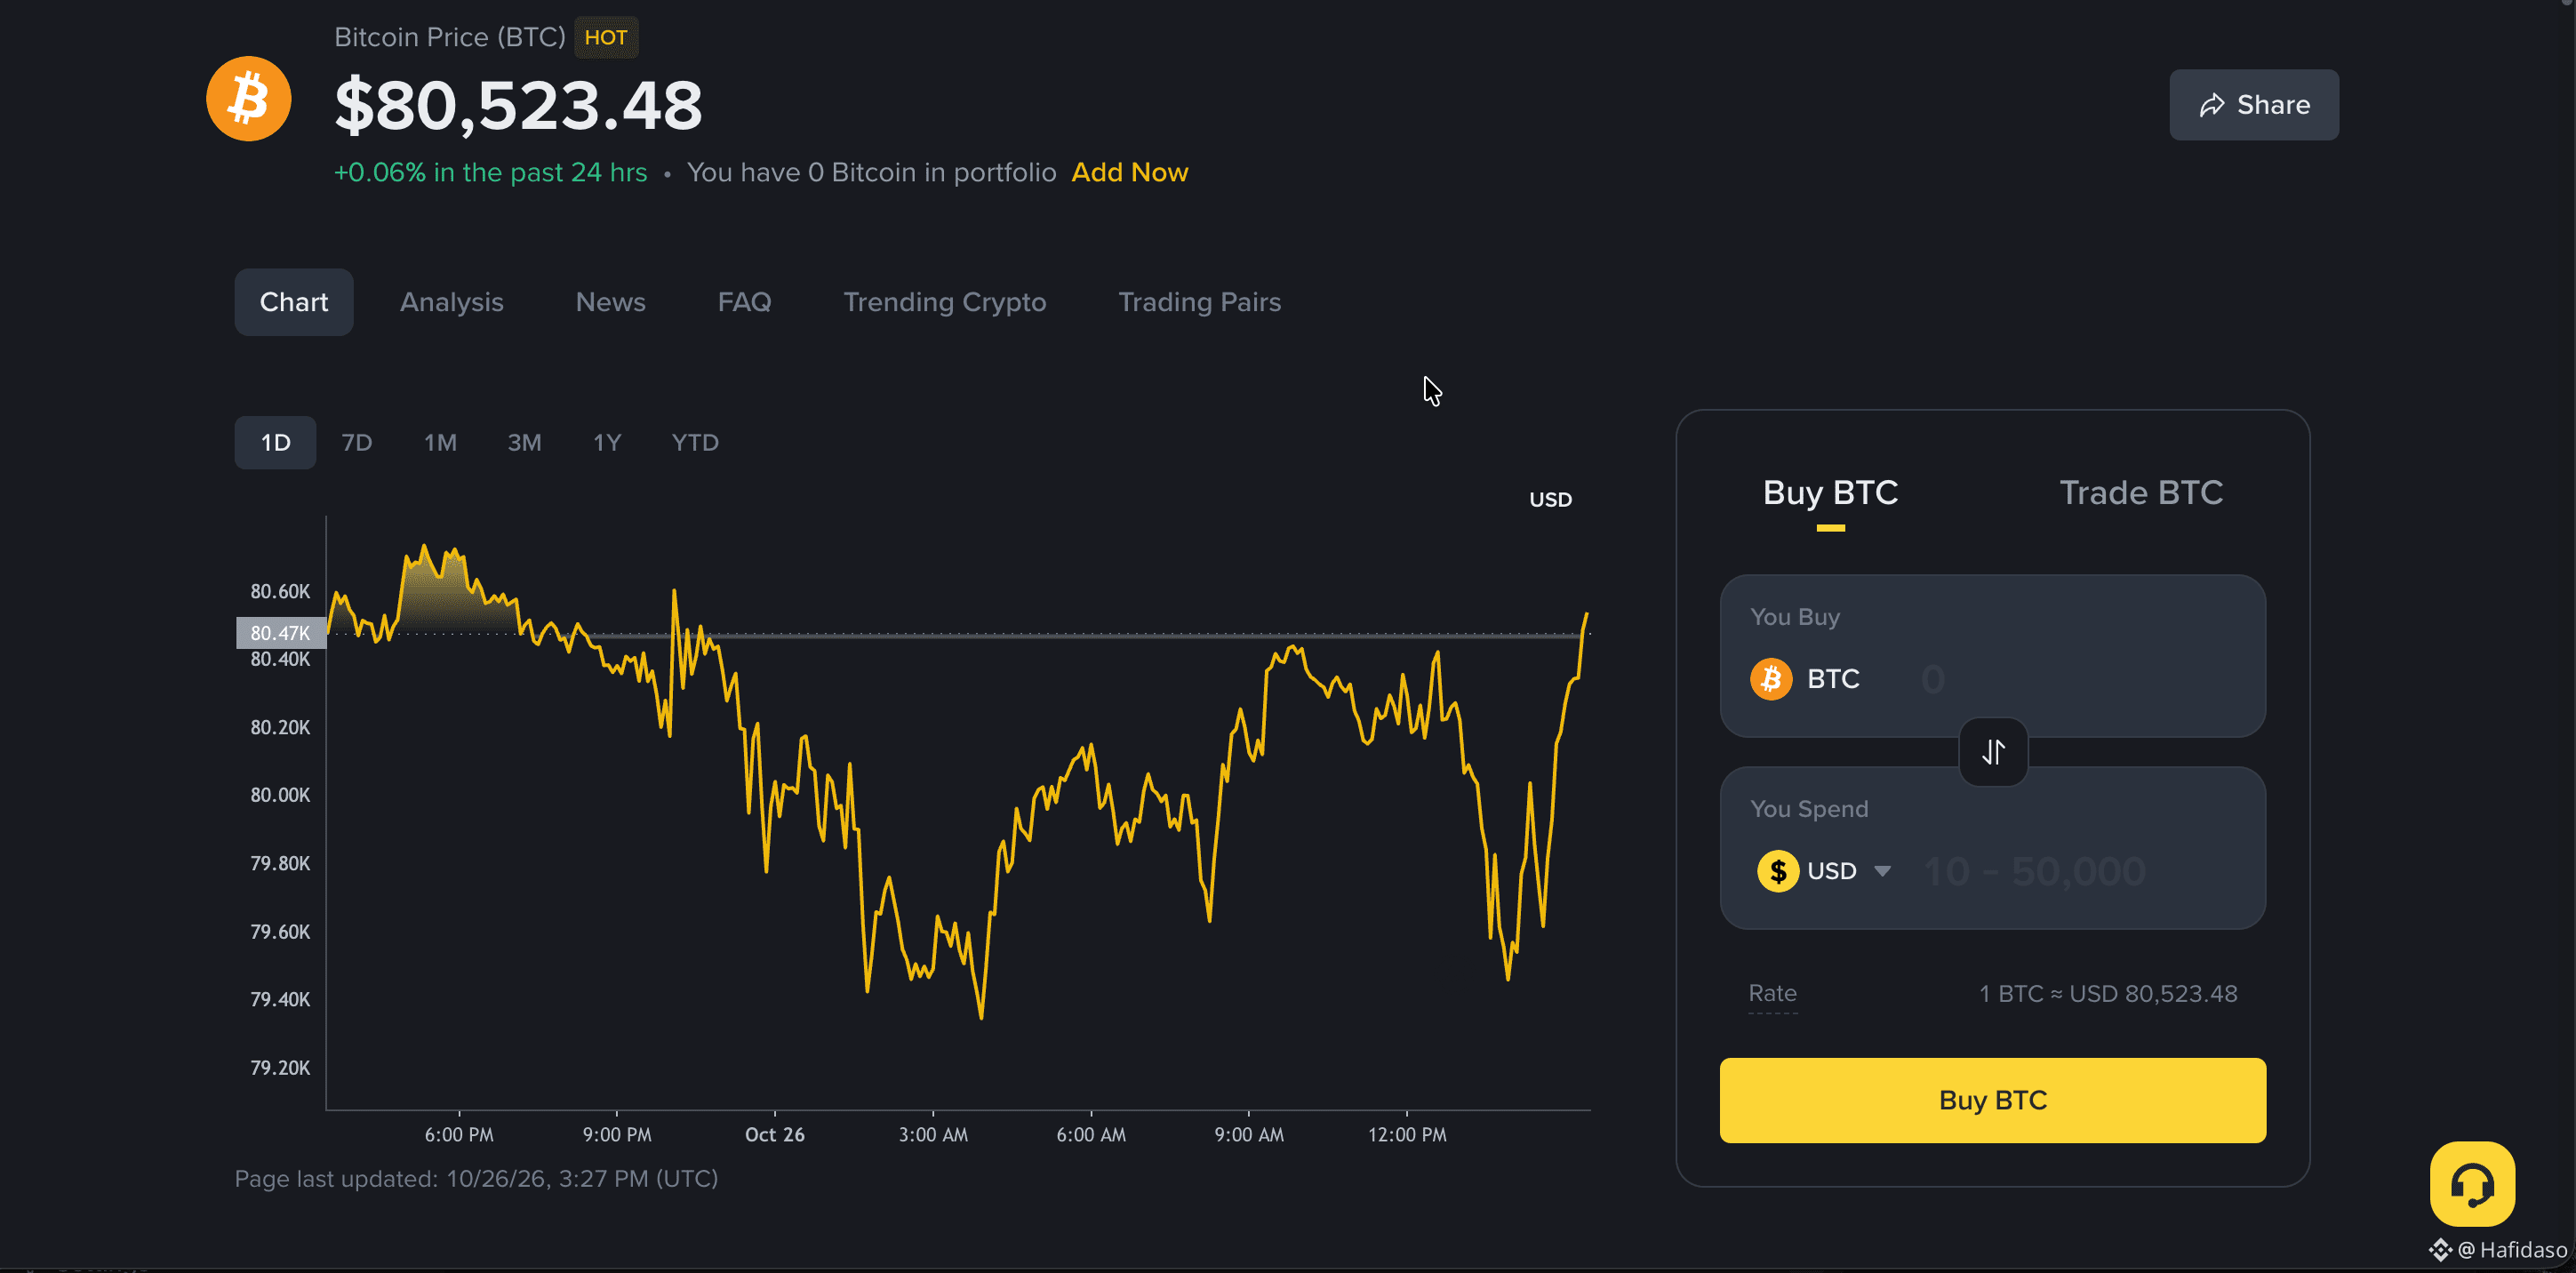
📊 Most People Watch Bitcoin's Price. I Watch the Data Behind It.
Everyone asks the same question:
"Will $BTC go up or down?"
But price alone doesn't tell the whole story.
Here are 3 things worth examining:
📈 1. Price: Shows where the market is trading, not where it must go next.
📊 2. Trading Volume: Helps us understand how much trading activity accompanies a price move.
⚡ 3. Volatility: Measures how dramatically prices fluctuate, in either direction.
Here's the important part:
More data doesn't automatically mean better predictions.
The real skill is understanding what each indicator reveals, and what it doesn't.
💬 Your turn: If you could follow only ONE indicator for Bitcoin, which would you choose: Price, Volume, or Volatility? Why?
#Bitcoin #BTC #CryptoData #BinanceSquare
Educational content only. Not financial advice.
$BTC
📊 Most People Watch Bitcoin's Price. I Watch the Data Behind It.
Everyone asks the same question:
"Will $BTC go up or down?"
But price alone doesn't tell the whole story.
Here are 3 things worth examining:
📈 1. Price: Shows where the market is trading, not where it must go next.
📊 2. Trading Volume: Helps us understand how much trading activity accompanies a price move.
⚡ 3. Volatility: Measures how dramatically prices fluctuate, in either direction.
Here's the important part:
More data doesn't automatically mean better predictions.
The real skill is understanding what each indicator reveals, and what it doesn't.
💬 Your turn: If you could follow only ONE indicator for Bitcoin, which would you choose: Price, Volume, or Volatility? Why?
#Bitcoin #BTC #CryptoData #BinanceSquare
Educational content only. Not financial advice.
📊 Most People Watch Bitcoin's Price. I Watch the Data Behind It.
Everyone asks the same question:
"Will $BTC go up or down?"
But price alone doesn't tell the whole story.
Here are 3 things worth examining:
📈 1. Price: Shows where the market is trading, not where it must go next.
📊 2. Trading Volume: Helps us understand how much trading activity accompanies a price move.
⚡ 3. Volatility: Measures how dramatically prices fluctuate, in either direction.
Here's the important part:
More data doesn't automatically mean better predictions.
The real skill is understanding what each indicator reveals, and what it doesn't.
💬 Your turn: If you could follow only ONE indicator for Bitcoin, which would you choose: Price, Volume, or Volatility? Why?
#Bitcoin #BTC #CryptoData #BinanceSquare
Educational content only. Not financial advice.
1
93

·
--
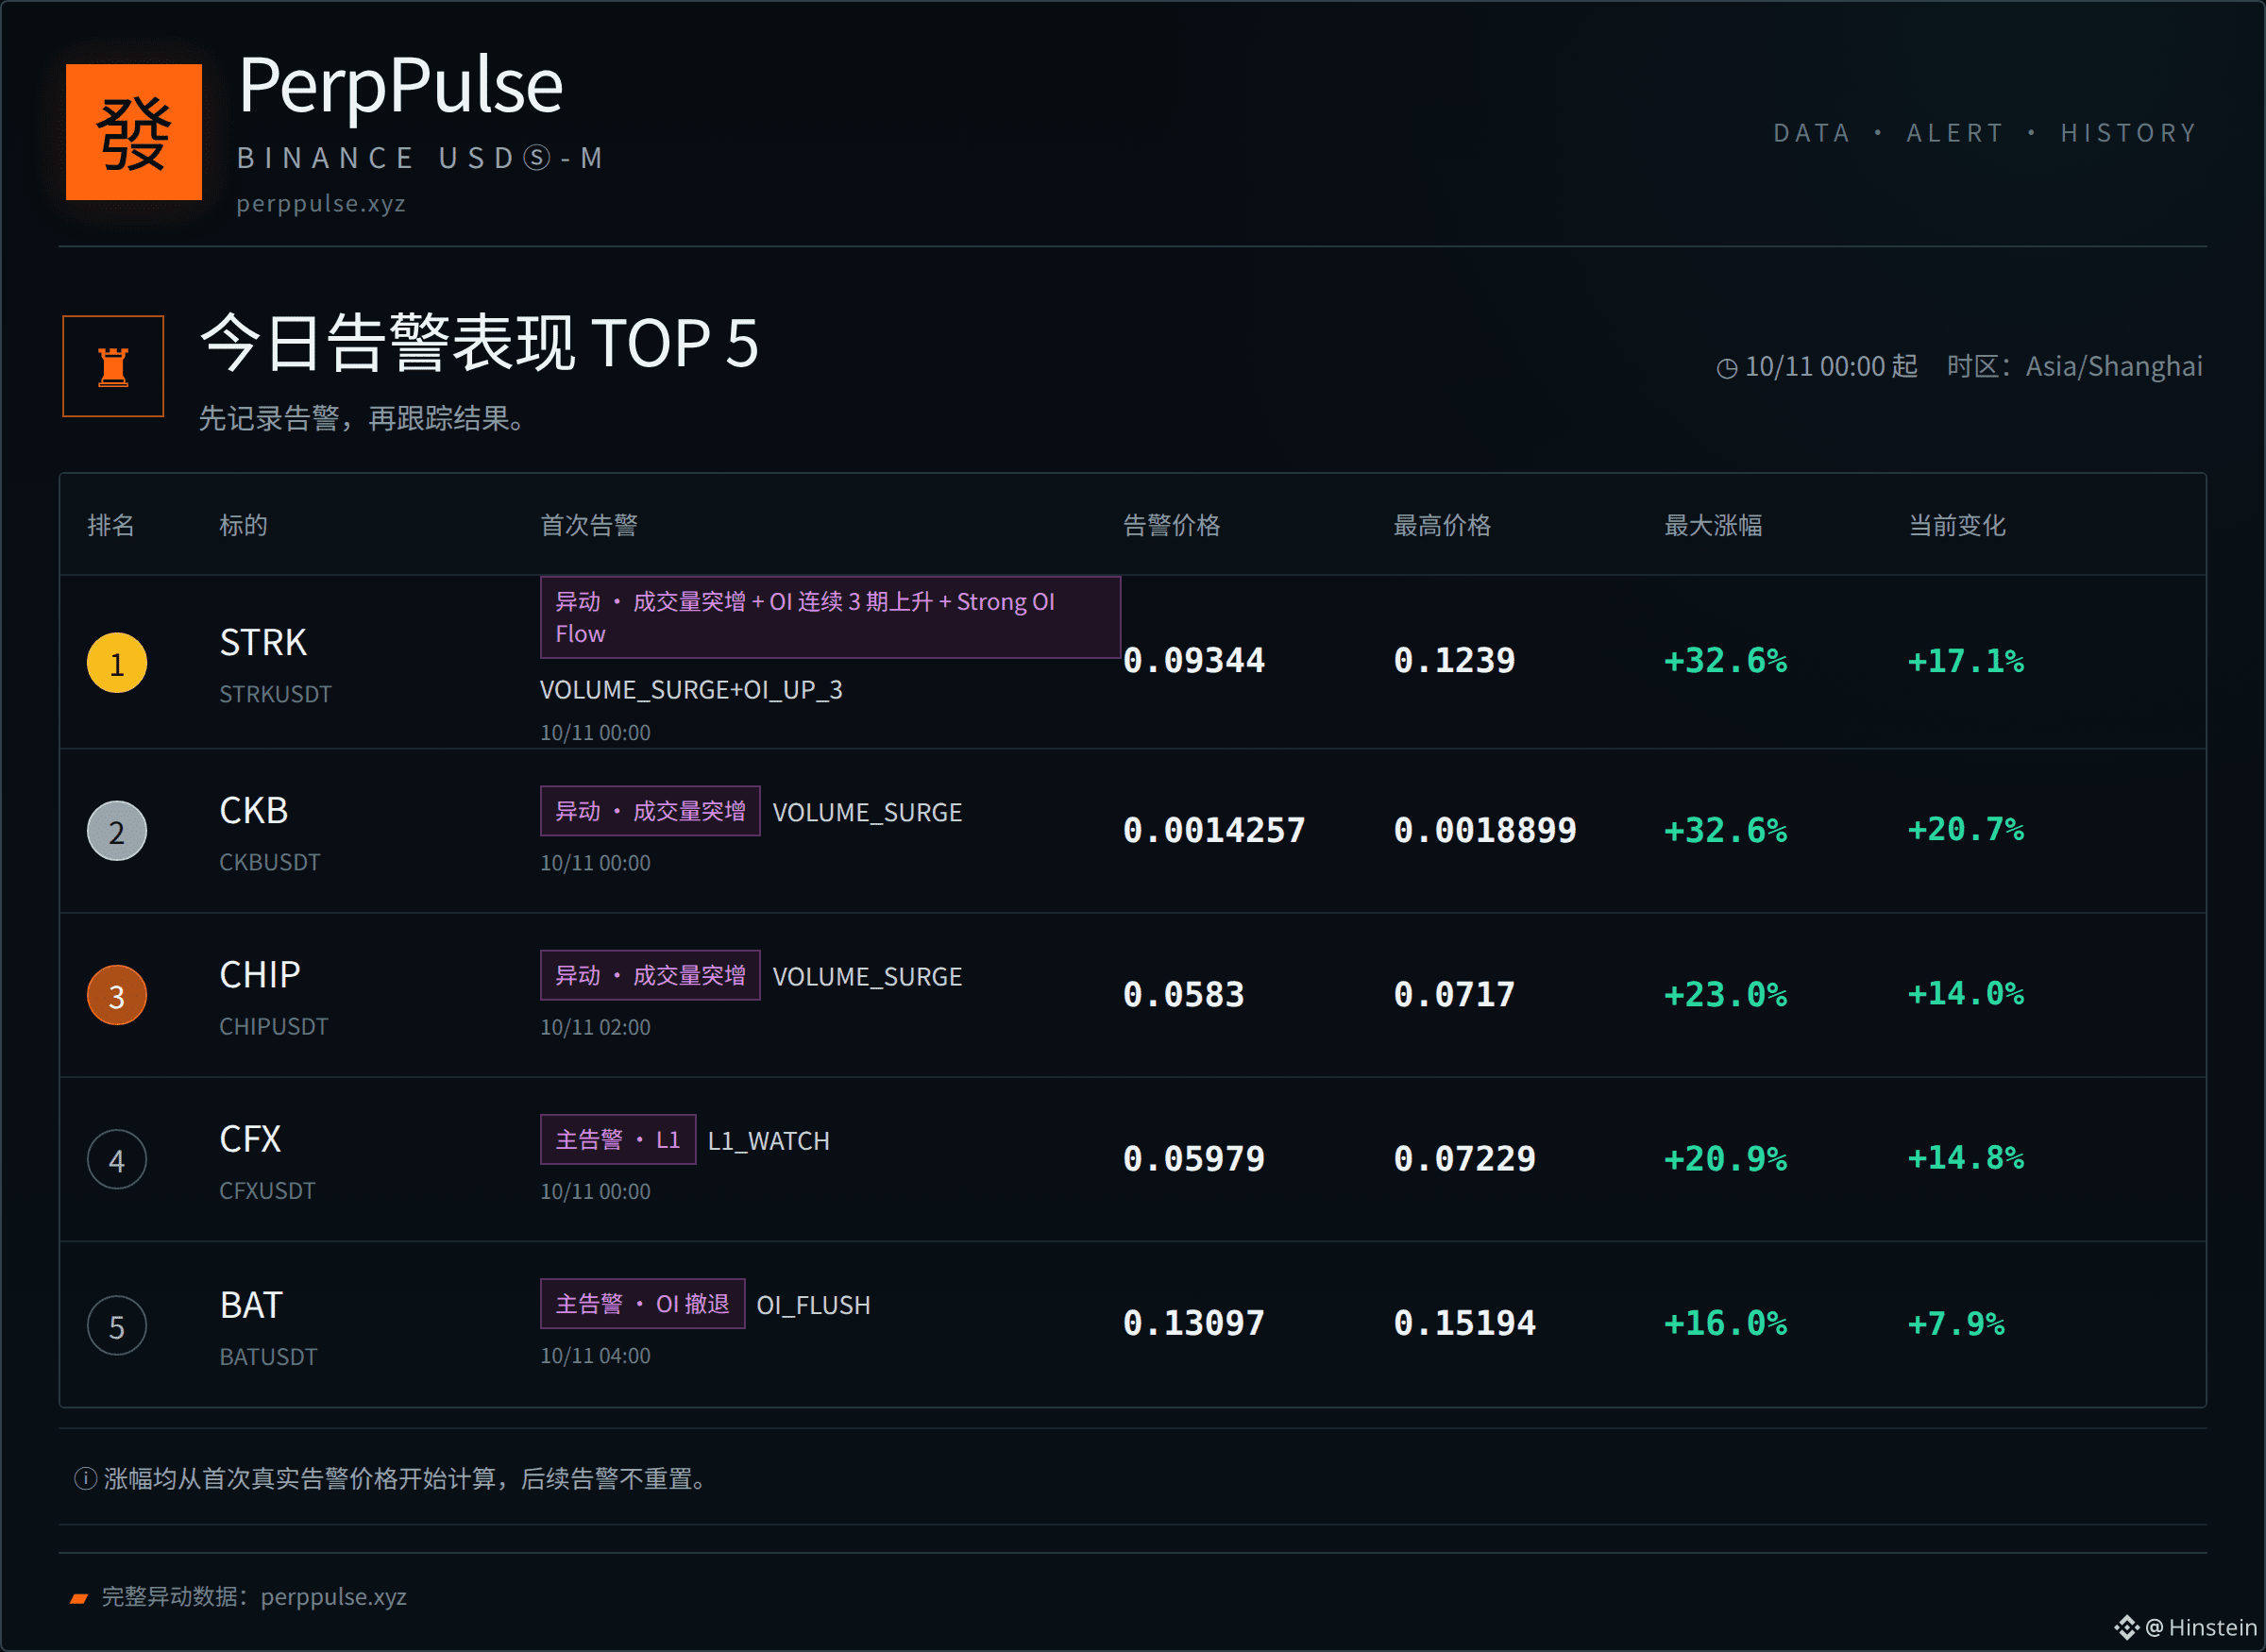
📊 Today's Top Unusual Movers
1. $STRK +32.6%
2. $CKB +32.6%
3. $CHIP +23.0%
4. CFX +20.9%
5. BAT +16.0%
Methodology: First valid alert of the day → highest price afterward.
We record only the outcome the market delivered; historical peak moves are not treated as trading profits.
#MarketMovers #CryptoData
Full unusual-mover data: perppulse.xyz
📊 Today's Top Unusual Movers
1. $STRK +32.6%
2. $CKB +32.6%
3. $CHIP +23.0%
4. CFX +20.9%
5. BAT +16.0%
Methodology: First valid alert of the day → highest price afterward.
We record only the outcome the market delivered; historical peak moves are not treated as trading profits.
#MarketMovers #CryptoData
Full unusual-mover data: perppulse.xyz
1. $STRK +32.6%
2. $CKB +32.6%
3. $CHIP +23.0%
4. CFX +20.9%
5. BAT +16.0%
Methodology: First valid alert of the day → highest price afterward.
We record only the outcome the market delivered; historical peak moves are not treated as trading profits.
#MarketMovers #CryptoData
Full unusual-mover data: perppulse.xyz
40
·
--
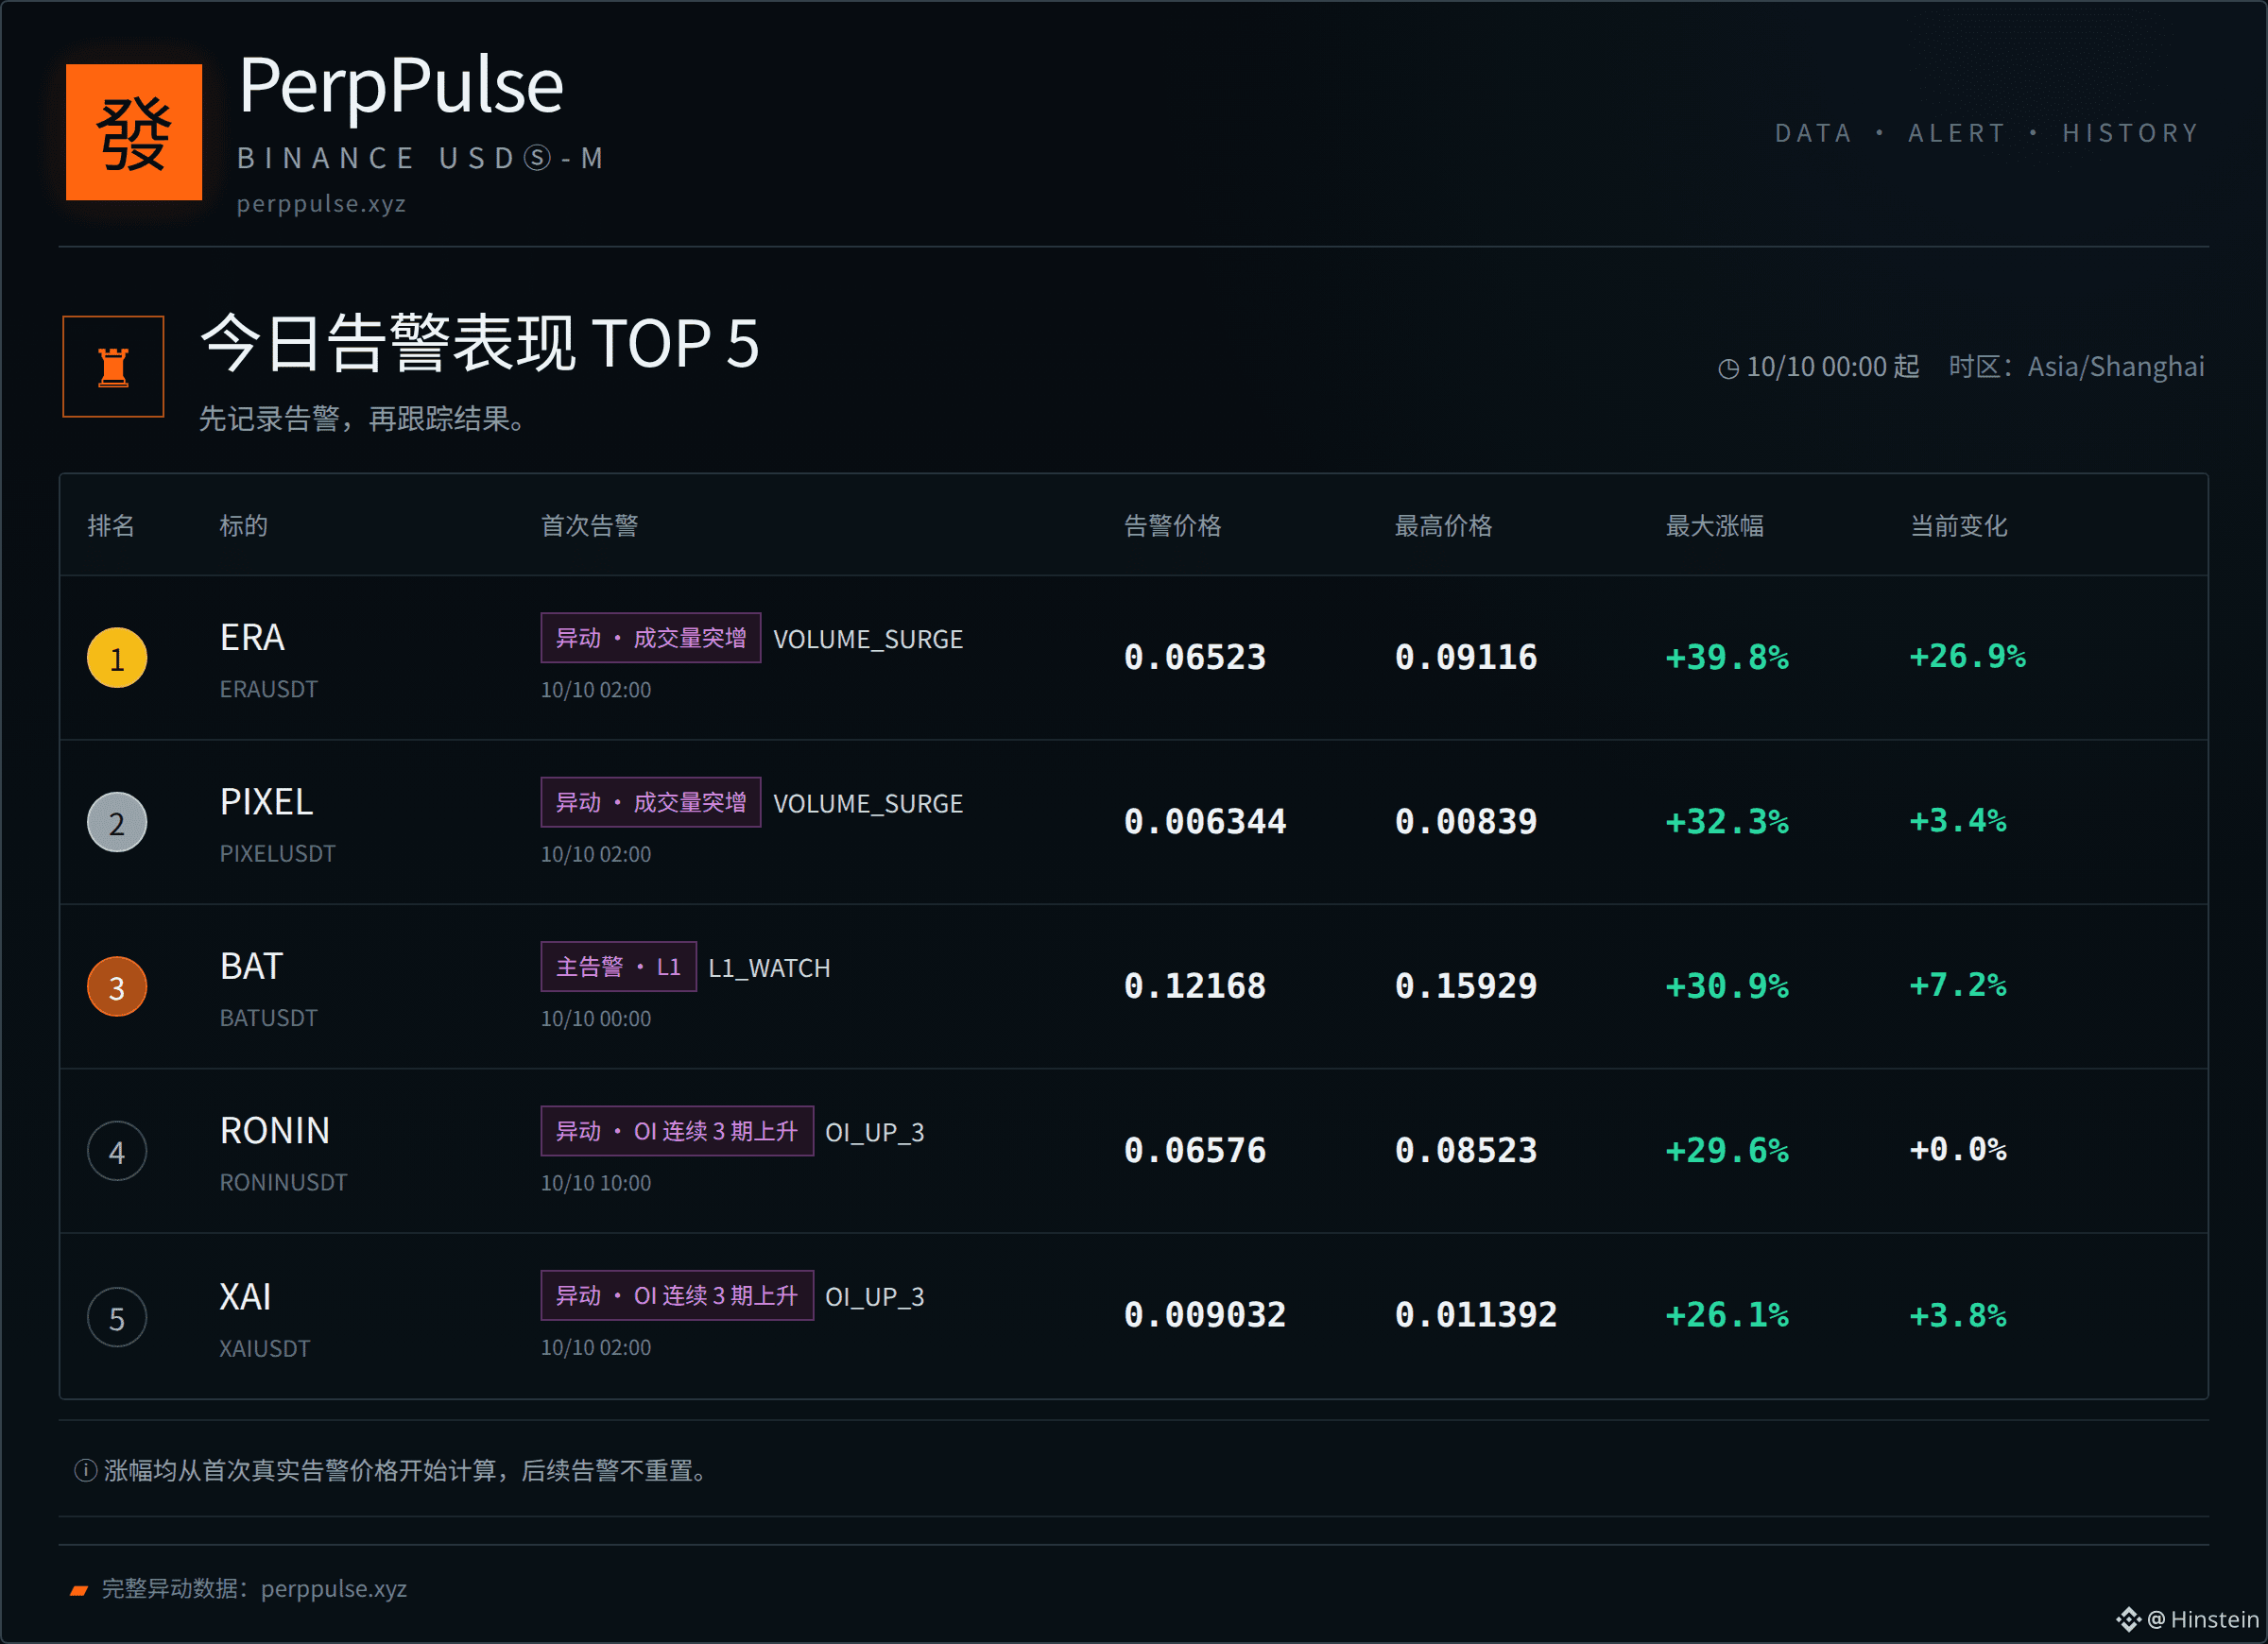
📊 Today's Top Movers
1. $ERA +39.8%
2. $PIXEL +32.3%
3. $BAT +30.9%
4. RONIN +29.6%
5. XAI +26.1%
Metric: First valid alert of the day → highest price reached afterward.
We record only what the market delivered; historical peak movements are not treated as trading returns.
#MarketMovers #CryptoData
Full market-mover data: perppulse.xyz
📊 Today's Top Movers
1. $ERA +39.8%
2. $PIXEL +32.3%
3. $BAT +30.9%
4. RONIN +29.6%
5. XAI +26.1%
Metric: First valid alert of the day → highest price reached afterward.
We record only what the market delivered; historical peak movements are not treated as trading returns.
#MarketMovers #CryptoData
Full market-mover data: perppulse.xyz
1. $ERA +39.8%
2. $PIXEL +32.3%
3. $BAT +30.9%
4. RONIN +29.6%
5. XAI +26.1%
Metric: First valid alert of the day → highest price reached afterward.
We record only what the market delivered; historical peak movements are not treated as trading returns.
#MarketMovers #CryptoData
Full market-mover data: perppulse.xyz
16
·
--
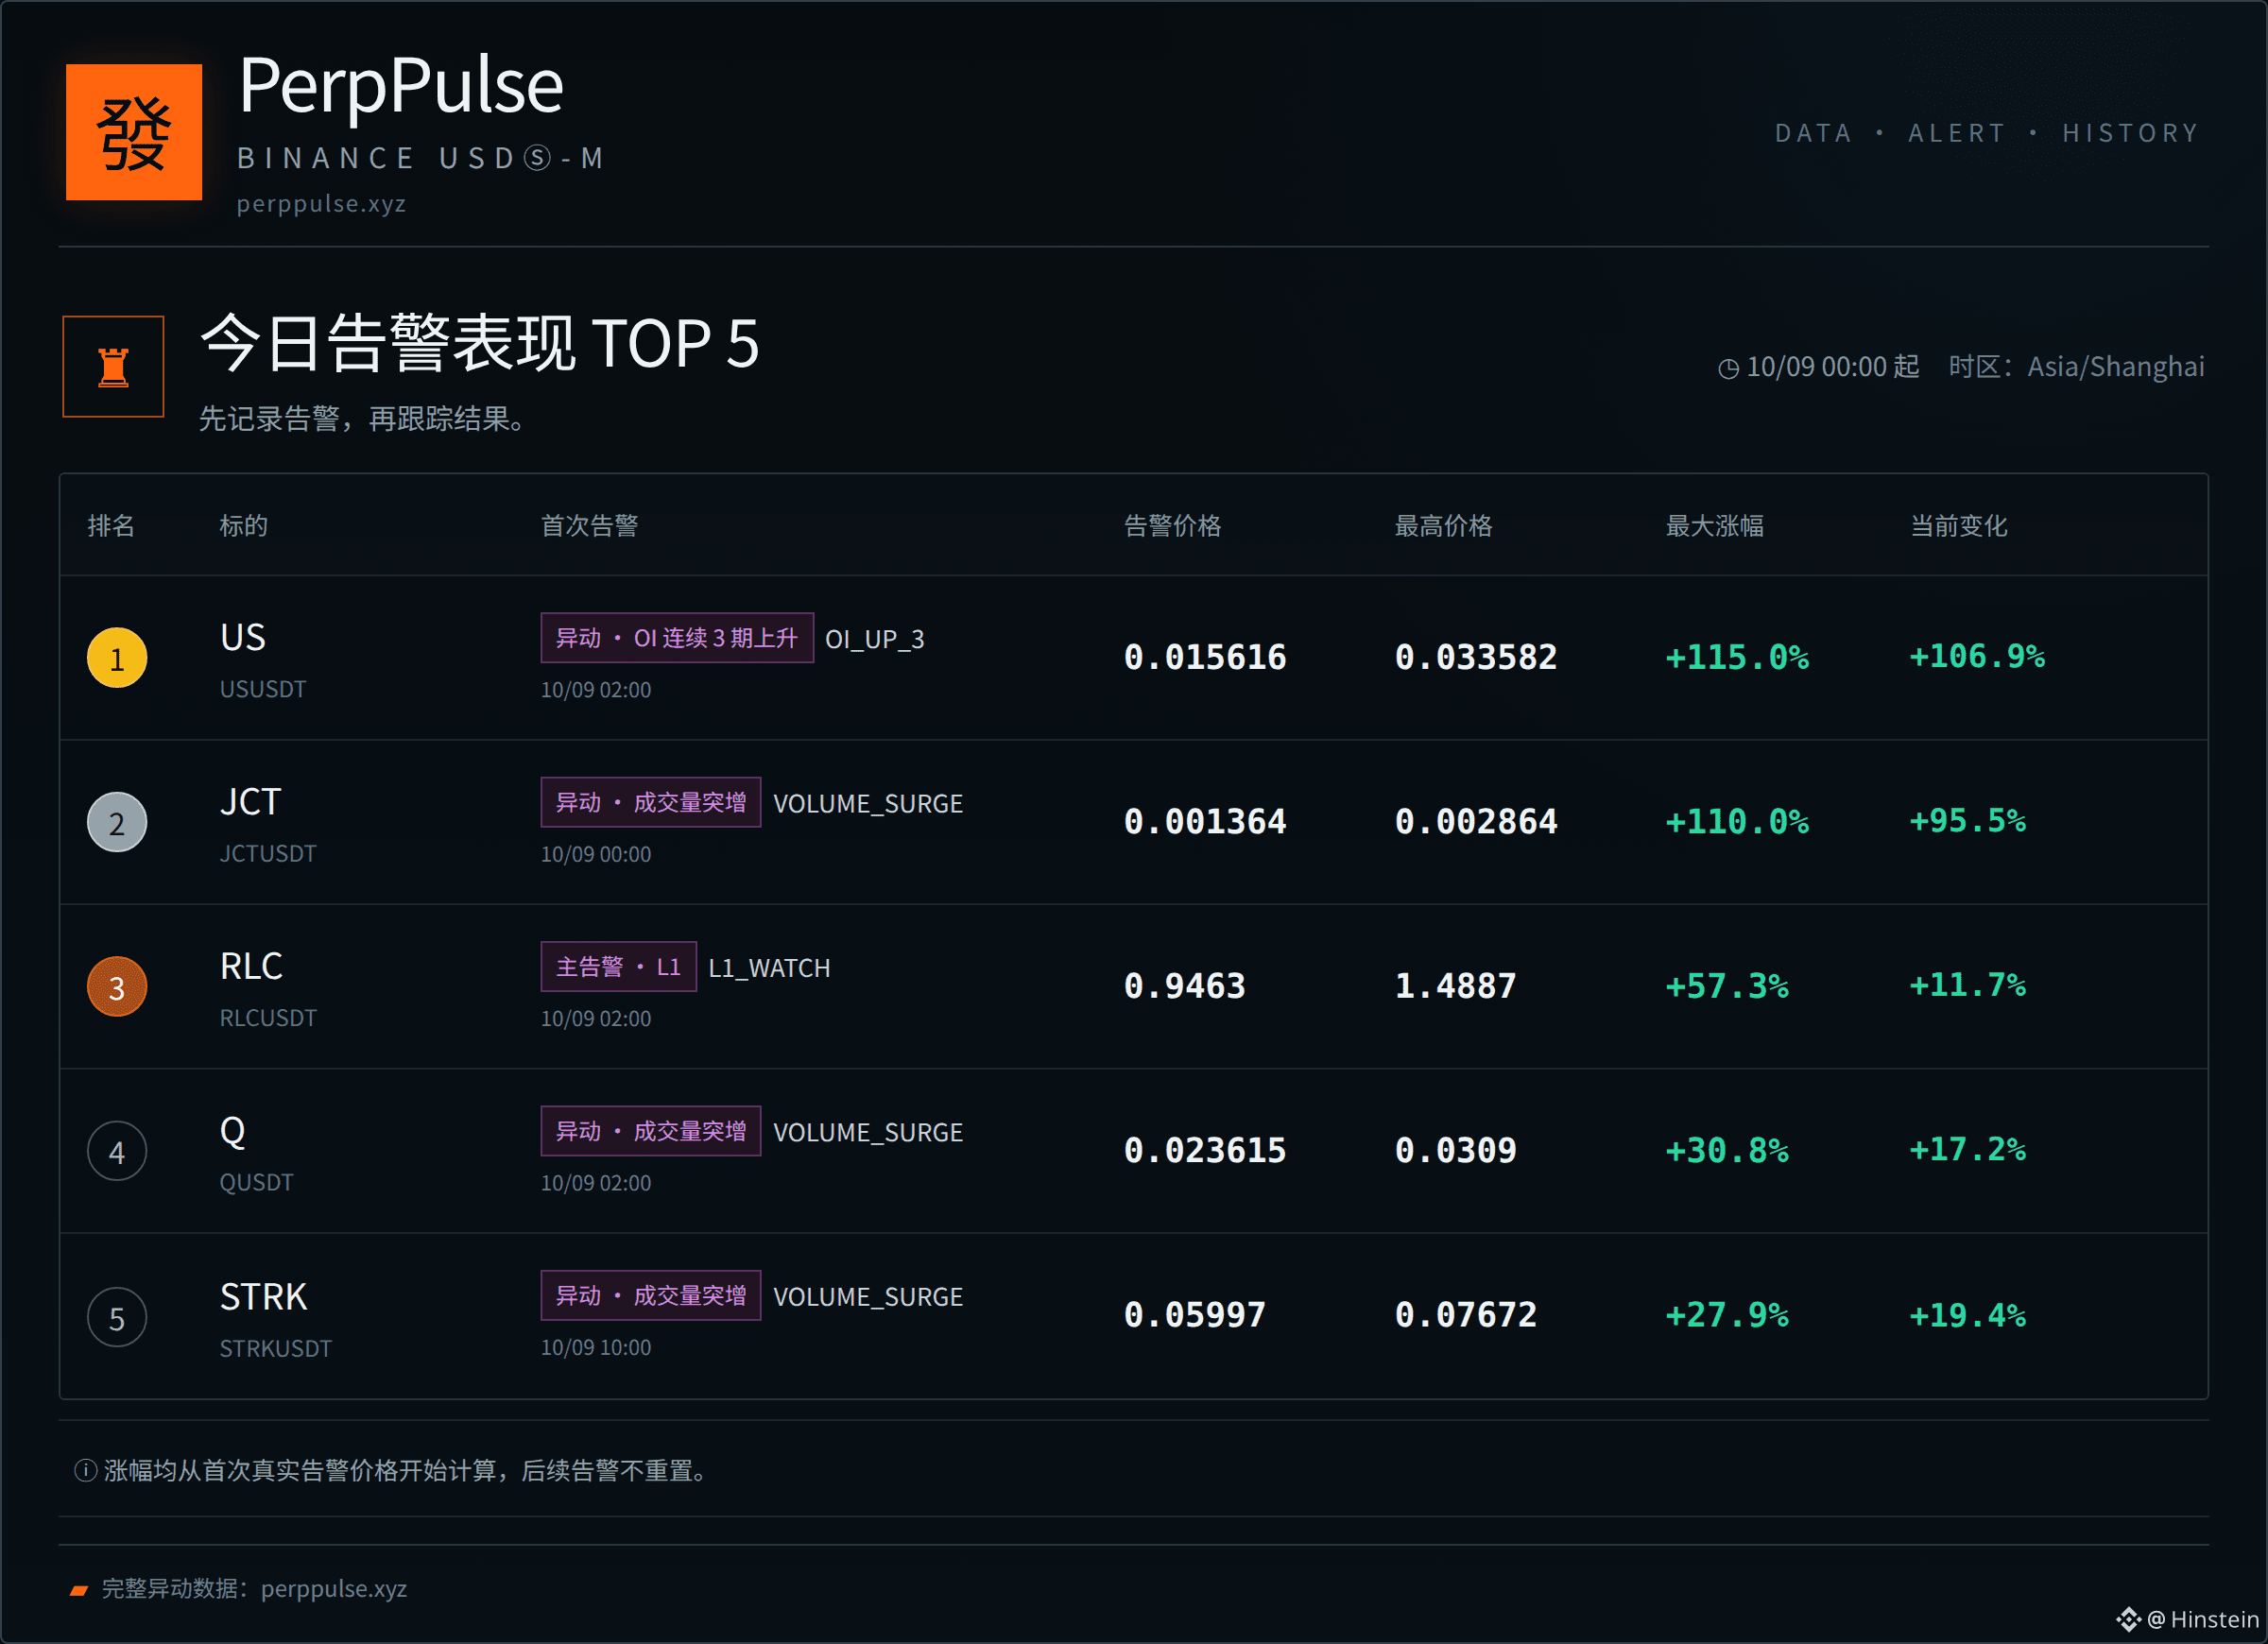
📊 Today's Biggest Price Movers
1. $US +115.0%
2. $JCT +110.0%
3. $RLC +57.3%
4. Q +30.8%
5. STRK +27.9%
Calculation method: First valid alert of the day → highest price afterward.
We only record what the market delivered; historical peak movements are not treated as trading profits.
#MarketMovers #CryptoData
Full price movement data: perppulse.xyz
📊 Today's Biggest Price Movers
1. $US +115.0%
2. $JCT +110.0%
3. $RLC +57.3%
4. Q +30.8%
5. STRK +27.9%
Calculation method: First valid alert of the day → highest price afterward.
We only record what the market delivered; historical peak movements are not treated as trading profits.
#MarketMovers #CryptoData
Full price movement data: perppulse.xyz
1. $US +115.0%
2. $JCT +110.0%
3. $RLC +57.3%
4. Q +30.8%
5. STRK +27.9%
Calculation method: First valid alert of the day → highest price afterward.
We only record what the market delivered; historical peak movements are not treated as trading profits.
#MarketMovers #CryptoData
Full price movement data: perppulse.xyz
25
·
--
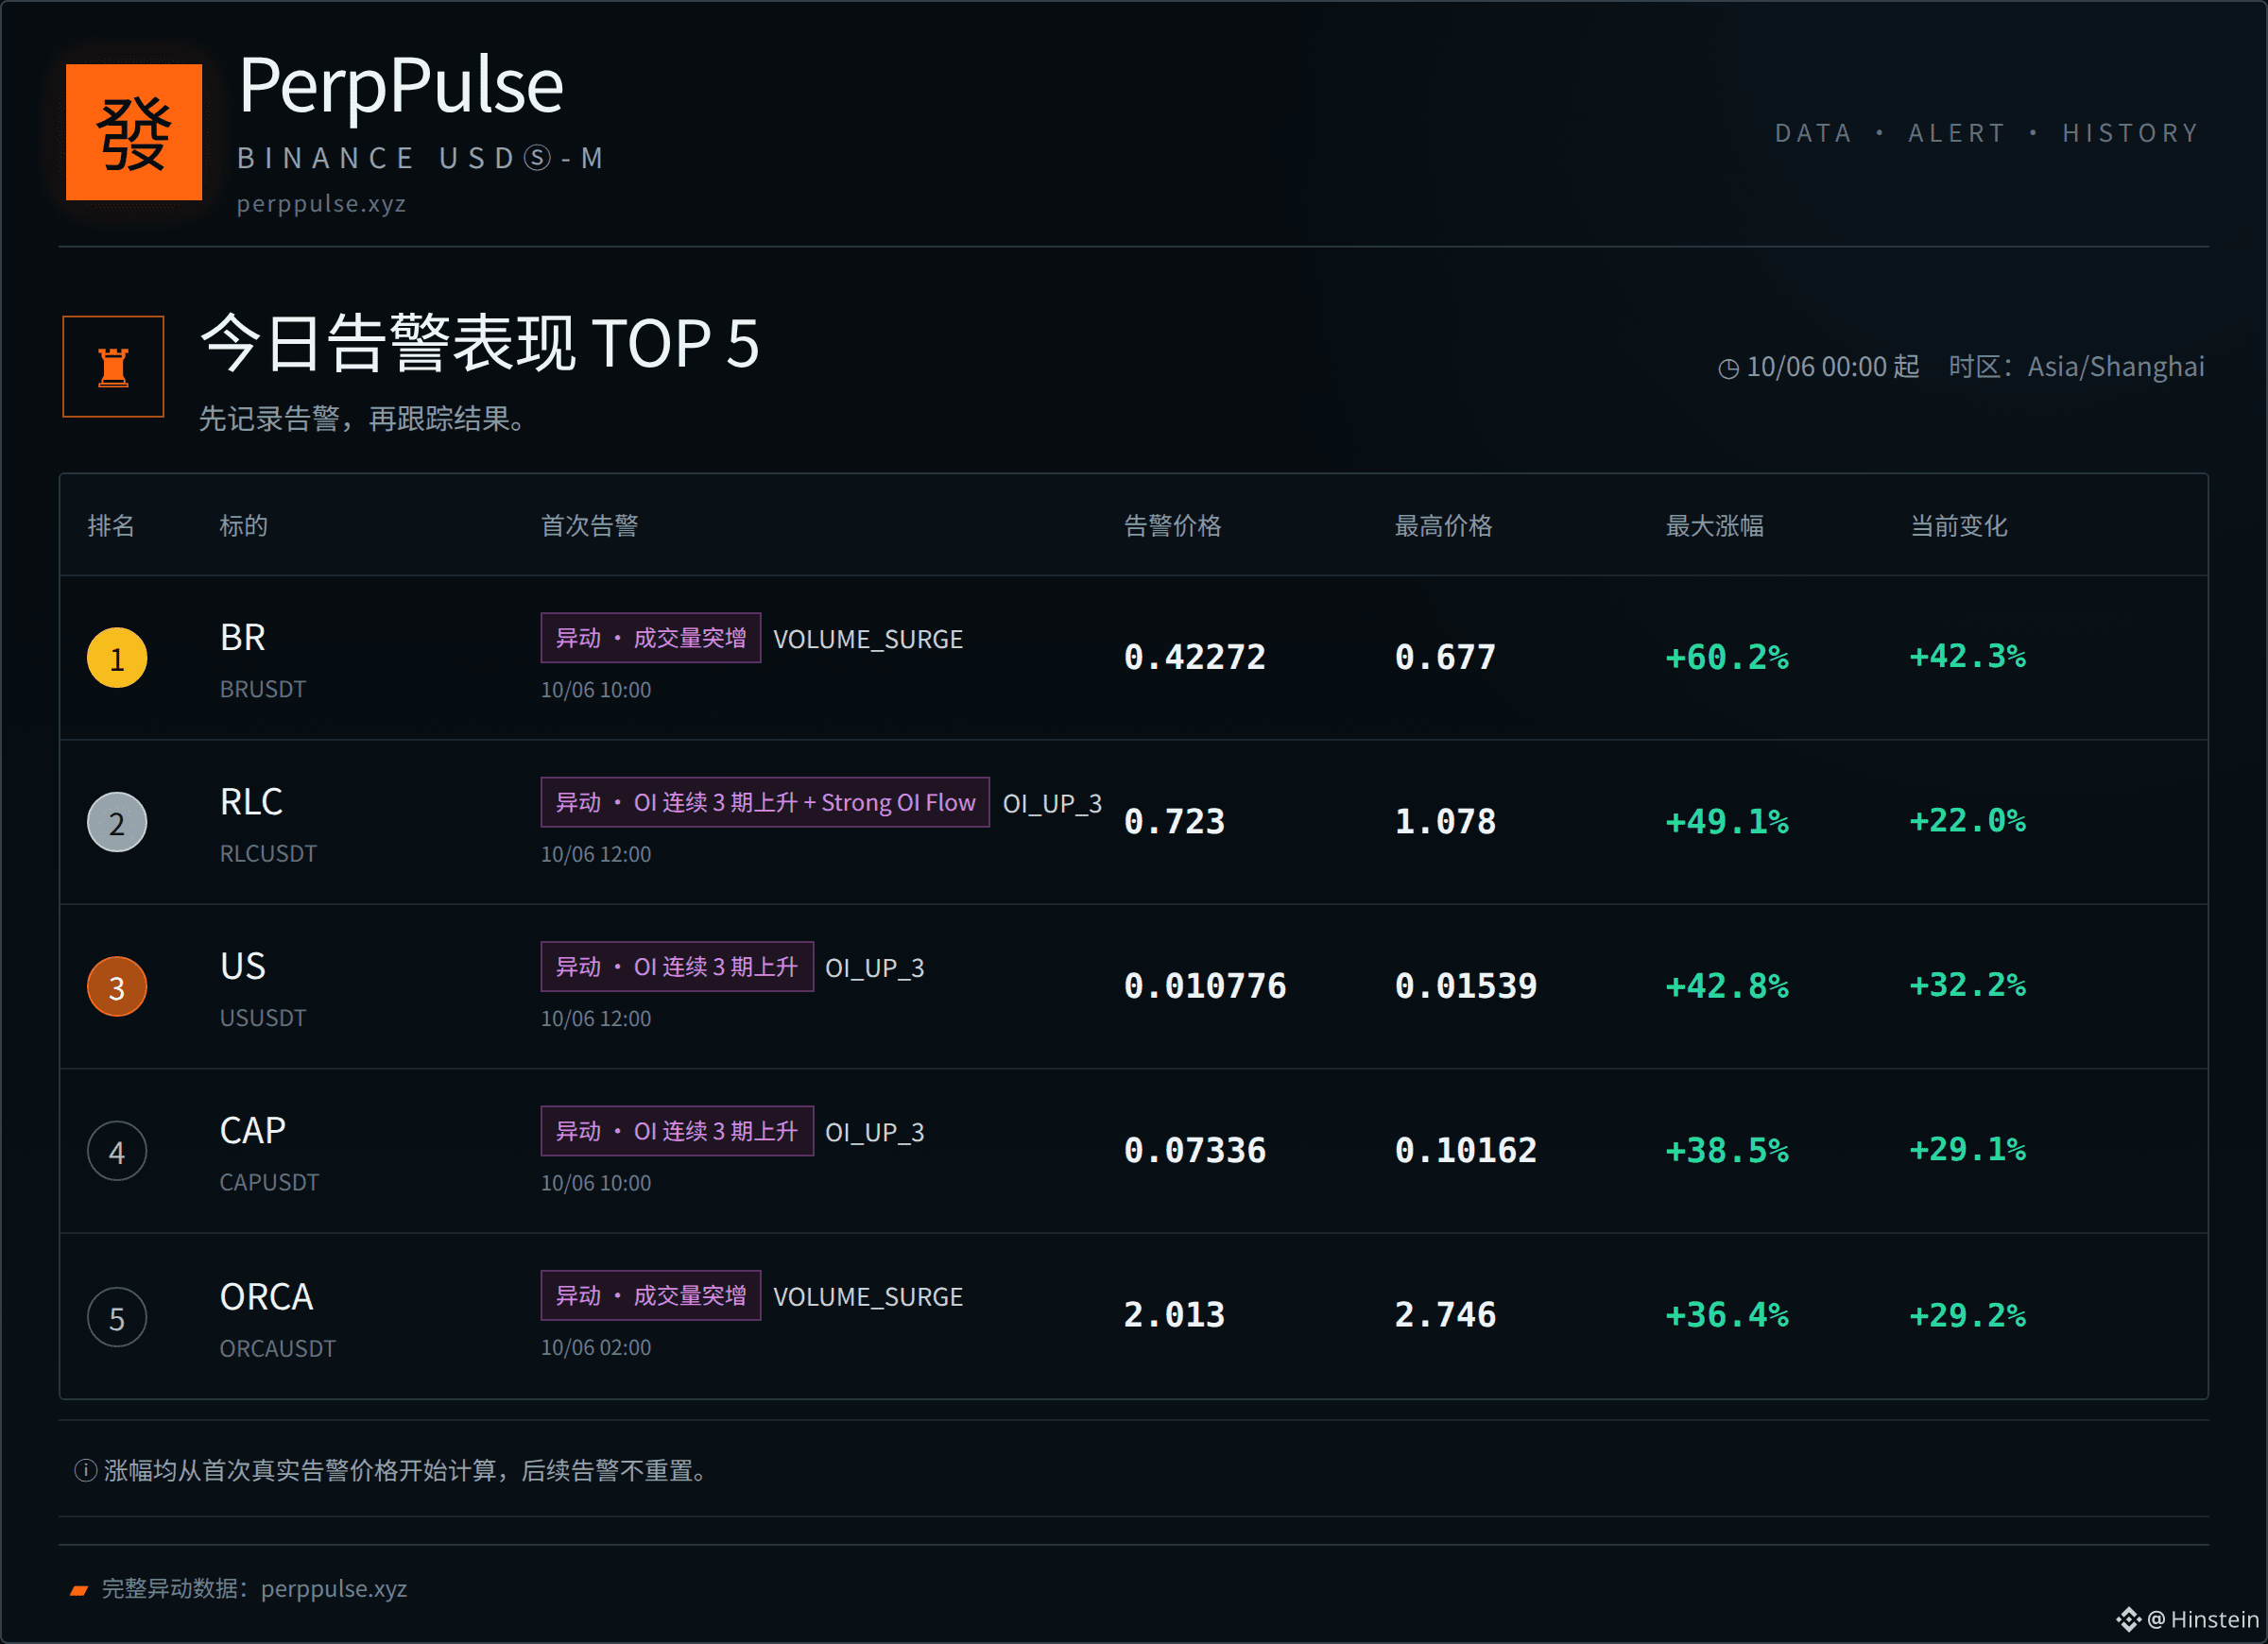
📊 Today's Top Movers
1. $BR +60.2%
2. $RLC +49.1%
3. $US +42.8%
4. CAP +38.5%
5. ORCA +36.4%
Methodology: First valid alert of the day → highest price afterward.
We only record what the market delivered; historical peak moves are not treated as trading returns.
#MarketMovers #CryptoData
Full mover data: perppulse.xyz
📊 Today's Top Movers
1. $BR +60.2%
2. $RLC +49.1%
3. $US +42.8%
4. CAP +38.5%
5. ORCA +36.4%
Methodology: First valid alert of the day → highest price afterward.
We only record what the market delivered; historical peak moves are not treated as trading returns.
#MarketMovers #CryptoData
Full mover data: perppulse.xyz
1. $BR +60.2%
2. $RLC +49.1%
3. $US +42.8%
4. CAP +38.5%
5. ORCA +36.4%
Methodology: First valid alert of the day → highest price afterward.
We only record what the market delivered; historical peak moves are not treated as trading returns.
#MarketMovers #CryptoData
Full mover data: perppulse.xyz
15

·
--
:📊 Real Data Check: BTC Holds $86K, ETF Flows Stay Positive & Whale Stablecoins Flood BinanceAs of October 5, 2026, Bitcoin is trading around $86,000–$86,300, with the total crypto market cap near $2.93–$2.95 trillion and BTC dominance sitting at approximately 59%.Here’s the latest verified data:US Spot Bitcoin ETFs: Third consecutive week of net inflows, bringing in $241 million last week (Sept 28–Oct 2). BlackRock’s IBIT continues to lead. Month-to-date October already shows solid positive flows after strong September performance (~$2.65B).
BNB: Trading near $790, up roughly 3–5% over the past week and month. Market cap sits around $105 billion. The token remains one of the stronger large-caps with clean structure near the psychological $800 level.
Stablecoin signals on Binance: Whale transfers (>$1M) of stablecoins into Binance have jumped more than 40% over the past 30 days, reaching $30.5 billion cumulative. Daily stablecoin inflows to the exchange have frequently exceeded $1 billion, keeping significant buying power on the platform.
Sentiment: Fear & Greed Index around 70 (Greed).
These flows — ETF capital returning, large stablecoin deposits concentrating on Binance, and BTC consolidating above $85K — point to continued institutional and whale interest rather than pure retail FOMO.Are you watching the ETF flow numbers, BNB’s approach to $800, or the stablecoin dry powder on Binance most closely right now?Not financial advice. Always DYOR and manage your risk. #Binance #CryptoData #MarketUpdate #BTC #BinanceSquare
:📊 Real Data Check: BTC Holds $86K, ETF Flows Stay Positive & Whale Stablecoins Flood BinanceAs of October 5, 2026, Bitcoin is trading around $86,000–$86,300, with the total crypto market cap near $2.93–$2.95 trillion and BTC dominance sitting at approximately 59%.Here’s the latest verified data:US Spot Bitcoin ETFs: Third consecutive week of net inflows, bringing in $241 million last week (Sept 28–Oct 2). BlackRock’s IBIT continues to lead. Month-to-date October already shows solid positive flows after strong September performance (~$2.65B).
BNB: Trading near $790, up roughly 3–5% over the past week and month. Market cap sits around $105 billion. The token remains one of the stronger large-caps with clean structure near the psychological $800 level.
Stablecoin signals on Binance: Whale transfers (>$1M) of stablecoins into Binance have jumped more than 40% over the past 30 days, reaching $30.5 billion cumulative. Daily stablecoin inflows to the exchange have frequently exceeded $1 billion, keeping significant buying power on the platform.
Sentiment: Fear & Greed Index around 70 (Greed).
These flows — ETF capital returning, large stablecoin deposits concentrating on Binance, and BTC consolidating above $85K — point to continued institutional and whale interest rather than pure retail FOMO.Are you watching the ETF flow numbers, BNB’s approach to $800, or the stablecoin dry powder on Binance most closely right now?Not financial advice. Always DYOR and manage your risk. #Binance #CryptoData #MarketUpdate #BTC #BinanceSquare
BNB: Trading near $790, up roughly 3–5% over the past week and month. Market cap sits around $105 billion. The token remains one of the stronger large-caps with clean structure near the psychological $800 level.
Stablecoin signals on Binance: Whale transfers (>$1M) of stablecoins into Binance have jumped more than 40% over the past 30 days, reaching $30.5 billion cumulative. Daily stablecoin inflows to the exchange have frequently exceeded $1 billion, keeping significant buying power on the platform.
Sentiment: Fear & Greed Index around 70 (Greed).
These flows — ETF capital returning, large stablecoin deposits concentrating on Binance, and BTC consolidating above $85K — point to continued institutional and whale interest rather than pure retail FOMO.Are you watching the ETF flow numbers, BNB’s approach to $800, or the stablecoin dry powder on Binance most closely right now?Not financial advice. Always DYOR and manage your risk. #Binance #CryptoData #MarketUpdate #BTC #BinanceSquare
103

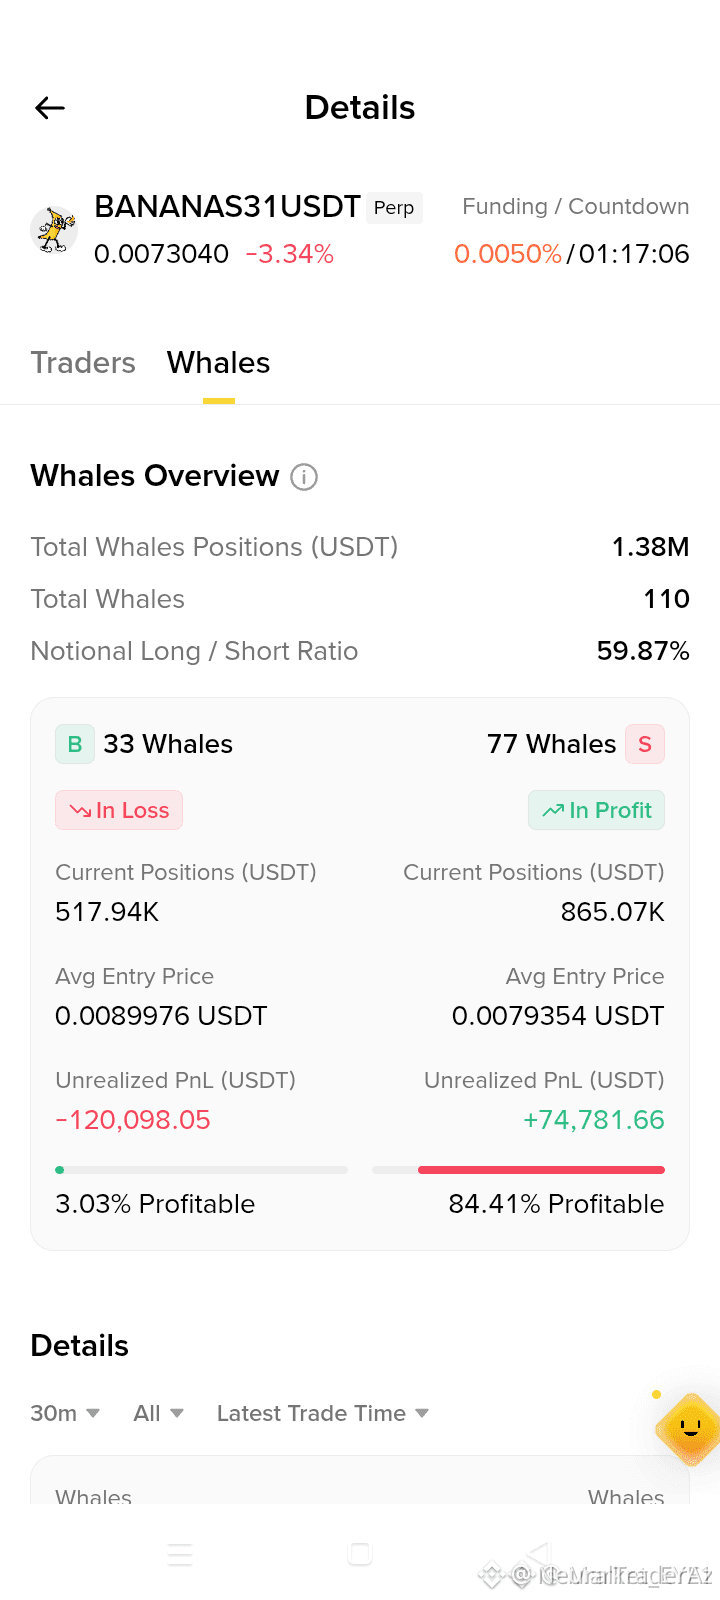
$BANANAS31 LONGS BEING LIQUIDATED AS SHORTS CONTROL THE FLOW 💀
Only 3% of $BANANAS31 buyers are in profit right now, carrying a collective -$120K in unrealized losses. Meanwhile, 77 short positions have stacked +$74K in floating gains. That’s a 24:1 profit ratio favoring the bears — a clear structural imbalance.
When 97% of one side is underwater, the path of least resistance usually remains with the dominant group until liquidity shifts. The data doesn't lie, emotions do. Are you positioned with the majority or against it?
Not financial advice. Always manage your risk.
#BANANAS31 #ShortSetup #Liquidation #CryptoData
⚡
$BANANAS31 LONGS BEING LIQUIDATED AS SHORTS CONTROL THE FLOW 💀
Only 3% of $BANANAS31 buyers are in profit right now, carrying a collective -$120K in unrealized losses. Meanwhile, 77 short positions have stacked +$74K in floating gains. That’s a 24:1 profit ratio favoring the bears — a clear structural imbalance.
When 97% of one side is underwater, the path of least resistance usually remains with the dominant group until liquidity shifts. The data doesn't lie, emotions do. Are you positioned with the majority or against it?
Not financial advice. Always manage your risk.
#BANANAS31 #ShortSetup #Liquidation #CryptoData
⚡
Only 3% of $BANANAS31 buyers are in profit right now, carrying a collective -$120K in unrealized losses. Meanwhile, 77 short positions have stacked +$74K in floating gains. That’s a 24:1 profit ratio favoring the bears — a clear structural imbalance.
When 97% of one side is underwater, the path of least resistance usually remains with the dominant group until liquidity shifts. The data doesn't lie, emotions do. Are you positioned with the majority or against it?
Not financial advice. Always manage your risk.
#BANANAS31 #ShortSetup #Liquidation #CryptoData
⚡
124
·
--
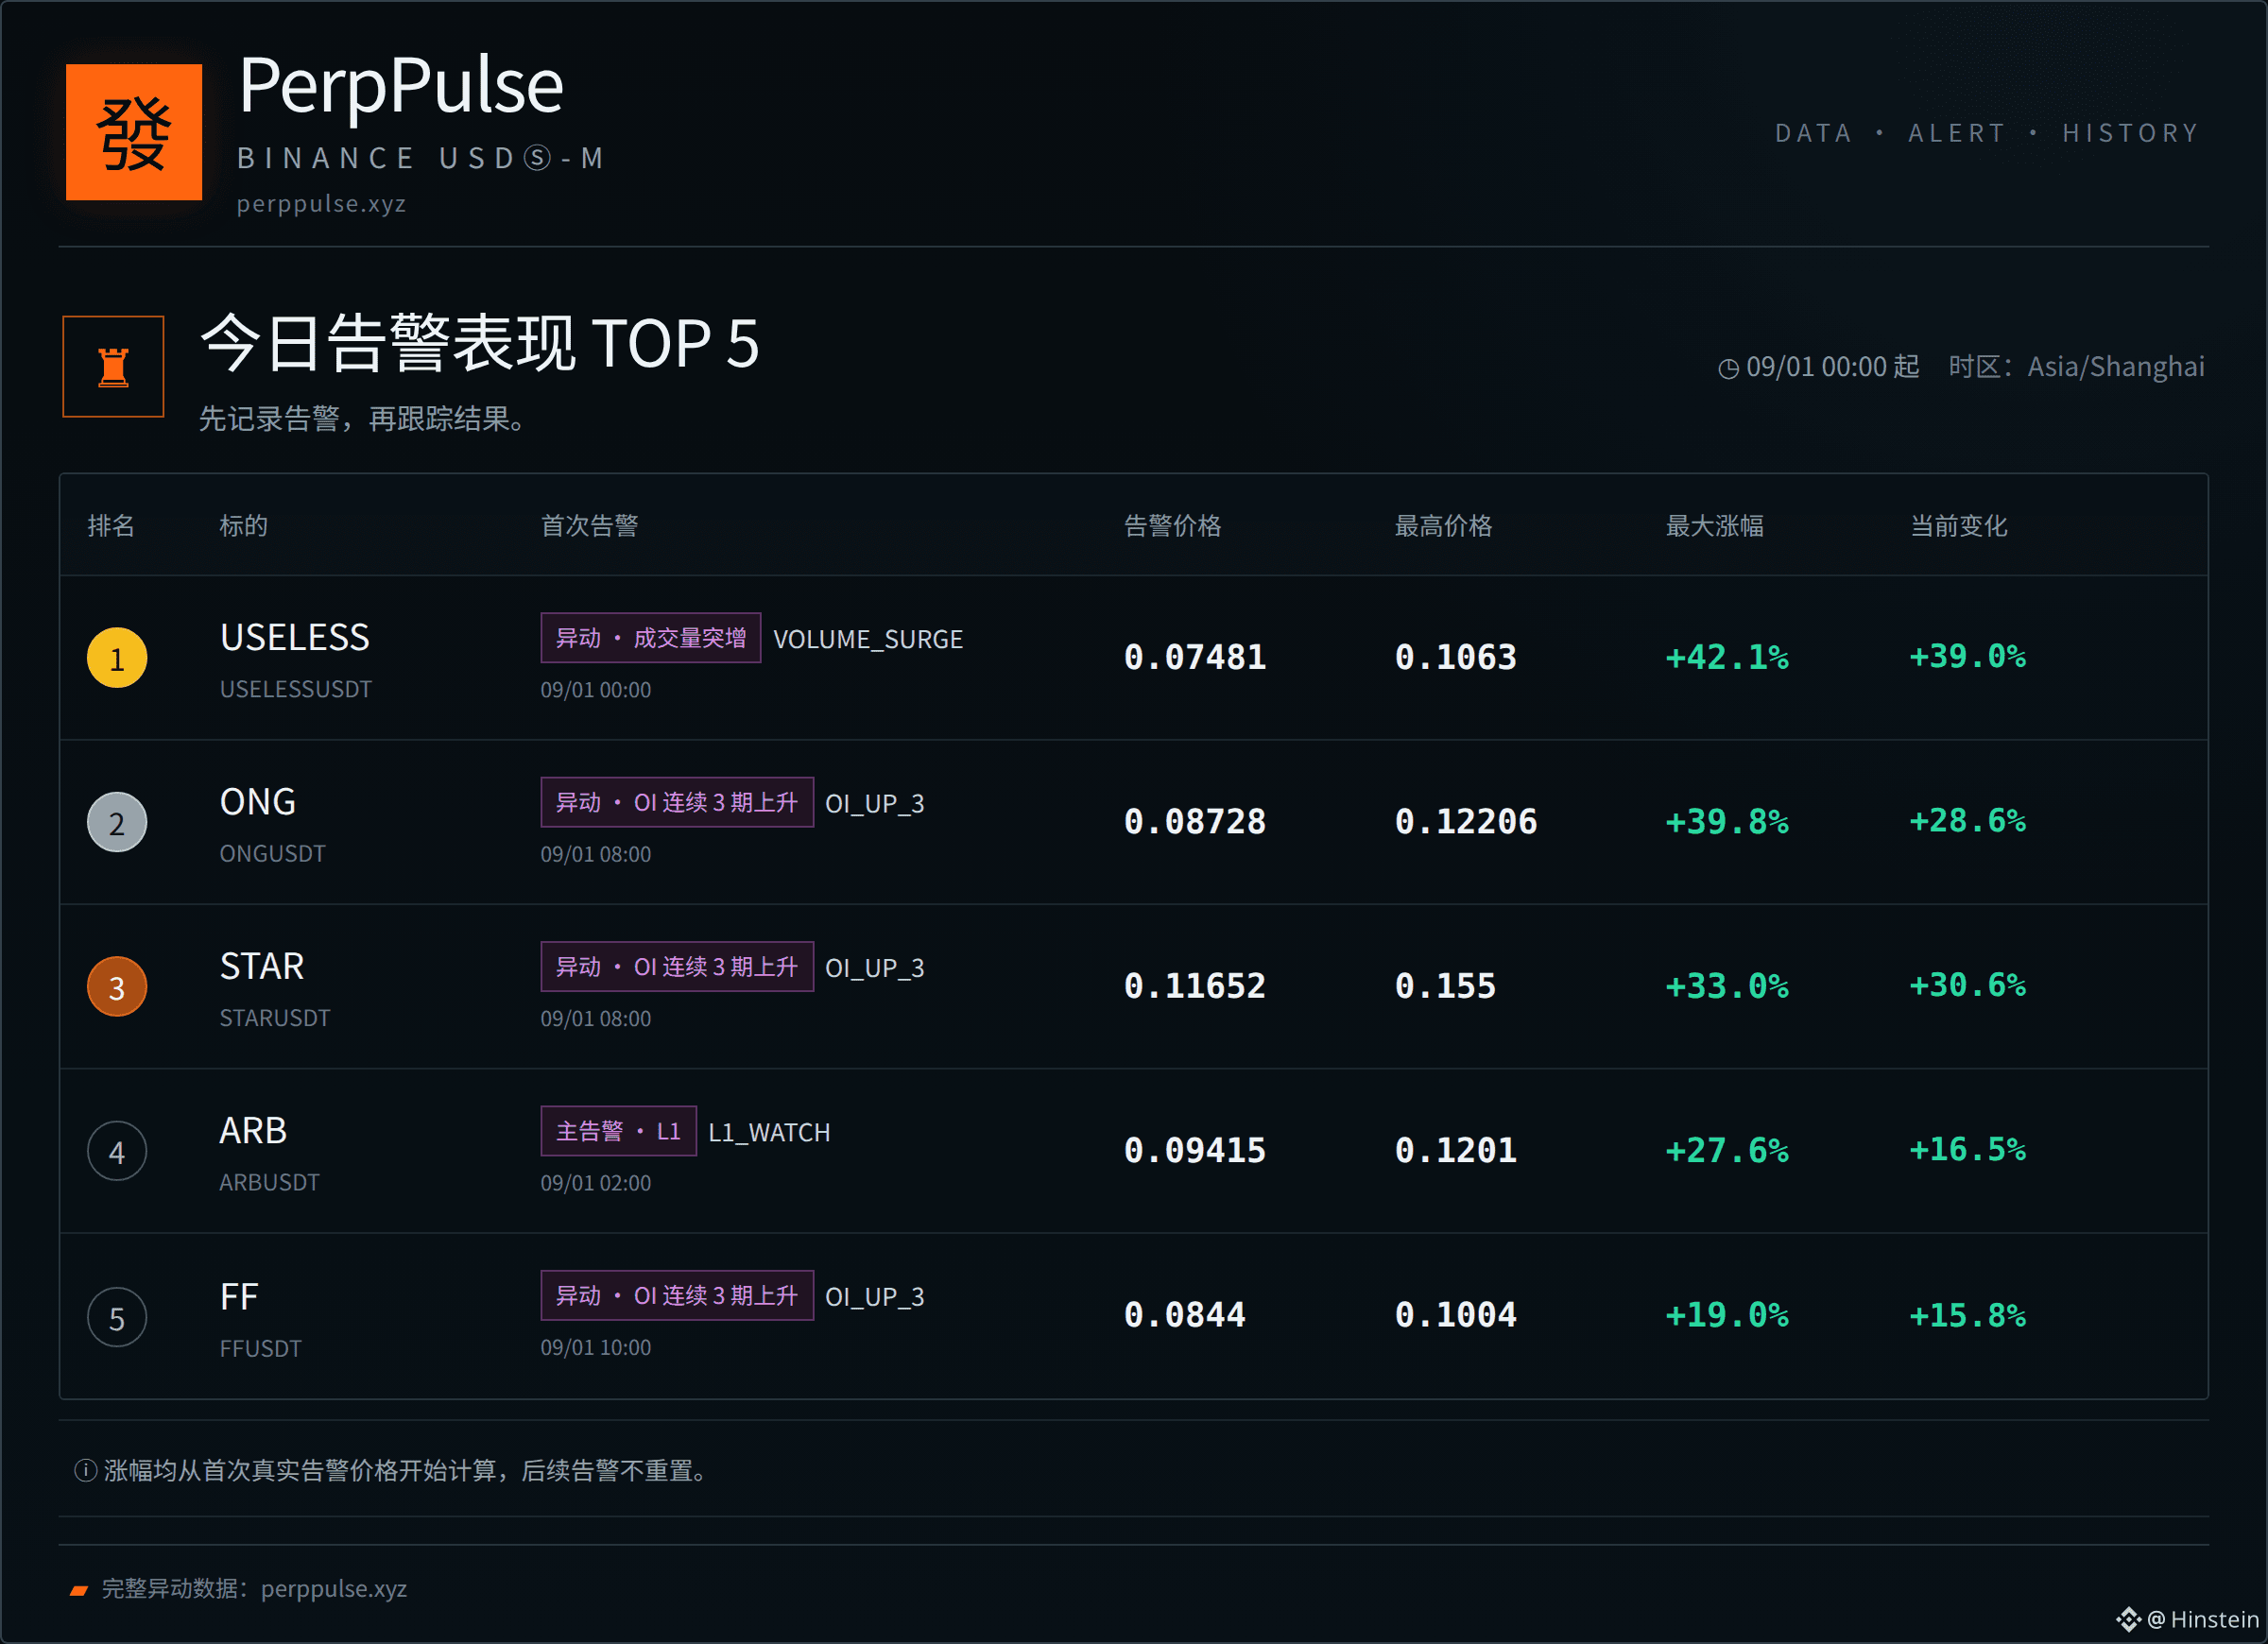
📊 Today’s Movers Ranking
1. $USELESS +42.1%
2. $ONG +39.8%
3. $STAR +33.0%
4. ARB +27.6%
5. FF +19.0%
Statistics methodology: first valid alert on the day → followed by the highest price thereafter.
Only records the results left in the market; does not treat the all-time highest change as trading profit.
#MarketMovers #CryptoData
Full movers data: perppulse.xyz
📊 Today’s Movers Ranking
1. $USELESS +42.1%
2. $ONG +39.8%
3. $STAR +33.0%
4. ARB +27.6%
5. FF +19.0%
Statistics methodology: first valid alert on the day → followed by the highest price thereafter.
Only records the results left in the market; does not treat the all-time highest change as trading profit.
#MarketMovers #CryptoData
Full movers data: perppulse.xyz
1. $USELESS +42.1%
2. $ONG +39.8%
3. $STAR +33.0%
4. ARB +27.6%
5. FF +19.0%
Statistics methodology: first valid alert on the day → followed by the highest price thereafter.
Only records the results left in the market; does not treat the all-time highest change as trading profit.
#MarketMovers #CryptoData
Full movers data: perppulse.xyz
29
·
--
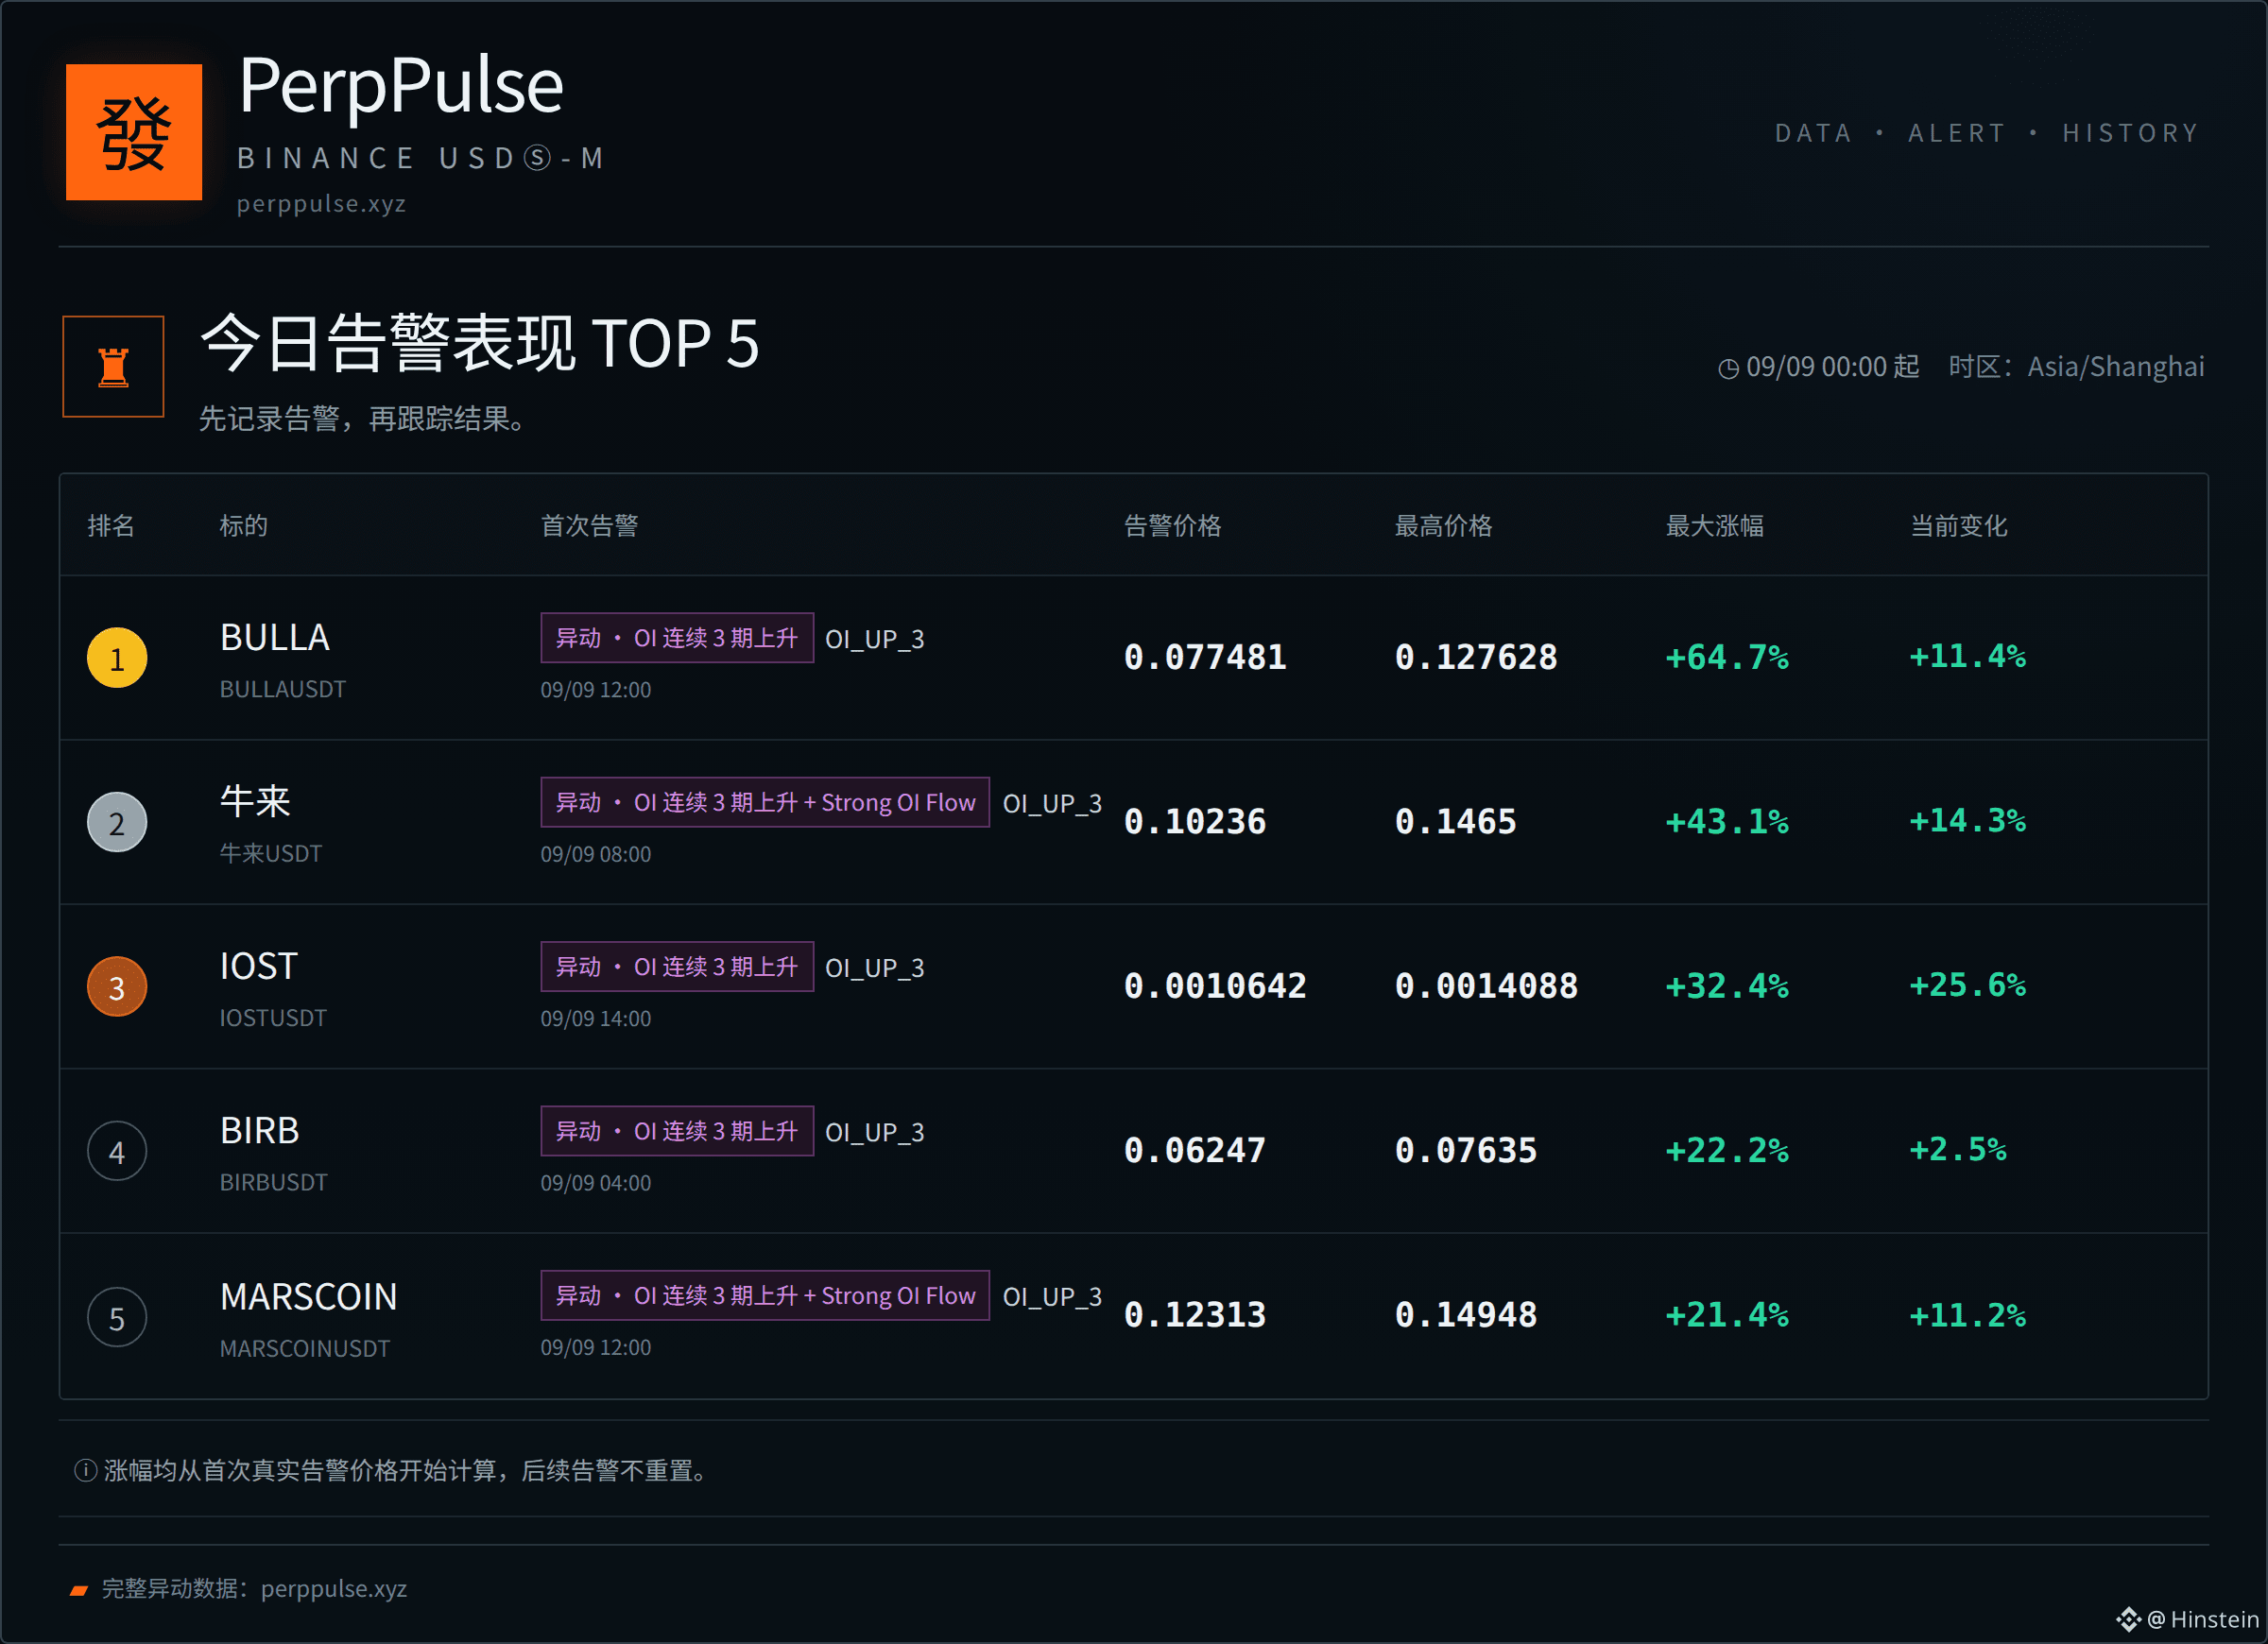
📊 Today’s Active Movers Ranking
1. $BULLA +64.7%
2. $牛来 +43.1%
3. $IOST +32.4%
4. $BIRB +22.2%
5. MARSCOIN +21.4%
Statistics scope: the first effective alert on the day → then the highest price thereafter.
We only record results left by the market; we do not treat historical highest change as trading profit.
#MarketMovers #CryptoData
Full movers data: perppulse.xyz
📊 Today’s Active Movers Ranking
1. $BULLA +64.7%
2. $牛来 +43.1%
3. $IOST +32.4%
4. $BIRB +22.2%
5. MARSCOIN +21.4%
Statistics scope: the first effective alert on the day → then the highest price thereafter.
We only record results left by the market; we do not treat historical highest change as trading profit.
#MarketMovers #CryptoData
Full movers data: perppulse.xyz
1. $BULLA +64.7%
2. $牛来 +43.1%
3. $IOST +32.4%
4. $BIRB +22.2%
5. MARSCOIN +21.4%
Statistics scope: the first effective alert on the day → then the highest price thereafter.
We only record results left by the market; we do not treat historical highest change as trading profit.
#MarketMovers #CryptoData
Full movers data: perppulse.xyz
1
79
·
--
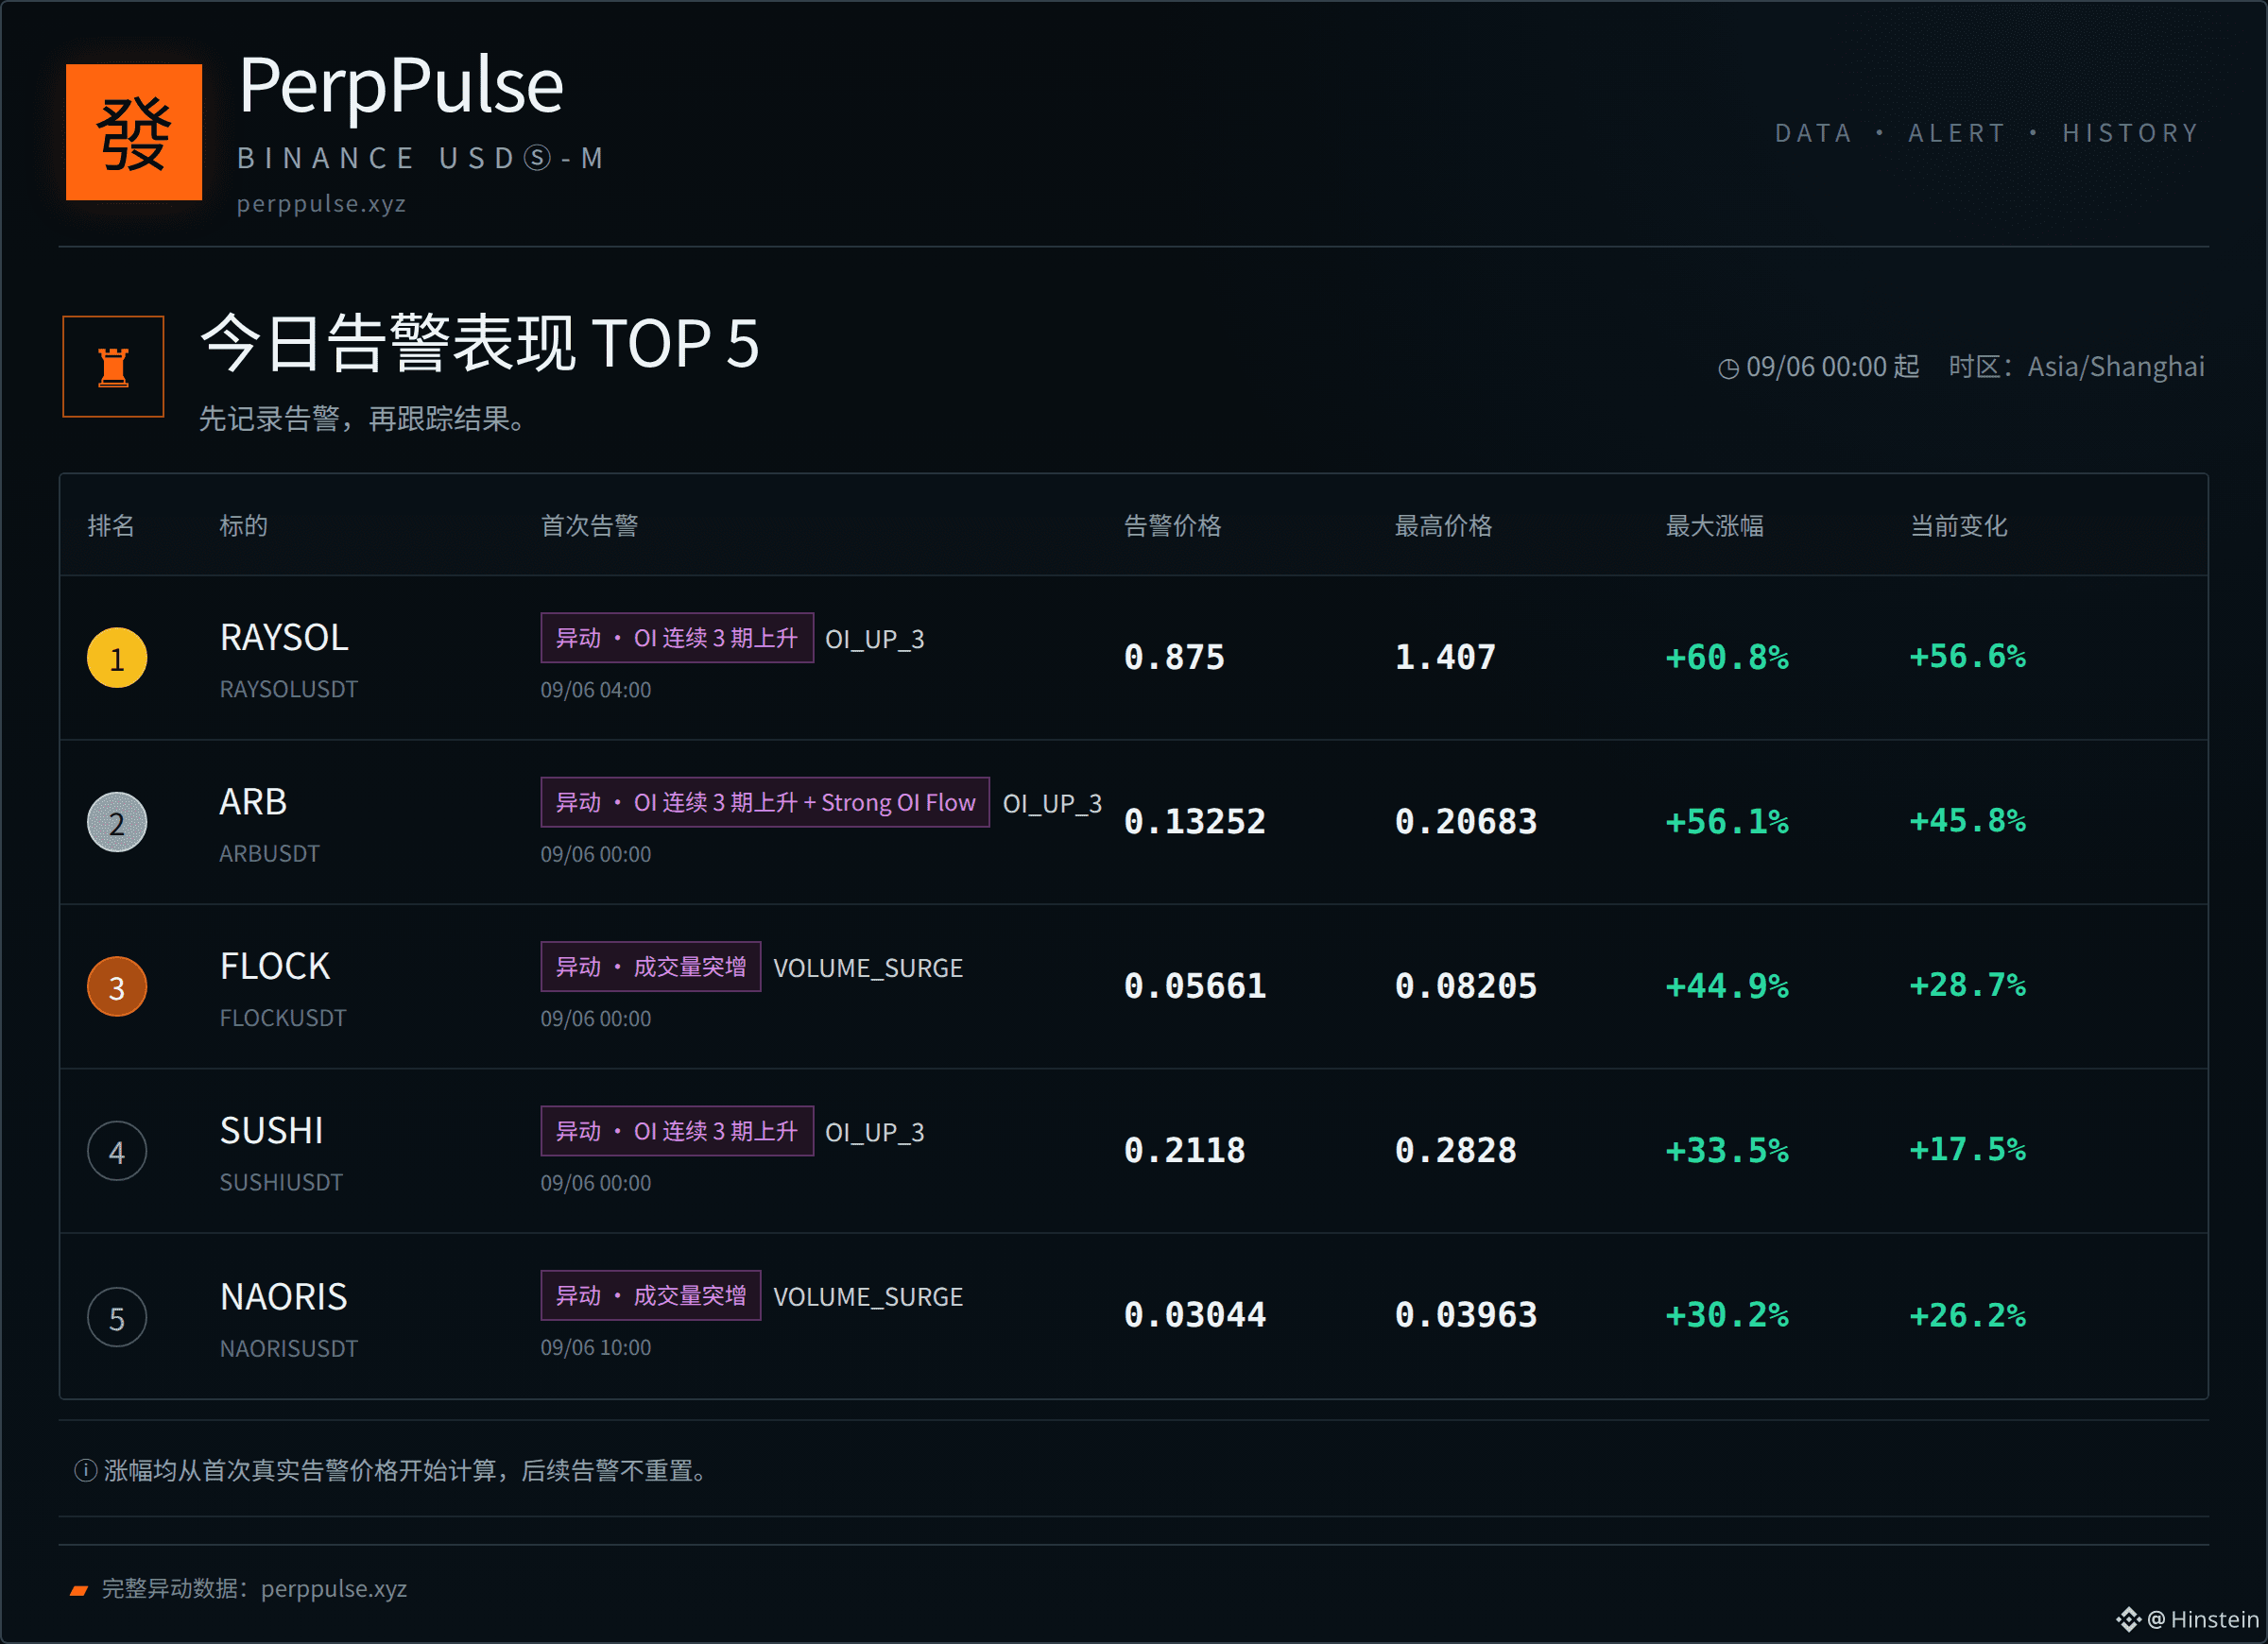
📊 Today's Top Movers
1. $RAYSOL +60.8%
2. $ARB +56.1%
3. $FLOCK +44.9%
4. SUSHI +33.5%
5. NAORIS +30.2%
Statistics basis: from the first valid alert of the day → to the subsequent highest price.
Only the results left by the market are recorded; historical peak changes are not counted as trading returns.
#MarketMovers #CryptoData
Full movement data: perppulse.xyz
📊 Today's Top Movers
1. $RAYSOL +60.8%
2. $ARB +56.1%
3. $FLOCK +44.9%
4. SUSHI +33.5%
5. NAORIS +30.2%
Statistics basis: from the first valid alert of the day → to the subsequent highest price.
Only the results left by the market are recorded; historical peak changes are not counted as trading returns.
#MarketMovers #CryptoData
Full movement data: perppulse.xyz
1. $RAYSOL +60.8%
2. $ARB +56.1%
3. $FLOCK +44.9%
4. SUSHI +33.5%
5. NAORIS +30.2%
Statistics basis: from the first valid alert of the day → to the subsequent highest price.
Only the results left by the market are recorded; historical peak changes are not counted as trading returns.
#MarketMovers #CryptoData
Full movement data: perppulse.xyz
38

·
--
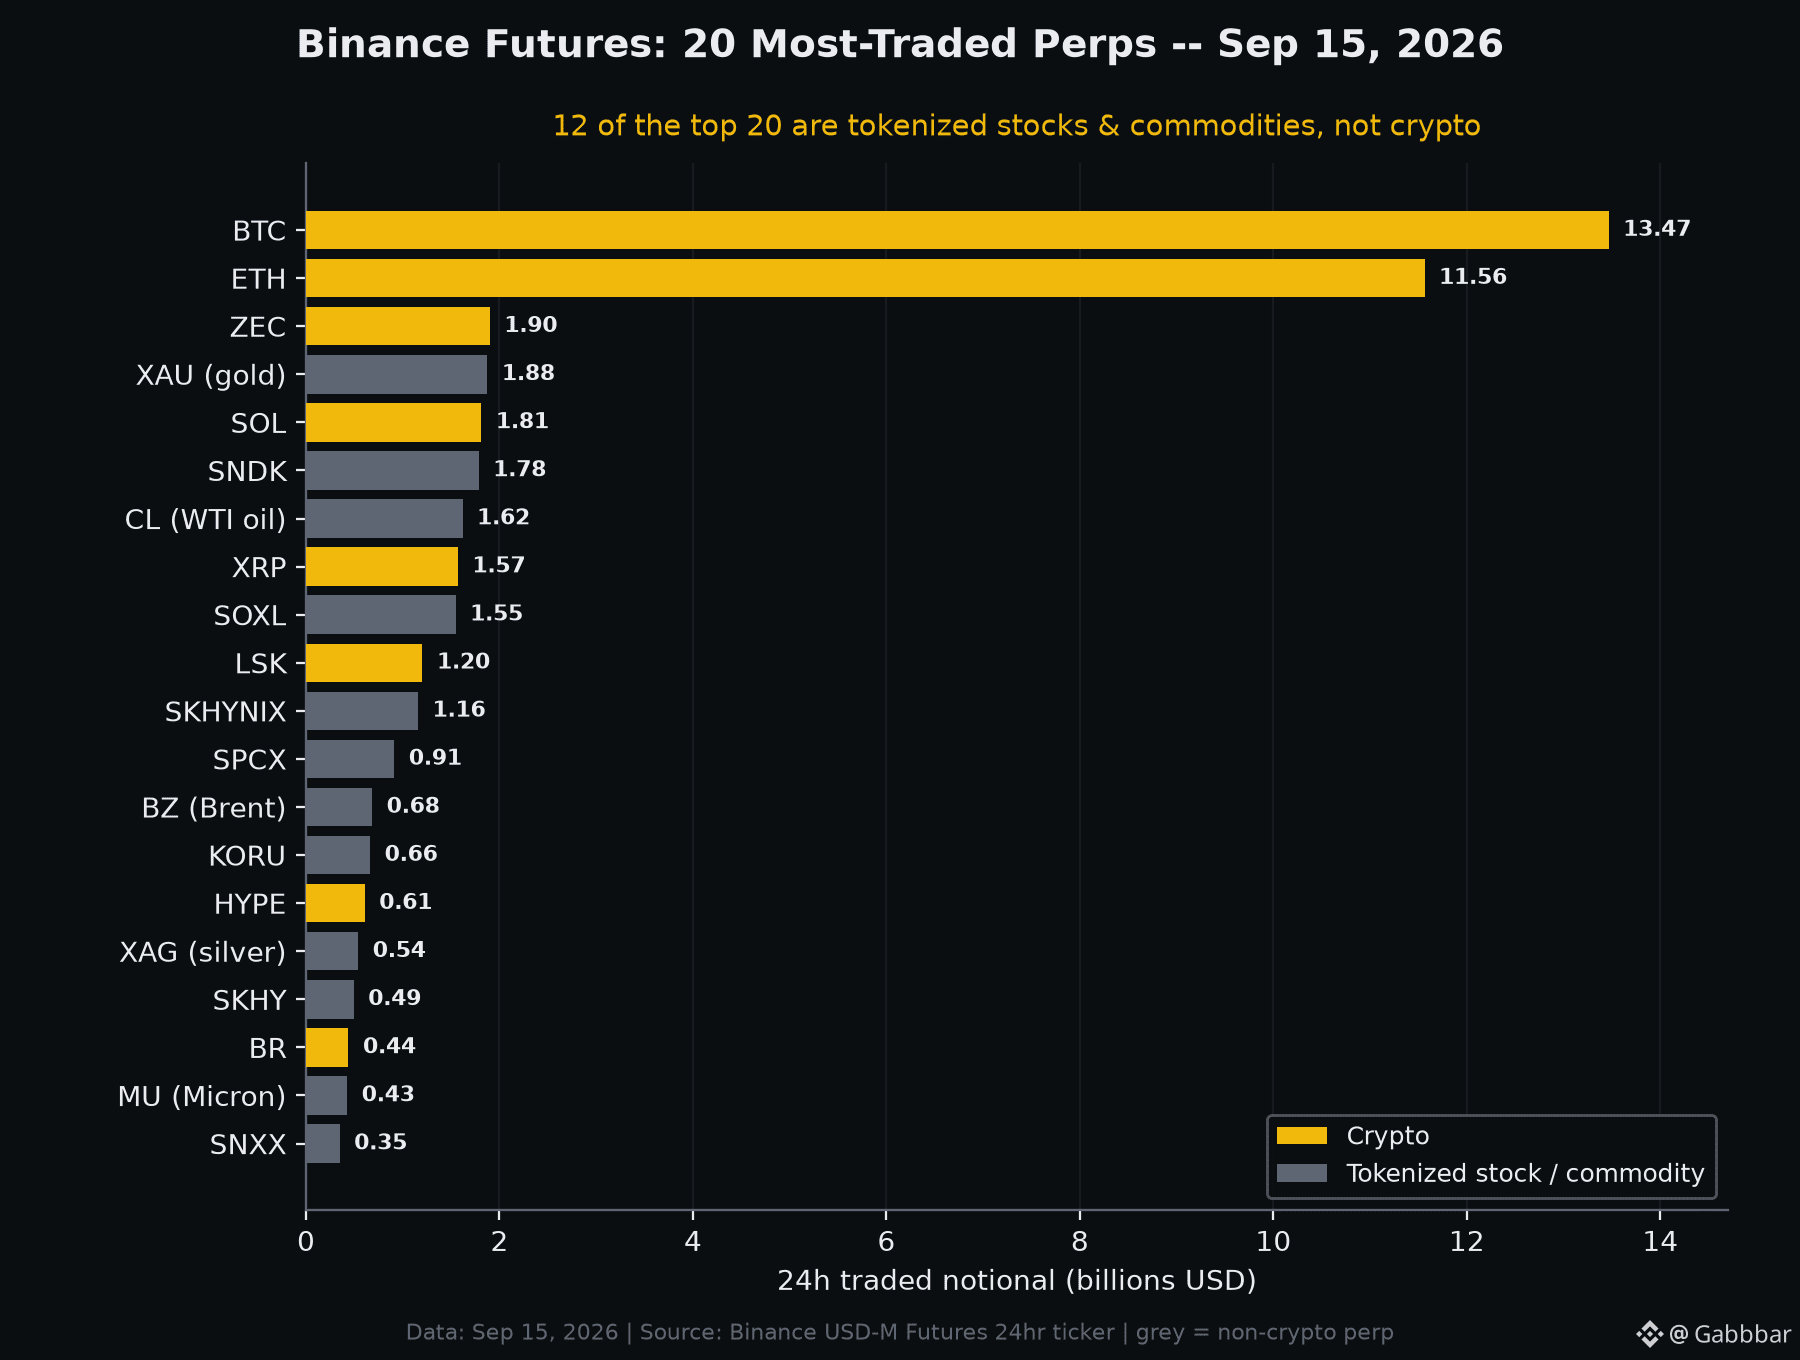
Only 8 of the 20 most-traded contracts on Binance USD-M Futures right now are actually crypto. The other 12 are tokenized stocks and commodities -- gold, oil, and chip names sitting shoulder-to-shoulder with BTC and ETH. Data as of September 15, 2026.
Top 20 Binance perpetual futures by 24h traded notional (USD):
1. BTC - $13.47B
2. ETH - $11.56B
3. ZEC - $1.90B
4. XAU (gold) - $1.88B
5. SOL - $1.81B
6. SNDK (SanDisk) - $1.78B
7. CL (WTI oil) - $1.62B
8. XRP - $1.57B
9. SOXL (semis ETF) - $1.55B
10. LSK - $1.20B
11. SKHYNIX - $1.16B
12. SPCX (SpaceX) - $0.91B
13. BZ (Brent oil) - $0.68B
14. KORU - $0.66B
15. HYPE - $0.61B
16. XAG (silver) - $0.54B
17. SKHY - $0.49B
18. BR - $0.44B
19. MU (Micron) - $0.43B
20. SNXX - $0.35B
A few facts that stand out on Sep 15, 2026:
- Across all 718 USDT-margined perps, 24h traded notional totaled about $56.3B.
- BTC and ETH alone accounted for roughly $25.0B of that -- about 44% of the entire perp market in just two contracts.
- The top 20 names made up about 79% of all perp volume, meaning the remaining ~700 contracts split only a fifth of it.
- Among crypto, ZEC ($1.90B) out-traded SOL and XRP, and LSK still churned $1.20B despite dropping ~47% on the day.
The bigger shift: a crypto derivatives venue where gold, oil and semiconductors trade billions a day next to Bitcoin. When an exchange blends crypto and tokenized TradFi in one book, does the line between 'crypto volume' and 'market volume' still mean much to you?
#BinanceFutures #Perpetuals #CryptoData
Only 8 of the 20 most-traded contracts on Binance USD-M Futures right now are actually crypto. The other 12 are tokenized stocks and commodities -- gold, oil, and chip names sitting shoulder-to-shoulder with BTC and ETH. Data as of September 15, 2026.
Top 20 Binance perpetual futures by 24h traded notional (USD):
1. BTC - $13.47B
2. ETH - $11.56B
3. ZEC - $1.90B
4. XAU (gold) - $1.88B
5. SOL - $1.81B
6. SNDK (SanDisk) - $1.78B
7. CL (WTI oil) - $1.62B
8. XRP - $1.57B
9. SOXL (semis ETF) - $1.55B
10. LSK - $1.20B
11. SKHYNIX - $1.16B
12. SPCX (SpaceX) - $0.91B
13. BZ (Brent oil) - $0.68B
14. KORU - $0.66B
15. HYPE - $0.61B
16. XAG (silver) - $0.54B
17. SKHY - $0.49B
18. BR - $0.44B
19. MU (Micron) - $0.43B
20. SNXX - $0.35B
A few facts that stand out on Sep 15, 2026:
- Across all 718 USDT-margined perps, 24h traded notional totaled about $56.3B.
- BTC and ETH alone accounted for roughly $25.0B of that -- about 44% of the entire perp market in just two contracts.
- The top 20 names made up about 79% of all perp volume, meaning the remaining ~700 contracts split only a fifth of it.
- Among crypto, ZEC ($1.90B) out-traded SOL and XRP, and LSK still churned $1.20B despite dropping ~47% on the day.
The bigger shift: a crypto derivatives venue where gold, oil and semiconductors trade billions a day next to Bitcoin. When an exchange blends crypto and tokenized TradFi in one book, does the line between 'crypto volume' and 'market volume' still mean much to you?
#BinanceFutures #Perpetuals #CryptoData
Top 20 Binance perpetual futures by 24h traded notional (USD):
1. BTC - $13.47B
2. ETH - $11.56B
3. ZEC - $1.90B
4. XAU (gold) - $1.88B
5. SOL - $1.81B
6. SNDK (SanDisk) - $1.78B
7. CL (WTI oil) - $1.62B
8. XRP - $1.57B
9. SOXL (semis ETF) - $1.55B
10. LSK - $1.20B
11. SKHYNIX - $1.16B
12. SPCX (SpaceX) - $0.91B
13. BZ (Brent oil) - $0.68B
14. KORU - $0.66B
15. HYPE - $0.61B
16. XAG (silver) - $0.54B
17. SKHY - $0.49B
18. BR - $0.44B
19. MU (Micron) - $0.43B
20. SNXX - $0.35B
A few facts that stand out on Sep 15, 2026:
- Across all 718 USDT-margined perps, 24h traded notional totaled about $56.3B.
- BTC and ETH alone accounted for roughly $25.0B of that -- about 44% of the entire perp market in just two contracts.
- The top 20 names made up about 79% of all perp volume, meaning the remaining ~700 contracts split only a fifth of it.
- Among crypto, ZEC ($1.90B) out-traded SOL and XRP, and LSK still churned $1.20B despite dropping ~47% on the day.
The bigger shift: a crypto derivatives venue where gold, oil and semiconductors trade billions a day next to Bitcoin. When an exchange blends crypto and tokenized TradFi in one book, does the line between 'crypto volume' and 'market volume' still mean much to you?
#BinanceFutures #Perpetuals #CryptoData
285

One “market cap” number can tell two different stories.
At 18:56 ICT, CoinMarketCap showed total crypto capitalization near $2.16T and slightly lower over 24 hours, while CoinGecko showed about $2.22T and a 1.1% increase. That gap does not automatically mean one feed is wrong: providers may track different asset universes, circulating-supply estimates, venue inputs, and update times.
Practical takeaway: never treat an aggregator’s headline as ground truth in isolation. Use the same provider consistently for comparisons, timestamp every snapshot, and cross-check large discrepancies before building a market narrative.
#CryptoData #MarketLesson
One “market cap” number can tell two different stories.
At 18:56 ICT, CoinMarketCap showed total crypto capitalization near $2.16T and slightly lower over 24 hours, while CoinGecko showed about $2.22T and a 1.1% increase. That gap does not automatically mean one feed is wrong: providers may track different asset universes, circulating-supply estimates, venue inputs, and update times.
Practical takeaway: never treat an aggregator’s headline as ground truth in isolation. Use the same provider consistently for comparisons, timestamp every snapshot, and cross-check large discrepancies before building a market narrative.
#CryptoData #MarketLesson
At 18:56 ICT, CoinMarketCap showed total crypto capitalization near $2.16T and slightly lower over 24 hours, while CoinGecko showed about $2.22T and a 1.1% increase. That gap does not automatically mean one feed is wrong: providers may track different asset universes, circulating-supply estimates, venue inputs, and update times.
Practical takeaway: never treat an aggregator’s headline as ground truth in isolation. Use the same provider consistently for comparisons, timestamp every snapshot, and cross-check large discrepancies before building a market narrative.
#CryptoData #MarketLesson
29

📊 BTC DERIVATIVES ACTIVITY IS STILL HUGE
Bitcoin futures Open Interest is currently around $54B, according to CoinGlass.
That tells us one thing clearly:
There is still a lot of capital positioned in the derivatives market.
But remember:
High Open Interest ≠ automatically bullish.
You need to look at: • Price
• OI
• Funding
• Liquidations
• Volume
That's why derivatives data can add important context to the BTC chart.
$BTC
#Bitcoin #CoinGlass #CryptoData $BTC
{spot}(BTCUSDT)
📊 BTC DERIVATIVES ACTIVITY IS STILL HUGE
Bitcoin futures Open Interest is currently around $54B, according to CoinGlass.
That tells us one thing clearly:
There is still a lot of capital positioned in the derivatives market.
But remember:
High Open Interest ≠ automatically bullish.
You need to look at: • Price
• OI
• Funding
• Liquidations
• Volume
That's why derivatives data can add important context to the BTC chart.
$BTC
#Bitcoin #CoinGlass #CryptoData $BTC
Bitcoin futures Open Interest is currently around $54B, according to CoinGlass.
That tells us one thing clearly:
There is still a lot of capital positioned in the derivatives market.
But remember:
High Open Interest ≠ automatically bullish.
You need to look at: • Price
• OI
• Funding
• Liquidations
• Volume
That's why derivatives data can add important context to the BTC chart.
$BTC
#Bitcoin #CoinGlass #CryptoData $BTC
186
·
--
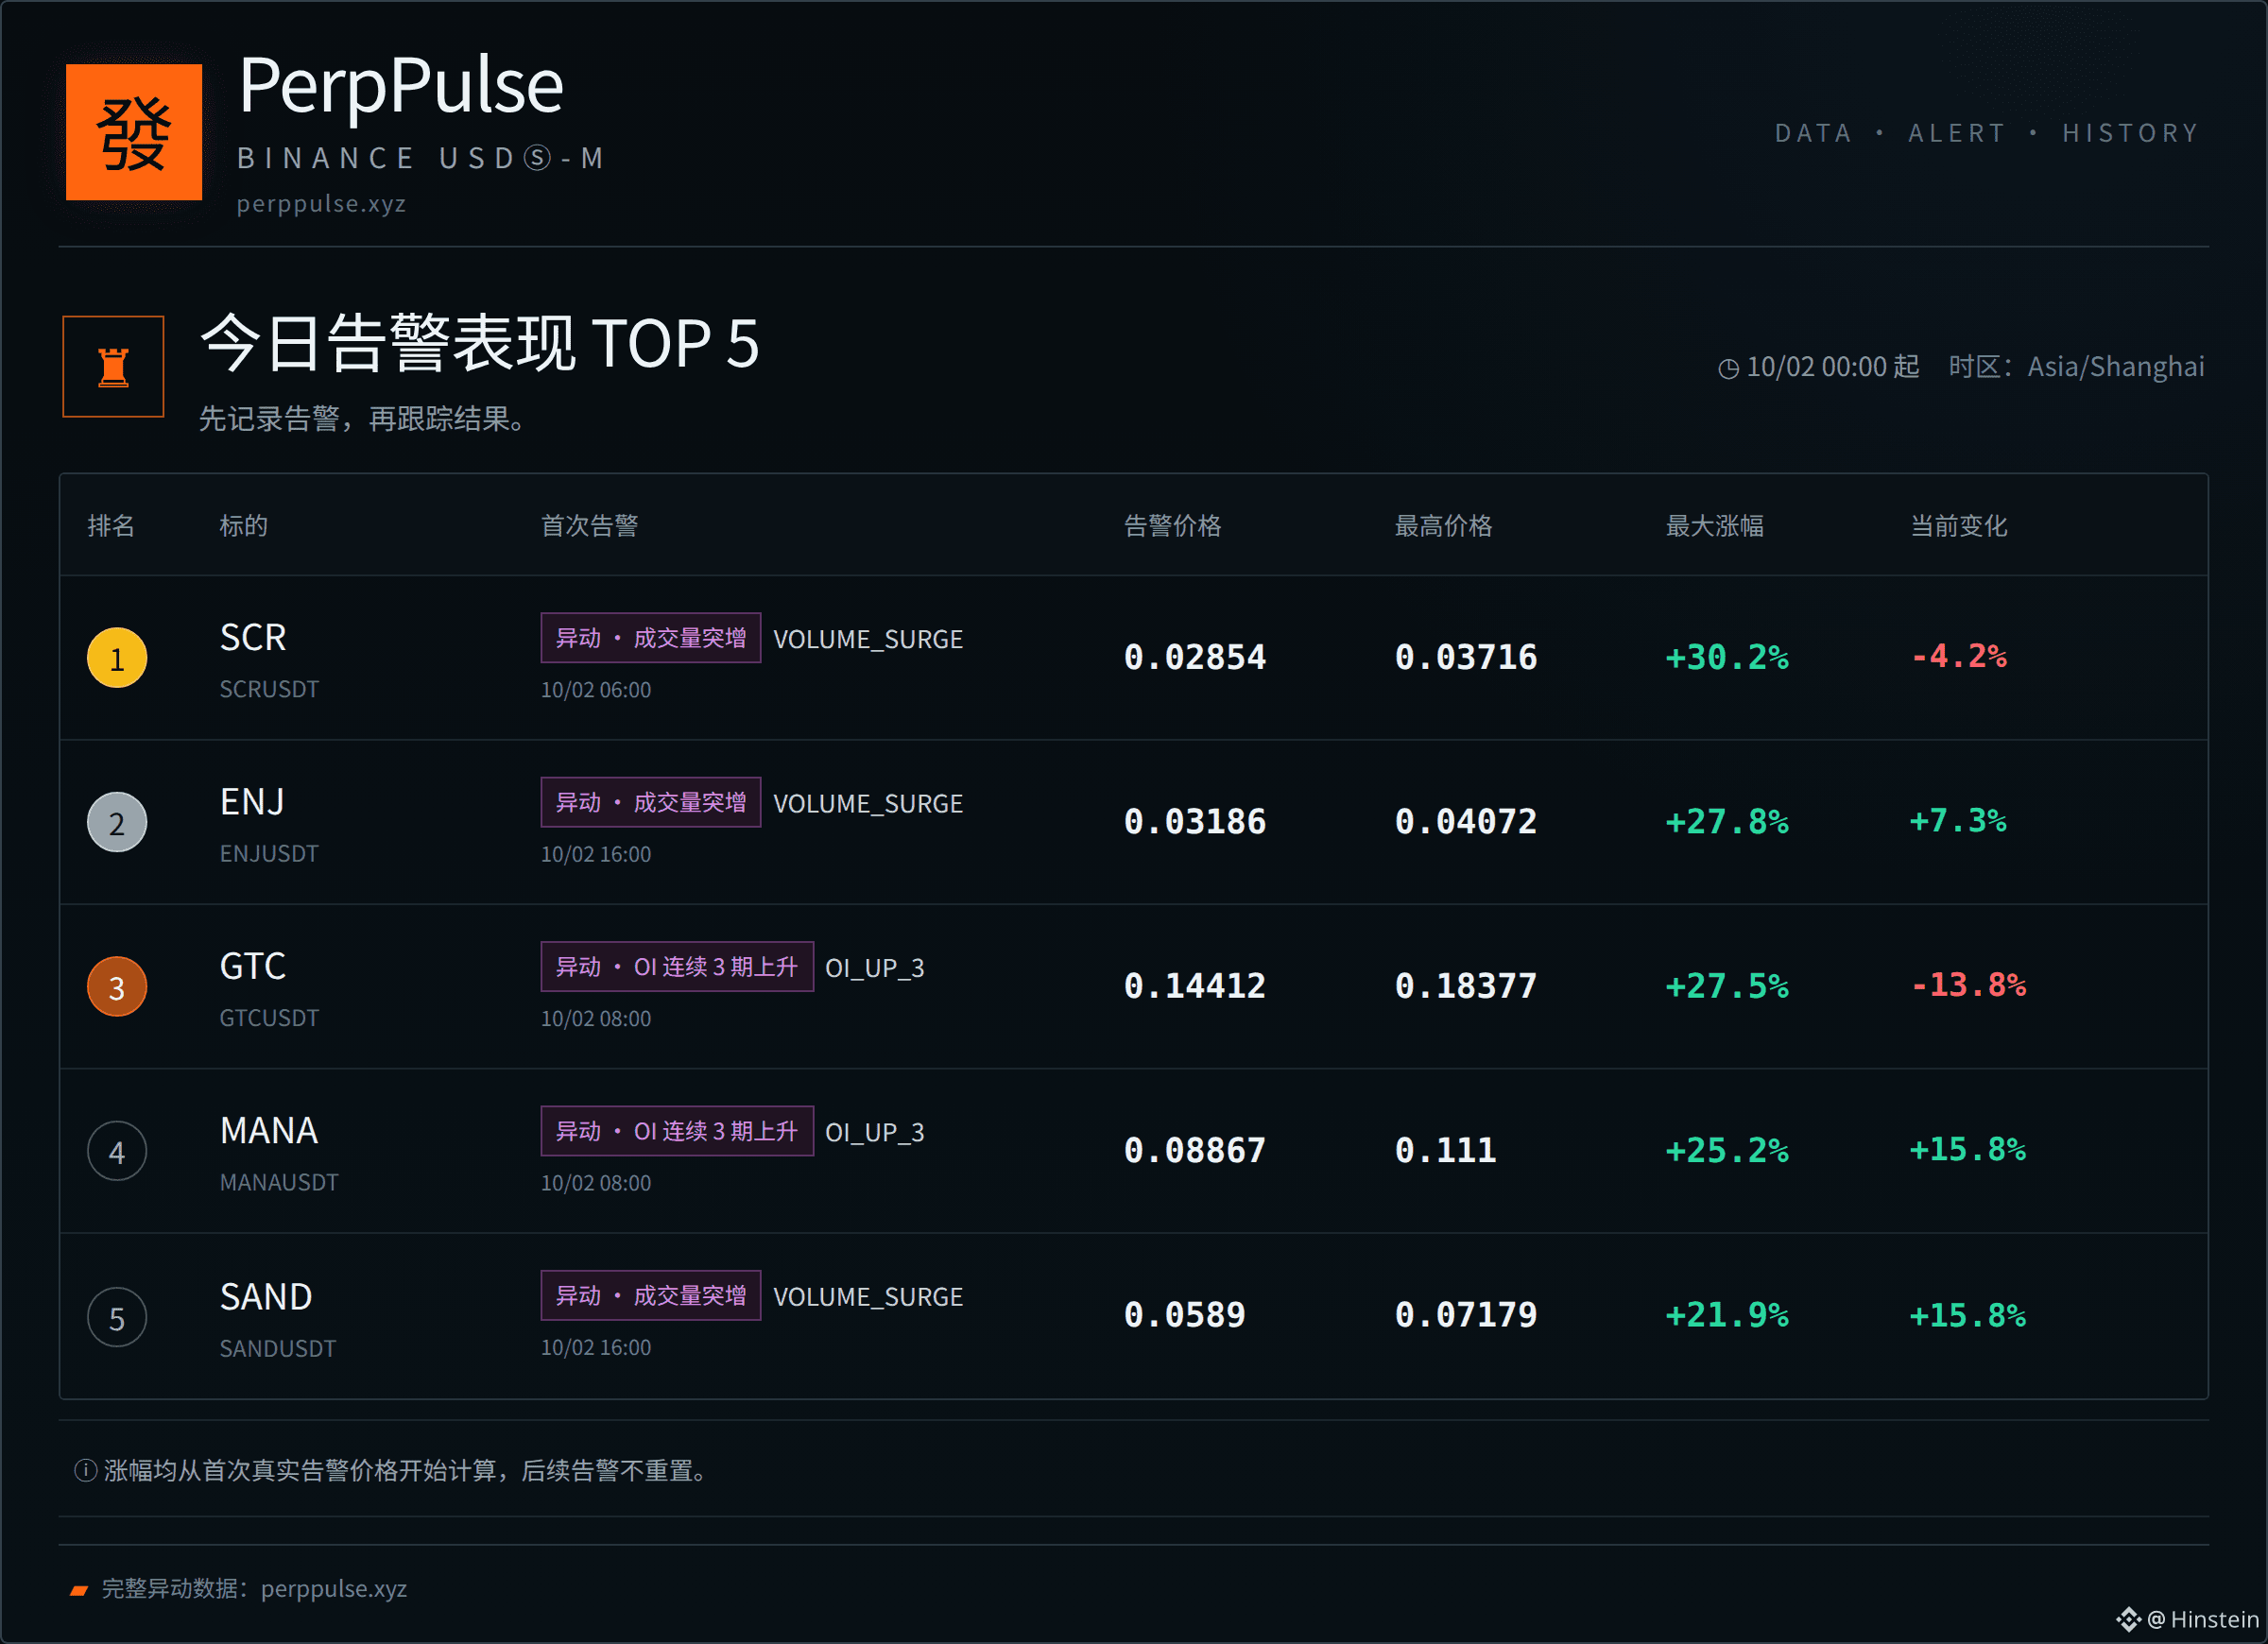
📊 Today’s Moving Figures Ranking
1. $SCR +30.2%
2. $ENJ +27.8%
3. $GTC +27.5%
4. MANA +25.2%
5. SAND +21.9%
Statistics definition: first effective alert of the day → then the highest price afterward.
Only records results left in the market; it does not treat past all-time changes as trading gains.
#MarketMovers #CryptoData
Full moving data: perppulse.xyz
📊 Today’s Moving Figures Ranking
1. $SCR +30.2%
2. $ENJ +27.8%
3. $GTC +27.5%
4. MANA +25.2%
5. SAND +21.9%
Statistics definition: first effective alert of the day → then the highest price afterward.
Only records results left in the market; it does not treat past all-time changes as trading gains.
#MarketMovers #CryptoData
Full moving data: perppulse.xyz
1. $SCR +30.2%
2. $ENJ +27.8%
3. $GTC +27.5%
4. MANA +25.2%
5. SAND +21.9%
Statistics definition: first effective alert of the day → then the highest price afterward.
Only records results left in the market; it does not treat past all-time changes as trading gains.
#MarketMovers #CryptoData
Full moving data: perppulse.xyz
27
·
--
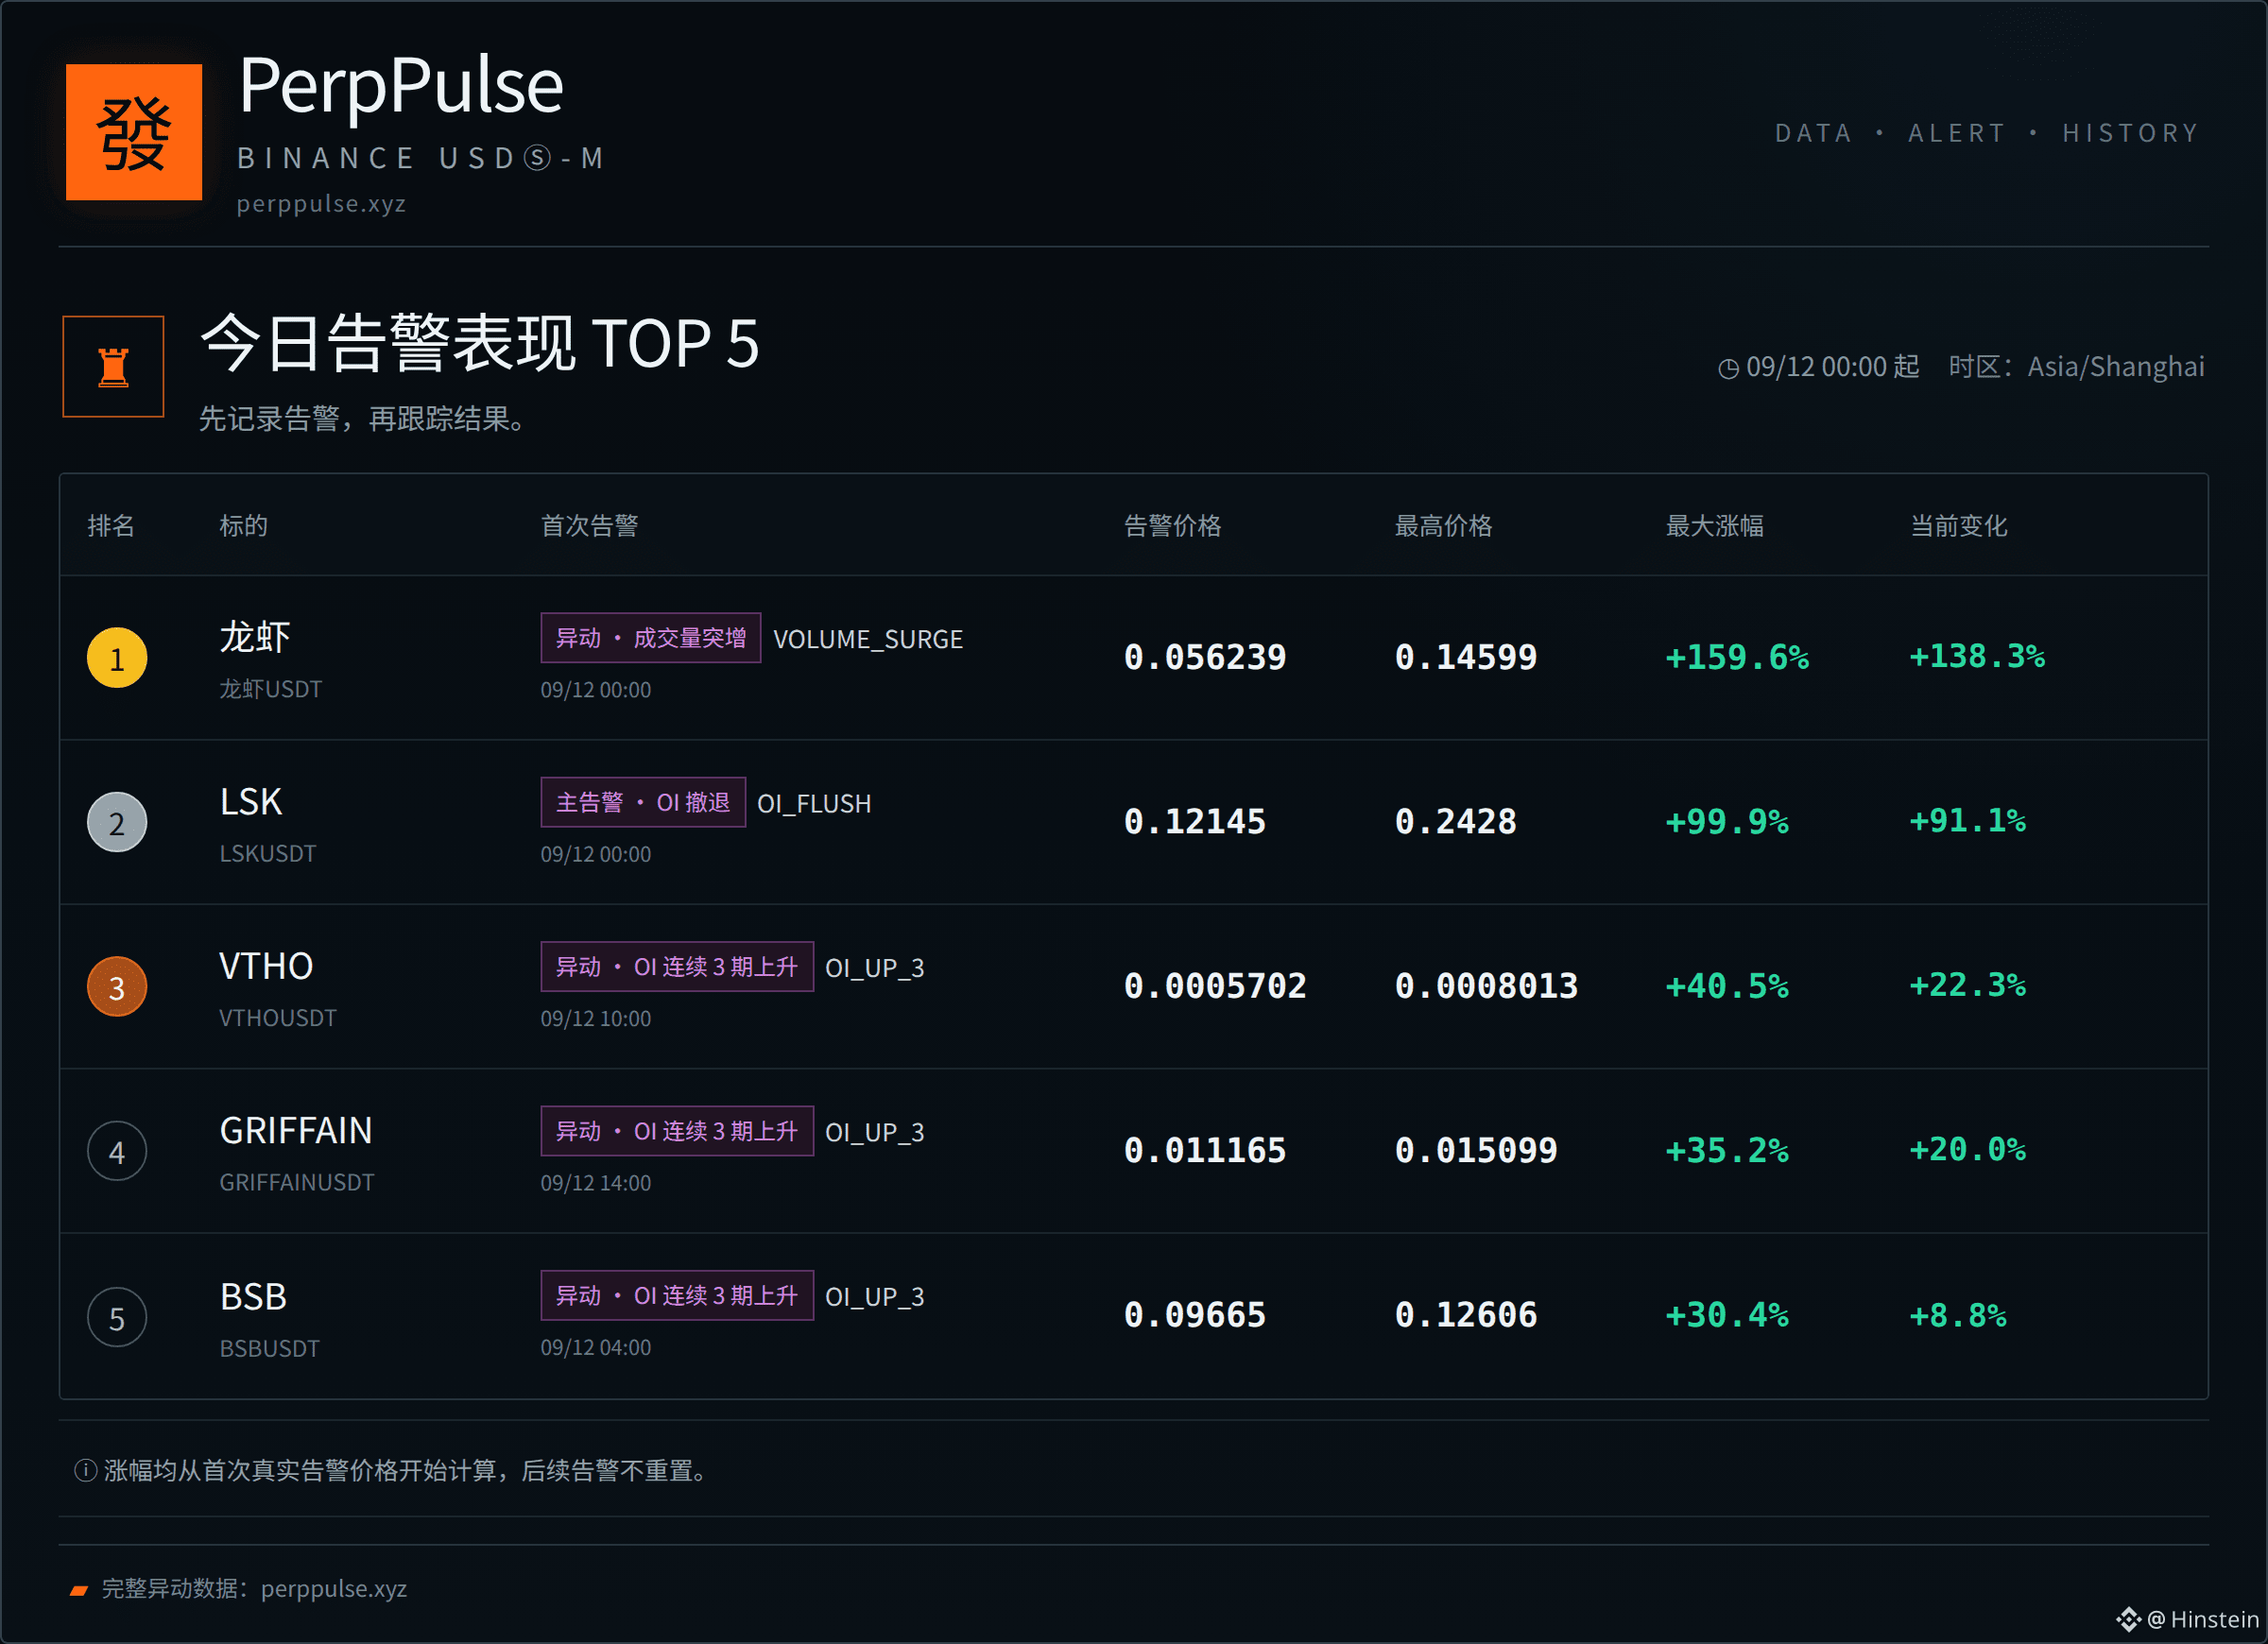
📊 Today’s Movers Ranking
1. $Lobster +159.6%
2. $LSK +99.9%
3. $VTHO +40.5%
4. $GRIFFAIN +35.2%
5. BSB +30.4%
Statistics criteria: first valid alert on the day → then the highest price thereafter.
We only record results left in the market; we do not treat historical all-time changes as trading profit.
#MarketMovers #CryptoData
Full movers data: perppulse.xyz
📊 Today’s Movers Ranking
1. $Lobster +159.6%
2. $LSK +99.9%
3. $VTHO +40.5%
4. $GRIFFAIN +35.2%
5. BSB +30.4%
Statistics criteria: first valid alert on the day → then the highest price thereafter.
We only record results left in the market; we do not treat historical all-time changes as trading profit.
#MarketMovers #CryptoData
Full movers data: perppulse.xyz
1. $Lobster +159.6%
2. $LSK +99.9%
3. $VTHO +40.5%
4. $GRIFFAIN +35.2%
5. BSB +30.4%
Statistics criteria: first valid alert on the day → then the highest price thereafter.
We only record results left in the market; we do not treat historical all-time changes as trading profit.
#MarketMovers #CryptoData
Full movers data: perppulse.xyz
73
·
--
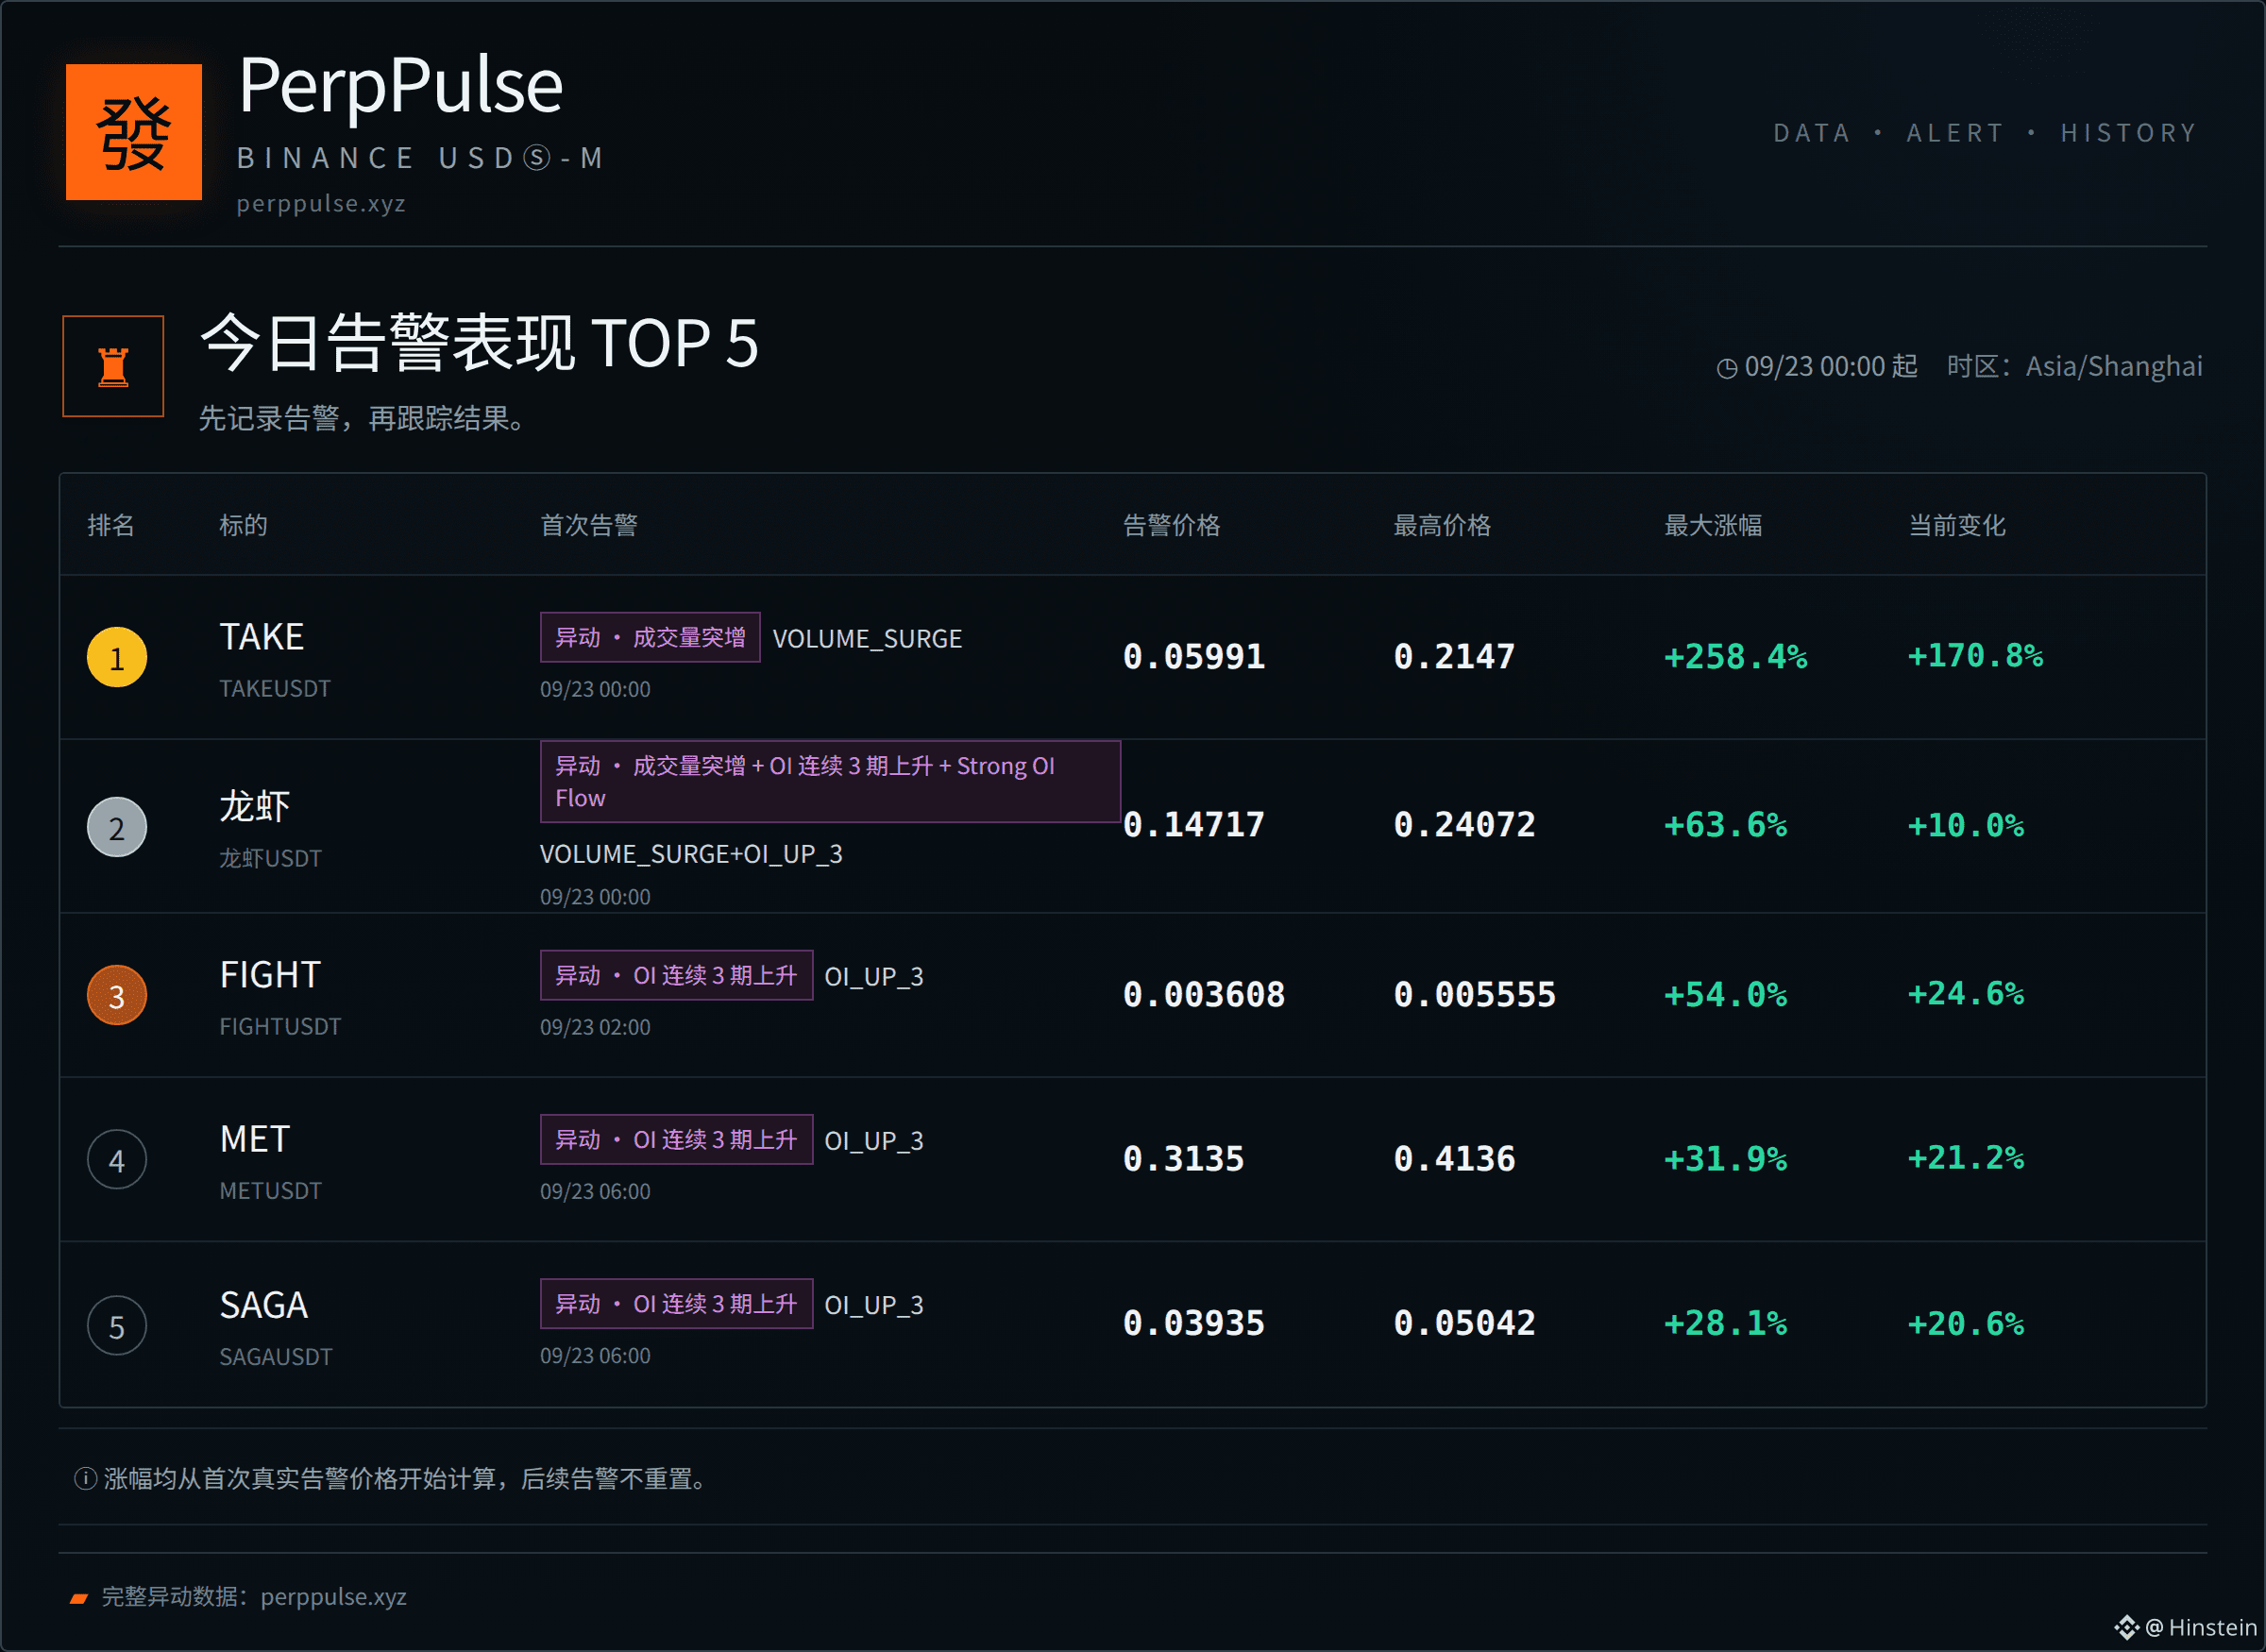
📊 Today's Volatility Performance Rankings
1. $TAKE +258.4%
2. $Lobster +63.6%
3. $FIGHT +54.0%
4. $MET +31.9%
5. SAGA +28.1%
Statistics 기준: First valid alert on the day → highest price thereafter.
Only records results left in the market; it does not treat historical highest change as trading profit.
#MarketMovers #CryptoData
Complete volatility data: perppulse.xyz
📊 Today's Volatility Performance Rankings
1. $TAKE +258.4%
2. $Lobster +63.6%
3. $FIGHT +54.0%
4. $MET +31.9%
5. SAGA +28.1%
Statistics 기준: First valid alert on the day → highest price thereafter.
Only records results left in the market; it does not treat historical highest change as trading profit.
#MarketMovers #CryptoData
Complete volatility data: perppulse.xyz
1. $TAKE +258.4%
2. $Lobster +63.6%
3. $FIGHT +54.0%
4. $MET +31.9%
5. SAGA +28.1%
Statistics 기준: First valid alert on the day → highest price thereafter.
Only records results left in the market; it does not treat historical highest change as trading profit.
#MarketMovers #CryptoData
Complete volatility data: perppulse.xyz
56
Log in to explore more content
Join global crypto users on Binance Square
⚡️ Get latest and useful information about crypto.
💬 Trusted by the world’s largest crypto exchange.
👍 Discover real insights from verified creators.
Email / Phone number
Trending Topics
1
#BinanceReopensWithdrawalsForMoreAssets
606,340 views
2,890 Discussing
2
#BTCRebounds80K
124,600 views
1,216 Discussing
3
#Binance98PercentReplenished
65,385 views
843 Discussing
4
#ADPUSPrivateEmployersAdd86000JobsInOctober
6,332 views
104 Discussing
5
#USMidterms-WhatAreMarketsExpecting?
431,707 views
2,338 Discussing
6
#USOctoberNFP-AreRateCutsStillPossible
438,548 views
3,048 Discussing
7
#TRUMPFalls18.1%In24HoursToRecordLow
5,633 views
65 Discussing
8
#USClearsSingleStockPerpetualFutures
5,815 views
109 Discussing
9
#GrayscaleSaysJPMorganAddsBitcoinTo2027LongTermAssumptions
131 views
4 Discussing
10
#HongKongPlansGoldTokensTiedTo400OunceBars
602 views
5 Discussing