
#ppi
ppi
40.7M views
211,390 Discussing
Hot
Latest


Verified
🚨TODAY COULD BE A VERY BAD DAY FOR BITCOIN HOLDERS!🚨
Okay, so Bitcoin is already struggling, people are panicking, and just when everyone thinks things can't get worse… we have another big event TODAY. 😂
🇺🇸 US PPI INFLATION DATA — NOVEMBER 13
⏰ 8:30 AM ET | 13:30 UTC
And here's what makes me a little nervous…
The last PPI report was already pretty ugly.
Inflation jumped 1.3% in a single month, with annual producer inflation reaching 6.3%.
Now imagine today's numbers coming in hotter than expected.
The market could start worrying about interest rates all over again. And seriously, that's the last thing Bitcoin needs right now. 😂
But what if inflation comes in cooler?
Well, we might finally get that relief bounce everyone has been desperately waiting for.
There's just one thing bothering me…
I've seen this movie before.
BTC pumps right after the news, everyone starts celebrating, late longs jump in… and suddenly the entire move reverses.
Or the exact opposite happens.
So please, don't let one economic report wipe out everything you've made this week.
I've got my eyes on today's release. Things could get interesting. 👀
Now tell me…
Are we getting another nasty dump today, or will Bitcoin finally surprise everyone with a recovery?
$BTC $SOL $ETH
{future}(ETHUSDT)
{future}(SOLUSDT)
{future}(BTCUSDT)
#PPI
🚨TODAY COULD BE A VERY BAD DAY FOR BITCOIN HOLDERS!🚨
Okay, so Bitcoin is already struggling, people are panicking, and just when everyone thinks things can't get worse… we have another big event TODAY. 😂
🇺🇸 US PPI INFLATION DATA — NOVEMBER 13
⏰ 8:30 AM ET | 13:30 UTC
And here's what makes me a little nervous…
The last PPI report was already pretty ugly.
Inflation jumped 1.3% in a single month, with annual producer inflation reaching 6.3%.
Now imagine today's numbers coming in hotter than expected.
The market could start worrying about interest rates all over again. And seriously, that's the last thing Bitcoin needs right now. 😂
But what if inflation comes in cooler?
Well, we might finally get that relief bounce everyone has been desperately waiting for.
There's just one thing bothering me…
I've seen this movie before.
BTC pumps right after the news, everyone starts celebrating, late longs jump in… and suddenly the entire move reverses.
Or the exact opposite happens.
So please, don't let one economic report wipe out everything you've made this week.
I've got my eyes on today's release. Things could get interesting. 👀
Now tell me…
Are we getting another nasty dump today, or will Bitcoin finally surprise everyone with a recovery?
$BTC $SOL $ETH
#PPI
Okay, so Bitcoin is already struggling, people are panicking, and just when everyone thinks things can't get worse… we have another big event TODAY. 😂
🇺🇸 US PPI INFLATION DATA — NOVEMBER 13
⏰ 8:30 AM ET | 13:30 UTC
And here's what makes me a little nervous…
The last PPI report was already pretty ugly.
Inflation jumped 1.3% in a single month, with annual producer inflation reaching 6.3%.
Now imagine today's numbers coming in hotter than expected.
The market could start worrying about interest rates all over again. And seriously, that's the last thing Bitcoin needs right now. 😂
But what if inflation comes in cooler?
Well, we might finally get that relief bounce everyone has been desperately waiting for.
There's just one thing bothering me…
I've seen this movie before.
BTC pumps right after the news, everyone starts celebrating, late longs jump in… and suddenly the entire move reverses.
Or the exact opposite happens.
So please, don't let one economic report wipe out everything you've made this week.
I've got my eyes on today's release. Things could get interesting. 👀
Now tell me…
Are we getting another nasty dump today, or will Bitcoin finally surprise everyone with a recovery?
$BTC $SOL $ETH
#PPI
Feed-Creator-30457864c:
Don't worry it will dump again start your short follow my signal
6
24
8.2k

𝐒𝐓𝐎𝐏..... 𝐒𝐓𝐎𝐏..... 𝐒𝐓𝐎𝐏 🚨
$BTC 🇺🇸 U.S. PPI INFLATION DATA DROPS TODAY AT 8:30 AM ET!
Markets are watching closely as October's Producer Price Index (PPI) data is released.
📊 PPI (YoY):
- Previous: 6.3%
- Forecast: 6.6%
📊 PPI (MoM):
- Previous: 1.3%
- Forecast: 0.4%
🔥 What to expect?
🔴 Above 6.6%: Higher-than-expected inflation could pressure BTC and risk assets.
🟡 At 6.6%: Markets may see a mixed reaction.
🟢 Below 6.6%: Cooler inflation could support a relief rally.
⚠️ Watch the actual numbers, especially Core PPI. Market reaction will also depend on positioning and expectations.
Stay alert. Volatility could hit crypto markets!
#PPI #FedWatch #Fed $XAU
𝐒𝐓𝐎𝐏..... 𝐒𝐓𝐎𝐏..... 𝐒𝐓𝐎𝐏 🚨
$BTC 🇺🇸 U.S. PPI INFLATION DATA DROPS TODAY AT 8:30 AM ET!
Markets are watching closely as October's Producer Price Index (PPI) data is released.
📊 PPI (YoY):
- Previous: 6.3%
- Forecast: 6.6%
📊 PPI (MoM):
- Previous: 1.3%
- Forecast: 0.4%
🔥 What to expect?
🔴 Above 6.6%: Higher-than-expected inflation could pressure BTC and risk assets.
🟡 At 6.6%: Markets may see a mixed reaction.
🟢 Below 6.6%: Cooler inflation could support a relief rally.
⚠️ Watch the actual numbers, especially Core PPI. Market reaction will also depend on positioning and expectations.
Stay alert. Volatility could hit crypto markets!
#PPI #FedWatch #Fed $XAU
$BTC 🇺🇸 U.S. PPI INFLATION DATA DROPS TODAY AT 8:30 AM ET!
Markets are watching closely as October's Producer Price Index (PPI) data is released.
📊 PPI (YoY):
- Previous: 6.3%
- Forecast: 6.6%
📊 PPI (MoM):
- Previous: 1.3%
- Forecast: 0.4%
🔥 What to expect?
🔴 Above 6.6%: Higher-than-expected inflation could pressure BTC and risk assets.
🟡 At 6.6%: Markets may see a mixed reaction.
🟢 Below 6.6%: Cooler inflation could support a relief rally.
⚠️ Watch the actual numbers, especially Core PPI. Market reaction will also depend on positioning and expectations.
Stay alert. Volatility could hit crypto markets!
#PPI #FedWatch #Fed $XAU

1
1
1.1k

·
--
🚨US Inflation Alert: Gold & Bitcoin Face Another Key Test!
In less than 30 minutes, the US will release two important inflation reports:
Core PPI: 0.3% expected (Previous: 0.7%)
PPI: 0.4% expected (Previous: 1.3%)
Following stronger-than-expected US employment data and this week's hotter CPI, today's PPI could influence Fed rate expectations and trigger volatility in Gold, Bitcoin, and DXY.
Based on recent economic data and analysts' forecasts, I expect both readings to come in close to expectations, although the risk of an upside inflation surprise remains.
Higher-than-expected PPI could strengthen DXY and pressure Gold and Bitcoin. Softer readings could weaken the dollar and support a short-term rebound.
With Middle East geopolitical tensions and weekend risks still in focus, please manage your positions carefully.
#PPI
🚨US Inflation Alert: Gold & Bitcoin Face Another Key Test!
In less than 30 minutes, the US will release two important inflation reports:
Core PPI: 0.3% expected (Previous: 0.7%)
PPI: 0.4% expected (Previous: 1.3%)
Following stronger-than-expected US employment data and this week's hotter CPI, today's PPI could influence Fed rate expectations and trigger volatility in Gold, Bitcoin, and DXY.
Based on recent economic data and analysts' forecasts, I expect both readings to come in close to expectations, although the risk of an upside inflation surprise remains.
Higher-than-expected PPI could strengthen DXY and pressure Gold and Bitcoin. Softer readings could weaken the dollar and support a short-term rebound.
With Middle East geopolitical tensions and weekend risks still in focus, please manage your positions carefully.
#PPI
In less than 30 minutes, the US will release two important inflation reports:
Core PPI: 0.3% expected (Previous: 0.7%)
PPI: 0.4% expected (Previous: 1.3%)
Following stronger-than-expected US employment data and this week's hotter CPI, today's PPI could influence Fed rate expectations and trigger volatility in Gold, Bitcoin, and DXY.
Based on recent economic data and analysts' forecasts, I expect both readings to come in close to expectations, although the risk of an upside inflation surprise remains.
Higher-than-expected PPI could strengthen DXY and pressure Gold and Bitcoin. Softer readings could weaken the dollar and support a short-term rebound.
With Middle East geopolitical tensions and weekend risks still in focus, please manage your positions carefully.
#PPI

3
459

·
--
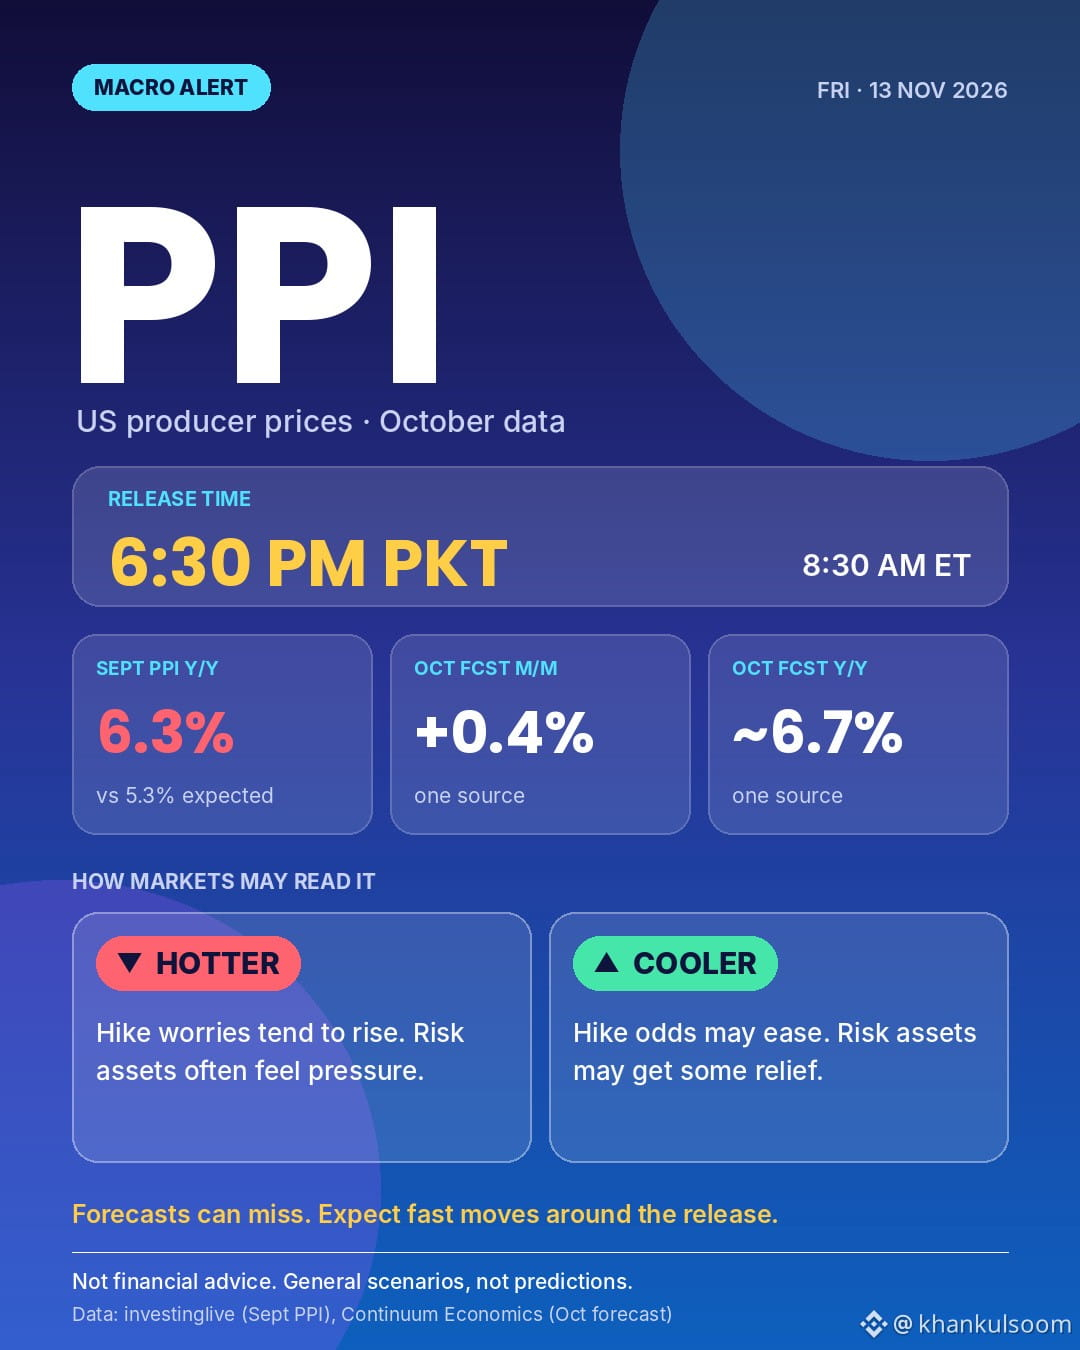
PPI DAY: US PRODUCER PRICES DROP AT 6:30 PM PKT
The US October PPI (producer prices) is due at 8:30 AM ET, which is 6:30 PM PKT.
Last month it came in hot: September PPI was 6.3% year-on-year vs 5.3% expected.
One forecast for October: about +0.4% month-on-month and ~6.7% year-on-year.
How markets may read it:
🔻 Hotter than expected: rate-hike worries tend to rise, and risk assets like $BTC often feel the pressure.
🔺 Cooler than expected: hike odds may ease, giving risk assets some relief.
Forecasts can miss, so expect fast moves around the release.
Hot or cool, what’s your guess?
🔥 Hotter
❄️ Cooler
🎯 In line
#PPI #bitcoin #Inflation #WhatWillDriveCryptoandStocks’NextRebound?
PPI DAY: US PRODUCER PRICES DROP AT 6:30 PM PKT
The US October PPI (producer prices) is due at 8:30 AM ET, which is 6:30 PM PKT.
Last month it came in hot: September PPI was 6.3% year-on-year vs 5.3% expected.
One forecast for October: about +0.4% month-on-month and ~6.7% year-on-year.
How markets may read it:
🔻 Hotter than expected: rate-hike worries tend to rise, and risk assets like $BTC often feel the pressure.
🔺 Cooler than expected: hike odds may ease, giving risk assets some relief.
Forecasts can miss, so expect fast moves around the release.
Hot or cool, what’s your guess?
🔥 Hotter
❄️ Cooler
🎯 In line
#PPI #bitcoin #Inflation #WhatWillDriveCryptoandStocks’NextRebound?
The US October PPI (producer prices) is due at 8:30 AM ET, which is 6:30 PM PKT.
Last month it came in hot: September PPI was 6.3% year-on-year vs 5.3% expected.
One forecast for October: about +0.4% month-on-month and ~6.7% year-on-year.
How markets may read it:
🔻 Hotter than expected: rate-hike worries tend to rise, and risk assets like $BTC often feel the pressure.
🔺 Cooler than expected: hike odds may ease, giving risk assets some relief.
Forecasts can miss, so expect fast moves around the release.
Hot or cool, what’s your guess?
🔥 Hotter
❄️ Cooler
🎯 In line
#PPI #bitcoin #Inflation #WhatWillDriveCryptoandStocks’NextRebound?
16

·
--
US PPI Lands in 1 Hour — The Last Inflation Test Before the Fed December Hike
October PPI drops at 8:30 AM ET (13:30 UTC). Economists expect +0.4% MoM and +6.6% YoY — the highest annual rate since 2022. Core PPI seen at +0.3% MoM.
It follows Tuesday hot CPI (+0.4%) that pushed December hike odds to ~90%, with a 14.5% chance of a 50bp move. Bitcoin is already below $70,000 and the Fear & Greed Index sits at 20 — extreme fear.
A hot print could strengthen the case for a bigger hike. A soft one may ease the pressure. Volatility ahead.
#Bitcoin #PPI #Fed
Not financial advice.
US PPI Lands in 1 Hour — The Last Inflation Test Before the Fed December Hike
October PPI drops at 8:30 AM ET (13:30 UTC). Economists expect +0.4% MoM and +6.6% YoY — the highest annual rate since 2022. Core PPI seen at +0.3% MoM.
It follows Tuesday hot CPI (+0.4%) that pushed December hike odds to ~90%, with a 14.5% chance of a 50bp move. Bitcoin is already below $70,000 and the Fear & Greed Index sits at 20 — extreme fear.
A hot print could strengthen the case for a bigger hike. A soft one may ease the pressure. Volatility ahead.
#Bitcoin #PPI #Fed
Not financial advice.
October PPI drops at 8:30 AM ET (13:30 UTC). Economists expect +0.4% MoM and +6.6% YoY — the highest annual rate since 2022. Core PPI seen at +0.3% MoM.
It follows Tuesday hot CPI (+0.4%) that pushed December hike odds to ~90%, with a 14.5% chance of a 50bp move. Bitcoin is already below $70,000 and the Fear & Greed Index sits at 20 — extreme fear.
A hot print could strengthen the case for a bigger hike. A soft one may ease the pressure. Volatility ahead.
#Bitcoin #PPI #Fed
Not financial advice.

2

·
--
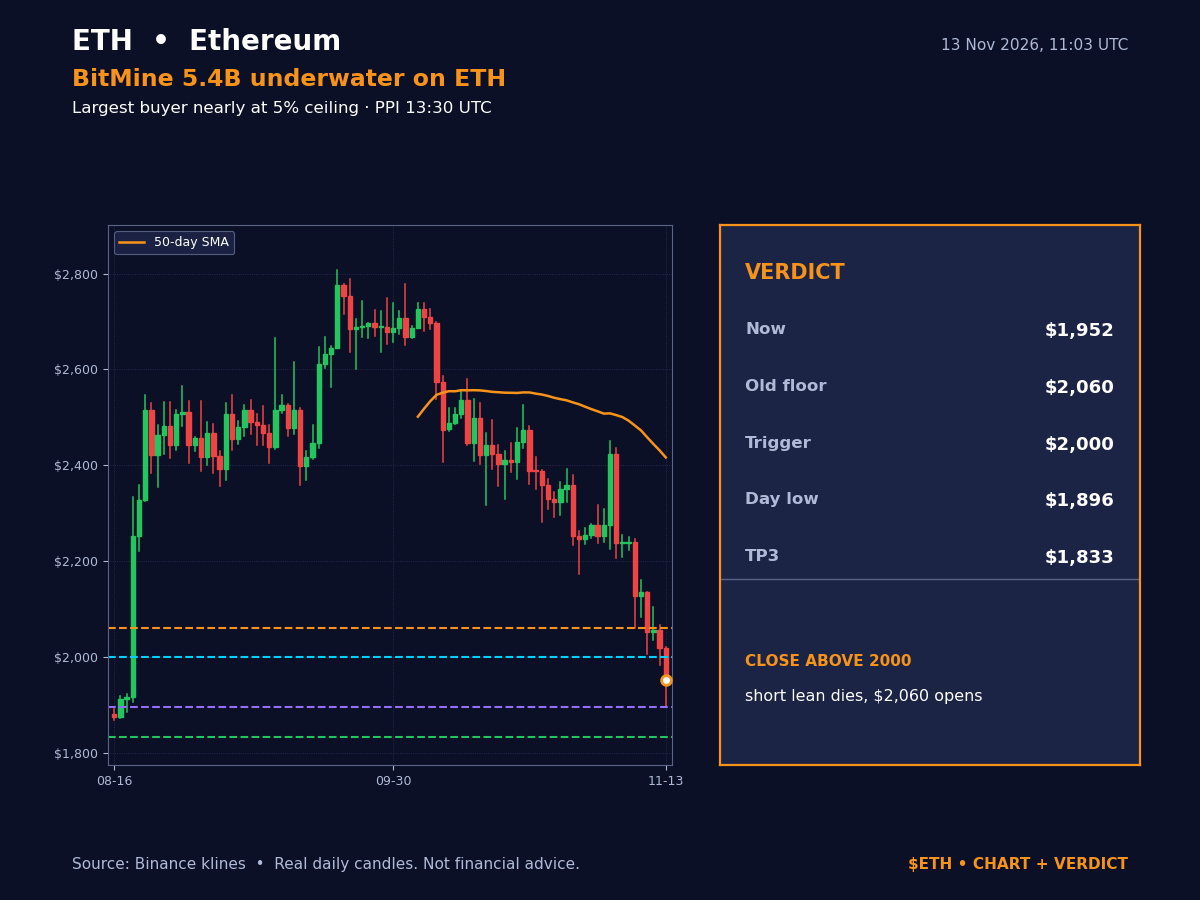
BitMine is $5.4B underwater on 5.9M ETH — and it still hasn't sold a single coin.
Its 10-K: a $6.31B net loss, $6.23B paper, as ETH fell 44% ($4,390 → $2,466). Its 5,901,837 ETH cost $19.95B, worth $14.56B; by 8 Nov it held 6,070,092 ETH — 4.97% of supply.
BitMine's ceiling is 5% of supply, so the largest ETH buyer is nearly out of room, while ETF buyers walked away five days running (-$144.8M).
ETH is $1,951 (Finnhub, 10:54 UTC), -4.66% in 24h; $2,000 broke and stayed broken, day low $1,895.95, high only $2,021.
I'm leaning short into PPI: entry $1,945–$1,960, targets $1,895.95 / $1,850 / $1,833, stop $2,005 — size light, a soft print flips this fast.
A close above $2,000 kills the lean, opens $2,060.
Soft PPI, ETH reclaims $2,000 — flip long or wait for $2,060? Drop your number.
$2,000 decides it for $ETH — PPI 13:30 UTC.
Not financial advice. DYOR.
#ETH #BitMine #PPI
BitMine is $5.4B underwater on 5.9M ETH — and it still hasn't sold a single coin.
Its 10-K: a $6.31B net loss, $6.23B paper, as ETH fell 44% ($4,390 → $2,466). Its 5,901,837 ETH cost $19.95B, worth $14.56B; by 8 Nov it held 6,070,092 ETH — 4.97% of supply.
BitMine's ceiling is 5% of supply, so the largest ETH buyer is nearly out of room, while ETF buyers walked away five days running (-$144.8M).
ETH is $1,951 (Finnhub, 10:54 UTC), -4.66% in 24h; $2,000 broke and stayed broken, day low $1,895.95, high only $2,021.
I'm leaning short into PPI: entry $1,945–$1,960, targets $1,895.95 / $1,850 / $1,833, stop $2,005 — size light, a soft print flips this fast.
A close above $2,000 kills the lean, opens $2,060.
Soft PPI, ETH reclaims $2,000 — flip long or wait for $2,060? Drop your number.
$2,000 decides it for $ETH — PPI 13:30 UTC.
Not financial advice. DYOR.
#ETH #BitMine #PPI
Its 10-K: a $6.31B net loss, $6.23B paper, as ETH fell 44% ($4,390 → $2,466). Its 5,901,837 ETH cost $19.95B, worth $14.56B; by 8 Nov it held 6,070,092 ETH — 4.97% of supply.
BitMine's ceiling is 5% of supply, so the largest ETH buyer is nearly out of room, while ETF buyers walked away five days running (-$144.8M).
ETH is $1,951 (Finnhub, 10:54 UTC), -4.66% in 24h; $2,000 broke and stayed broken, day low $1,895.95, high only $2,021.
I'm leaning short into PPI: entry $1,945–$1,960, targets $1,895.95 / $1,850 / $1,833, stop $2,005 — size light, a soft print flips this fast.
A close above $2,000 kills the lean, opens $2,060.
Soft PPI, ETH reclaims $2,000 — flip long or wait for $2,060? Drop your number.
$2,000 decides it for $ETH — PPI 13:30 UTC.
Not financial advice. DYOR.
#ETH #BitMine #PPI
3

·
--
🚨 BITCOIN FACES ANOTHER MAJOR TEST TODAY! WILL BTC DUMP OR RECOVER? 👀
Bitcoin is already under pressure, market sentiment is shaky, and traders are watching one important event today.
US PPI INFLATION DATA — NOVEMBER 13 (⏰ 8:30 AM ET | 13:30 UTC)
Here's why this report matters
Last month's PPI numbers were surprisingly hot:
🔴 Monthly PPI: +1.3%
🔴 Annual PPI: +6.3%
That's a strong inflation reading, and today's numbers could influence expectations around the Federal Reserve's interest-rate decisions.
So, what should Bitcoin traders watch?
📉 Scenario 1: HOTTER-THAN-EXPECTED INFLATION
If producer inflation comes in higher than expected, markets could become more concerned about interest rates.
That could put additional pressure on risk assets, including Bitcoin.
📈 Scenario 2: COOLER THAN EXPECTED INFLATION
If inflation shows signs of slowing, we could see some relief in the market.
Bitcoin might get the bounce bulls have been waiting for.
⚠️ But here's the catch.
Don't assume that a green candle immediately after the announcement means the market has turned bullish.
News-driven moves can reverse quickly, especially when liquidity is thin and traders start chasing the price.
What do you expect today?
🔥 $BTC DUMP — Inflation creates more pressure.
🚀 $BTC PUMP — Bulls finally take control.
Or will we see another fake breakout that traps both sides?
Let me know your prediction in the comments
#PPI #CryptoTrading #Infaltion
🚨 BITCOIN FACES ANOTHER MAJOR TEST TODAY! WILL BTC DUMP OR RECOVER? 👀
Bitcoin is already under pressure, market sentiment is shaky, and traders are watching one important event today.
US PPI INFLATION DATA — NOVEMBER 13 (⏰ 8:30 AM ET | 13:30 UTC)
Here's why this report matters
Last month's PPI numbers were surprisingly hot:
🔴 Monthly PPI: +1.3%
🔴 Annual PPI: +6.3%
That's a strong inflation reading, and today's numbers could influence expectations around the Federal Reserve's interest-rate decisions.
So, what should Bitcoin traders watch?
📉 Scenario 1: HOTTER-THAN-EXPECTED INFLATION
If producer inflation comes in higher than expected, markets could become more concerned about interest rates.
That could put additional pressure on risk assets, including Bitcoin.
📈 Scenario 2: COOLER THAN EXPECTED INFLATION
If inflation shows signs of slowing, we could see some relief in the market.
Bitcoin might get the bounce bulls have been waiting for.
⚠️ But here's the catch.
Don't assume that a green candle immediately after the announcement means the market has turned bullish.
News-driven moves can reverse quickly, especially when liquidity is thin and traders start chasing the price.
What do you expect today?
🔥 $BTC DUMP — Inflation creates more pressure.
🚀 $BTC PUMP — Bulls finally take control.
Or will we see another fake breakout that traps both sides?
Let me know your prediction in the comments
#PPI #CryptoTrading #Infaltion
Bitcoin is already under pressure, market sentiment is shaky, and traders are watching one important event today.
US PPI INFLATION DATA — NOVEMBER 13 (⏰ 8:30 AM ET | 13:30 UTC)
Here's why this report matters
Last month's PPI numbers were surprisingly hot:
🔴 Monthly PPI: +1.3%
🔴 Annual PPI: +6.3%
That's a strong inflation reading, and today's numbers could influence expectations around the Federal Reserve's interest-rate decisions.
So, what should Bitcoin traders watch?
📉 Scenario 1: HOTTER-THAN-EXPECTED INFLATION
If producer inflation comes in higher than expected, markets could become more concerned about interest rates.
That could put additional pressure on risk assets, including Bitcoin.
📈 Scenario 2: COOLER THAN EXPECTED INFLATION
If inflation shows signs of slowing, we could see some relief in the market.
Bitcoin might get the bounce bulls have been waiting for.
⚠️ But here's the catch.
Don't assume that a green candle immediately after the announcement means the market has turned bullish.
News-driven moves can reverse quickly, especially when liquidity is thin and traders start chasing the price.
What do you expect today?
🔥 $BTC DUMP — Inflation creates more pressure.
🚀 $BTC PUMP — Bulls finally take control.
Or will we see another fake breakout that traps both sides?
Let me know your prediction in the comments
#PPI #CryptoTrading #Infaltion
73

·
--
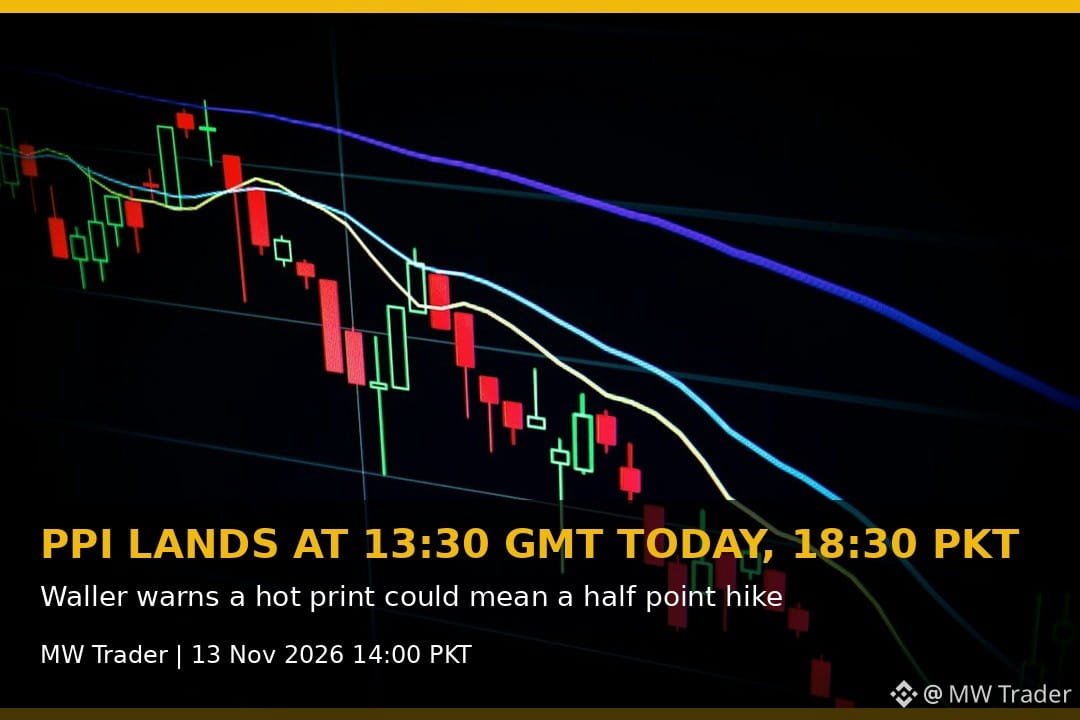
PPI lands at 13:30 GMT today, 18:30 PKT, and the Fed just warned a hot print could mean a half point hike. ⚠️
FinanceFeeds reports October producer prices arrive at 13:30 GMT today, and Fed Governor Christopher Waller said a reading at or above 0.3 percent might warrant a half point move, while CME FedWatch put a quarter point December hike at 88.8 percent and half point odds at 15.3 percent. 📰 Markets are already pricing a December hike, and the dollar index above 103, its highest since April 2025, shows how seriously traders are taking the tighter policy talk. My reading is that PPI is the single biggest event left today, because a soft print cools the dollar and lets Bitcoin bounce, while a hot print pushes half point odds higher and drags risk assets down again, and Bitcoin at 68,750 dollars has no cushion left for a bad surprise.
Does PPI come in soft and give Bitcoin its bounce, or hot and push it toward 65,000? 🤔
Follow for more trades.
#Crypto #Bitcoin #FuturesTrading #TradingSignals #PPI
PPI lands at 13:30 GMT today, 18:30 PKT, and the Fed just warned a hot print could mean a half point hike. ⚠️
FinanceFeeds reports October producer prices arrive at 13:30 GMT today, and Fed Governor Christopher Waller said a reading at or above 0.3 percent might warrant a half point move, while CME FedWatch put a quarter point December hike at 88.8 percent and half point odds at 15.3 percent. 📰 Markets are already pricing a December hike, and the dollar index above 103, its highest since April 2025, shows how seriously traders are taking the tighter policy talk. My reading is that PPI is the single biggest event left today, because a soft print cools the dollar and lets Bitcoin bounce, while a hot print pushes half point odds higher and drags risk assets down again, and Bitcoin at 68,750 dollars has no cushion left for a bad surprise.
Does PPI come in soft and give Bitcoin its bounce, or hot and push it toward 65,000? 🤔
Follow for more trades.
#Crypto #Bitcoin #FuturesTrading #TradingSignals #PPI
FinanceFeeds reports October producer prices arrive at 13:30 GMT today, and Fed Governor Christopher Waller said a reading at or above 0.3 percent might warrant a half point move, while CME FedWatch put a quarter point December hike at 88.8 percent and half point odds at 15.3 percent. 📰 Markets are already pricing a December hike, and the dollar index above 103, its highest since April 2025, shows how seriously traders are taking the tighter policy talk. My reading is that PPI is the single biggest event left today, because a soft print cools the dollar and lets Bitcoin bounce, while a hot print pushes half point odds higher and drags risk assets down again, and Bitcoin at 68,750 dollars has no cushion left for a bad surprise.
Does PPI come in soft and give Bitcoin its bounce, or hot and push it toward 65,000? 🤔
Follow for more trades.
#Crypto #Bitcoin #FuturesTrading #TradingSignals #PPI
·
--
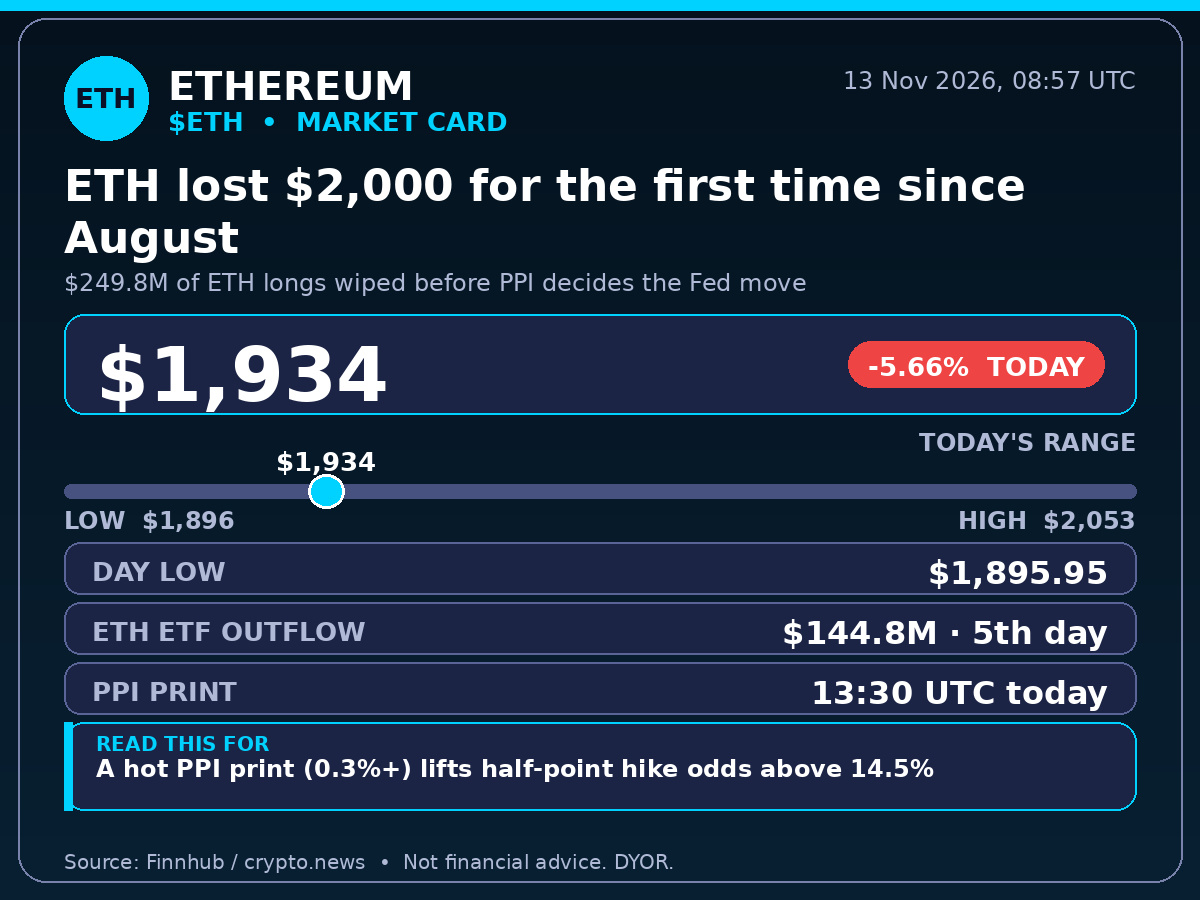
$ETH just lost $2,000 for the first time since August — and the flush wiped $249.8M of ETH longs hours before PPI decides the Fed's next move.
Source: crypto.news / Finnhub, 08:57 UTC. ETH $1,934, -5.66%, day low $1,895.95, while $BTC slid to $68,705. Nvidia's CEO exit rattled tech and ETH ETFs bled $144.8M for a 5th straight day.
I'm leaning bearish into the 13:30 UTC print: a hot reading (0.3%+) lifts half-point hike odds above 14.5%.
If $1,920 breaks, $1,833 is next. If it holds, the $2,000 reclaim is the first test. A daily close above $2,000 proves me wrong.
Hot print or cool — which side are you on at $1,920?
Not financial advice. DYOR.
#Ethereum #PPI #CryptoMarket
$ETH just lost $2,000 for the first time since August — and the flush wiped $249.8M of ETH longs hours before PPI decides the Fed's next move.
Source: crypto.news / Finnhub, 08:57 UTC. ETH $1,934, -5.66%, day low $1,895.95, while $BTC slid to $68,705. Nvidia's CEO exit rattled tech and ETH ETFs bled $144.8M for a 5th straight day.
I'm leaning bearish into the 13:30 UTC print: a hot reading (0.3%+) lifts half-point hike odds above 14.5%.
If $1,920 breaks, $1,833 is next. If it holds, the $2,000 reclaim is the first test. A daily close above $2,000 proves me wrong.
Hot print or cool — which side are you on at $1,920?
Not financial advice. DYOR.
#Ethereum #PPI #CryptoMarket
Source: crypto.news / Finnhub, 08:57 UTC. ETH $1,934, -5.66%, day low $1,895.95, while $BTC slid to $68,705. Nvidia's CEO exit rattled tech and ETH ETFs bled $144.8M for a 5th straight day.
I'm leaning bearish into the 13:30 UTC print: a hot reading (0.3%+) lifts half-point hike odds above 14.5%.
If $1,920 breaks, $1,833 is next. If it holds, the $2,000 reclaim is the first test. A daily close above $2,000 proves me wrong.
Hot print or cool — which side are you on at $1,920?
Not financial advice. DYOR.
#Ethereum #PPI #CryptoMarket
1
·
--
Article
BTC under $70,000 into PPI: $1.3B flushed, $67,879 decides nextBTC under $70,000 into PPI: $1.3B flushed, $67,879 decides next
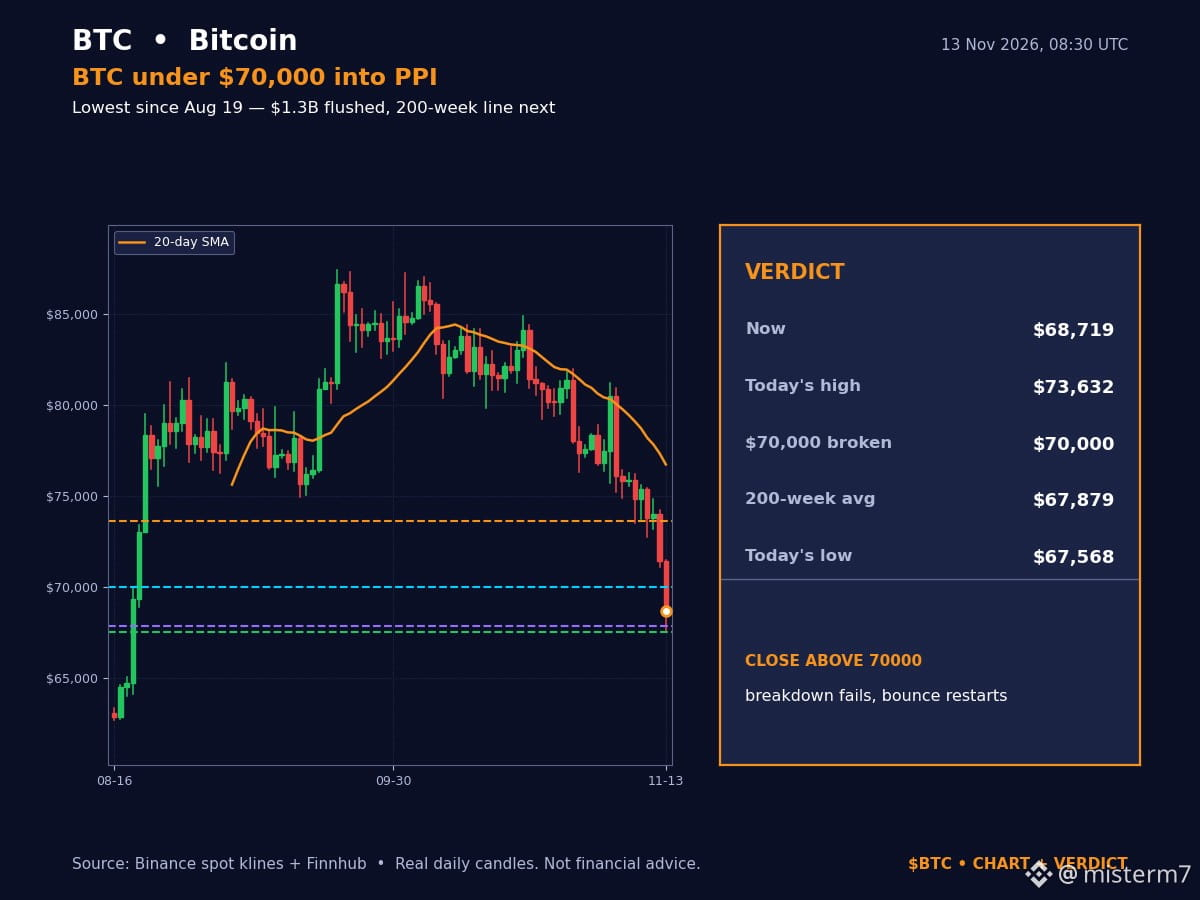
I called the $70,000 reclaim the bounce trigger in my last $BTC post. It never came. $70,000 broke in the Asian session, $1.3B in leveraged positions was flushed in 24 hours, and Bitcoin is now sitting $800 above the line that decides whether this is a bottom or the next leg down.
That line is $67,879 — the 200-week average. I keep staring at it because everything else has already given way. $73,510 broke on Monday. $71,255 broke overnight. $70,000 broke this morning. The 200-week average is the last big line with a name on it, and today's low of $67,568 already poked under it once.
What happened, with the numbers fresh this morning: $BTC $68,672 on Binance spot at 08:28 UTC, down 6.6% in 24 hours, range $67,568–$73,632. Finnhub's quote at 08:27 UTC agrees at $68,647. The Nov 12 close was $71,460. The low of $68,297 is the lowest since Aug 19, per Bloomberg. This is not a wick — it is a full session of selling.
Why it matters: the flush was real money, not noise. CoinGlass counts more than $1.3B liquidated across the market in 24 hours, over $1.2B of it longs — and nearly $500M of that came as $70,000 broke. US spot Bitcoin ETFs have now lost about $1.44B over five straight sessions, and $2.5B since Oct 30. Stablecoin supply has shrunk $14.2B in 30 days, the sharpest contraction since 2022. That is the fuel leaving the tank: fewer dollars standing by to buy the dip.
The macro side is doing the pushing. The 10-year Treasury yield is above 5.1%, the dollar is at a 19-month high, and a December Fed hike is now fully priced. Today at 13:30 UTC comes October PPI — consensus +0.4% month-on-month and 6.6% year-on-year, after September's 1.3% surge. A hot print hits every risk asset at once; a soft one takes some hike bets off the table. That is the whole trade today: PPI decides whether $67,879 holds or breaks.
My stance, and I will grade it honestly: leaning bearish into PPI, not strong. Fear & Greed sits at 20, Extreme Fear, and RSI is 24.9 — deeply oversold, the zone where sellers usually tire. $ETH is already under $2,000 at $1,932, and the whole board is red. Leaning, not strong, because an oversold market into a data print can snap back violently — and a soft PPI is exactly the kind of surprise that does it.
The levels, so you know exactly what to watch. Resistance first: a reclaim of $70,000, then today's high $73,632, where the biggest short cluster sits. Support: $67,879, the 200-week average, then today's low $67,568. If $67,879 breaks and the daily close lands under it, the next open space runs to $65,000–$67,500. If $67,879 holds through PPI and price closes back above $70,000, the breakdown fails and the bounce I called yesterday finally starts — late, but real.
What would prove me wrong: a daily close back above $70,000 kills the bearish view outright. A close under $67,879 confirms it and opens $65,000. Between those two lines this is chop, and chasing the first PPI candle is how most of that $1.3B got liquidated — keep size light into 13:30 UTC.
The next update triggers on the PPI print: hot PPI with a close under $67,879, or soft PPI with a $70,000 reclaim — whichever prints first, I will own it.
Are you watching $67,879 hold or break into PPI — and what is your plan if it breaks first?
Not financial advice. DYOR.
#Bitcoin #PPI #CryptoMarket
BTC under $70,000 into PPI: $1.3B flushed, $67,879 decides next
BTC under $70,000 into PPI: $1.3B flushed, $67,879 decides next
I called the $70,000 reclaim the bounce trigger in my last $BTC post. It never came. $70,000 broke in the Asian session, $1.3B in leveraged positions was flushed in 24 hours, and Bitcoin is now sitting $800 above the line that decides whether this is a bottom or the next leg down.
That line is $67,879 — the 200-week average. I keep staring at it because everything else has already given way. $73,510 broke on Monday. $71,255 broke overnight. $70,000 broke this morning. The 200-week average is the last big line with a name on it, and today's low of $67,568 already poked under it once.
What happened, with the numbers fresh this morning: $BTC $68,672 on Binance spot at 08:28 UTC, down 6.6% in 24 hours, range $67,568–$73,632. Finnhub's quote at 08:27 UTC agrees at $68,647. The Nov 12 close was $71,460. The low of $68,297 is the lowest since Aug 19, per Bloomberg. This is not a wick — it is a full session of selling.
Why it matters: the flush was real money, not noise. CoinGlass counts more than $1.3B liquidated across the market in 24 hours, over $1.2B of it longs — and nearly $500M of that came as $70,000 broke. US spot Bitcoin ETFs have now lost about $1.44B over five straight sessions, and $2.5B since Oct 30. Stablecoin supply has shrunk $14.2B in 30 days, the sharpest contraction since 2022. That is the fuel leaving the tank: fewer dollars standing by to buy the dip.
The macro side is doing the pushing. The 10-year Treasury yield is above 5.1%, the dollar is at a 19-month high, and a December Fed hike is now fully priced. Today at 13:30 UTC comes October PPI — consensus +0.4% month-on-month and 6.6% year-on-year, after September's 1.3% surge. A hot print hits every risk asset at once; a soft one takes some hike bets off the table. That is the whole trade today: PPI decides whether $67,879 holds or breaks.
My stance, and I will grade it honestly: leaning bearish into PPI, not strong. Fear & Greed sits at 20, Extreme Fear, and RSI is 24.9 — deeply oversold, the zone where sellers usually tire. $ETH is already under $2,000 at $1,932, and the whole board is red. Leaning, not strong, because an oversold market into a data print can snap back violently — and a soft PPI is exactly the kind of surprise that does it.
The levels, so you know exactly what to watch. Resistance first: a reclaim of $70,000, then today's high $73,632, where the biggest short cluster sits. Support: $67,879, the 200-week average, then today's low $67,568. If $67,879 breaks and the daily close lands under it, the next open space runs to $65,000–$67,500. If $67,879 holds through PPI and price closes back above $70,000, the breakdown fails and the bounce I called yesterday finally starts — late, but real.
What would prove me wrong: a daily close back above $70,000 kills the bearish view outright. A close under $67,879 confirms it and opens $65,000. Between those two lines this is chop, and chasing the first PPI candle is how most of that $1.3B got liquidated — keep size light into 13:30 UTC.
The next update triggers on the PPI print: hot PPI with a close under $67,879, or soft PPI with a $70,000 reclaim — whichever prints first, I will own it.
Are you watching $67,879 hold or break into PPI — and what is your plan if it breaks first?
Not financial advice. DYOR.
#Bitcoin #PPI #CryptoMarket
I called the $70,000 reclaim the bounce trigger in my last $BTC post. It never came. $70,000 broke in the Asian session, $1.3B in leveraged positions was flushed in 24 hours, and Bitcoin is now sitting $800 above the line that decides whether this is a bottom or the next leg down.
That line is $67,879 — the 200-week average. I keep staring at it because everything else has already given way. $73,510 broke on Monday. $71,255 broke overnight. $70,000 broke this morning. The 200-week average is the last big line with a name on it, and today's low of $67,568 already poked under it once.
What happened, with the numbers fresh this morning: $BTC $68,672 on Binance spot at 08:28 UTC, down 6.6% in 24 hours, range $67,568–$73,632. Finnhub's quote at 08:27 UTC agrees at $68,647. The Nov 12 close was $71,460. The low of $68,297 is the lowest since Aug 19, per Bloomberg. This is not a wick — it is a full session of selling.
Why it matters: the flush was real money, not noise. CoinGlass counts more than $1.3B liquidated across the market in 24 hours, over $1.2B of it longs — and nearly $500M of that came as $70,000 broke. US spot Bitcoin ETFs have now lost about $1.44B over five straight sessions, and $2.5B since Oct 30. Stablecoin supply has shrunk $14.2B in 30 days, the sharpest contraction since 2022. That is the fuel leaving the tank: fewer dollars standing by to buy the dip.
The macro side is doing the pushing. The 10-year Treasury yield is above 5.1%, the dollar is at a 19-month high, and a December Fed hike is now fully priced. Today at 13:30 UTC comes October PPI — consensus +0.4% month-on-month and 6.6% year-on-year, after September's 1.3% surge. A hot print hits every risk asset at once; a soft one takes some hike bets off the table. That is the whole trade today: PPI decides whether $67,879 holds or breaks.
My stance, and I will grade it honestly: leaning bearish into PPI, not strong. Fear & Greed sits at 20, Extreme Fear, and RSI is 24.9 — deeply oversold, the zone where sellers usually tire. $ETH is already under $2,000 at $1,932, and the whole board is red. Leaning, not strong, because an oversold market into a data print can snap back violently — and a soft PPI is exactly the kind of surprise that does it.
The levels, so you know exactly what to watch. Resistance first: a reclaim of $70,000, then today's high $73,632, where the biggest short cluster sits. Support: $67,879, the 200-week average, then today's low $67,568. If $67,879 breaks and the daily close lands under it, the next open space runs to $65,000–$67,500. If $67,879 holds through PPI and price closes back above $70,000, the breakdown fails and the bounce I called yesterday finally starts — late, but real.
What would prove me wrong: a daily close back above $70,000 kills the bearish view outright. A close under $67,879 confirms it and opens $65,000. Between those two lines this is chop, and chasing the first PPI candle is how most of that $1.3B got liquidated — keep size light into 13:30 UTC.
The next update triggers on the PPI print: hot PPI with a close under $67,879, or soft PPI with a $70,000 reclaim — whichever prints first, I will own it.
Are you watching $67,879 hold or break into PPI — and what is your plan if it breaks first?
Not financial advice. DYOR.
#Bitcoin #PPI #CryptoMarket
4
·
--
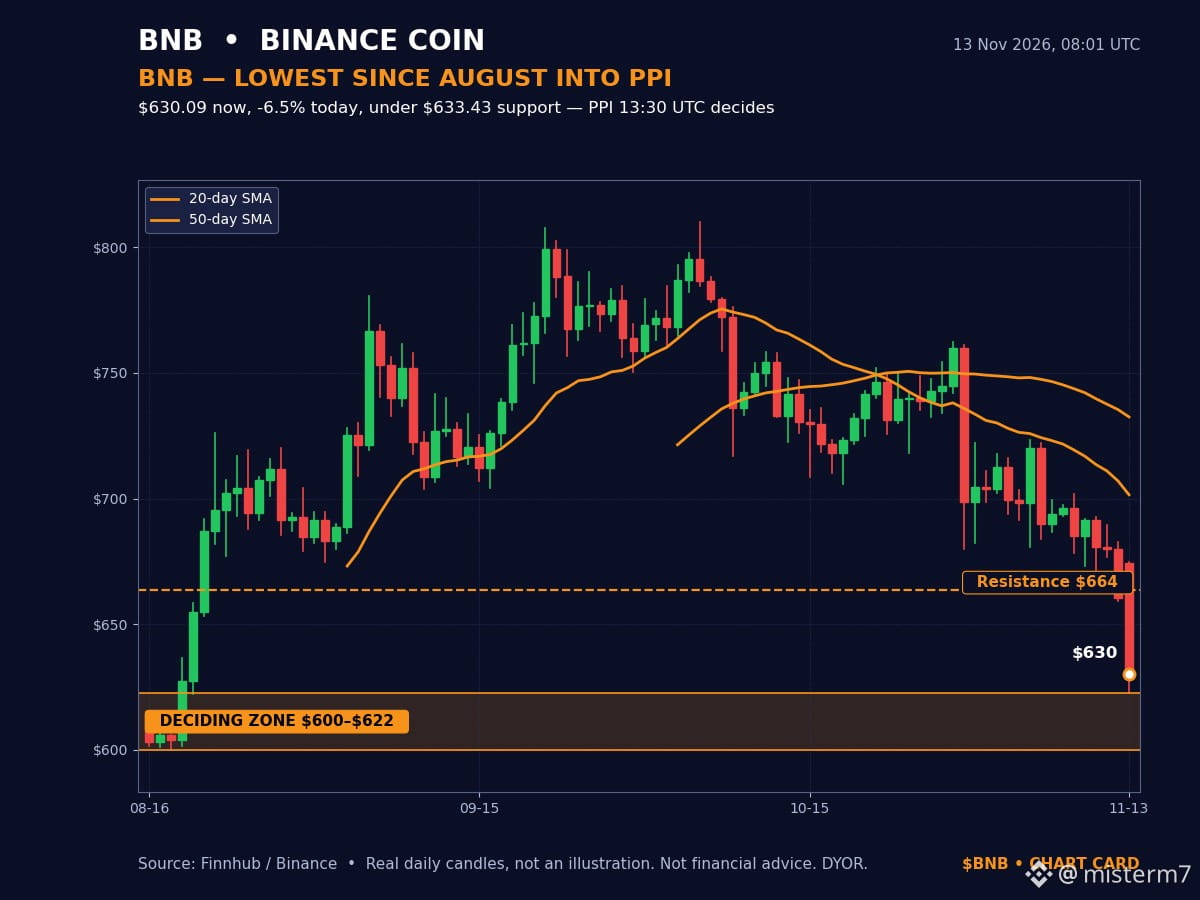
PPI lands at 13:30 UTC and $BNB is already at its lowest since August — Fear & Greed at 20, RSI 28.4, and nobody wants to catch this knife yet.
This morning it was already $635 after the $673.31 floor gave way. Binance spot has it at $630 now, and $622.41 is the only thing between us and the $600 round number.
$BTC is doing the same at $68,602, down 6.9% — this isn't a BNB story, it's a whole market holding its breath before PPI. Three straight red closes, $759 to $630 in two weeks, and still no buyers stepping in. I'm leaning cautious: only a soft PPI print flips this before the close.
If $622.41 holds into 13:30 UTC, the bounce has a floor. If it breaks, $600 decides. Would you buy $BNB at $600 on a soft PPI, or wait for the daily close?
Not financial advice. DYOR.
#BNB #ExtremeFear #PPI
PPI lands at 13:30 UTC and $BNB is already at its lowest since August — Fear & Greed at 20, RSI 28.4, and nobody wants to catch this knife yet.
This morning it was already $635 after the $673.31 floor gave way. Binance spot has it at $630 now, and $622.41 is the only thing between us and the $600 round number.
$BTC is doing the same at $68,602, down 6.9% — this isn't a BNB story, it's a whole market holding its breath before PPI. Three straight red closes, $759 to $630 in two weeks, and still no buyers stepping in. I'm leaning cautious: only a soft PPI print flips this before the close.
If $622.41 holds into 13:30 UTC, the bounce has a floor. If it breaks, $600 decides. Would you buy $BNB at $600 on a soft PPI, or wait for the daily close?
Not financial advice. DYOR.
#BNB #ExtremeFear #PPI
This morning it was already $635 after the $673.31 floor gave way. Binance spot has it at $630 now, and $622.41 is the only thing between us and the $600 round number.
$BTC is doing the same at $68,602, down 6.9% — this isn't a BNB story, it's a whole market holding its breath before PPI. Three straight red closes, $759 to $630 in two weeks, and still no buyers stepping in. I'm leaning cautious: only a soft PPI print flips this before the close.
If $622.41 holds into 13:30 UTC, the bounce has a floor. If it breaks, $600 decides. Would you buy $BNB at $600 on a soft PPI, or wait for the daily close?
Not financial advice. DYOR.
#BNB #ExtremeFear #PPI
2

🚨 $BTC SET FOR MAXIMUM VOLATILITY AS US PPI INFLATION DATA DROPS TODAY! ⚡
Wall Street is holding its breath as the latest Producer Price Index figures hit the wire at 8:30 AM ET. 📊 Markets are locked in on whether the YoY forecast of 6.6 percent holds firm or shocks order books. ⚡
A cooler print below expectations could spark an aggressive relief rally across risk assets, while a hot print will test key structural bids. 💡 Core metrics and positioning will dictate the immediate tape reaction when the print lands. 🌊
Are you positioned for a volatile sweep or waiting for the dust to settle before entering? 👇
⚠️ Not financial advice. Always manage your risk. 🛡️
🏷️ #BTC $XAU #FedWatch #PPI #Crypto
🔥 💎
🚨 $BTC SET FOR MAXIMUM VOLATILITY AS US PPI INFLATION DATA DROPS TODAY! ⚡
Wall Street is holding its breath as the latest Producer Price Index figures hit the wire at 8:30 AM ET. 📊 Markets are locked in on whether the YoY forecast of 6.6 percent holds firm or shocks order books. ⚡
A cooler print below expectations could spark an aggressive relief rally across risk assets, while a hot print will test key structural bids. 💡 Core metrics and positioning will dictate the immediate tape reaction when the print lands. 🌊
Are you positioned for a volatile sweep or waiting for the dust to settle before entering? 👇
⚠️ Not financial advice. Always manage your risk. 🛡️
🏷️ #BTC $XAU #FedWatch #PPI #Crypto
🔥 💎
Wall Street is holding its breath as the latest Producer Price Index figures hit the wire at 8:30 AM ET. 📊 Markets are locked in on whether the YoY forecast of 6.6 percent holds firm or shocks order books. ⚡
A cooler print below expectations could spark an aggressive relief rally across risk assets, while a hot print will test key structural bids. 💡 Core metrics and positioning will dictate the immediate tape reaction when the print lands. 🌊
Are you positioned for a volatile sweep or waiting for the dust to settle before entering? 👇
⚠️ Not financial advice. Always manage your risk. 🛡️
🏷️ #BTC $XAU #FedWatch #PPI #Crypto
🔥 💎

3

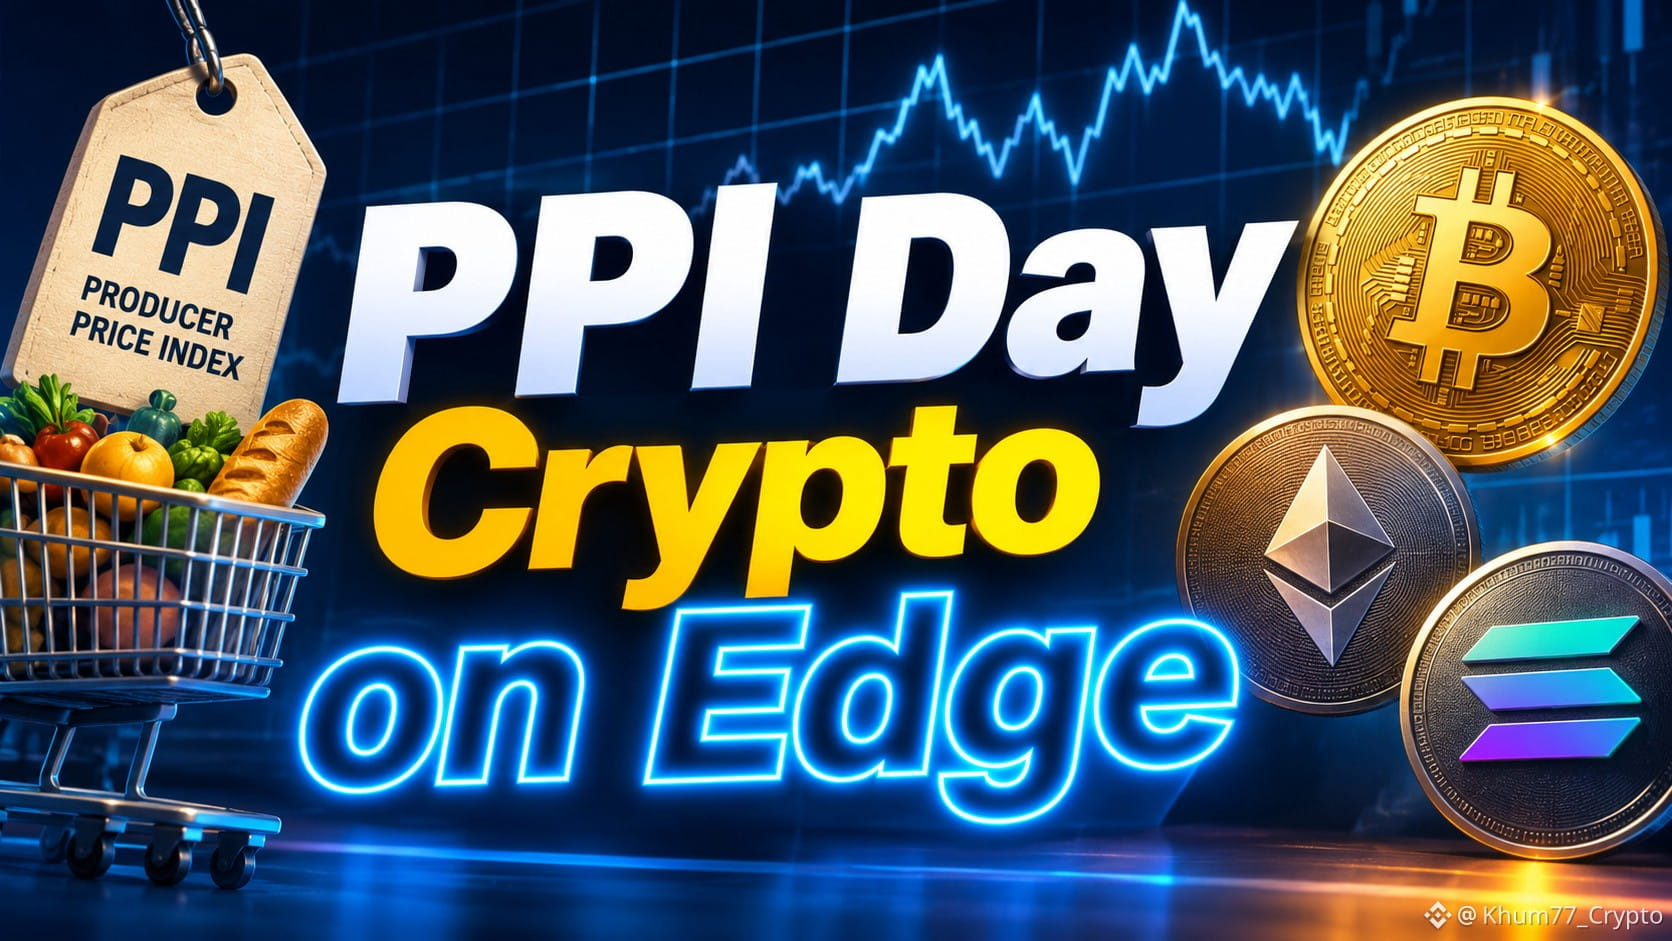
PPI Day: Crypto on Edge ⚡
Bitcoin has started the day bleeding. Losing around 6.8% to trade around $68,900 with Fear & Greed at 20. 😬📉 Economists are expecting October producer prices to rise by 0.4% compared to the previous month.
Following a shocking 1.3% increase in September. 📊🔥 The October CPI figure was already strong, printing at 0.4%. Traders are therefore expecting to factor in risk of a rate hike in December. 🏦⚠️
Typically higher producer prices will feed through into consumer prices, keeping the Fed in a hawkish position and liquidity tight. 🧲💧 Outflows in US Spot ETFs have been running for three consecutive days this week, therefore there isn’t much support below price. 🐻🏃
If we get a strong print then Bitcoin could move towards $68,000. 🧨📉 But if it prints weakly then we could see a bounce as sentiment is very oversold.
#PPI #Fed #cpi
$BTC
{spot}(BTCUSDT)
PPI Day: Crypto on Edge ⚡
Bitcoin has started the day bleeding. Losing around 6.8% to trade around $68,900 with Fear & Greed at 20. 😬📉 Economists are expecting October producer prices to rise by 0.4% compared to the previous month.
Following a shocking 1.3% increase in September. 📊🔥 The October CPI figure was already strong, printing at 0.4%. Traders are therefore expecting to factor in risk of a rate hike in December. 🏦⚠️
Typically higher producer prices will feed through into consumer prices, keeping the Fed in a hawkish position and liquidity tight. 🧲💧 Outflows in US Spot ETFs have been running for three consecutive days this week, therefore there isn’t much support below price. 🐻🏃
If we get a strong print then Bitcoin could move towards $68,000. 🧨📉 But if it prints weakly then we could see a bounce as sentiment is very oversold.
#PPI #Fed #cpi
$BTC
Bitcoin has started the day bleeding. Losing around 6.8% to trade around $68,900 with Fear & Greed at 20. 😬📉 Economists are expecting October producer prices to rise by 0.4% compared to the previous month.
Following a shocking 1.3% increase in September. 📊🔥 The October CPI figure was already strong, printing at 0.4%. Traders are therefore expecting to factor in risk of a rate hike in December. 🏦⚠️
Typically higher producer prices will feed through into consumer prices, keeping the Fed in a hawkish position and liquidity tight. 🧲💧 Outflows in US Spot ETFs have been running for three consecutive days this week, therefore there isn’t much support below price. 🐻🏃
If we get a strong print then Bitcoin could move towards $68,000. 🧨📉 But if it prints weakly then we could see a bounce as sentiment is very oversold.
#PPI #Fed #cpi
$BTC
Bernadine Kneefe obKR:
yes
1
1
144

·
--
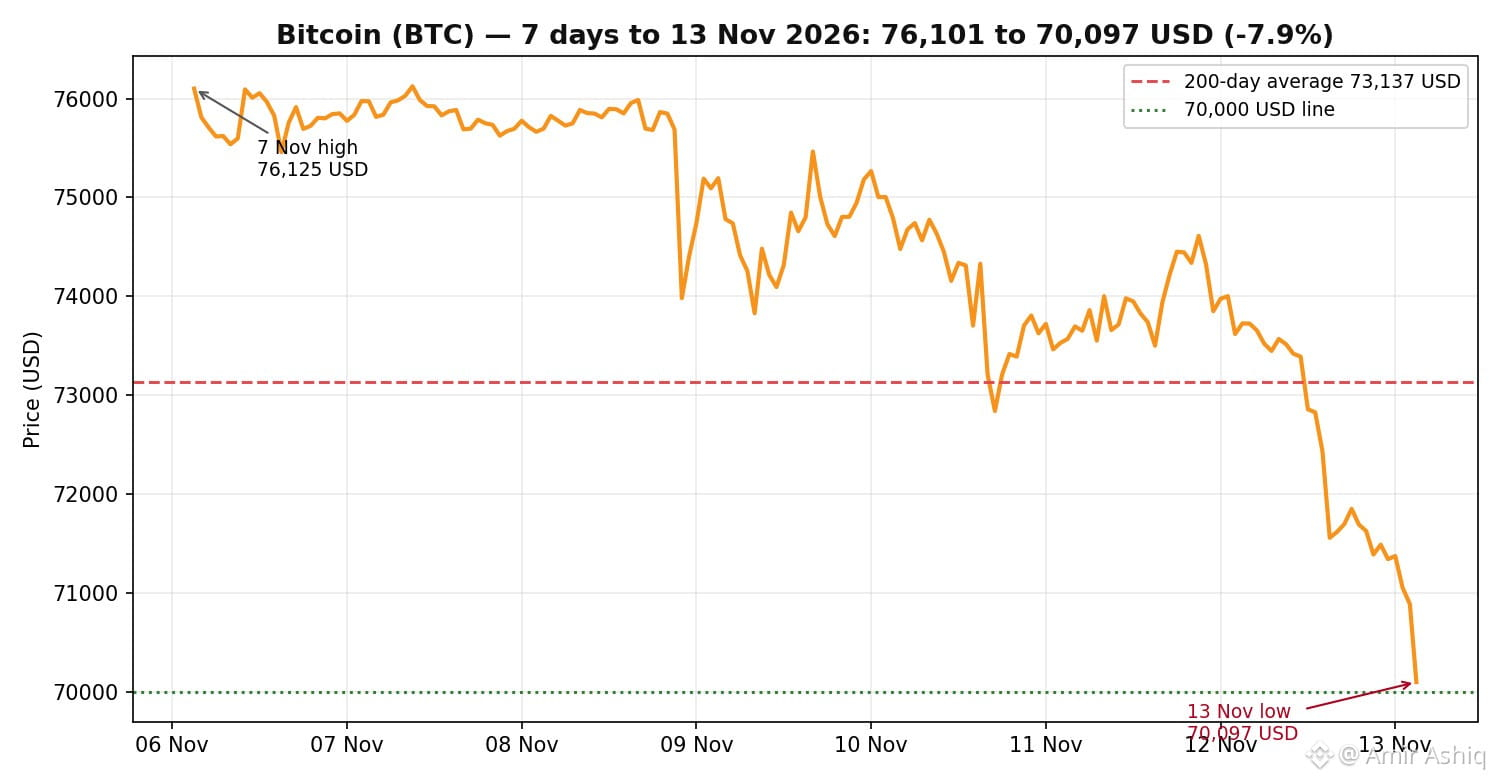
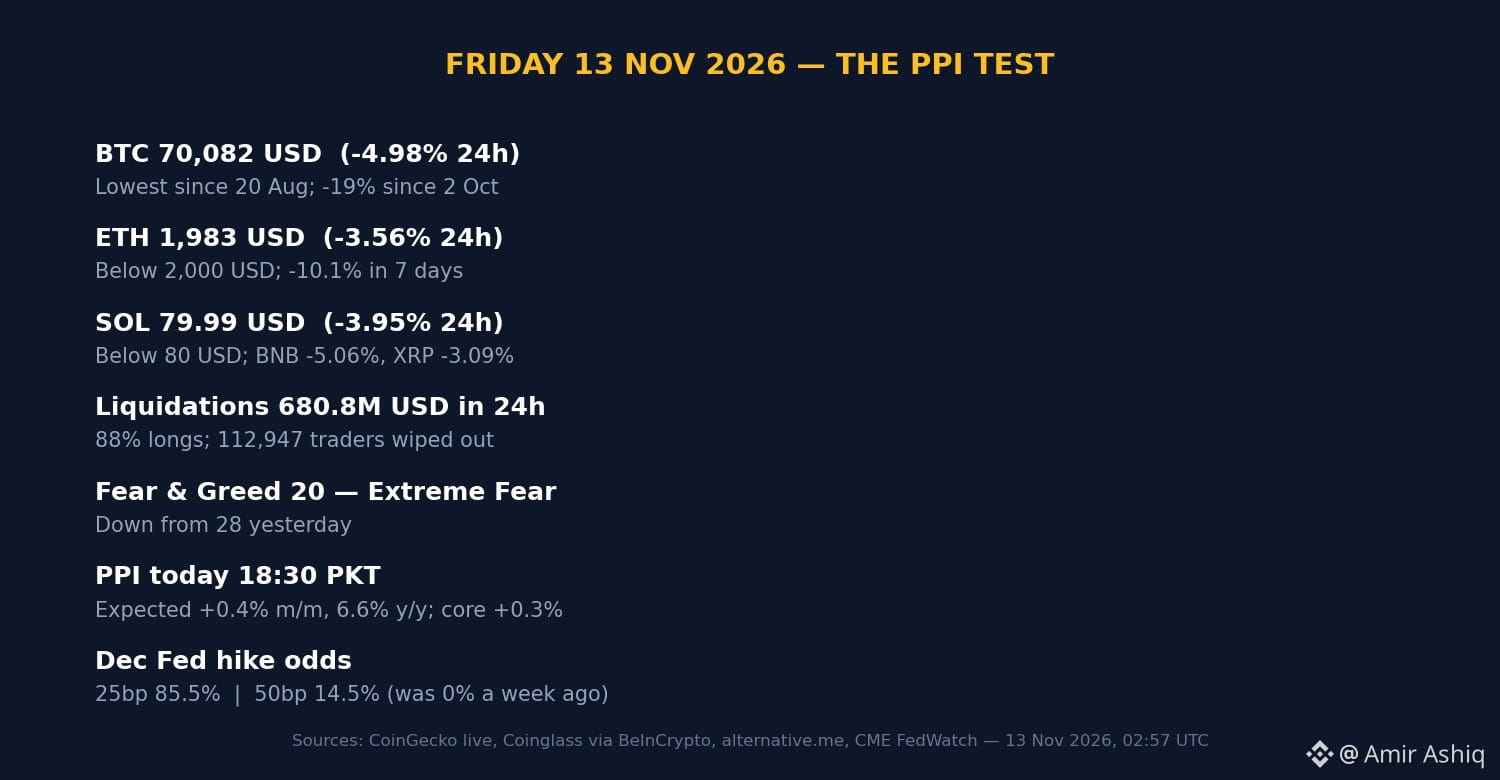
🚨 $BTC JUST CRASHED BELOW 71,000 USD — BUT TODAY'S PPI COULD FLIP THE SCRIPT! ⚠️
Bitcoin hit 70,082 USD overnight — its lowest since August 20, and down more than 19% since October 2.
$ETH slipped under 2,000 USD for the first time since mid-August, and $SOL fell below 80 USD. The whole market is bleeding together.
Here's the catch:
📉 $BTC lost its 200-day average at 73,137 USD on Thursday — the next supports sit at 68,000 and 67,000 USD.
📊 Fear & Greed just plunged to 20 — Extreme Fear — down from 28 yesterday.
💧 680.8M USD liquidated in 24 hours, 88% of it longs — 112,947 traders wiped out, including one 31.1M USD long.
Hot inflation = tighter money = thinner liquidity = bigger swings on data days. October CPI already beat forecasts — now PPI decides whether December brings a 25 or a 50-point hike.
Will a soft PPI print save the 70,000 USD line — or is this just the start? 👇
Not financial advice — educational purposes only.
#Bitcoin #crypto #Ethereum #PPI
🚨 $BTC JUST CRASHED BELOW 71,000 USD — BUT TODAY'S PPI COULD FLIP THE SCRIPT! ⚠️
Bitcoin hit 70,082 USD overnight — its lowest since August 20, and down more than 19% since October 2.
$ETH slipped under 2,000 USD for the first time since mid-August, and $SOL fell below 80 USD. The whole market is bleeding together.
Here's the catch:
📉 $BTC lost its 200-day average at 73,137 USD on Thursday — the next supports sit at 68,000 and 67,000 USD.
📊 Fear & Greed just plunged to 20 — Extreme Fear — down from 28 yesterday.
💧 680.8M USD liquidated in 24 hours, 88% of it longs — 112,947 traders wiped out, including one 31.1M USD long.
Hot inflation = tighter money = thinner liquidity = bigger swings on data days. October CPI already beat forecasts — now PPI decides whether December brings a 25 or a 50-point hike.
Will a soft PPI print save the 70,000 USD line — or is this just the start? 👇
Not financial advice — educational purposes only.
#Bitcoin #crypto #Ethereum #PPI
Bitcoin hit 70,082 USD overnight — its lowest since August 20, and down more than 19% since October 2.
$ETH slipped under 2,000 USD for the first time since mid-August, and $SOL fell below 80 USD. The whole market is bleeding together.
Here's the catch:
📉 $BTC lost its 200-day average at 73,137 USD on Thursday — the next supports sit at 68,000 and 67,000 USD.
📊 Fear & Greed just plunged to 20 — Extreme Fear — down from 28 yesterday.
💧 680.8M USD liquidated in 24 hours, 88% of it longs — 112,947 traders wiped out, including one 31.1M USD long.
Hot inflation = tighter money = thinner liquidity = bigger swings on data days. October CPI already beat forecasts — now PPI decides whether December brings a 25 or a 50-point hike.
Will a soft PPI print save the 70,000 USD line — or is this just the start? 👇
Not financial advice — educational purposes only.
#Bitcoin #crypto #Ethereum #PPI
76
·
--
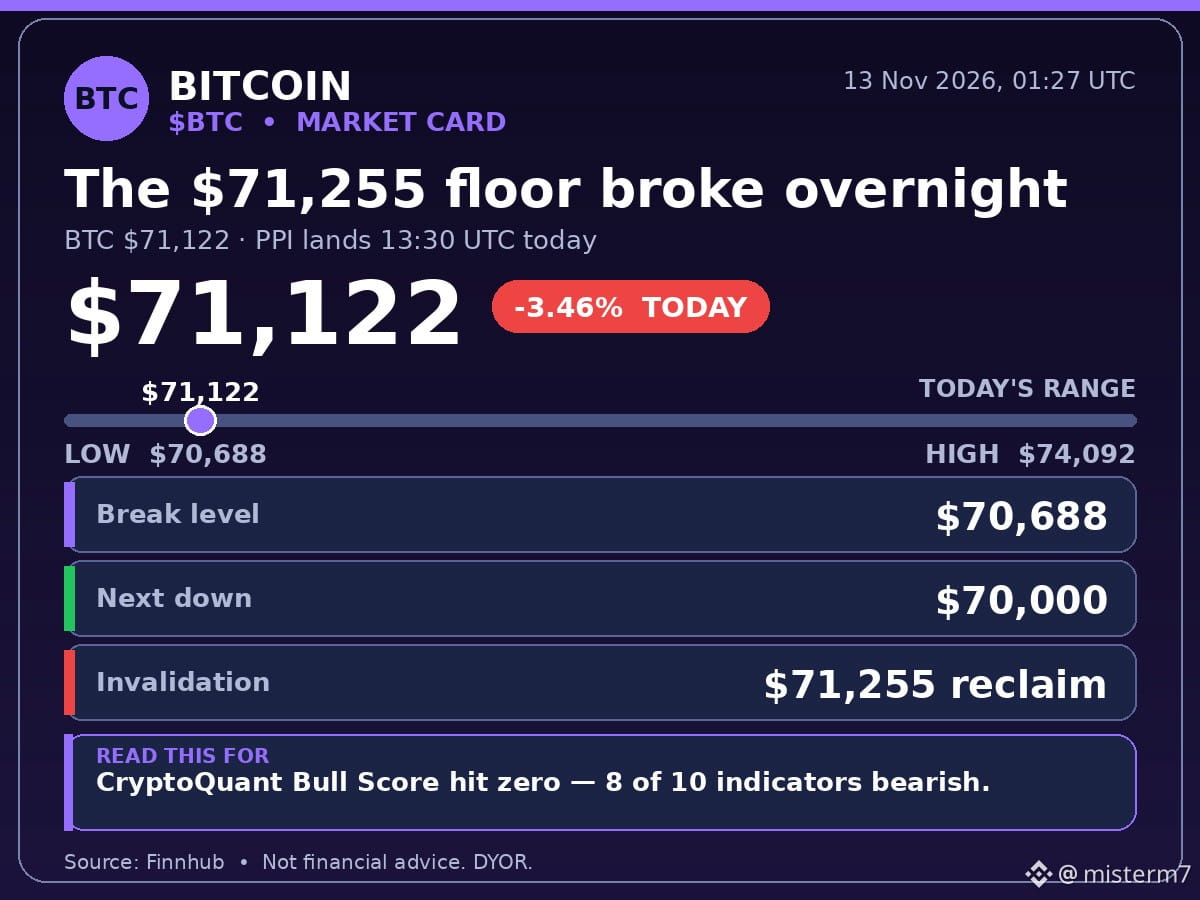
$BTC $71,255 floor broke overnight — low $70,688, now $71,122
Finnhub, 01:27 UTC. PPI lands 13:30 UTC today.
I called this floor a hold yesterday. Wrong — the spike to $74,092 was the trap, then the floor gave way.
Leaning bearish into PPI: CryptoQuant's Bull Score hit zero on 11 Nov, fear at 20, extreme. SOL's doing the same dance — $81.55 now, tagged $80.46 overnight, back above its $81.34 floor by 21 cents.
Break $70,688 and $70,000 is next. Reclaim $71,255 by the close and it's a wick — $73,510 back on. Hot PPI over +0.4% and the break sticks.
Would you buy the $70,000 test, or wait for the reclaim?
$BTC $71,255 decides it.
Not financial advice. DYOR.
#BTC #PPI #CryptoNews
$BTC $71,255 floor broke overnight — low $70,688, now $71,122
Finnhub, 01:27 UTC. PPI lands 13:30 UTC today.
I called this floor a hold yesterday. Wrong — the spike to $74,092 was the trap, then the floor gave way.
Leaning bearish into PPI: CryptoQuant's Bull Score hit zero on 11 Nov, fear at 20, extreme. SOL's doing the same dance — $81.55 now, tagged $80.46 overnight, back above its $81.34 floor by 21 cents.
Break $70,688 and $70,000 is next. Reclaim $71,255 by the close and it's a wick — $73,510 back on. Hot PPI over +0.4% and the break sticks.
Would you buy the $70,000 test, or wait for the reclaim?
$BTC $71,255 decides it.
Not financial advice. DYOR.
#BTC #PPI #CryptoNews
Finnhub, 01:27 UTC. PPI lands 13:30 UTC today.
I called this floor a hold yesterday. Wrong — the spike to $74,092 was the trap, then the floor gave way.
Leaning bearish into PPI: CryptoQuant's Bull Score hit zero on 11 Nov, fear at 20, extreme. SOL's doing the same dance — $81.55 now, tagged $80.46 overnight, back above its $81.34 floor by 21 cents.
Break $70,688 and $70,000 is next. Reclaim $71,255 by the close and it's a wick — $73,510 back on. Hot PPI over +0.4% and the break sticks.
Would you buy the $70,000 test, or wait for the reclaim?
$BTC $71,255 decides it.
Not financial advice. DYOR.
#BTC #PPI #CryptoNews
29
·
--
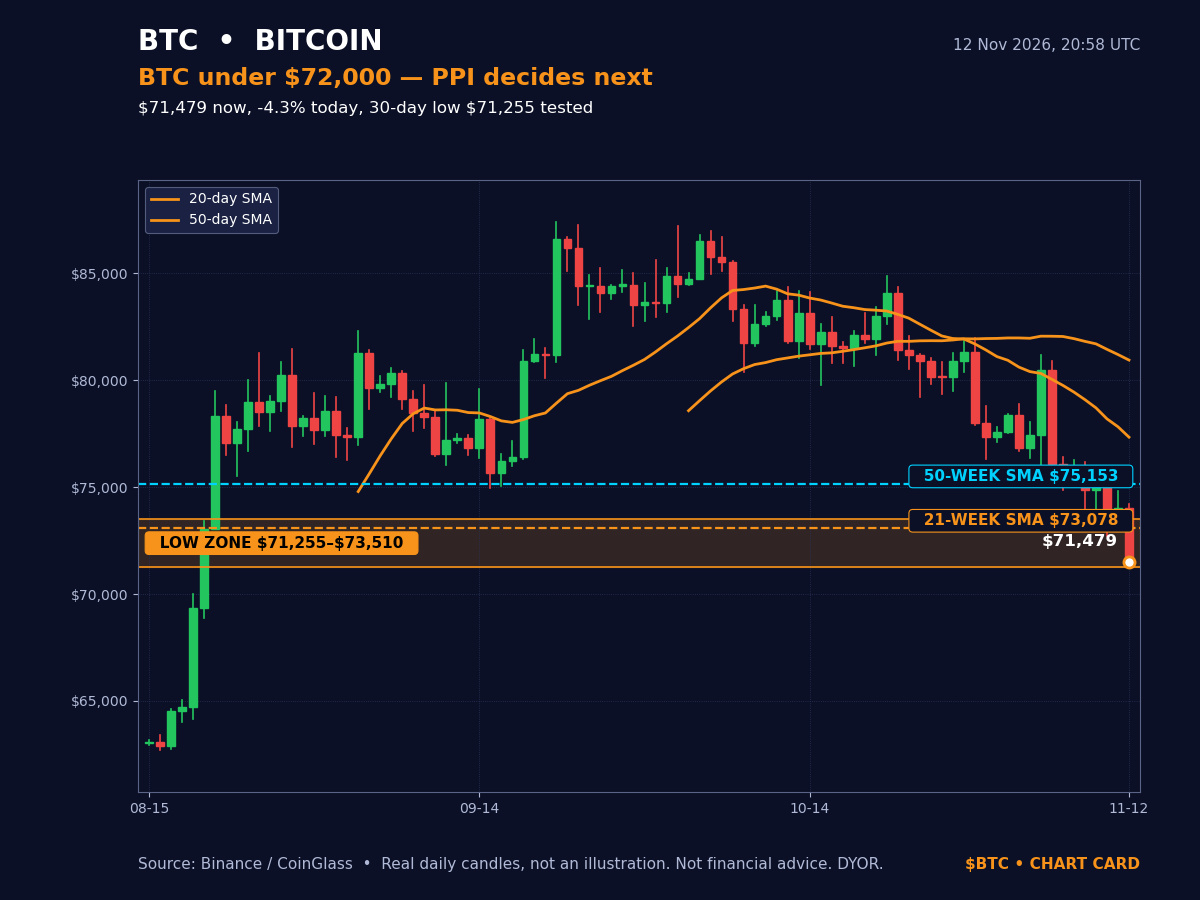
$BTC breaks under $72,000 — PPI at 13:30 UTC decides if $70,000 is next
Source: Cointelegraph, 12 Nov 15:46 UTC — Nvidia CEO Jensen Huang resigned, stocks sank, BTC fell 3.5% and set new 11-week lows.
I called $70,000 next in my last BTC post — and tonight $71,255, the fresh 30-day low, is still holding, by just $224. That is the whole trade now.
BTC sits at $71,479, -4.3% today, under its 21-week average of $73,078. CoinGlass counted $730M liquidated in 24 hours. PPI lands Friday 13:30 UTC — consensus +0.4%, core +0.3% — after Tuesday's hot CPI already priced in a December hike.
I'm leaning bearish into the print, because every bounce this week has been sold. But a cool PPI flips it fast: $72,427 holds the biggest short-liquidation cluster, $111.7M of shorts waiting to be squeezed.
If $71,255 breaks, $70,979 is the next cluster and $70,000 is the round number everyone watches. If it holds into PPI, $73,078 is the reclaim that kills my lean.
PPI hot or cool — does $BTC hold $71,255 or print $70,000 first? Drop your number.
Not financial advice. DYOR.
#Bitcoin #CryptoNews #PPI
$BTC breaks under $72,000 — PPI at 13:30 UTC decides if $70,000 is next
Source: Cointelegraph, 12 Nov 15:46 UTC — Nvidia CEO Jensen Huang resigned, stocks sank, BTC fell 3.5% and set new 11-week lows.
I called $70,000 next in my last BTC post — and tonight $71,255, the fresh 30-day low, is still holding, by just $224. That is the whole trade now.
BTC sits at $71,479, -4.3% today, under its 21-week average of $73,078. CoinGlass counted $730M liquidated in 24 hours. PPI lands Friday 13:30 UTC — consensus +0.4%, core +0.3% — after Tuesday's hot CPI already priced in a December hike.
I'm leaning bearish into the print, because every bounce this week has been sold. But a cool PPI flips it fast: $72,427 holds the biggest short-liquidation cluster, $111.7M of shorts waiting to be squeezed.
If $71,255 breaks, $70,979 is the next cluster and $70,000 is the round number everyone watches. If it holds into PPI, $73,078 is the reclaim that kills my lean.
PPI hot or cool — does $BTC hold $71,255 or print $70,000 first? Drop your number.
Not financial advice. DYOR.
#Bitcoin #CryptoNews #PPI
Source: Cointelegraph, 12 Nov 15:46 UTC — Nvidia CEO Jensen Huang resigned, stocks sank, BTC fell 3.5% and set new 11-week lows.
I called $70,000 next in my last BTC post — and tonight $71,255, the fresh 30-day low, is still holding, by just $224. That is the whole trade now.
BTC sits at $71,479, -4.3% today, under its 21-week average of $73,078. CoinGlass counted $730M liquidated in 24 hours. PPI lands Friday 13:30 UTC — consensus +0.4%, core +0.3% — after Tuesday's hot CPI already priced in a December hike.
I'm leaning bearish into the print, because every bounce this week has been sold. But a cool PPI flips it fast: $72,427 holds the biggest short-liquidation cluster, $111.7M of shorts waiting to be squeezed.
If $71,255 breaks, $70,979 is the next cluster and $70,000 is the round number everyone watches. If it holds into PPI, $73,078 is the reclaim that kills my lean.
PPI hot or cool — does $BTC hold $71,255 or print $70,000 first? Drop your number.
Not financial advice. DYOR.
#Bitcoin #CryptoNews #PPI
1

·
--
🇺🇸 NEXT BIG MARKET CATALYST: US PPI TOMORROW!!!!
The October Producer Price Index arrives on November 13.
⏰ Release: 8:30 AM ET
After hotter-than-expected consumer inflation, markets are watching producer prices for further clues about the Federal Reserve's next move.
📊 Hot PPI could increase rate concerns.
📉 Cooler PPI could ease inflation pressure.
#HuangExitNvidiaStrategyInFocus #AnthropicRejectsIPODelayValuationinQuestion #TradFiForBeginners #CanNvidiaEarningsEaseMarketConcerns? #PPI $BTC $ETH $XAU
{future}(XAUUSDT)
{spot}(ETHUSDT)
{spot}(BTCUSDT)
🇺🇸 NEXT BIG MARKET CATALYST: US PPI TOMORROW!!!!
The October Producer Price Index arrives on November 13.
⏰ Release: 8:30 AM ET
After hotter-than-expected consumer inflation, markets are watching producer prices for further clues about the Federal Reserve's next move.
📊 Hot PPI could increase rate concerns.
📉 Cooler PPI could ease inflation pressure.
#HuangExitNvidiaStrategyInFocus #AnthropicRejectsIPODelayValuationinQuestion #TradFiForBeginners #CanNvidiaEarningsEaseMarketConcerns? #PPI $BTC $ETH $XAU
The October Producer Price Index arrives on November 13.
⏰ Release: 8:30 AM ET
After hotter-than-expected consumer inflation, markets are watching producer prices for further clues about the Federal Reserve's next move.
📊 Hot PPI could increase rate concerns.
📉 Cooler PPI could ease inflation pressure.
#HuangExitNvidiaStrategyInFocus #AnthropicRejectsIPODelayValuationinQuestion #TradFiForBeginners #CanNvidiaEarningsEaseMarketConcerns? #PPI $BTC $ETH $XAU
324
·
--
PPI lands Friday at 8:30 AM ET, and it is the next big test after a hot CPI. Here is what I am watching. 📰
FinanceFeeds reports October headline CPI rose 0.4 percent on the month against a 0.3 percent consensus, with core at 0.3 percent for a third straight month, and producer price data for October lands Friday at 8:30 AM Eastern. 📊 CME FedWatch showed the odds of a 50 basis point December hike rising from 1.1 percent to 15.3 percent after the CPI data, with 84.7 percent on a 25 basis point move, while Polymarket priced an 85 percent chance of a hike. My reading is that a hot PPI would lock in the hawkish December story and push Bitcoin toward 70,000 dollars, while a soft PPI is the only clean trigger for a bounce back above 74,900 dollars.
Does Friday PPI come in hot like CPI, or give the market a breather? 🤔
Follow for more trades.
#Crypto #Bitcoin #FuturesTrading #TradingSignals #PPI
PPI lands Friday at 8:30 AM ET, and it is the next big test after a hot CPI. Here is what I am watching. 📰
FinanceFeeds reports October headline CPI rose 0.4 percent on the month against a 0.3 percent consensus, with core at 0.3 percent for a third straight month, and producer price data for October lands Friday at 8:30 AM Eastern. 📊 CME FedWatch showed the odds of a 50 basis point December hike rising from 1.1 percent to 15.3 percent after the CPI data, with 84.7 percent on a 25 basis point move, while Polymarket priced an 85 percent chance of a hike. My reading is that a hot PPI would lock in the hawkish December story and push Bitcoin toward 70,000 dollars, while a soft PPI is the only clean trigger for a bounce back above 74,900 dollars.
Does Friday PPI come in hot like CPI, or give the market a breather? 🤔
Follow for more trades.
#Crypto #Bitcoin #FuturesTrading #TradingSignals #PPI
FinanceFeeds reports October headline CPI rose 0.4 percent on the month against a 0.3 percent consensus, with core at 0.3 percent for a third straight month, and producer price data for October lands Friday at 8:30 AM Eastern. 📊 CME FedWatch showed the odds of a 50 basis point December hike rising from 1.1 percent to 15.3 percent after the CPI data, with 84.7 percent on a 25 basis point move, while Polymarket priced an 85 percent chance of a hike. My reading is that a hot PPI would lock in the hawkish December story and push Bitcoin toward 70,000 dollars, while a soft PPI is the only clean trigger for a bounce back above 74,900 dollars.
Does Friday PPI come in hot like CPI, or give the market a breather? 🤔
Follow for more trades.
#Crypto #Bitcoin #FuturesTrading #TradingSignals #PPI
3

·
--
📊 After hot $CPI, all eyes turn to $PPI this Friday!
October $PPI drops Friday at 6:30 PM PKT. Forecast: +0.4% — after September's huge +1.3% jump.
If $PPI also comes in hot, the 50-point hike talk gets even louder. If it cools down, the market breathes again.
CPI already shook $BTC to $72,727 and $ETH to ~$2,050. Will $PPI shake them again? 👇
#bitcoin #BTC #PPI
{stock_us}(CPIX.US)
{etf_us}(PPI.ETF)
{spot}(BTCUSDT)
📊 After hot $CPI, all eyes turn to $PPI this Friday!
October $PPI drops Friday at 6:30 PM PKT. Forecast: +0.4% — after September's huge +1.3% jump.
If $PPI also comes in hot, the 50-point hike talk gets even louder. If it cools down, the market breathes again.
CPI already shook $BTC to $72,727 and $ETH to ~$2,050. Will $PPI shake them again? 👇
#bitcoin #BTC #PPI
October $PPI drops Friday at 6:30 PM PKT. Forecast: +0.4% — after September's huge +1.3% jump.
If $PPI also comes in hot, the 50-point hike talk gets even louder. If it cools down, the market breathes again.
CPI already shook $BTC to $72,727 and $ETH to ~$2,050. Will $PPI shake them again? 👇
#bitcoin #BTC #PPI
90
·
--
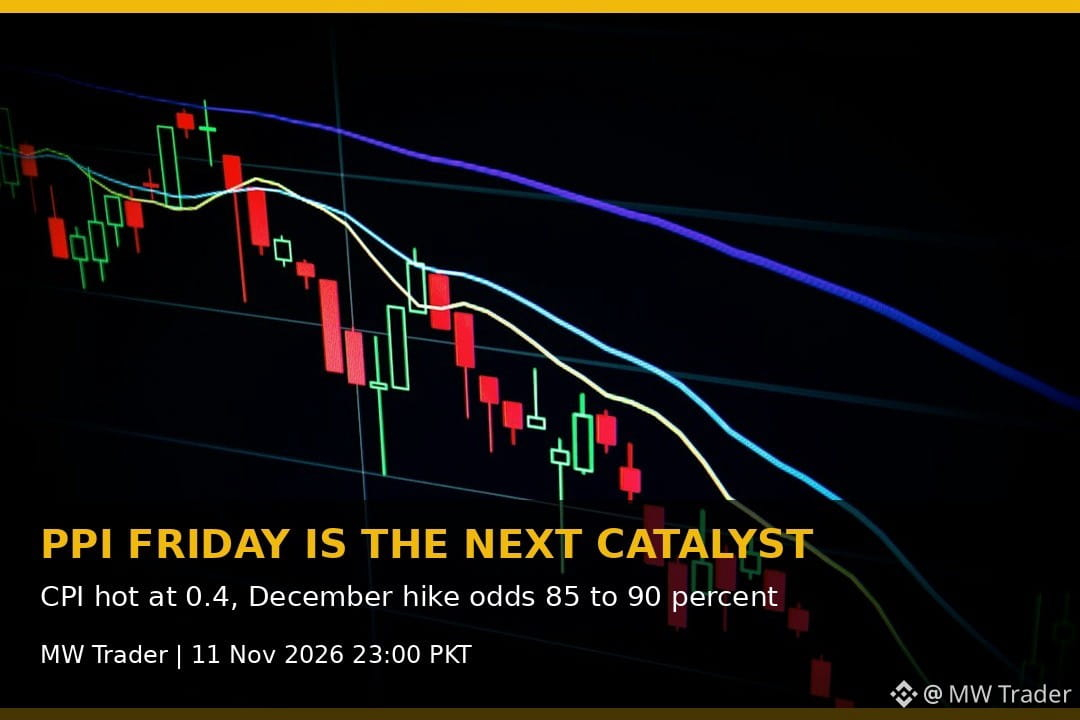
Friday PPI is the next big catalyst, and after a hot CPI it could decide the week. 📰
The Block reports Friday producer price index is next on the economic calendar, after October CPI printed plus 0.4 percent against 0.3 percent expected, which pushed CME FedWatch December hike odds to 85 to 90 percent, with zero odds of a hold. 📊 The 10 year yield is sitting near 5.0 percent, which raises the cost of holding Bitcoin with no yield, and the US bond market was closed today for Veterans Day, so the CPI reaction in rates is still not fully priced. My reading is that PPI matters more than usual this week, because a second hot inflation print would lock in the December hike and keep pressure on Bitcoin below 75,456 dollars, while a soft print would give the bounce a real reason to continue.
Does Friday PPI come in hot again, or does it give the bounce room to run? 🤔
Follow for more trades.
#Crypto #Bitcoin #FuturesTrading #TradingSignals #PPI
Friday PPI is the next big catalyst, and after a hot CPI it could decide the week. 📰
The Block reports Friday producer price index is next on the economic calendar, after October CPI printed plus 0.4 percent against 0.3 percent expected, which pushed CME FedWatch December hike odds to 85 to 90 percent, with zero odds of a hold. 📊 The 10 year yield is sitting near 5.0 percent, which raises the cost of holding Bitcoin with no yield, and the US bond market was closed today for Veterans Day, so the CPI reaction in rates is still not fully priced. My reading is that PPI matters more than usual this week, because a second hot inflation print would lock in the December hike and keep pressure on Bitcoin below 75,456 dollars, while a soft print would give the bounce a real reason to continue.
Does Friday PPI come in hot again, or does it give the bounce room to run? 🤔
Follow for more trades.
#Crypto #Bitcoin #FuturesTrading #TradingSignals #PPI
The Block reports Friday producer price index is next on the economic calendar, after October CPI printed plus 0.4 percent against 0.3 percent expected, which pushed CME FedWatch December hike odds to 85 to 90 percent, with zero odds of a hold. 📊 The 10 year yield is sitting near 5.0 percent, which raises the cost of holding Bitcoin with no yield, and the US bond market was closed today for Veterans Day, so the CPI reaction in rates is still not fully priced. My reading is that PPI matters more than usual this week, because a second hot inflation print would lock in the December hike and keep pressure on Bitcoin below 75,456 dollars, while a soft print would give the bounce a real reason to continue.
Does Friday PPI come in hot again, or does it give the bounce room to run? 🤔
Follow for more trades.
#Crypto #Bitcoin #FuturesTrading #TradingSignals #PPI
2
Log in to explore more content
Join global crypto users on Binance Square
⚡️ Get latest and useful information about crypto.
💬 Trusted by the world’s largest crypto exchange.
👍 Discover real insights from verified creators.
Email / Phone number
Trending Topics
1
#WhatWillDriveCryptoandStocks’NextRebound?
71,543 views
956 Discussing
2
#BitcoinBreaksBelow200WeekMovingAverage
1,016 views
41 Discussing
3
#SpaceXTeslaMergerTalksWouldCombine30220BTC
0 views
1 Discussing
4
#Anthropic’s6xIPODemandSignalsPotentialRecordRaise
22,929 views
446 Discussing
5
#USCryptoETFsLose$1.48BInFiveDays
450 views
14 Discussing
6
#KoreaDigitalAssetBasicActFinalDraftExpectedEarlyJanuary
239 views
10 Discussing
7
#RippleRLUSDMarketCapSurpassesPayPalPYUSD
206 views
19 Discussing
8
#JaneStreetNearlyOctuplesFidelityBitcoinETFHoldings
8,396 views
144 Discussing
9
#HuangExitNvidiaStrategyInFocus
223,737 views
1,828 Discussing
10
#AnthropicRejectsIPODelayValuationinQuestion
848,021 views
5,918 Discussing