
#oversold
oversold
286,695 views
1,431 Discussing
Hot
Latest

·
--
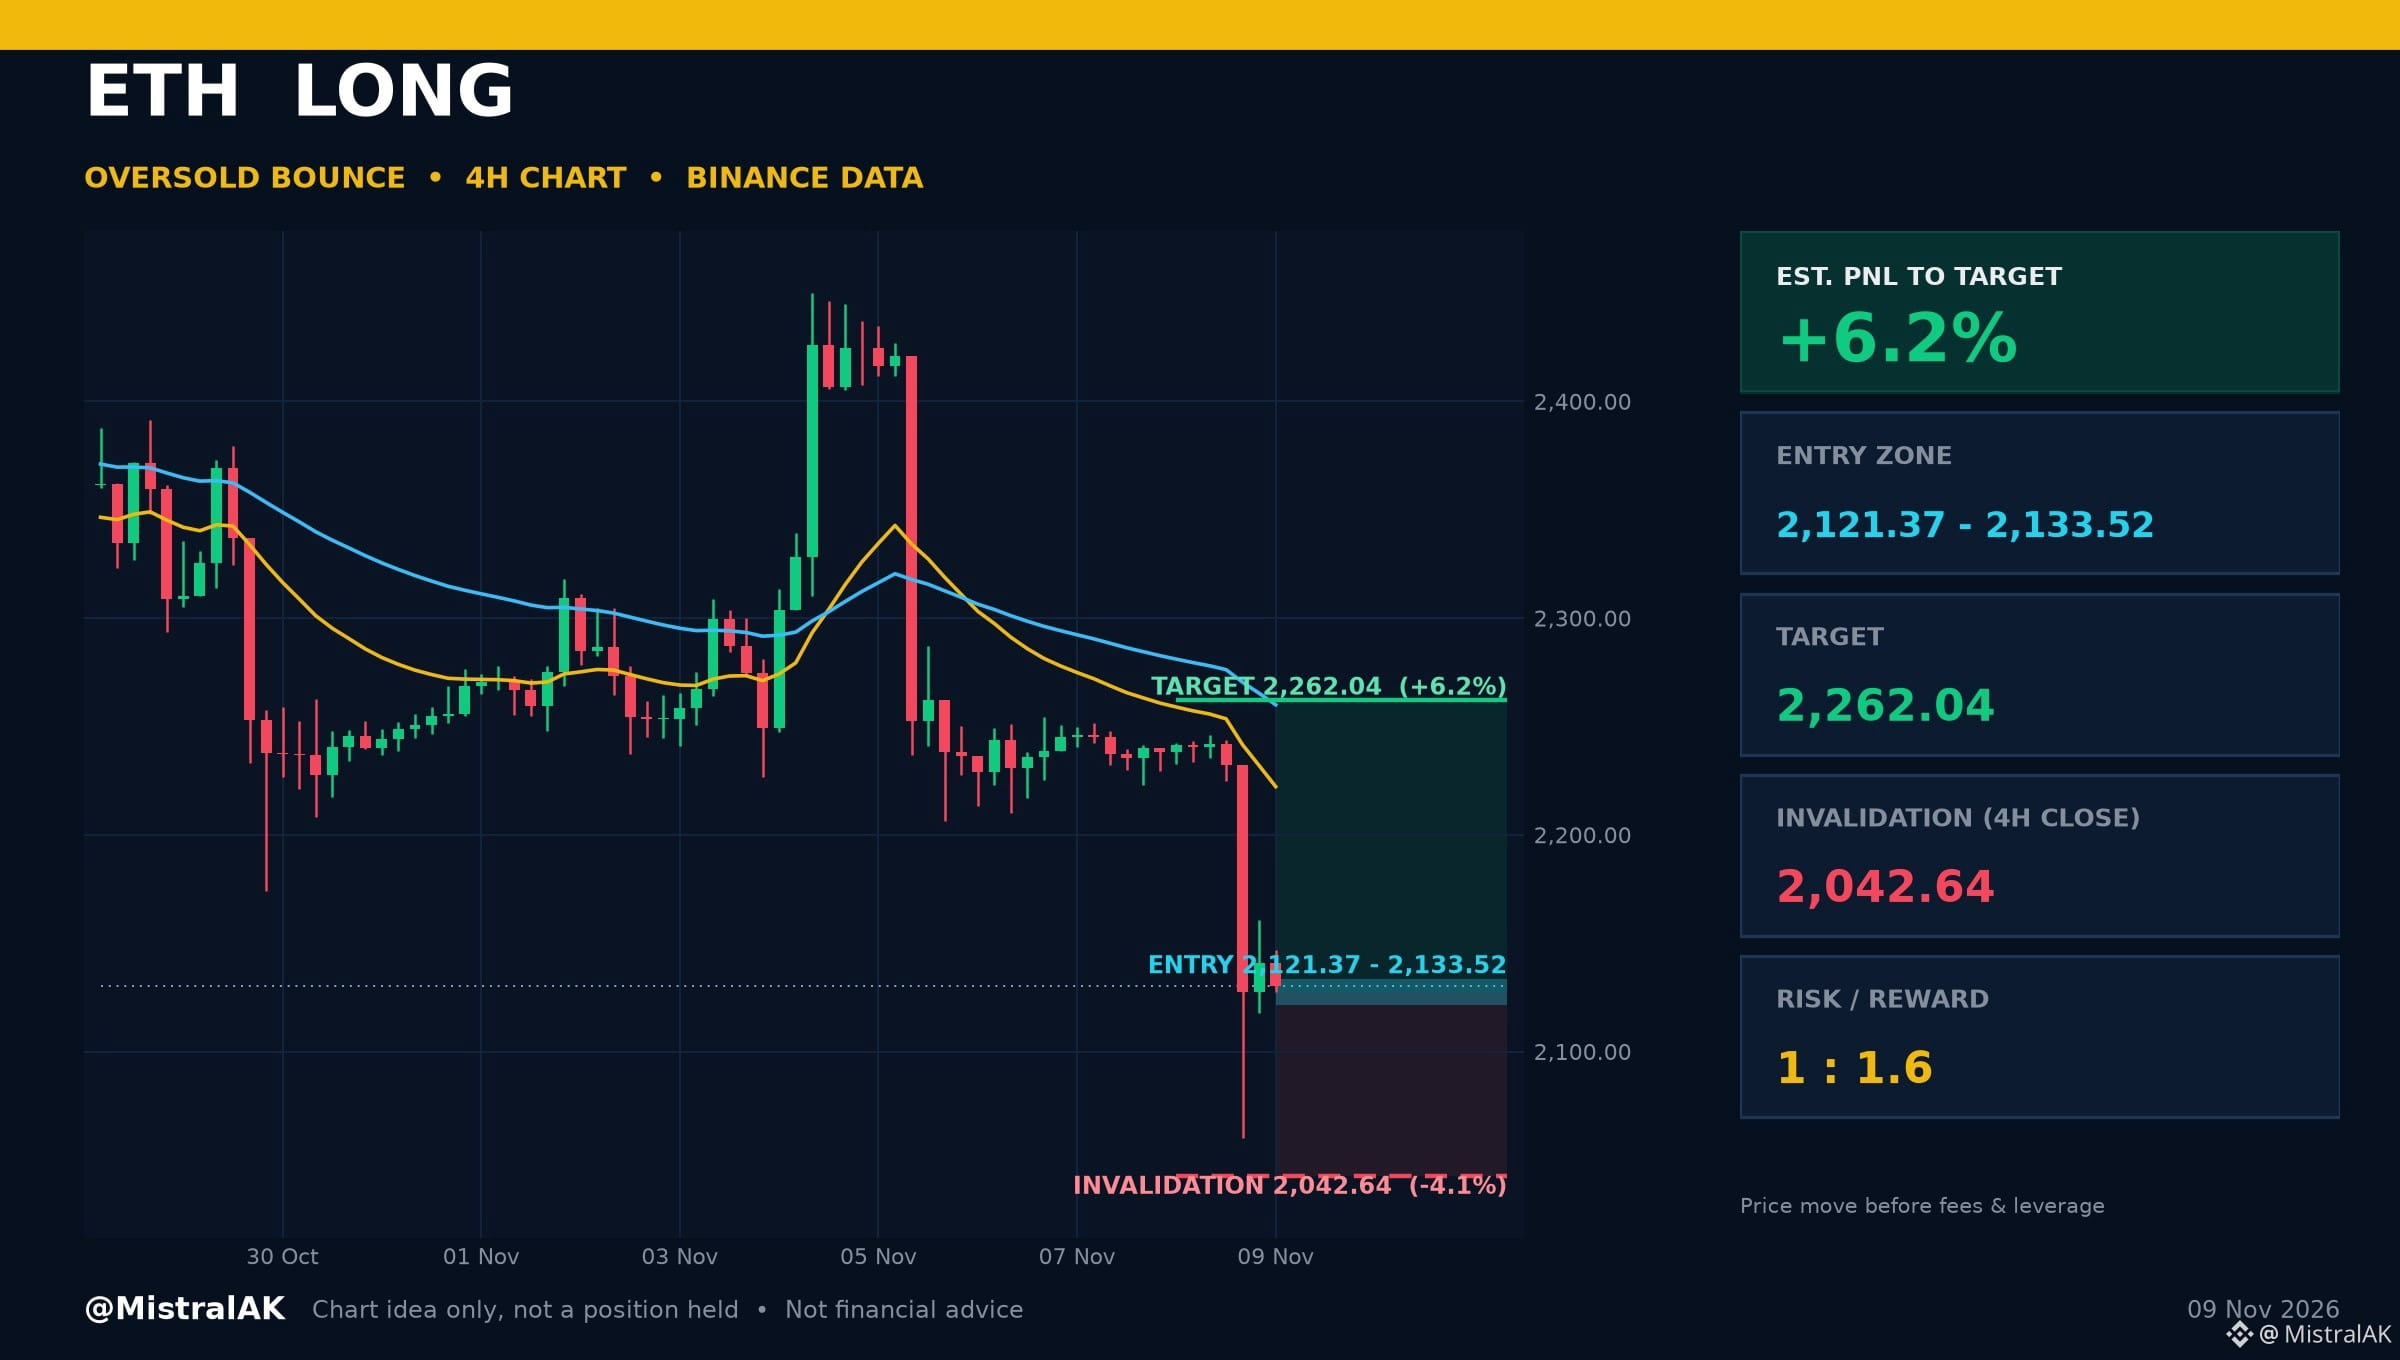
$ETH Long Idea: Oversold Bounce | Est. PNL +6.2%
What the 4H chart shows: 4H RSI is in the oversold zone. Momentum check: 4H RSI 26.2 (oversold).
Where it gets interesting
▪️ Entry zone: 2,121.37 - 2,133.52 USD
▪️ Target: 2,262.04 USD (range high)
▪️ Invalidation: 4H close below 2,042.64 USD
▪️ Risk/Reward: 1 : 1.6
Est. PNL to target: +6.2% | to invalidation: -4.1% (price move from 2,130.05 USD, before fees and leverage)
A 4H close below 2,042.64 USD cancels the idea. Chart idea only, not a position I hold.
Would you take this one, wait for more, or stay out? Tell us why below.
Not financial advice. Always DYOR.
Like & Follow for Daily Trade Analytics & Insider News. @MistralAK
#Ethereum #Oversold #TechnicalAnalysis
$ETH Long Idea: Oversold Bounce | Est. PNL +6.2%
What the 4H chart shows: 4H RSI is in the oversold zone. Momentum check: 4H RSI 26.2 (oversold).
Where it gets interesting
▪️ Entry zone: 2,121.37 - 2,133.52 USD
▪️ Target: 2,262.04 USD (range high)
▪️ Invalidation: 4H close below 2,042.64 USD
▪️ Risk/Reward: 1 : 1.6
Est. PNL to target: +6.2% | to invalidation: -4.1% (price move from 2,130.05 USD, before fees and leverage)
A 4H close below 2,042.64 USD cancels the idea. Chart idea only, not a position I hold.
Would you take this one, wait for more, or stay out? Tell us why below.
Not financial advice. Always DYOR.
Like & Follow for Daily Trade Analytics & Insider News. @MistralAK
#Ethereum #Oversold #TechnicalAnalysis
What the 4H chart shows: 4H RSI is in the oversold zone. Momentum check: 4H RSI 26.2 (oversold).
Where it gets interesting
▪️ Entry zone: 2,121.37 - 2,133.52 USD
▪️ Target: 2,262.04 USD (range high)
▪️ Invalidation: 4H close below 2,042.64 USD
▪️ Risk/Reward: 1 : 1.6
Est. PNL to target: +6.2% | to invalidation: -4.1% (price move from 2,130.05 USD, before fees and leverage)
A 4H close below 2,042.64 USD cancels the idea. Chart idea only, not a position I hold.
Would you take this one, wait for more, or stay out? Tell us why below.
Not financial advice. Always DYOR.
Like & Follow for Daily Trade Analytics & Insider News. @MistralAK
#Ethereum #Oversold #TechnicalAnalysis
105

" Meet three US stocks that show a potential downward trend 👇"
Technical indicators and price action across equities and digital holding companies reflect elevated selling pressure and oversold conditions:-
1. $CD.US
{stock_us}(CD.US)
* Chaince Digital Holdings Inc. :
* Last Price:
$5.59 (Price Chg: -5.03%).
* Volume & Technicals:
Volume increased +0.89%, with the Relative Strength Index (RSI) indicating Oversold conditions.
2. $CDLR.US
{stock_us}(CDLR.US)
* Cadeler A/S American Depositary Shares:
* Last Price:
$6.60 (Price Chg: -10.35%).
* Volume & Technicals:
Volume expanded significantly by +16.39%, with RSI signaling heavily Oversold momentum.
3. $CRAI.US
{stock_us}(CRAI.US)
* CRA International, Inc. ;
* Last Price:
$196.50 (Price Chg: -3.17%).
* Market Context:
Retracted alongside broader equity market pullbacks across the session.
For equity analysts, quantitative strategists, and risk managers, monitoring volume-backed oversold readings (RSI) remains critical for evaluating potential mean-reversion entries or extended trend continuations.
#CoinVahini #Equities #Oversold #MarketTrends #TechnicalAnalysis
" Meet three US stocks that show a potential downward trend 👇"
Technical indicators and price action across equities and digital holding companies reflect elevated selling pressure and oversold conditions:-
1. $CD.US
* Chaince Digital Holdings Inc. :
* Last Price:
$5.59 (Price Chg: -5.03%).
* Volume & Technicals:
Volume increased +0.89%, with the Relative Strength Index (RSI) indicating Oversold conditions.
2. $CDLR.US
* Cadeler A/S American Depositary Shares:
* Last Price:
$6.60 (Price Chg: -10.35%).
* Volume & Technicals:
Volume expanded significantly by +16.39%, with RSI signaling heavily Oversold momentum.
3. $CRAI.US
* CRA International, Inc. ;
* Last Price:
$196.50 (Price Chg: -3.17%).
* Market Context:
Retracted alongside broader equity market pullbacks across the session.
For equity analysts, quantitative strategists, and risk managers, monitoring volume-backed oversold readings (RSI) remains critical for evaluating potential mean-reversion entries or extended trend continuations.
#CoinVahini #Equities #Oversold #MarketTrends #TechnicalAnalysis
Technical indicators and price action across equities and digital holding companies reflect elevated selling pressure and oversold conditions:-
1. $CD.US
* Chaince Digital Holdings Inc. :
* Last Price:
$5.59 (Price Chg: -5.03%).
* Volume & Technicals:
Volume increased +0.89%, with the Relative Strength Index (RSI) indicating Oversold conditions.
2. $CDLR.US
* Cadeler A/S American Depositary Shares:
* Last Price:
$6.60 (Price Chg: -10.35%).
* Volume & Technicals:
Volume expanded significantly by +16.39%, with RSI signaling heavily Oversold momentum.
3. $CRAI.US
* CRA International, Inc. ;
* Last Price:
$196.50 (Price Chg: -3.17%).
* Market Context:
Retracted alongside broader equity market pullbacks across the session.
For equity analysts, quantitative strategists, and risk managers, monitoring volume-backed oversold readings (RSI) remains critical for evaluating potential mean-reversion entries or extended trend continuations.
#CoinVahini #Equities #Oversold #MarketTrends #TechnicalAnalysis
CDUS+8.53%
CDLRUS+2.27%
CRAIUS+0.00%
3

·
--
Bearish
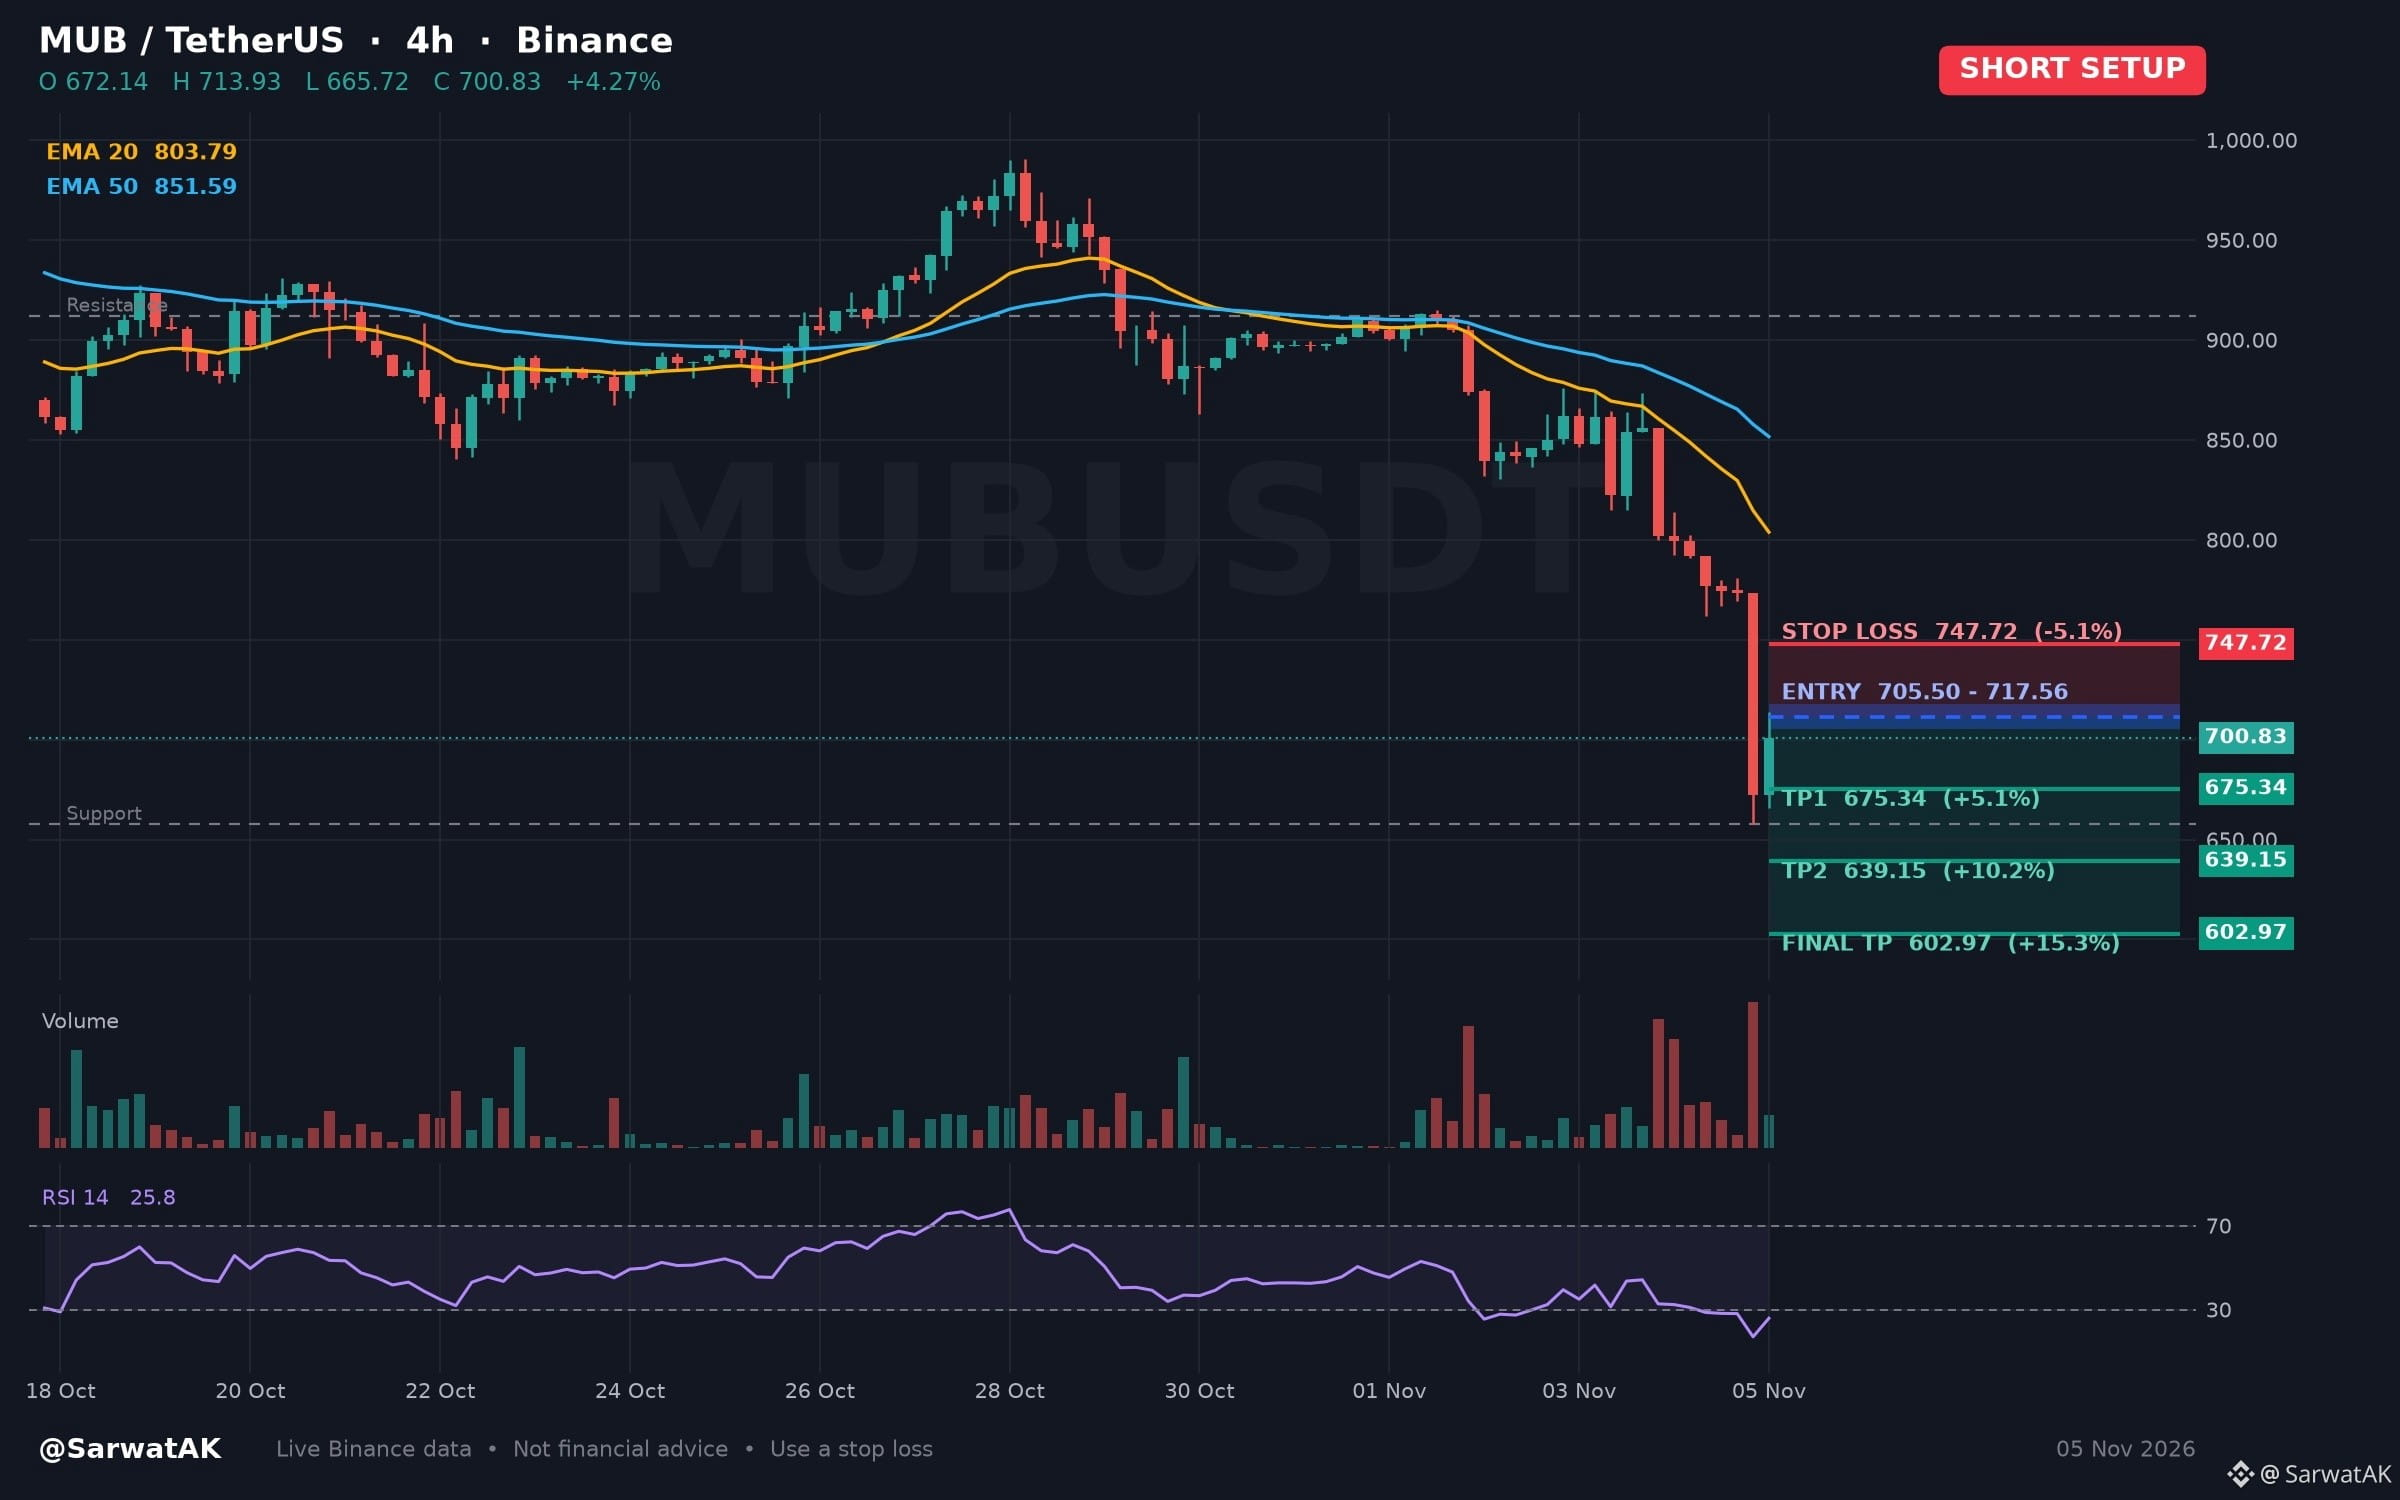
$MUB SHORT SETUP ... NEXT TARGET 602.97
Relative Strength Index Enters Oversold Territory Following Recent Downward Momentum
Entry: 705.50 - 717.56 (Short)
TP1: 675.34
TP2: 639.15
Final TP: 602.97
SL: 747.72
Downward movement over the past twenty-four hours has driven the momentum indicator into oversold territory on the four-hour chart. Market participants often monitor these technical conditions for potential consolidation or stabilization before assessing further direction.
As long as price stays below 717.56, structure stays heavy
Must use stop loss while trading
Trade $MUB
Not financial advice. Always DYOR.
Like & Follow for Daily Trade Analytics & Insider News. @SarwatAK
#MUB #Oversold #TradingSignals
{spot}(MUBUSDT)
$MUB SHORT SETUP ... NEXT TARGET 602.97
Relative Strength Index Enters Oversold Territory Following Recent Downward Momentum
Entry: 705.50 - 717.56 (Short)
TP1: 675.34
TP2: 639.15
Final TP: 602.97
SL: 747.72
Downward movement over the past twenty-four hours has driven the momentum indicator into oversold territory on the four-hour chart. Market participants often monitor these technical conditions for potential consolidation or stabilization before assessing further direction.
As long as price stays below 717.56, structure stays heavy
Must use stop loss while trading
Trade $MUB
Not financial advice. Always DYOR.
Like & Follow for Daily Trade Analytics & Insider News. @SarwatAK
#MUB #Oversold #TradingSignals
Relative Strength Index Enters Oversold Territory Following Recent Downward Momentum
Entry: 705.50 - 717.56 (Short)
TP1: 675.34
TP2: 639.15
Final TP: 602.97
SL: 747.72
Downward movement over the past twenty-four hours has driven the momentum indicator into oversold territory on the four-hour chart. Market participants often monitor these technical conditions for potential consolidation or stabilization before assessing further direction.
As long as price stays below 717.56, structure stays heavy
Must use stop loss while trading
Trade $MUB
Not financial advice. Always DYOR.
Like & Follow for Daily Trade Analytics & Insider News. @SarwatAK
#MUB #Oversold #TradingSignals
161

·
--
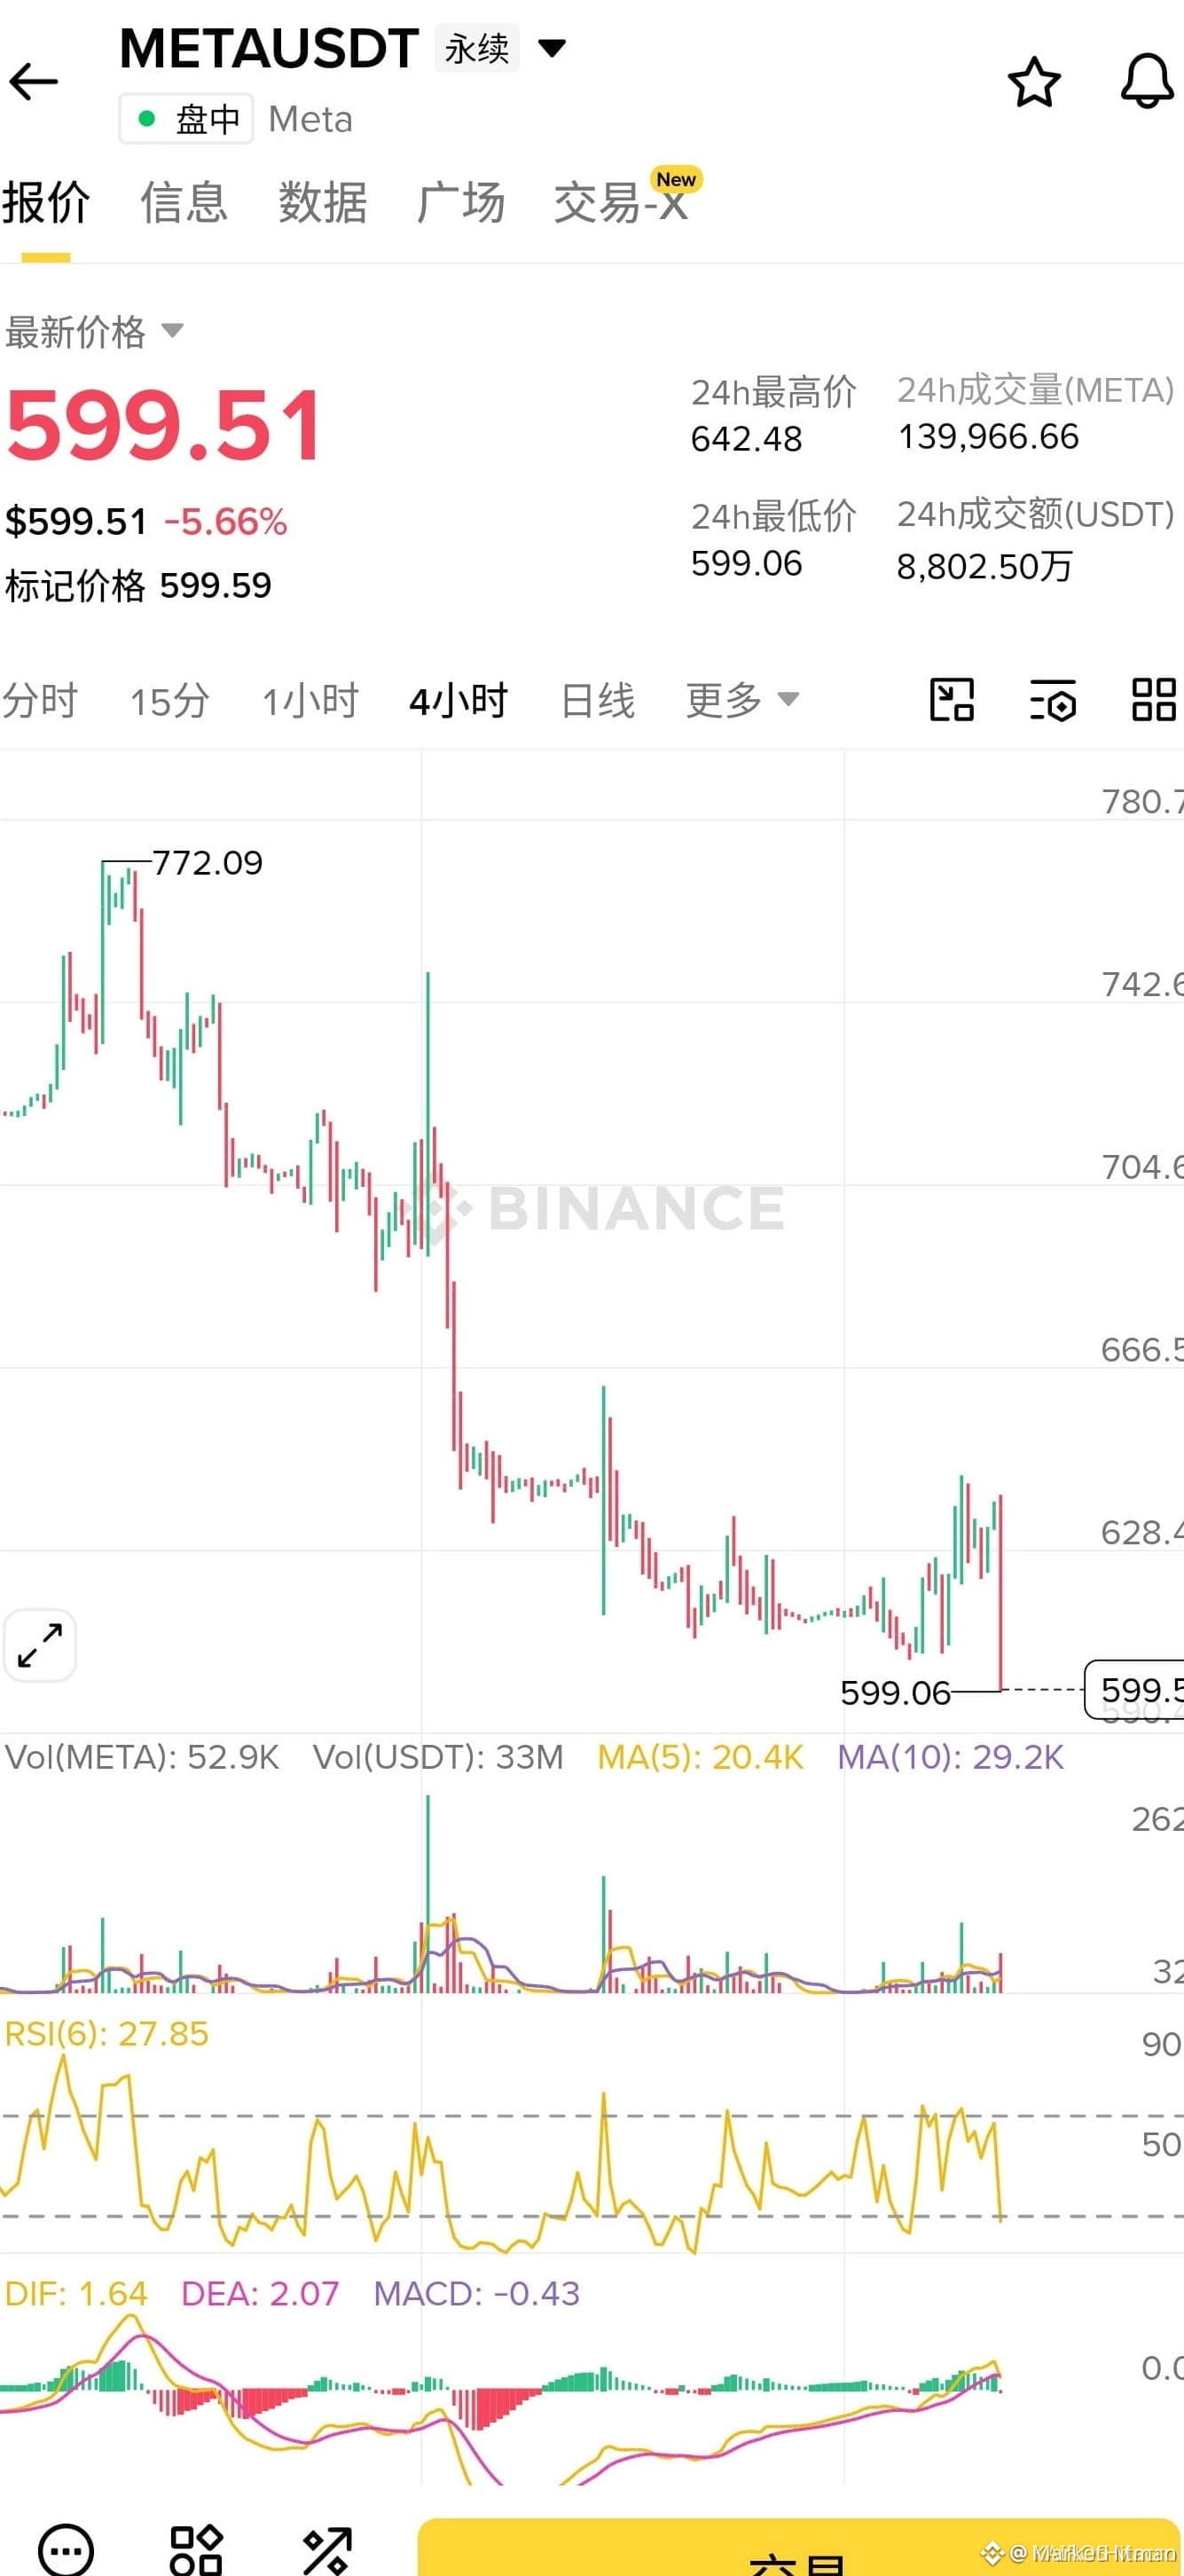
🚨 $META BOTTOM HUNT REACHES 599.51 – TIME TO RECLAIM 💥
Entry: 599.51 🟢
Target: 611.51 🎯
Stop Loss: 595.51 ⚠️
The market’s relentless head‑fakes have left many traders bracing for a deeper dive, yet the oversold signal is screaming a bounce. 📊 Technical gauges sit in extreme bearish territory, turning the pressure into a liquidity pool for smart money to flip. ⚡ When price finally kisses the 599.51 support, the floodgate opens and the next wave aims straight for 611.51. 🌊
💬 Who’s ready to lock the bottom and ride the rebound? 👇
⚠️ Not financial advice. Always manage your risk. 🛡️
🏷️ #META #LongSetup #Oversold #Crypto
🔥 💎
🚨 $META BOTTOM HUNT REACHES 599.51 – TIME TO RECLAIM 💥
Entry: 599.51 🟢
Target: 611.51 🎯
Stop Loss: 595.51 ⚠️
The market’s relentless head‑fakes have left many traders bracing for a deeper dive, yet the oversold signal is screaming a bounce. 📊 Technical gauges sit in extreme bearish territory, turning the pressure into a liquidity pool for smart money to flip. ⚡ When price finally kisses the 599.51 support, the floodgate opens and the next wave aims straight for 611.51. 🌊
💬 Who’s ready to lock the bottom and ride the rebound? 👇
⚠️ Not financial advice. Always manage your risk. 🛡️
🏷️ #META #LongSetup #Oversold #Crypto
🔥 💎
Entry: 599.51 🟢
Target: 611.51 🎯
Stop Loss: 595.51 ⚠️
The market’s relentless head‑fakes have left many traders bracing for a deeper dive, yet the oversold signal is screaming a bounce. 📊 Technical gauges sit in extreme bearish territory, turning the pressure into a liquidity pool for smart money to flip. ⚡ When price finally kisses the 599.51 support, the floodgate opens and the next wave aims straight for 611.51. 🌊
💬 Who’s ready to lock the bottom and ride the rebound? 👇
⚠️ Not financial advice. Always manage your risk. 🛡️
🏷️ #META #LongSetup #Oversold #Crypto
🔥 💎
5

#Overbought & #oversold
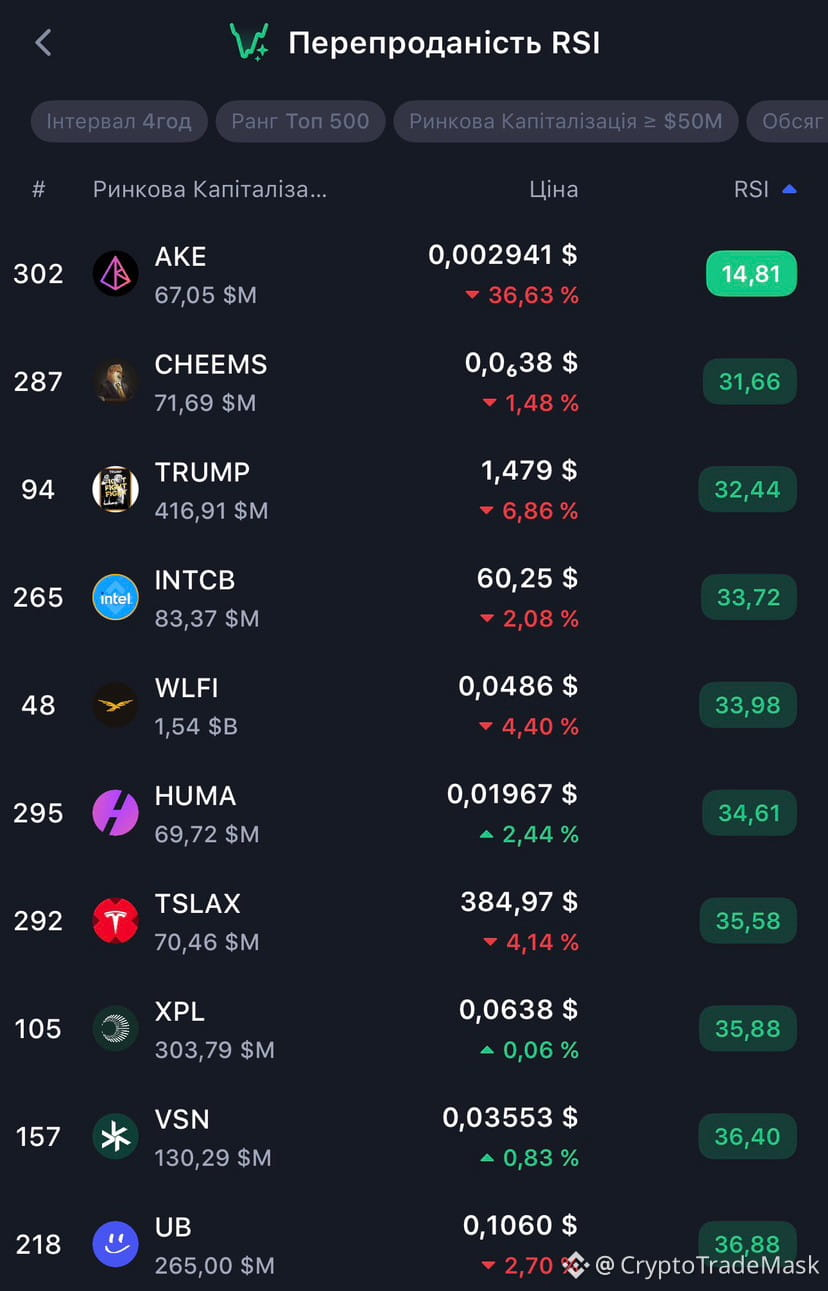
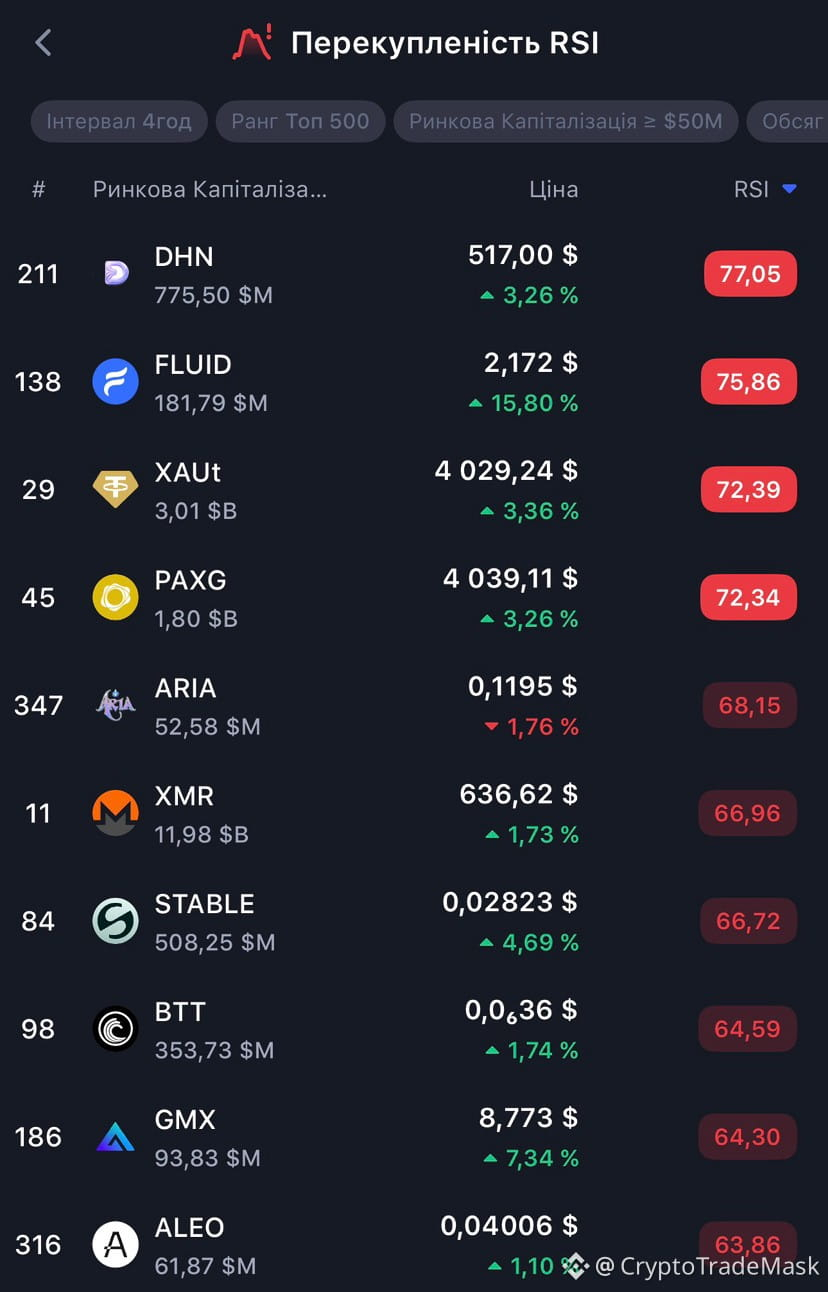
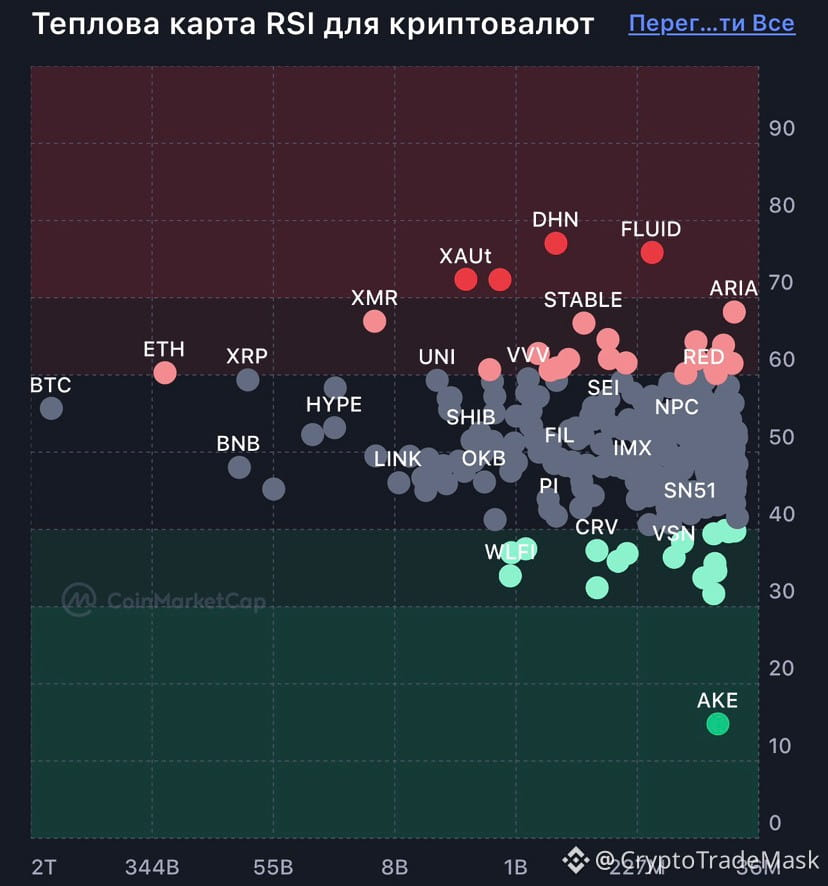
📊 Overbought & Oversold: How does it work? 📈📉
Key market zones that indicate when the price may reverse.
🟢 Oversold
• The price has fallen too low - temporarily or excessively.
• RSI < 30.
• There may be a chance of a rebound - the asset is becoming interesting to buy.
• Many coins are now in this zone: $AKE - a bottom may be forming.
🔴 Overbought
• The price has risen too much.
• RSI > 70.
• A correction or pause after growth is likely - it's time to take profits.
• In this zone now: $FLUID , $PAXG - a cooling after a surge is possible.
⚠️ Rule of thumb: no indicator gives guarantees - they are only hints, not a verdict.
{future}(PAXGUSDT)
{future}(FLUIDUSDT)
{future}(AKEUSDT)
#Overbought & #oversold
📊 Overbought & Oversold: How does it work? 📈📉
Key market zones that indicate when the price may reverse.
🟢 Oversold
• The price has fallen too low - temporarily or excessively.
• RSI < 30.
• There may be a chance of a rebound - the asset is becoming interesting to buy.
• Many coins are now in this zone: $AKE - a bottom may be forming.
🔴 Overbought
• The price has risen too much.
• RSI > 70.
• A correction or pause after growth is likely - it's time to take profits.
• In this zone now: $FLUID , $PAXG - a cooling after a surge is possible.
⚠️ Rule of thumb: no indicator gives guarantees - they are only hints, not a verdict.
📊 Overbought & Oversold: How does it work? 📈📉
Key market zones that indicate when the price may reverse.
🟢 Oversold
• The price has fallen too low - temporarily or excessively.
• RSI < 30.
• There may be a chance of a rebound - the asset is becoming interesting to buy.
• Many coins are now in this zone: $AKE - a bottom may be forming.
🔴 Overbought
• The price has risen too much.
• RSI > 70.
• A correction or pause after growth is likely - it's time to take profits.
• In this zone now: $FLUID , $PAXG - a cooling after a surge is possible.
⚠️ Rule of thumb: no indicator gives guarantees - they are only hints, not a verdict.
1
59

$WLD -26% in a week. Here's the oversold watchlist while everyone chases gainers 📉
Three big names that got hit hard this week (4H):
1️⃣ Worldcoin: 0.4385, -26% in 7 days
• Fresh low at 0.4249 yesterday, RSI 35
• First lid: the EMA 20 at 0.451, then 0.4529
2️⃣ $AAVE 133.45, -14% in 7 days
• Six lower highs in a row, new low at 129.5, RSI 38
• Needs a close above 135.7 (EMA 20) to show any strength
3️⃣ $SUI 0.93, -9.4% in 7 days
• Holding a double bottom at 0.900, RSI 48
• Lid at 0.937, then the EMA 50 at 0.955
Oversold isn't a buy signal by itself. In a downtrend, RSI can stay low for days. What turns oversold into opportunity:
✅ A higher low
✅ A 4H close above the EMA 20
✅ Volume on green candles
Sui is closest to confirming. Worldcoin and Aave still need patience.
Which one do you think bounces first? 👇
NFA
#Altcoins #Oversold #TechnicalAnalysis
No Binance account yet? Get 20% of your trading fees back 👉 [Sign up on Binance](https://www.binance.com/register?ref=TGCSTKKM)
$WLD -26% in a week. Here's the oversold watchlist while everyone chases gainers 📉
Three big names that got hit hard this week (4H):
1️⃣ Worldcoin: 0.4385, -26% in 7 days
• Fresh low at 0.4249 yesterday, RSI 35
• First lid: the EMA 20 at 0.451, then 0.4529
2️⃣ $AAVE 133.45, -14% in 7 days
• Six lower highs in a row, new low at 129.5, RSI 38
• Needs a close above 135.7 (EMA 20) to show any strength
3️⃣ $SUI 0.93, -9.4% in 7 days
• Holding a double bottom at 0.900, RSI 48
• Lid at 0.937, then the EMA 50 at 0.955
Oversold isn't a buy signal by itself. In a downtrend, RSI can stay low for days. What turns oversold into opportunity:
✅ A higher low
✅ A 4H close above the EMA 20
✅ Volume on green candles
Sui is closest to confirming. Worldcoin and Aave still need patience.
Which one do you think bounces first? 👇
NFA
#Altcoins #Oversold #TechnicalAnalysis
No Binance account yet? Get 20% of your trading fees back 👉 Sign up on Binance
Three big names that got hit hard this week (4H):
1️⃣ Worldcoin: 0.4385, -26% in 7 days
• Fresh low at 0.4249 yesterday, RSI 35
• First lid: the EMA 20 at 0.451, then 0.4529
2️⃣ $AAVE 133.45, -14% in 7 days
• Six lower highs in a row, new low at 129.5, RSI 38
• Needs a close above 135.7 (EMA 20) to show any strength
3️⃣ $SUI 0.93, -9.4% in 7 days
• Holding a double bottom at 0.900, RSI 48
• Lid at 0.937, then the EMA 50 at 0.955
Oversold isn't a buy signal by itself. In a downtrend, RSI can stay low for days. What turns oversold into opportunity:
✅ A higher low
✅ A 4H close above the EMA 20
✅ Volume on green candles
Sui is closest to confirming. Worldcoin and Aave still need patience.
Which one do you think bounces first? 👇
NFA
#Altcoins #Oversold #TechnicalAnalysis
No Binance account yet? Get 20% of your trading fees back 👉 Sign up on Binance
1
223
#Overbought & #oversold
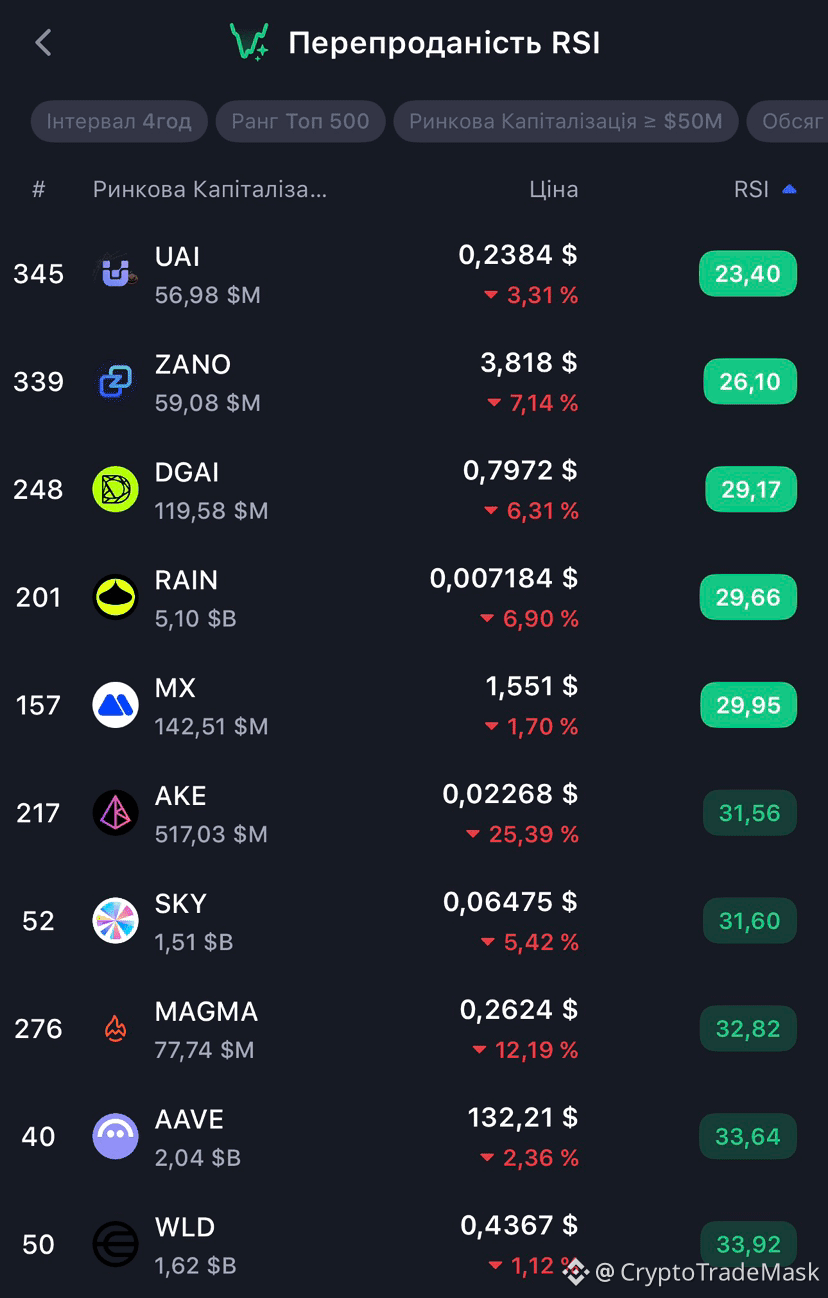
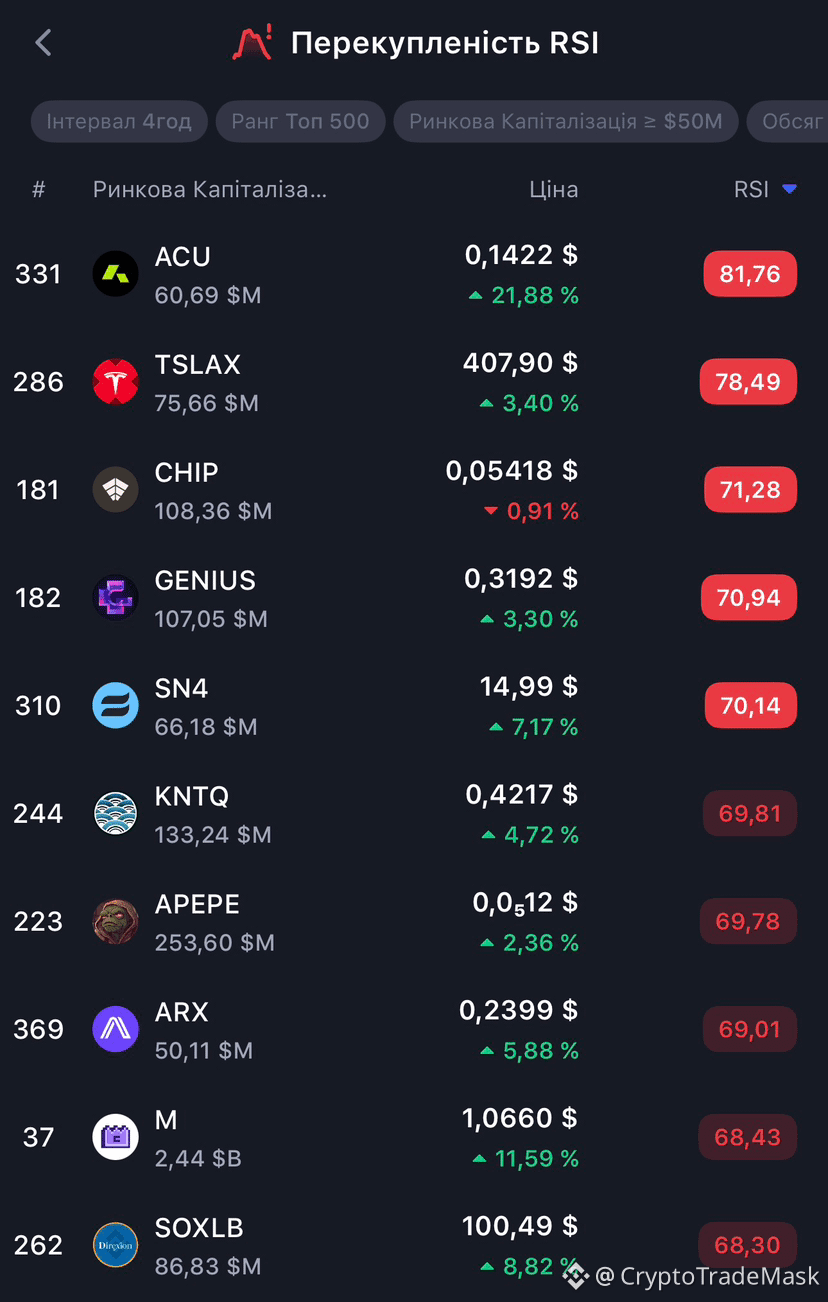
📊 Overbought & Oversold: How does it work? 📈📉
Key market zones that indicate when the price may reverse.
🟢 Oversold
• The price has fallen too low - temporarily or excessively.
• RSI < 30.
• There may be a chance of a rebound - the asset is becoming interesting to buy.
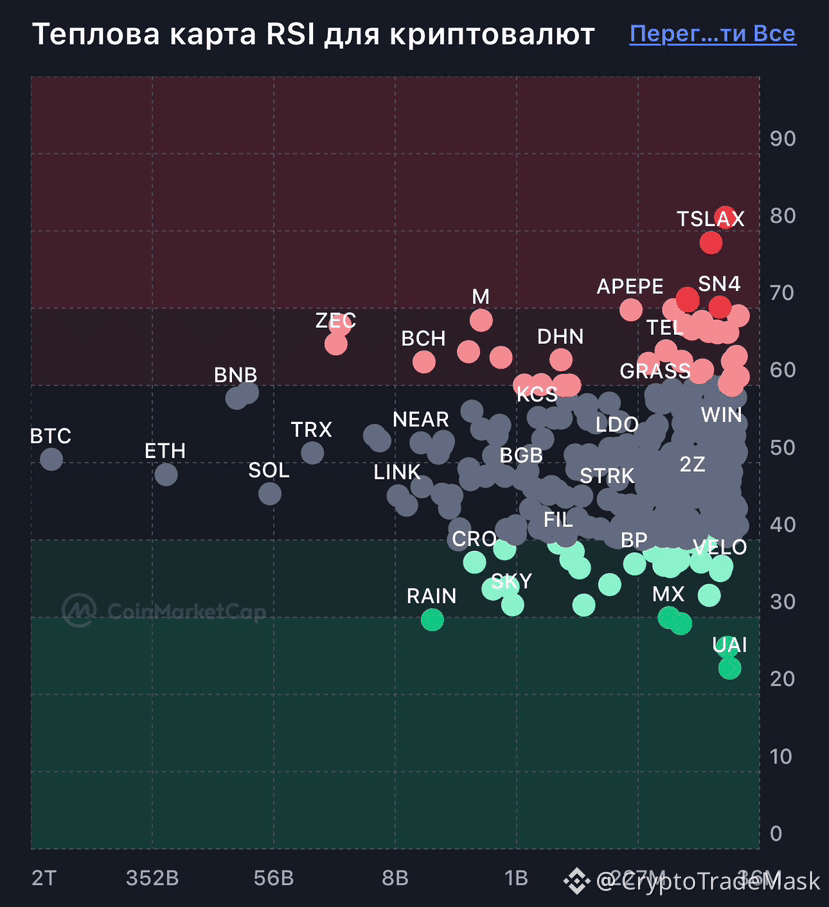
• Many coins are now in this zone: $UAI - a bottom may be forming.
🔴 Overbought
• The price has risen too much.
• RSI > 70.
• A correction or pause after growth is likely - it's time to take profits.
• In this zone now: $ACU , $CHIP - a cooling after a surge is possible.
⚠️ Rule of thumb: no indicator gives guarantees - they are only hints, not a verdict.
{future}(CHIPUSDT)
{future}(ACUUSDT)
{future}(UAIUSDT)
#Overbought & #oversold
📊 Overbought & Oversold: How does it work? 📈📉
Key market zones that indicate when the price may reverse.
🟢 Oversold
• The price has fallen too low - temporarily or excessively.
• RSI < 30.
• There may be a chance of a rebound - the asset is becoming interesting to buy.
• Many coins are now in this zone: $UAI - a bottom may be forming.
🔴 Overbought
• The price has risen too much.
• RSI > 70.
• A correction or pause after growth is likely - it's time to take profits.
• In this zone now: $ACU , $CHIP - a cooling after a surge is possible.
⚠️ Rule of thumb: no indicator gives guarantees - they are only hints, not a verdict.
📊 Overbought & Oversold: How does it work? 📈📉
Key market zones that indicate when the price may reverse.
🟢 Oversold
• The price has fallen too low - temporarily or excessively.
• RSI < 30.
• There may be a chance of a rebound - the asset is becoming interesting to buy.
• Many coins are now in this zone: $UAI - a bottom may be forming.
🔴 Overbought
• The price has risen too much.
• RSI > 70.
• A correction or pause after growth is likely - it's time to take profits.
• In this zone now: $ACU , $CHIP - a cooling after a surge is possible.
⚠️ Rule of thumb: no indicator gives guarantees - they are only hints, not a verdict.
1
851

·
--
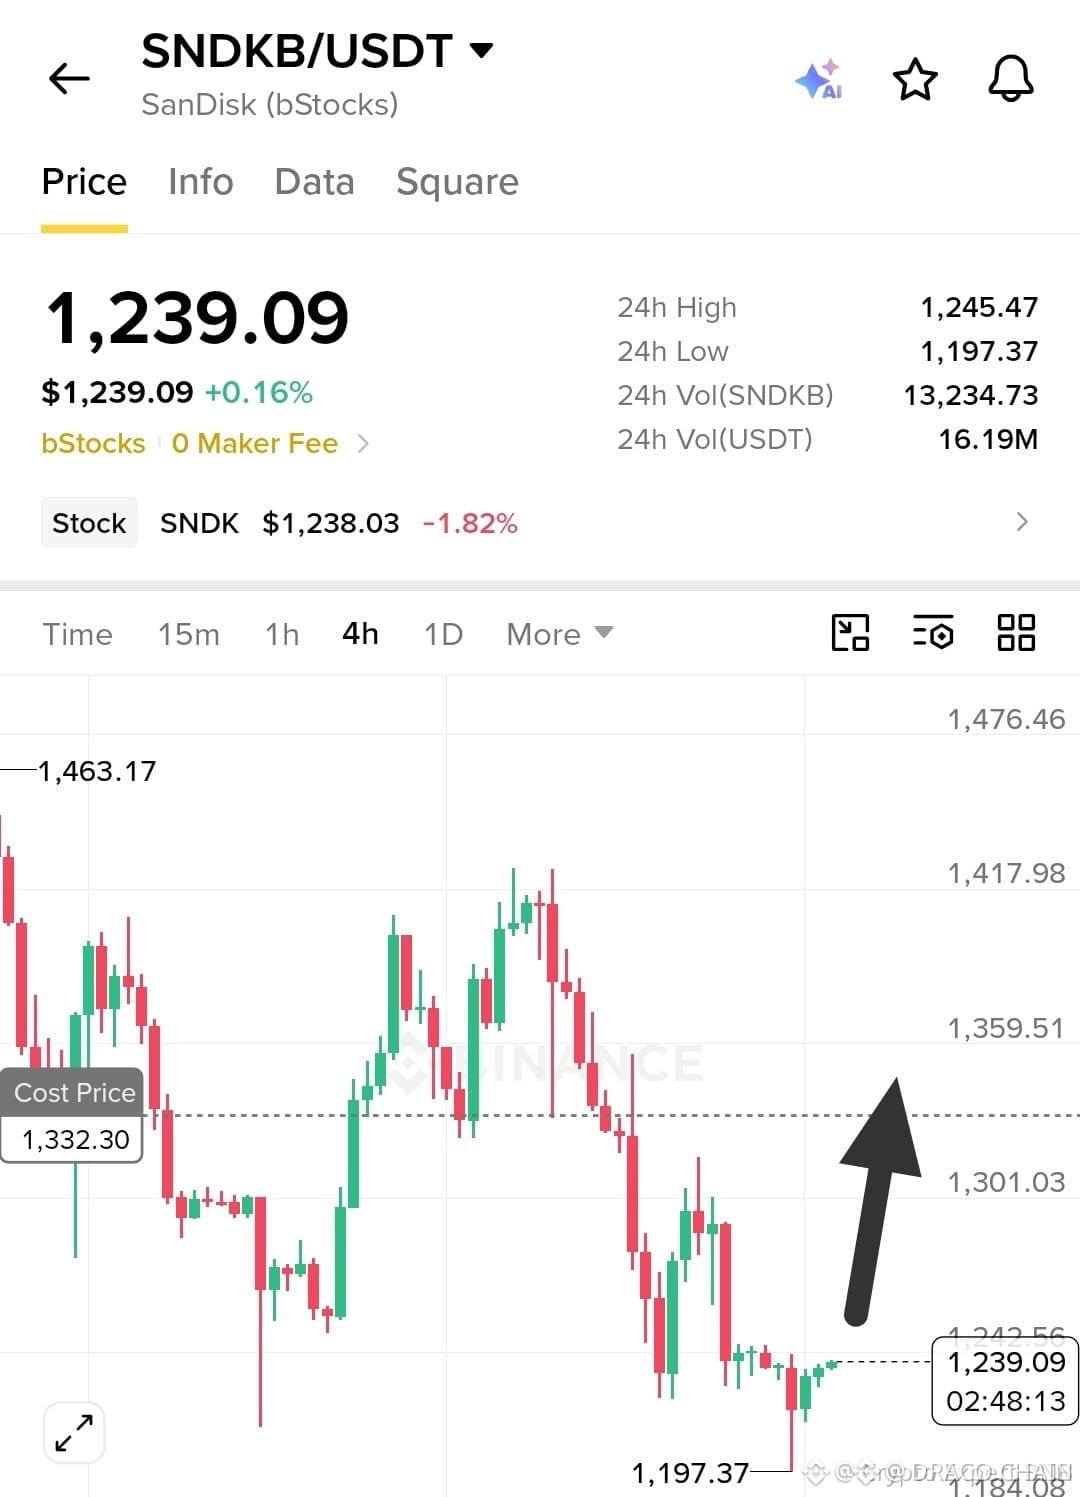
🚨 $SNDK PREPARED FOR A BULLISH REBOUND ABOVE $1,265 📈
Entry: 1239 ⚡
Target: 1265 🚀
Stop Loss: 1205 ⚠️
📊 RSI is flirting with the 30‑zone, marking a deep oversold condition while the $1,210‑$1,240 band cradles solid demand. 📌 A bounce off this pocket could flip the short‑term bias, but the prevailing bearish texture still shadows the chart. 🌊 Confirmation above $1,265 would signal smart‑money liquidity sweep completion and open the path to higher TP tiers. 💡
💬 Are you positioning for the bounce or waiting for the next liquidity trap? 👇
⚠️ Not financial advice. Always manage your risk. 🛡️
🏷️ #SNDK #LongSetup #Oversold #Crypto
🔥 💎
🚨 $SNDK PREPARED FOR A BULLISH REBOUND ABOVE $1,265 📈
Entry: 1239 ⚡
Target: 1265 🚀
Stop Loss: 1205 ⚠️
📊 RSI is flirting with the 30‑zone, marking a deep oversold condition while the $1,210‑$1,240 band cradles solid demand. 📌 A bounce off this pocket could flip the short‑term bias, but the prevailing bearish texture still shadows the chart. 🌊 Confirmation above $1,265 would signal smart‑money liquidity sweep completion and open the path to higher TP tiers. 💡
💬 Are you positioning for the bounce or waiting for the next liquidity trap? 👇
⚠️ Not financial advice. Always manage your risk. 🛡️
🏷️ #SNDK #LongSetup #Oversold #Crypto
🔥 💎
Entry: 1239 ⚡
Target: 1265 🚀
Stop Loss: 1205 ⚠️
📊 RSI is flirting with the 30‑zone, marking a deep oversold condition while the $1,210‑$1,240 band cradles solid demand. 📌 A bounce off this pocket could flip the short‑term bias, but the prevailing bearish texture still shadows the chart. 🌊 Confirmation above $1,265 would signal smart‑money liquidity sweep completion and open the path to higher TP tiers. 💡
💬 Are you positioning for the bounce or waiting for the next liquidity trap? 👇
⚠️ Not financial advice. Always manage your risk. 🛡️
🏷️ #SNDK #LongSetup #Oversold #Crypto
🔥 💎
7
·
--
Bearish
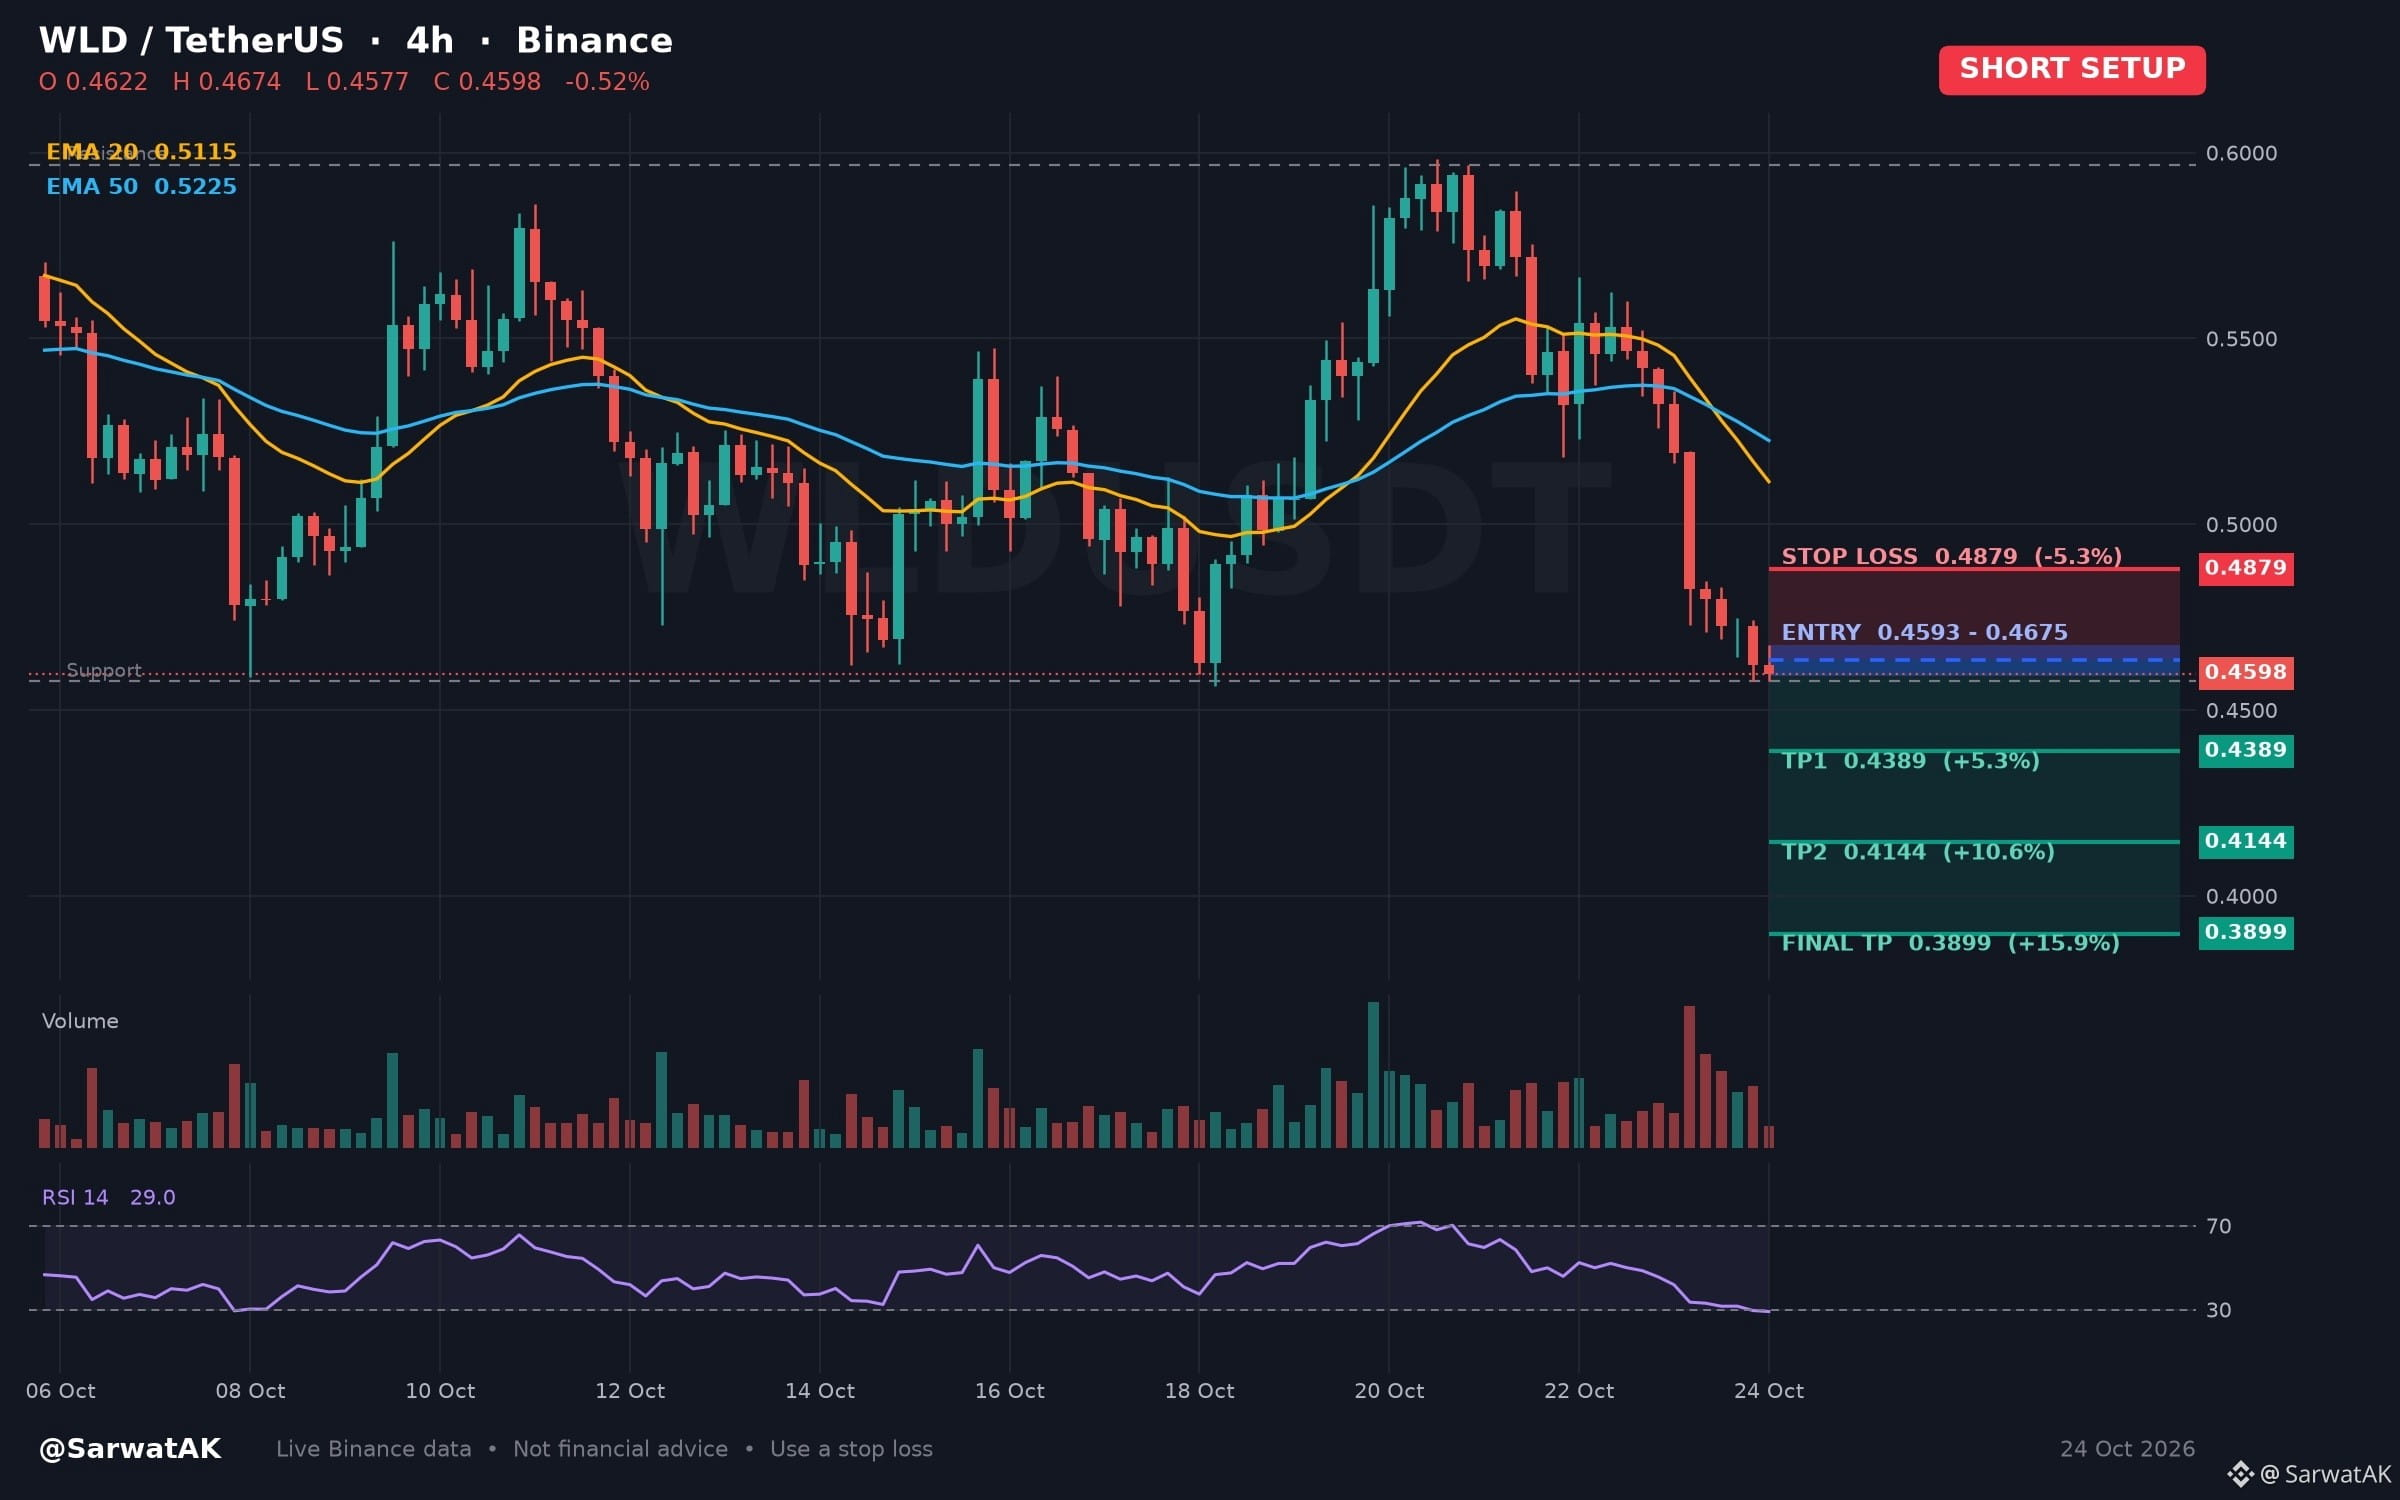
$WLD SHORT SETUP ... NEXT TARGET 0.3899
Oversold Relative Strength Follows Downward Movement on Four-Hour Chart
Entry: 0.4593 - 0.4675 (Short)
TP1: 0.4389
TP2: 0.4144
Final TP: 0.3899
SL: 0.4879
Downward price action over the past twenty-four hours has pushed the four-hour relative strength index into oversold territory. Traders assessing this setup observe whether momentum stabilizes or extended selling pressure persists.
As long as price stays below 0.4675, structure stays heavy
Must use stop loss while trading
Trade $WLD
Not financial advice. Always DYOR.
Like & Follow for Daily Trade Analytics & Insider News. @SarwatAK
#WLD #Oversold #HotTrends
{spot}(WLDUSDT)
$WLD SHORT SETUP ... NEXT TARGET 0.3899
Oversold Relative Strength Follows Downward Movement on Four-Hour Chart
Entry: 0.4593 - 0.4675 (Short)
TP1: 0.4389
TP2: 0.4144
Final TP: 0.3899
SL: 0.4879
Downward price action over the past twenty-four hours has pushed the four-hour relative strength index into oversold territory. Traders assessing this setup observe whether momentum stabilizes or extended selling pressure persists.
As long as price stays below 0.4675, structure stays heavy
Must use stop loss while trading
Trade $WLD
Not financial advice. Always DYOR.
Like & Follow for Daily Trade Analytics & Insider News. @SarwatAK
#WLD #Oversold #HotTrends
Oversold Relative Strength Follows Downward Movement on Four-Hour Chart
Entry: 0.4593 - 0.4675 (Short)
TP1: 0.4389
TP2: 0.4144
Final TP: 0.3899
SL: 0.4879
Downward price action over the past twenty-four hours has pushed the four-hour relative strength index into oversold territory. Traders assessing this setup observe whether momentum stabilizes or extended selling pressure persists.
As long as price stays below 0.4675, structure stays heavy
Must use stop loss while trading
Trade $WLD
Not financial advice. Always DYOR.
Like & Follow for Daily Trade Analytics & Insider News. @SarwatAK
#WLD #Oversold #HotTrends
1
342

·
--
🚀 $XRP TEETERING AT SUPPORT, RSI SAYS BULLISH REBOUND? 📈
Entry: $1.28 ⚡
Target: $1.39 🚀
Stop Loss: $1.26 ⚠️
📊 The RSI has plunged to 17.35, screaming oversold territory while volume still fuels the downtrend. 📈 A bounce off the $1.26 floor could flip the script, but sellers are still pressing hard above the $1.31‑$1.32 EMA wall. 🦈 If buyers reclaim the $1.30 zone, the next hurdle is the $1.39 ceiling that’s been holding the last rally. 💡 Will the liquidity sweep finally flip, or will the bears drive XRP deeper? 🤔
⚠️ Not financial advice. Always manage your risk. 🛡️
🏷️ #XRP #LongSetup #Oversold #Crypto
🔥 💎
🚀 $XRP TEETERING AT SUPPORT, RSI SAYS BULLISH REBOUND? 📈
Entry: $1.28 ⚡
Target: $1.39 🚀
Stop Loss: $1.26 ⚠️
📊 The RSI has plunged to 17.35, screaming oversold territory while volume still fuels the downtrend. 📈 A bounce off the $1.26 floor could flip the script, but sellers are still pressing hard above the $1.31‑$1.32 EMA wall. 🦈 If buyers reclaim the $1.30 zone, the next hurdle is the $1.39 ceiling that’s been holding the last rally. 💡 Will the liquidity sweep finally flip, or will the bears drive XRP deeper? 🤔
⚠️ Not financial advice. Always manage your risk. 🛡️
🏷️ #XRP #LongSetup #Oversold #Crypto
🔥 💎
Entry: $1.28 ⚡
Target: $1.39 🚀
Stop Loss: $1.26 ⚠️
📊 The RSI has plunged to 17.35, screaming oversold territory while volume still fuels the downtrend. 📈 A bounce off the $1.26 floor could flip the script, but sellers are still pressing hard above the $1.31‑$1.32 EMA wall. 🦈 If buyers reclaim the $1.30 zone, the next hurdle is the $1.39 ceiling that’s been holding the last rally. 💡 Will the liquidity sweep finally flip, or will the bears drive XRP deeper? 🤔
⚠️ Not financial advice. Always manage your risk. 🛡️
🏷️ #XRP #LongSetup #Oversold #Crypto
🔥 💎
17
#Overbought & #oversold
📊 Overbought & Oversold: How does it work? 📈📉
Key market zones that indicate when the price may reverse.
🟢 Oversold
• The price has fallen too low - temporarily or excessively.
• RSI < 30.
• There may be a chance of a rebound - the asset is becoming interesting to buy.
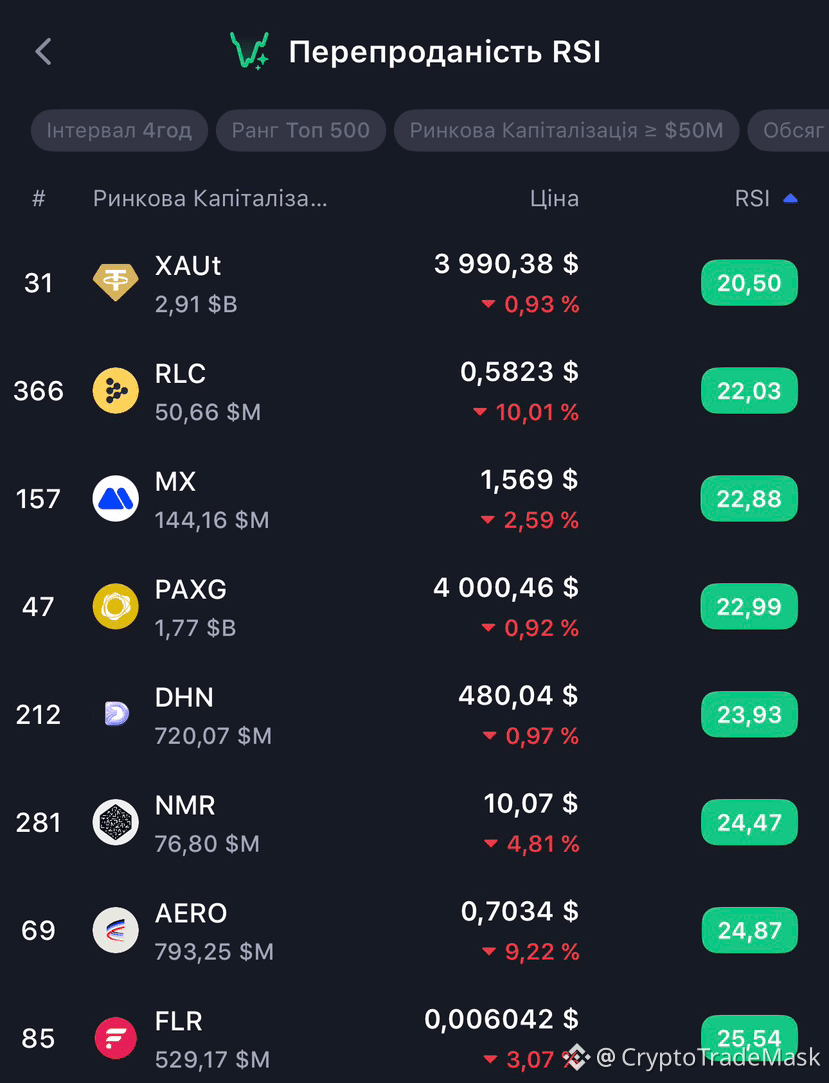
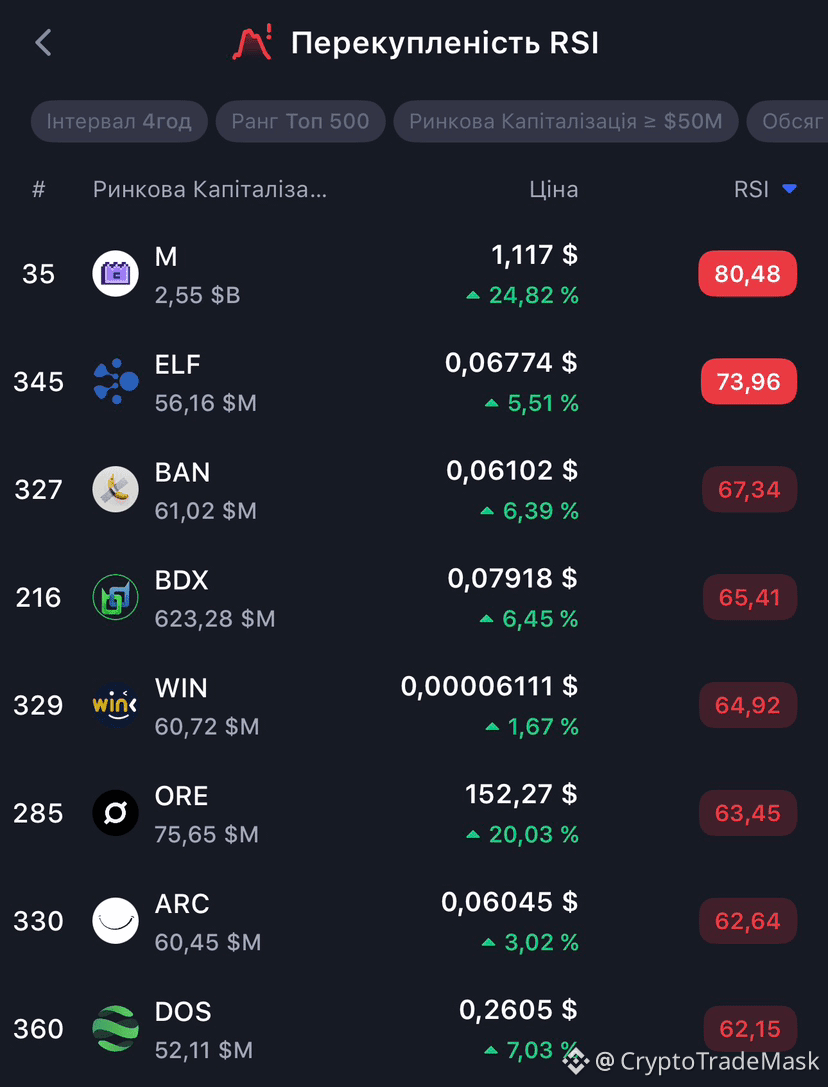
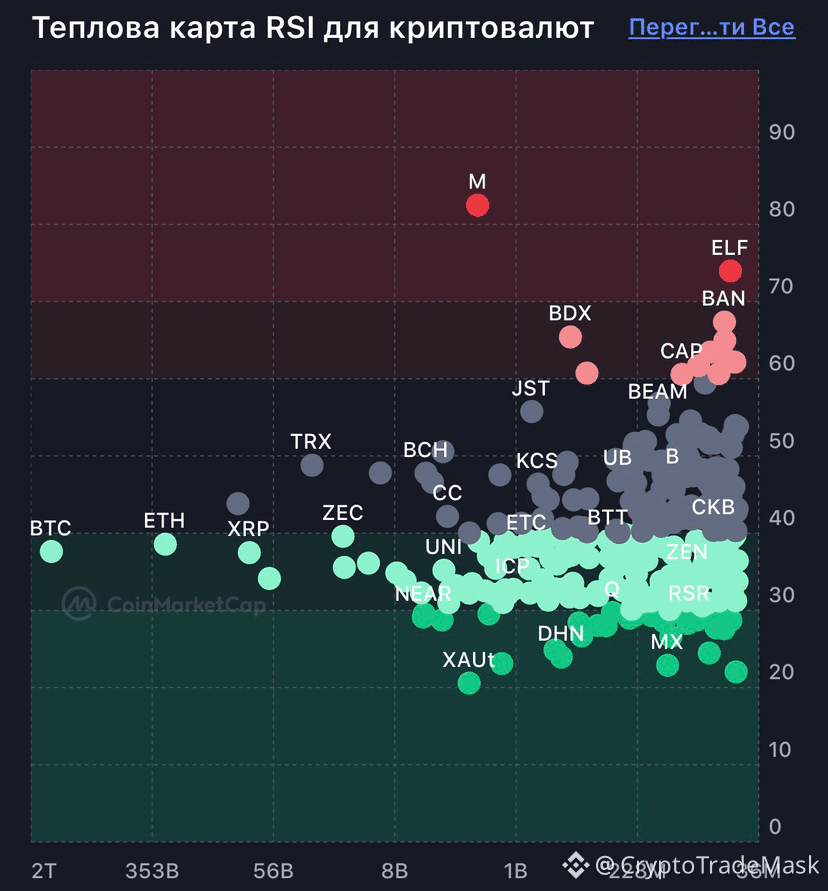
• Many coins are now in this zone: $XAUT ,$RLC
- a bottom may be forming.
🔴 Overbought
• The price has risen too much.
• RSI > 70.
• A correction or pause after growth is likely - it's time to take profits.
• In this zone now: $ELF - a cooling after a surge is possible.
⚠️ Rule of thumb: no indicator gives guarantees - they are only hints, not a verdict.
{future}(PAXGUSDT)
{future}(RLCUSDT)
{future}(XAUTUSDT)
#Overbought & #oversold
📊 Overbought & Oversold: How does it work? 📈📉
Key market zones that indicate when the price may reverse.
🟢 Oversold
• The price has fallen too low - temporarily or excessively.
• RSI < 30.
• There may be a chance of a rebound - the asset is becoming interesting to buy.
• Many coins are now in this zone: $XAUT ,$RLC
- a bottom may be forming.
🔴 Overbought
• The price has risen too much.
• RSI > 70.
• A correction or pause after growth is likely - it's time to take profits.
• In this zone now: $ELF - a cooling after a surge is possible.
⚠️ Rule of thumb: no indicator gives guarantees - they are only hints, not a verdict.
📊 Overbought & Oversold: How does it work? 📈📉
Key market zones that indicate when the price may reverse.
🟢 Oversold
• The price has fallen too low - temporarily or excessively.
• RSI < 30.
• There may be a chance of a rebound - the asset is becoming interesting to buy.
• Many coins are now in this zone: $XAUT ,$RLC
- a bottom may be forming.
🔴 Overbought
• The price has risen too much.
• RSI > 70.
• A correction or pause after growth is likely - it's time to take profits.
• In this zone now: $ELF - a cooling after a surge is possible.
⚠️ Rule of thumb: no indicator gives guarantees - they are only hints, not a verdict.
1
639

🚨 $XRP NEARS CRITICAL SUPPORT AT $1.26 – RSI SAYS OVERSOLD 💥
📊 The RSI plunges to 17.35, a textbook extreme oversold reading that often precedes a short‑term relief rally. ⚡ Yet the token remains entrenched below every EMA (12‑200), signaling that smart money has yet to flip the bias.
📌 Immediate support at $1.26 has rebounded three times since August, acting as a liquidity pool for buyers. If that zone cracks, the next cushion sits around $1.15‑$1.14, exposing XRP to a deeper correction.
💬 Will buyers seize the $1.26 defense or let XRP slip deeper?
⚠️ Not financial advice. Always manage your risk. 🛡️
🏷️ #XRP #Oversold #ShortSetup #Crypto
🦈 📊
🚨 $XRP NEARS CRITICAL SUPPORT AT $1.26 – RSI SAYS OVERSOLD 💥
📊 The RSI plunges to 17.35, a textbook extreme oversold reading that often precedes a short‑term relief rally. ⚡ Yet the token remains entrenched below every EMA (12‑200), signaling that smart money has yet to flip the bias.
📌 Immediate support at $1.26 has rebounded three times since August, acting as a liquidity pool for buyers. If that zone cracks, the next cushion sits around $1.15‑$1.14, exposing XRP to a deeper correction.
💬 Will buyers seize the $1.26 defense or let XRP slip deeper?
⚠️ Not financial advice. Always manage your risk. 🛡️
🏷️ #XRP #Oversold #ShortSetup #Crypto
🦈 📊
📊 The RSI plunges to 17.35, a textbook extreme oversold reading that often precedes a short‑term relief rally. ⚡ Yet the token remains entrenched below every EMA (12‑200), signaling that smart money has yet to flip the bias.
📌 Immediate support at $1.26 has rebounded three times since August, acting as a liquidity pool for buyers. If that zone cracks, the next cushion sits around $1.15‑$1.14, exposing XRP to a deeper correction.
💬 Will buyers seize the $1.26 defense or let XRP slip deeper?
⚠️ Not financial advice. Always manage your risk. 🛡️
🏷️ #XRP #Oversold #ShortSetup #Crypto
🦈 📊
14
·
--
$GTC
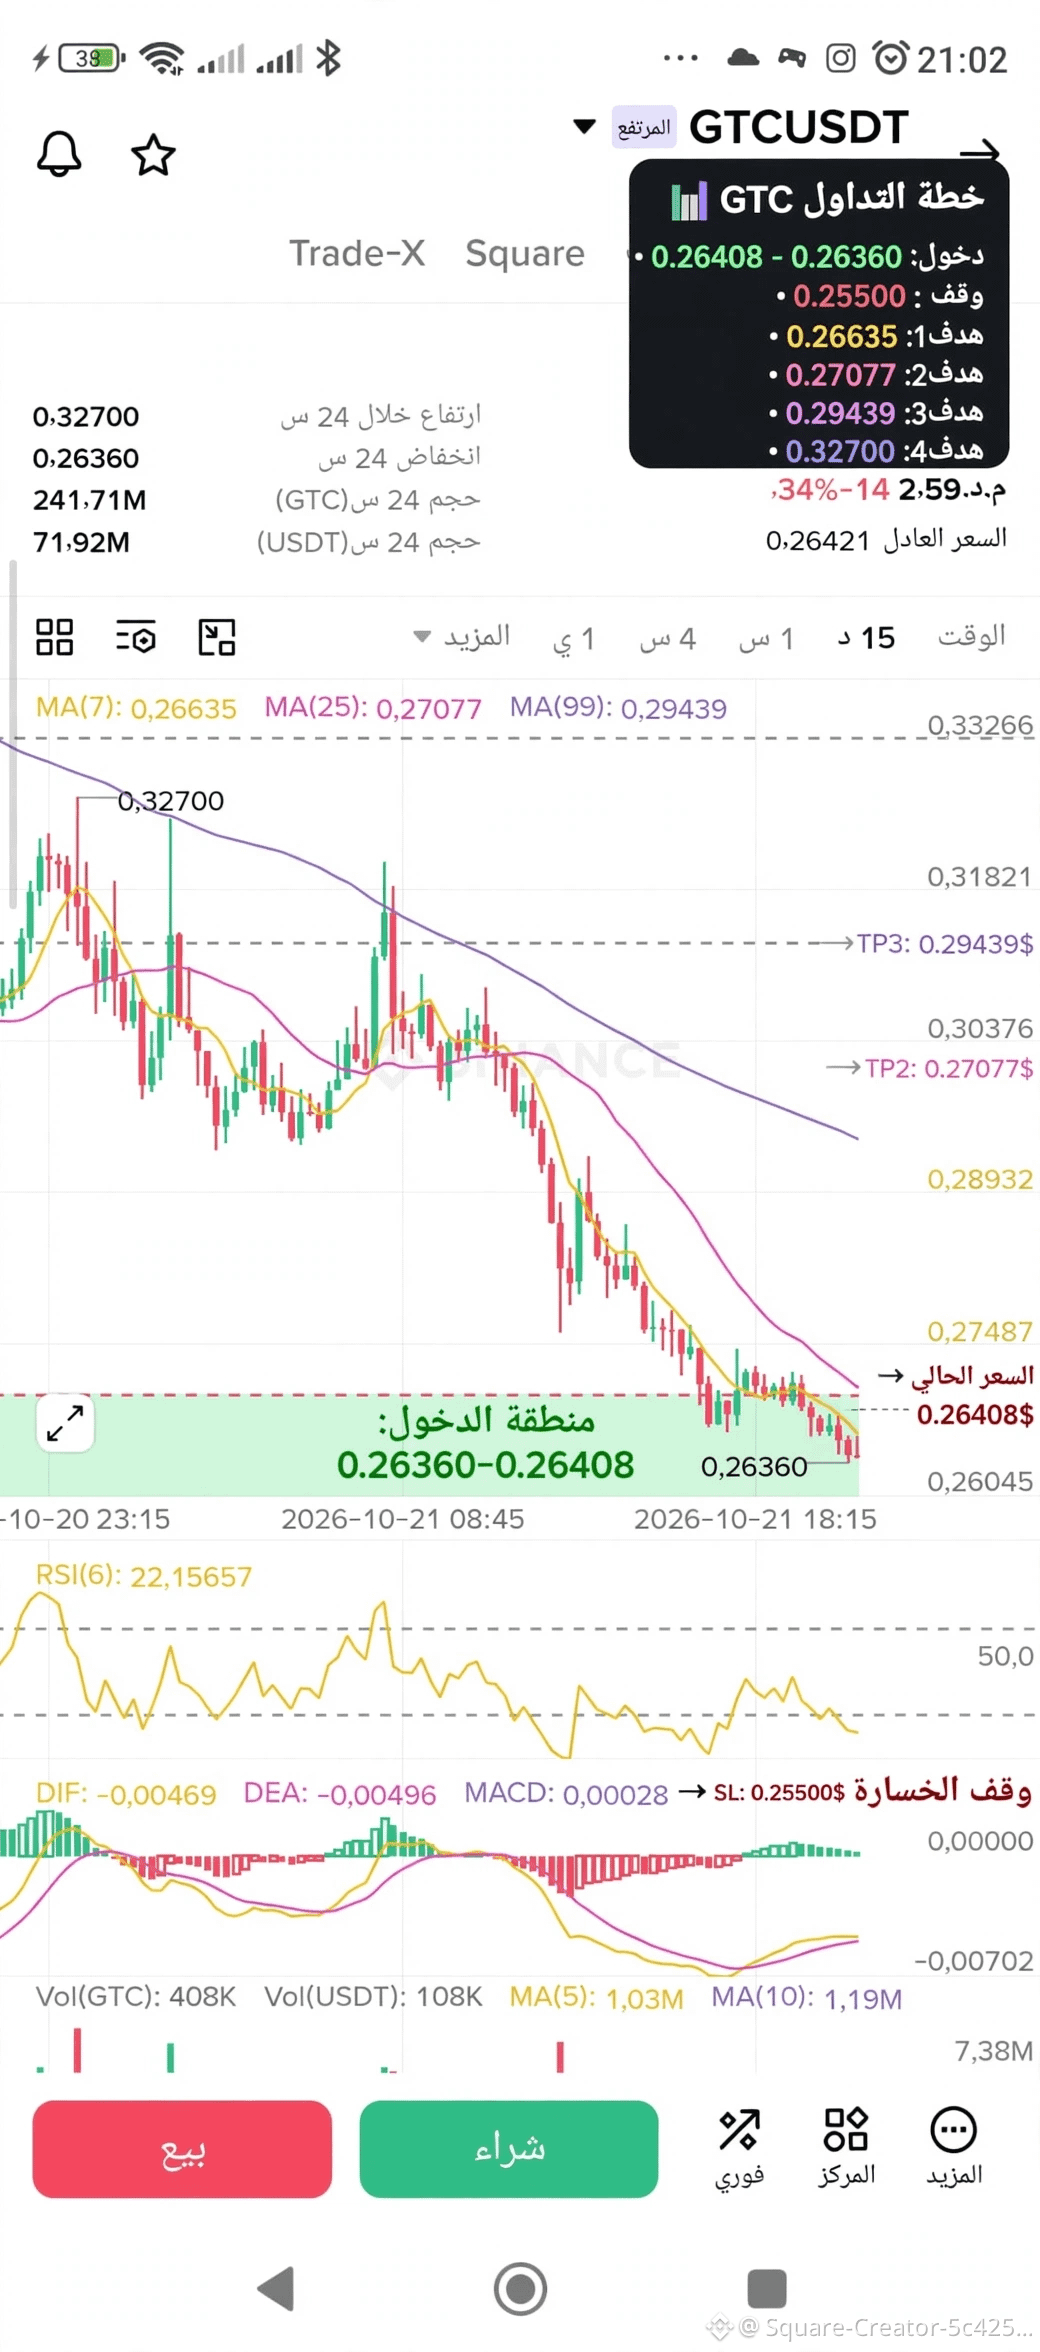
📉 Down from 0,32700$ to 0,26360$ = -19% — now at the absolute bottom
*Trading plan:*
🟢 Entry: 0,26360$ - 0,26408$ (current bottom - green zone)
🔴 Stop: 0,25500$ (-3,4%)
🎯 Targets:
Target 1: 0,26635$ = MA7 (+0,8%)
Target 2: 0,27077$ = MA25 (+2,5%)
Target 3: 0,29439$ = MA99 (+11%)
Target 4: 0,32700$ = previous high (+23%)
📊 RSI 22,15 = extremely oversold — very close to a rebound
MACD is green, albeit slightly = beginning of a reversal
RSI 22 = historic oversold levels
ENTRY: 0.26360-0.26408
SL: 0.25500
TP1: 0.26635
TP2: 0.27077
TP3: 0.29439
TP4: 0.32700
Risk 3.4% / Reward 23% 🚀
#GTC #Gitcoin #Binance #Oversold
$GTC
📉 Down from 0,32700$ to 0,26360$ = -19% — now at the absolute bottom
*Trading plan:*
🟢 Entry: 0,26360$ - 0,26408$ (current bottom - green zone)
🔴 Stop: 0,25500$ (-3,4%)
🎯 Targets:
Target 1: 0,26635$ = MA7 (+0,8%)
Target 2: 0,27077$ = MA25 (+2,5%)
Target 3: 0,29439$ = MA99 (+11%)
Target 4: 0,32700$ = previous high (+23%)
📊 RSI 22,15 = extremely oversold — very close to a rebound
MACD is green, albeit slightly = beginning of a reversal
RSI 22 = historic oversold levels
ENTRY: 0.26360-0.26408
SL: 0.25500
TP1: 0.26635
TP2: 0.27077
TP3: 0.29439
TP4: 0.32700
Risk 3.4% / Reward 23% 🚀
#GTC #Gitcoin #Binance #Oversold
📉 Down from 0,32700$ to 0,26360$ = -19% — now at the absolute bottom
*Trading plan:*
🟢 Entry: 0,26360$ - 0,26408$ (current bottom - green zone)
🔴 Stop: 0,25500$ (-3,4%)
🎯 Targets:
Target 1: 0,26635$ = MA7 (+0,8%)
Target 2: 0,27077$ = MA25 (+2,5%)
Target 3: 0,29439$ = MA99 (+11%)
Target 4: 0,32700$ = previous high (+23%)
📊 RSI 22,15 = extremely oversold — very close to a rebound
MACD is green, albeit slightly = beginning of a reversal
RSI 22 = historic oversold levels
ENTRY: 0.26360-0.26408
SL: 0.25500
TP1: 0.26635
TP2: 0.27077
TP3: 0.29439
TP4: 0.32700
Risk 3.4% / Reward 23% 🚀
#GTC #Gitcoin #Binance #Oversold
1
2
520

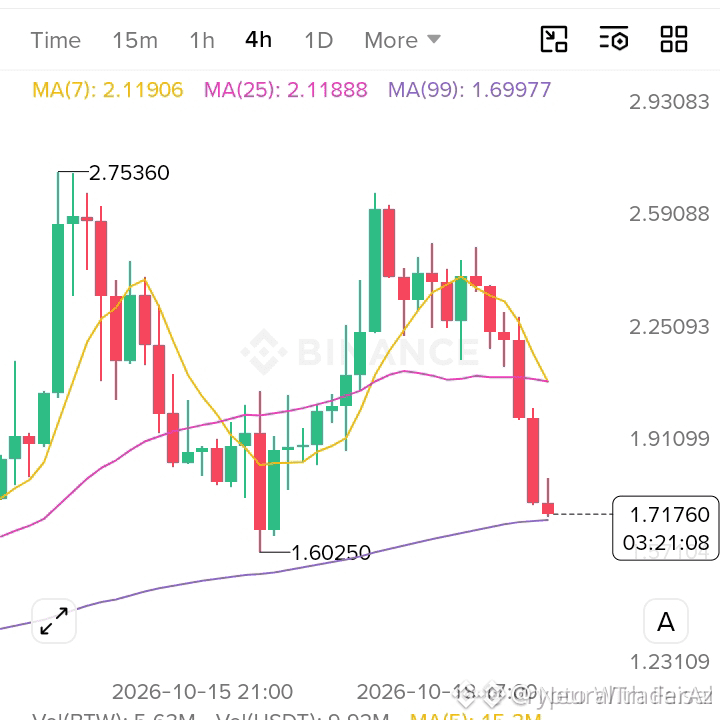
🚨 $BTW WIPES 21% INTO CRITICAL SUPPORT AS OVERCROWDED SHORTS RISK A SQUEEZE! ⚡
Entry: 1.699 🟢
📌 After a steep -21.81% flush, $BTW is testing its MA(99) dynamic baseline at $1.699, an area ripe for institutional absorption. With 61.26% of the market heavily positioned short, liquidity is aggressively stacked overhead, elevating the probability of a violent squeeze.
🌊 The 6-period RSI has collapsed into deeply oversold territory at 19.31 as price tests the $1.69 structural floor. Continuing to short at these extremes presents an asymmetric risk profile, making a technical relief rotation far more compelling.
💬 Are you positioning for a mean reversion bounce here, or do you anticipate structural breakdown? 👇
⚠️ Not financial advice. Always manage your risk. 🛡️
🏷️ #BTW #Crypto #Oversold #Altcoins
🎯 🦈
🚨 $BTW WIPES 21% INTO CRITICAL SUPPORT AS OVERCROWDED SHORTS RISK A SQUEEZE! ⚡
Entry: 1.699 🟢
📌 After a steep -21.81% flush, $BTW is testing its MA(99) dynamic baseline at $1.699, an area ripe for institutional absorption. With 61.26% of the market heavily positioned short, liquidity is aggressively stacked overhead, elevating the probability of a violent squeeze.
🌊 The 6-period RSI has collapsed into deeply oversold territory at 19.31 as price tests the $1.69 structural floor. Continuing to short at these extremes presents an asymmetric risk profile, making a technical relief rotation far more compelling.
💬 Are you positioning for a mean reversion bounce here, or do you anticipate structural breakdown? 👇
⚠️ Not financial advice. Always manage your risk. 🛡️
🏷️ #BTW #Crypto #Oversold #Altcoins
🎯 🦈
Entry: 1.699 🟢
📌 After a steep -21.81% flush, $BTW is testing its MA(99) dynamic baseline at $1.699, an area ripe for institutional absorption. With 61.26% of the market heavily positioned short, liquidity is aggressively stacked overhead, elevating the probability of a violent squeeze.
🌊 The 6-period RSI has collapsed into deeply oversold territory at 19.31 as price tests the $1.69 structural floor. Continuing to short at these extremes presents an asymmetric risk profile, making a technical relief rotation far more compelling.
💬 Are you positioning for a mean reversion bounce here, or do you anticipate structural breakdown? 👇
⚠️ Not financial advice. Always manage your risk. 🛡️
🏷️ #BTW #Crypto #Oversold #Altcoins
🎯 🦈
6

·
--
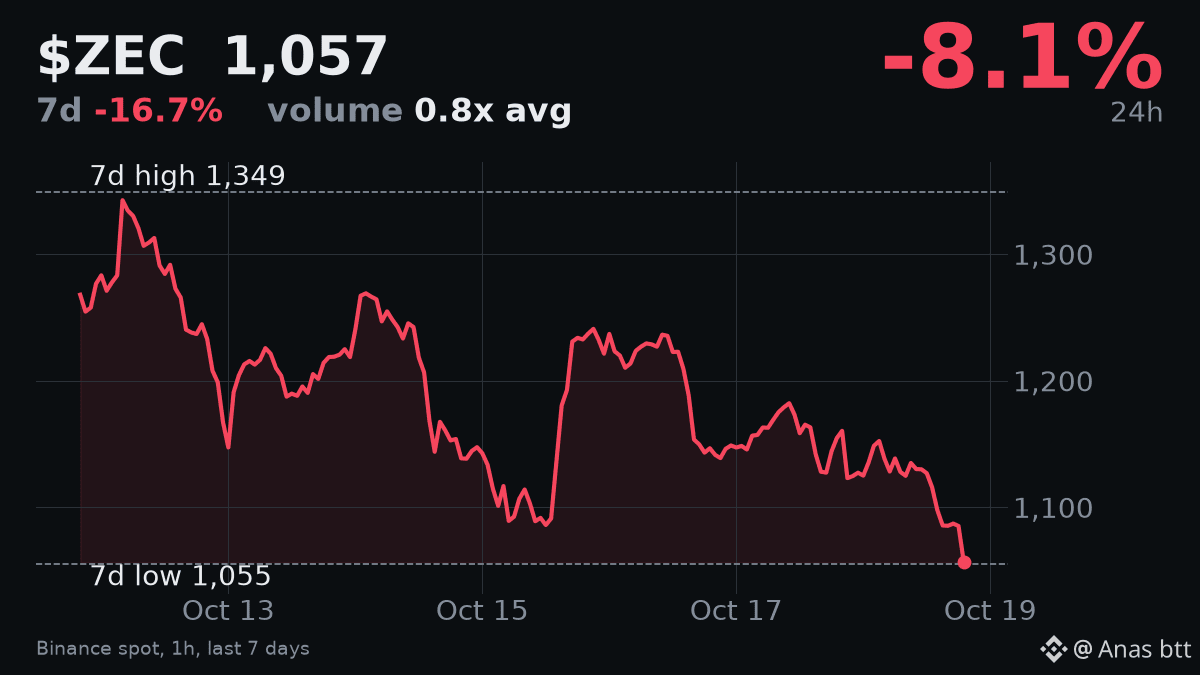
$ZEC has dropped significantly, down over 8% in the last 24 hours to $1057.44. This extends its 7-day decline to over 16%.
It now trades more than 21% below its 7-day high of $1349.3. Current 24-hour trading volume is low, at only 75% of its 7-day average. The 14-hour RSI is at a very low 23.3.
My view is neutral for now. The low RSI suggests $ZEC is oversold, but the weak volume on this downtrend does not give confidence for a reversal. I would become bullish if I saw a clear bounce from the 7-day low of $1055.03, confirmed by a significant increase in buying volume. A break below $1055.03 on heavy volume would suggest further downside.
I am watching for a clear reversal candle with strong volume above the 7-day low.
#ZEC #Oversold
$ZEC has dropped significantly, down over 8% in the last 24 hours to $1057.44. This extends its 7-day decline to over 16%.
It now trades more than 21% below its 7-day high of $1349.3. Current 24-hour trading volume is low, at only 75% of its 7-day average. The 14-hour RSI is at a very low 23.3.
My view is neutral for now. The low RSI suggests $ZEC is oversold, but the weak volume on this downtrend does not give confidence for a reversal. I would become bullish if I saw a clear bounce from the 7-day low of $1055.03, confirmed by a significant increase in buying volume. A break below $1055.03 on heavy volume would suggest further downside.
I am watching for a clear reversal candle with strong volume above the 7-day low.
#ZEC #Oversold
It now trades more than 21% below its 7-day high of $1349.3. Current 24-hour trading volume is low, at only 75% of its 7-day average. The 14-hour RSI is at a very low 23.3.
My view is neutral for now. The low RSI suggests $ZEC is oversold, but the weak volume on this downtrend does not give confidence for a reversal. I would become bullish if I saw a clear bounce from the 7-day low of $1055.03, confirmed by a significant increase in buying volume. A break below $1055.03 on heavy volume would suggest further downside.
I am watching for a clear reversal candle with strong volume above the 7-day low.
#ZEC #Oversold
1
442
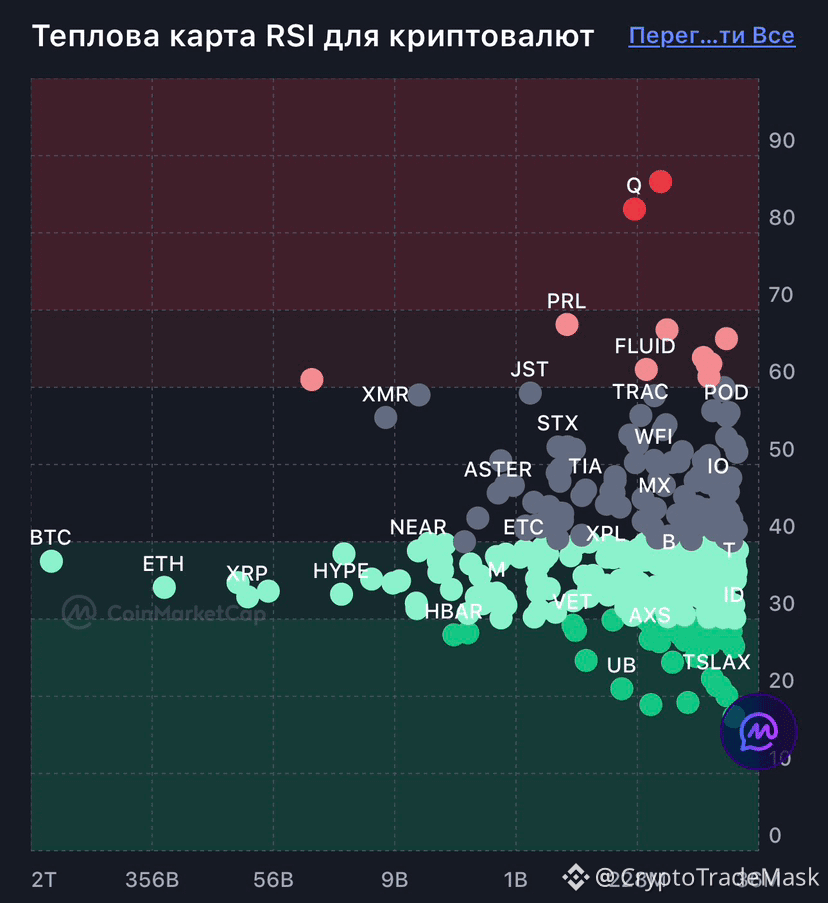
#Overbought & #oversold
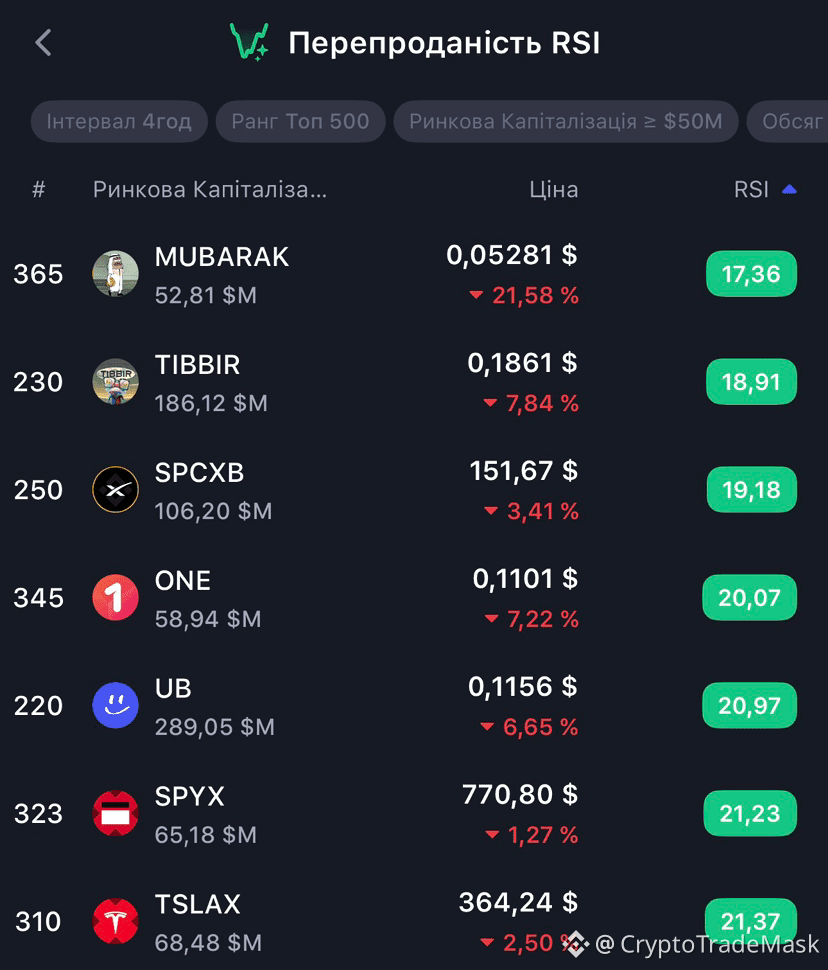
📊 Overbought & Oversold: How does it work? 📈📉
Key market zones that indicate when the price may reverse.
🟢 Oversold
• The price has fallen too low - temporarily or excessively.
• RSI < 30.
• There may be a chance of a rebound - the asset is becoming interesting to buy.
• Many coins are now in this zone: $MUBARAK , $SPCXB - a bottom may be forming.
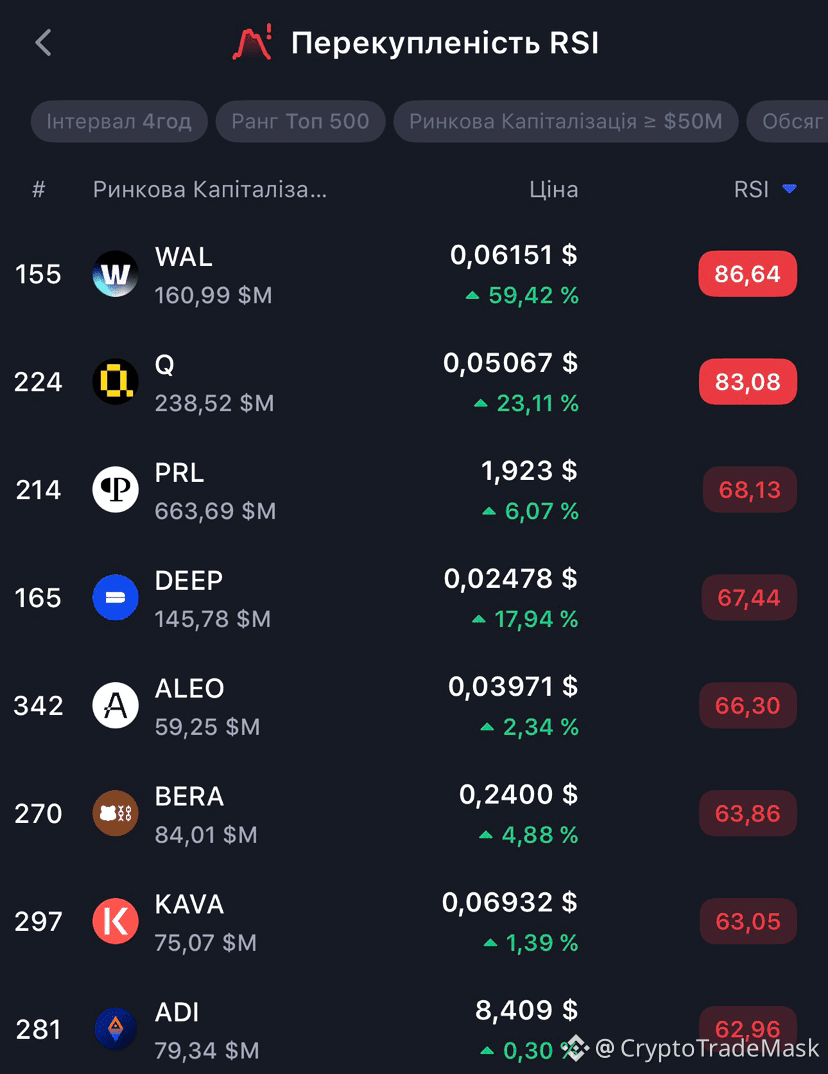
🔴 Overbought
• The price has risen too much.
• RSI > 70.
• A correction or pause after growth is likely - it's time to take profits.
• In this zone now: $WAL - a cooling after a surge is possible.
⚠️ Rule of thumb: no indicator gives guarantees - they are only hints, not a verdict.
{spot}(SPCXBUSDT)
{future}(WALUSDT)
{future}(MUBARAKUSDT)
#Overbought & #oversold
📊 Overbought & Oversold: How does it work? 📈📉
Key market zones that indicate when the price may reverse.
🟢 Oversold
• The price has fallen too low - temporarily or excessively.
• RSI < 30.
• There may be a chance of a rebound - the asset is becoming interesting to buy.
• Many coins are now in this zone: $MUBARAK , $SPCXB - a bottom may be forming.
🔴 Overbought
• The price has risen too much.
• RSI > 70.
• A correction or pause after growth is likely - it's time to take profits.
• In this zone now: $WAL - a cooling after a surge is possible.
⚠️ Rule of thumb: no indicator gives guarantees - they are only hints, not a verdict.
📊 Overbought & Oversold: How does it work? 📈📉
Key market zones that indicate when the price may reverse.
🟢 Oversold
• The price has fallen too low - temporarily or excessively.
• RSI < 30.
• There may be a chance of a rebound - the asset is becoming interesting to buy.
• Many coins are now in this zone: $MUBARAK , $SPCXB - a bottom may be forming.
🔴 Overbought
• The price has risen too much.
• RSI > 70.
• A correction or pause after growth is likely - it's time to take profits.
• In this zone now: $WAL - a cooling after a surge is possible.
⚠️ Rule of thumb: no indicator gives guarantees - they are only hints, not a verdict.
1
62
#Overbought & #oversold
📊 Overbought & Oversold: How does it work? 📈📉
Key market zones that indicate when the price may reverse.
🟢 Oversold
• The price has fallen too low - temporarily or excessively.
• RSI < 30.
• There may be a chance of a rebound - the asset is becoming interesting to buy.
• Many coins are now in this zone: $EDGE - a bottom may be forming.
🔴 Overbought
• The price has risen too much.
• RSI > 70.
• A correction or pause after growth is likely - it's time to take profits.
• In this zone now: $KAIA , $STRK - a cooling after a surge is possible.
⚠️ Rule of thumb: no indicator gives guarantees - they are only hints, not a verdict.
{future}(STRKUSDT)
{future}(KAIAUSDT)
{future}(EDGEUSDT)
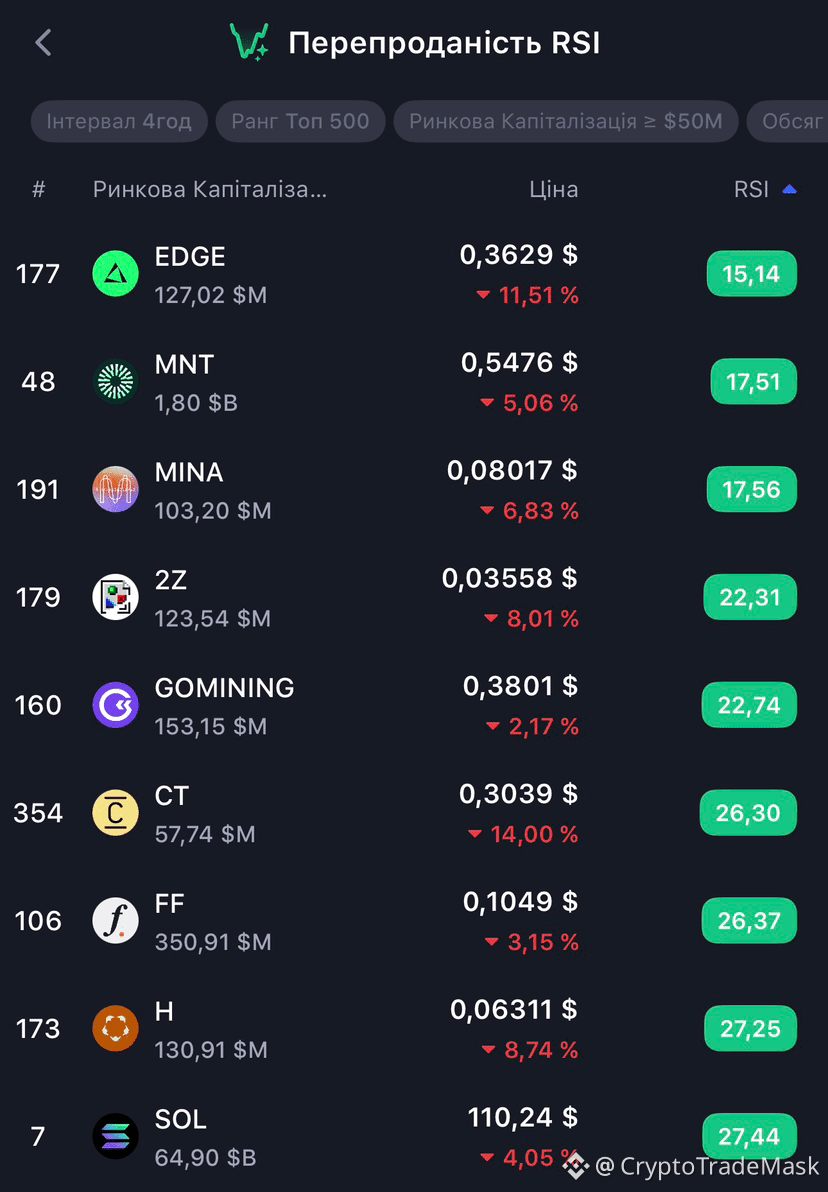
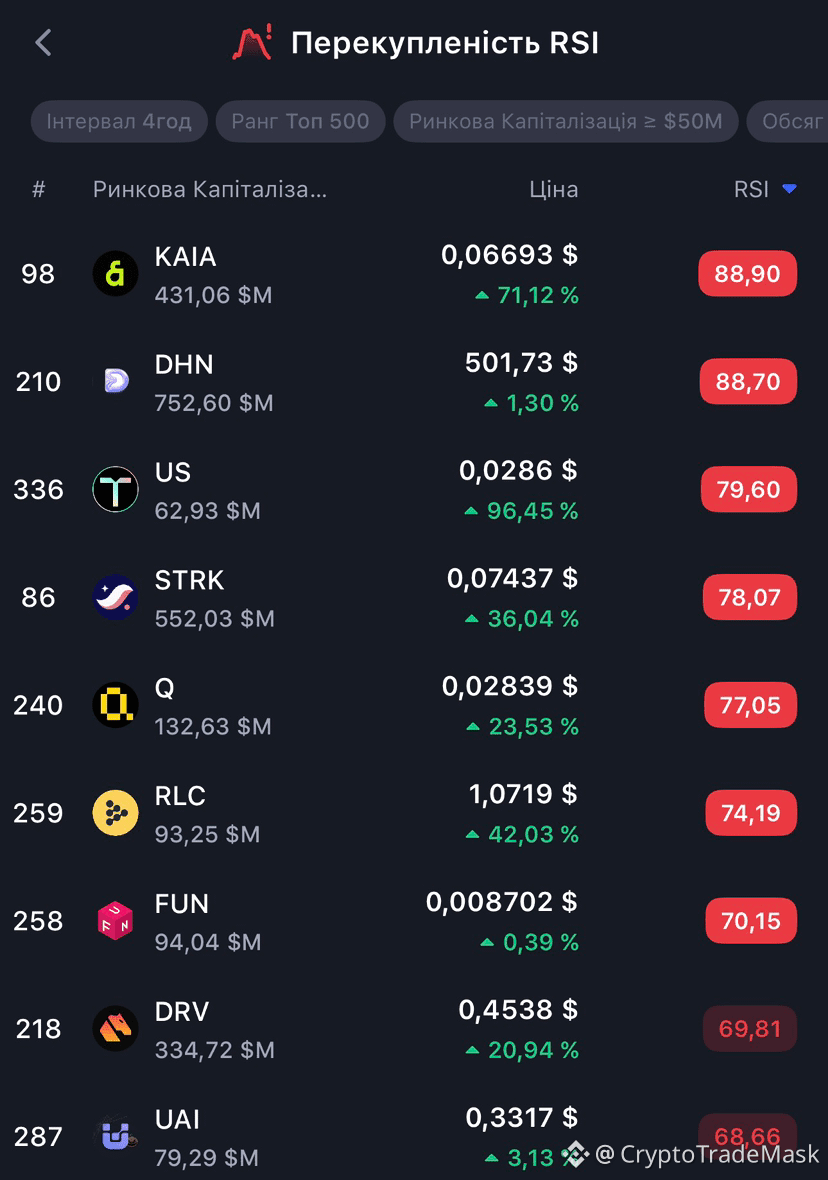
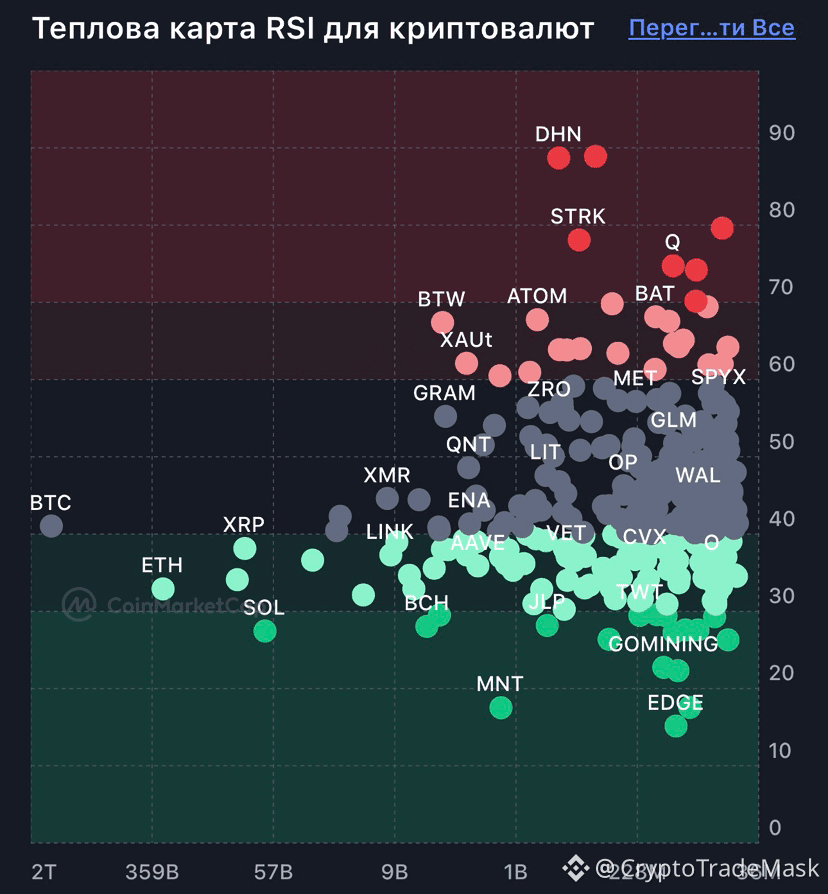
#Overbought & #oversold
📊 Overbought & Oversold: How does it work? 📈📉
Key market zones that indicate when the price may reverse.
🟢 Oversold
• The price has fallen too low - temporarily or excessively.
• RSI < 30.
• There may be a chance of a rebound - the asset is becoming interesting to buy.
• Many coins are now in this zone: $EDGE - a bottom may be forming.
🔴 Overbought
• The price has risen too much.
• RSI > 70.
• A correction or pause after growth is likely - it's time to take profits.
• In this zone now: $KAIA , $STRK - a cooling after a surge is possible.
⚠️ Rule of thumb: no indicator gives guarantees - they are only hints, not a verdict.
📊 Overbought & Oversold: How does it work? 📈📉
Key market zones that indicate when the price may reverse.
🟢 Oversold
• The price has fallen too low - temporarily or excessively.
• RSI < 30.
• There may be a chance of a rebound - the asset is becoming interesting to buy.
• Many coins are now in this zone: $EDGE - a bottom may be forming.
🔴 Overbought
• The price has risen too much.
• RSI > 70.
• A correction or pause after growth is likely - it's time to take profits.
• In this zone now: $KAIA , $STRK - a cooling after a surge is possible.
⚠️ Rule of thumb: no indicator gives guarantees - they are only hints, not a verdict.
149
#Overbought & #oversold
📊 Overbought & Oversold: How does it work? 📈📉
Key market zones that indicate when the price may reverse.
🟢 Oversold
• The price has fallen too low - temporarily or excessively.
• RSI < 30.
• There may be a chance of a rebound - the asset is becoming interesting to buy.
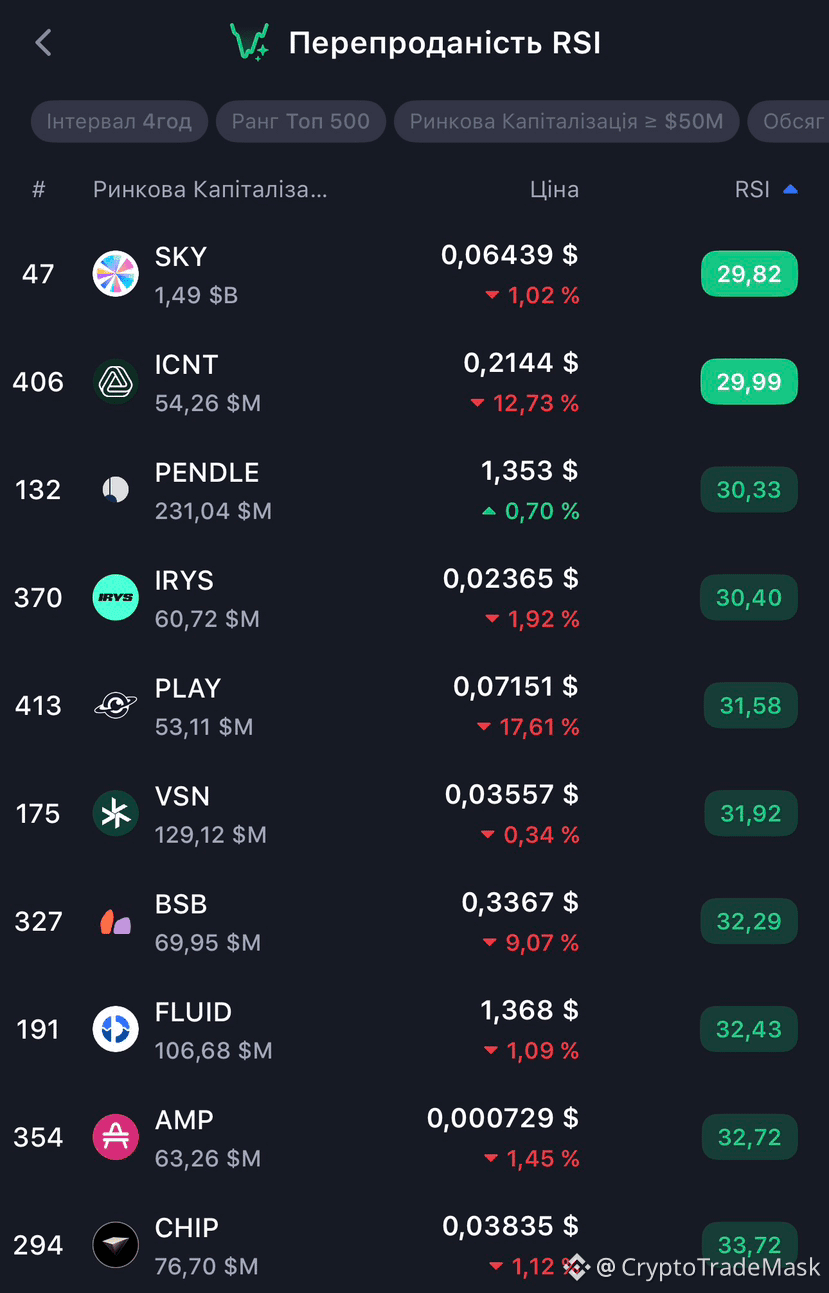
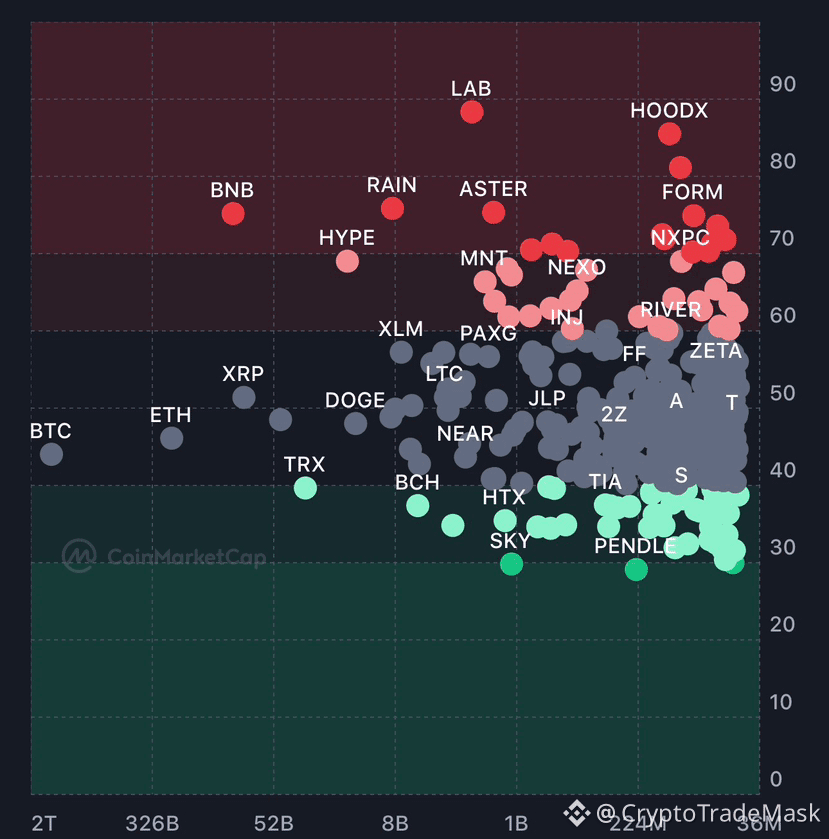
• Many coins are now in this zone: $SKY - a bottom may be forming.
🔴 Overbought
• The price has risen too much.
• RSI > 70.
• A correction or pause after growth is likely - it's time to take profits.
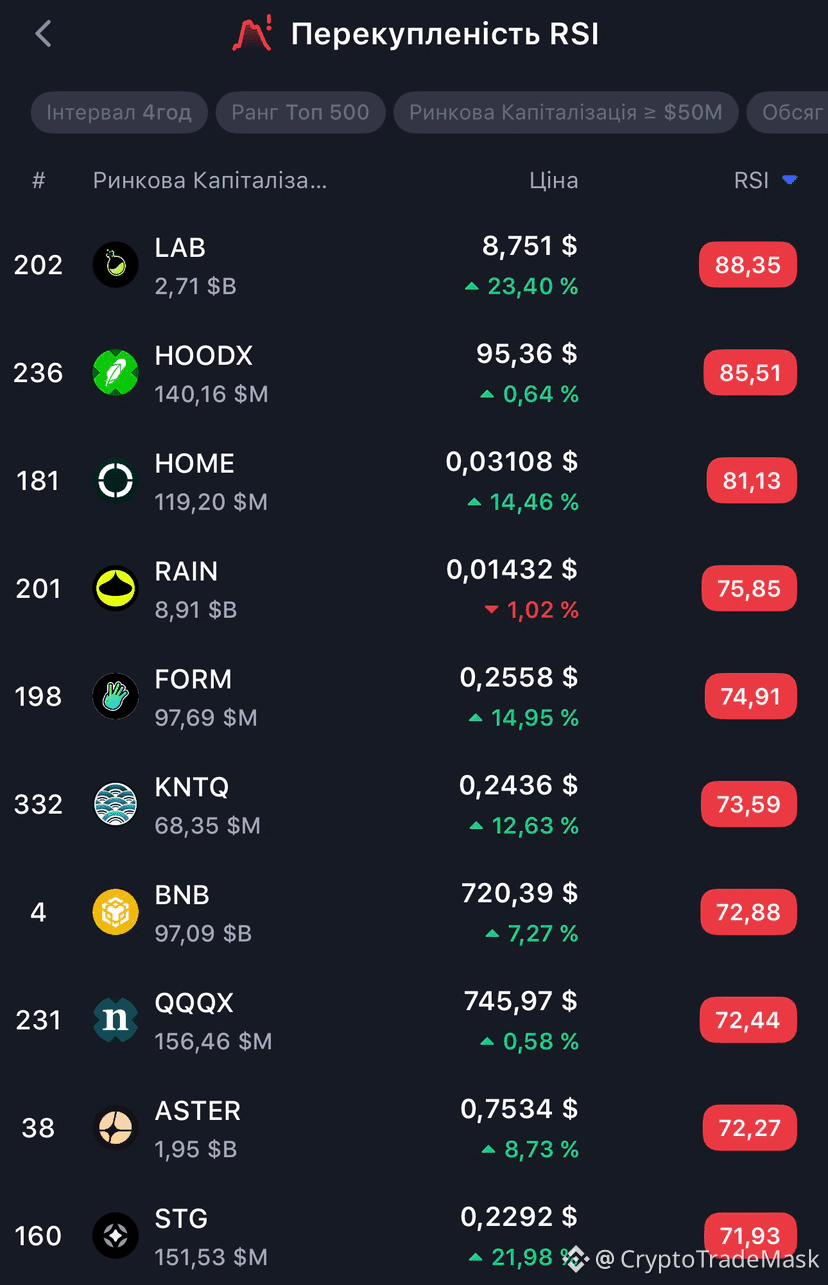
• In this zone now: $LAB , $HOME - a cooling after a surge is possible.
⚠️ Rule of thumb: no indicator gives guarantees - they are only hints, not a verdict.
{future}(HOMEUSDT)
{future}(LABUSDT)
{future}(SKYUSDT)
#Overbought & #oversold
📊 Overbought & Oversold: How does it work? 📈📉
Key market zones that indicate when the price may reverse.
🟢 Oversold
• The price has fallen too low - temporarily or excessively.
• RSI < 30.
• There may be a chance of a rebound - the asset is becoming interesting to buy.
• Many coins are now in this zone: $SKY - a bottom may be forming.
🔴 Overbought
• The price has risen too much.
• RSI > 70.
• A correction or pause after growth is likely - it's time to take profits.
• In this zone now: $LAB , $HOME - a cooling after a surge is possible.
⚠️ Rule of thumb: no indicator gives guarantees - they are only hints, not a verdict.
📊 Overbought & Oversold: How does it work? 📈📉
Key market zones that indicate when the price may reverse.
🟢 Oversold
• The price has fallen too low - temporarily or excessively.
• RSI < 30.
• There may be a chance of a rebound - the asset is becoming interesting to buy.
• Many coins are now in this zone: $SKY - a bottom may be forming.
🔴 Overbought
• The price has risen too much.
• RSI > 70.
• A correction or pause after growth is likely - it's time to take profits.
• In this zone now: $LAB , $HOME - a cooling after a surge is possible.
⚠️ Rule of thumb: no indicator gives guarantees - they are only hints, not a verdict.
372
·
--
$LAB FROM $20 TO $1: STRUCTURAL LIQUIDITY ZONE FORMING 💎
The 95% decline from peak to current levels has carved a clear liquidity void on the weekly chart. Volume is thinning into the lows, and the daily RSI is sub-20 — levels that historically precede structural reversals when order flow shifts.
Patience here is a strategy, not an emotion. The market will tell you when it's ready to rotate, but the risk-reward asymmetry grows the lower we go.
Are you scaling into this zone or waiting for a breaker block to confirm?
Not financial advice. Always manage your risk.
#LAB #Altcoin #Crypto #Oversold
💎
$LAB FROM $20 TO $1: STRUCTURAL LIQUIDITY ZONE FORMING 💎
The 95% decline from peak to current levels has carved a clear liquidity void on the weekly chart. Volume is thinning into the lows, and the daily RSI is sub-20 — levels that historically precede structural reversals when order flow shifts.
Patience here is a strategy, not an emotion. The market will tell you when it's ready to rotate, but the risk-reward asymmetry grows the lower we go.
Are you scaling into this zone or waiting for a breaker block to confirm?
Not financial advice. Always manage your risk.
#LAB #Altcoin #Crypto #Oversold
💎
The 95% decline from peak to current levels has carved a clear liquidity void on the weekly chart. Volume is thinning into the lows, and the daily RSI is sub-20 — levels that historically precede structural reversals when order flow shifts.
Patience here is a strategy, not an emotion. The market will tell you when it's ready to rotate, but the risk-reward asymmetry grows the lower we go.
Are you scaling into this zone or waiting for a breaker block to confirm?
Not financial advice. Always manage your risk.
#LAB #Altcoin #Crypto #Oversold
💎

358
·
--
$XLM REJECTED AT $0.21 – NOW TESTING CRITICAL SUPPORT 🔥
Body: That rejection at $0.2156 did structural damage. Price dropped 5.69% in a single session, slicing through the moving average cluster between $0.1948 and $0.1973. Sellers now control the tape.
RSI just hit 24.85 — oversold territory. But oversold doesn't guarantee a bounce. The real risk is a breakdown below $0.18, which could open the door to the mid-$0.16 range. Are you shorting this breakdown or waiting for a reclaim of $0.21?
Not financial advice. Always manage your risk.
#XLM #CryptoAnalysis #Oversold #SupportTest
💎
$XLM REJECTED AT $0.21 – NOW TESTING CRITICAL SUPPORT 🔥
Body: That rejection at $0.2156 did structural damage. Price dropped 5.69% in a single session, slicing through the moving average cluster between $0.1948 and $0.1973. Sellers now control the tape.
RSI just hit 24.85 — oversold territory. But oversold doesn't guarantee a bounce. The real risk is a breakdown below $0.18, which could open the door to the mid-$0.16 range. Are you shorting this breakdown or waiting for a reclaim of $0.21?
Not financial advice. Always manage your risk.
#XLM #CryptoAnalysis #Oversold #SupportTest
💎
Body: That rejection at $0.2156 did structural damage. Price dropped 5.69% in a single session, slicing through the moving average cluster between $0.1948 and $0.1973. Sellers now control the tape.
RSI just hit 24.85 — oversold territory. But oversold doesn't guarantee a bounce. The real risk is a breakdown below $0.18, which could open the door to the mid-$0.16 range. Are you shorting this breakdown or waiting for a reclaim of $0.21?
Not financial advice. Always manage your risk.
#XLM #CryptoAnalysis #Oversold #SupportTest
💎
61
Log in to explore more content
Join global crypto users on Binance Square
⚡️ Get latest and useful information about crypto.
💬 Trusted by the world’s largest crypto exchange.
👍 Discover real insights from verified creators.
Email / Phone number
Trending Topics
1
#NvidiaInvestigatesAfterHuang’sAffairApology
30,109 views
411 Discussing
2
#BitcoinFiveWeeklyLosses
45,551 views
839 Discussing
3
#AIChipSlumpNasdaq
26,294 views
485 Discussing
4
#SouthKoreaSupremeCourtClarifiesVirtualAssetSeizureRules
231 views
10 Discussing
5
#EthereumSpotETFsPost$365MWeeklyOutflow
1,279 views
35 Discussing
6
#TradFiForBeginners
267,032 views
2,398 Discussing
7
#KeplrAdvisesSocialLoginUsersToTransferAssets
92,847 views
699 Discussing
8
#TetherPlans€28.8MForJuventusCapitalIncrease
61,609 views
508 Discussing
9
#JobsReportRaisesHikeOdds
1M views
4,711 Discussing
10
#CPITestsDecemberRateOutlook
491,333 views
2,057 Discussing