

#market_tips
market_tips
1.1M views
2,656 Discussing
Hot
Latest

Article
Analyzing MARSCOIN Structure📊 Current structure
Price: ~$0.1173
24H high: $0.1431
24H low: $0.1105
RSI(6): ~40.8
The big picture is:
$0.2675 → sharp selloff → $0.0822 → recovery/range → recent spike → pullback
So the coin is currently trying to establish whether the area around $0.11–$0.125 can become a new trading range.
Key levels
Level
Importance
$0.143–0.145
Major near-term resistance
$0.124–0.126
First important resistance
$0.117
Current price
$0.110–0.112
Immediate support
$0.095–0.100
Deeper support
$0.0822
Major swing low
🟢 Bullish scenario
If buyers defend $0.110–0.112 and price gets back above $0.124–0.126 with strong 4H volume, that would be a meaningful improvement in structure.
The next area I'd watch would be roughly $0.140–0.145.
A clean 4H close above that area would be considerably more significant than simply wicking above it.
🔴 Bearish scenario
If $0.110 breaks decisively on a 4H closing basis, the chart becomes weaker.
Then I'd watch approximately:
$0.10 → $0.095 → $0.0822
The $0.0822 level is particularly important because that's the visible major swing low on your chart.
📉 RSI + volume
The RSI around 40.8 is interesting.
It's not oversold, but it's also below the 50 area, so momentum currently isn't particularly strong.
More importantly, the recent move upward toward ~$0.14 appears to have been followed by selling, while volume has cooled. That means I'd want to see buyers return with increasing volume before treating another push upward as a confirmed breakout.
#MARSCOIN #market_tips #MarketUpdate
Analyzing MARSCOIN Structure
📊 Current structure
Price: ~$0.1173
24H high: $0.1431
24H low: $0.1105
RSI(6): ~40.8
The big picture is:
$0.2675 → sharp selloff → $0.0822 → recovery/range → recent spike → pullback
So the coin is currently trying to establish whether the area around $0.11–$0.125 can become a new trading range.
Key levels
Level
Importance
$0.143–0.145
Major near-term resistance
$0.124–0.126
First important resistance
$0.117
Current price
$0.110–0.112
Immediate support
$0.095–0.100
Deeper support
$0.0822
Major swing low
🟢 Bullish scenario
If buyers defend $0.110–0.112 and price gets back above $0.124–0.126 with strong 4H volume, that would be a meaningful improvement in structure.
The next area I'd watch would be roughly $0.140–0.145.
A clean 4H close above that area would be considerably more significant than simply wicking above it.
🔴 Bearish scenario
If $0.110 breaks decisively on a 4H closing basis, the chart becomes weaker.
Then I'd watch approximately:
$0.10 → $0.095 → $0.0822
The $0.0822 level is particularly important because that's the visible major swing low on your chart.
📉 RSI + volume
The RSI around 40.8 is interesting.
It's not oversold, but it's also below the 50 area, so momentum currently isn't particularly strong.
More importantly, the recent move upward toward ~$0.14 appears to have been followed by selling, while volume has cooled. That means I'd want to see buyers return with increasing volume before treating another push upward as a confirmed breakout.
#MARSCOIN #market_tips #MarketUpdate
Price: ~$0.1173
24H high: $0.1431
24H low: $0.1105
RSI(6): ~40.8
The big picture is:
$0.2675 → sharp selloff → $0.0822 → recovery/range → recent spike → pullback
So the coin is currently trying to establish whether the area around $0.11–$0.125 can become a new trading range.
Key levels
Level
Importance
$0.143–0.145
Major near-term resistance
$0.124–0.126
First important resistance
$0.117
Current price
$0.110–0.112
Immediate support
$0.095–0.100
Deeper support
$0.0822
Major swing low
🟢 Bullish scenario
If buyers defend $0.110–0.112 and price gets back above $0.124–0.126 with strong 4H volume, that would be a meaningful improvement in structure.
The next area I'd watch would be roughly $0.140–0.145.
A clean 4H close above that area would be considerably more significant than simply wicking above it.
🔴 Bearish scenario
If $0.110 breaks decisively on a 4H closing basis, the chart becomes weaker.
Then I'd watch approximately:
$0.10 → $0.095 → $0.0822
The $0.0822 level is particularly important because that's the visible major swing low on your chart.
📉 RSI + volume
The RSI around 40.8 is interesting.
It's not oversold, but it's also below the 50 area, so momentum currently isn't particularly strong.
More importantly, the recent move upward toward ~$0.14 appears to have been followed by selling, while volume has cooled. That means I'd want to see buyers return with increasing volume before treating another push upward as a confirmed breakout.
#MARSCOIN #market_tips #MarketUpdate
611

·
--
$BTC MARKET UPDATE
Bitcoin made a strong move toward $87K, but the market is now seeing a pullback, with BTC trading around $84K. 📉
What I’m watching now isn’t simply, “Will BTC dump?” or “Will it pump?”
👀 Key zone: $83K–$84K
🧱 Resistance: $86K–$87K
🎯 Psychological level: $90K
If BTC holds the $83K–$84K zone and reclaims higher levels, momentum could strengthen again.
But if support breaks, traders should be
prepared for increased volatility.
Don’t FOMO. Don’t over-leverage. Wait for confirmation, then manage your risk.
Crypto markets offer no guarantees.
DYOR & trade responsibly. 🧠📊
$BTC #Market_Update #MarketMoves #market_tips
$BTC MARKET UPDATE
Bitcoin made a strong move toward $87K, but the market is now seeing a pullback, with BTC trading around $84K. 📉
What I’m watching now isn’t simply, “Will BTC dump?” or “Will it pump?”
👀 Key zone: $83K–$84K
🧱 Resistance: $86K–$87K
🎯 Psychological level: $90K
If BTC holds the $83K–$84K zone and reclaims higher levels, momentum could strengthen again.
But if support breaks, traders should be
prepared for increased volatility.
Don’t FOMO. Don’t over-leverage. Wait for confirmation, then manage your risk.
Crypto markets offer no guarantees.
DYOR & trade responsibly. 🧠📊
$BTC #Market_Update #MarketMoves #market_tips
Bitcoin made a strong move toward $87K, but the market is now seeing a pullback, with BTC trading around $84K. 📉
What I’m watching now isn’t simply, “Will BTC dump?” or “Will it pump?”
👀 Key zone: $83K–$84K
🧱 Resistance: $86K–$87K
🎯 Psychological level: $90K
If BTC holds the $83K–$84K zone and reclaims higher levels, momentum could strengthen again.
But if support breaks, traders should be
prepared for increased volatility.
Don’t FOMO. Don’t over-leverage. Wait for confirmation, then manage your risk.
Crypto markets offer no guarantees.
DYOR & trade responsibly. 🧠📊
$BTC #Market_Update #MarketMoves #market_tips
1
65


·
--
🚨$ZEC — MOMENTUM IS GETTING SERIOUS
Zcash just delivered a powerful expansion from the 1,520 zone, pushing into the 1,640–1,650 resistance area before cooling around 1,604.
The key detail is volume.
A major volume burst accompanied the breakout, showing that this was more than a quiet price drift. Now ZEC is consolidating near the highs, which makes the next reaction around 1,600–1,650 extremely important.
TRADE SETUP
Entry: 1,580 – 1,610
Stop Loss: 1,545
TP1: 1,650
TP2: 1,720
TP3: 1,800
Key support:
1,580
1,545
1,520
Key resistance:
1,650
1,720
1,800
The structure remains interesting while price holds above the recent breakout area. A clean move through 1,650 with strong volume would put the higher targets into focus, while losing 1,545 would weaken this setup.
The bigger story is also getting attention: Zcash holders backed faster 25-second blocks and continuation of the halving schedule, while Zcash ETF demand has brought significant capital into the market.
This is a high-volatility setup after a very large move, so position size and stop discipline matter.
Risk managed. Let the chart confirm the move.
Let’s go and Trade now
🤑🤑🤑🤑🤑🤑🤯🤯🤯🤯🤯🤯🤑🤑🤑🤑🤑🤑🤑🤑🤑🤑🤑🤑🤑🤑🤑🤑🤑🤑
{spot}(ZECUSDT)
#market_tips #AIStocksWhatNext #DogecoinRises15% #BNBMarketCapPassesBNYMellon #MuseOvertakesChatGPTAsTopFreeIOSApp
🚨$ZEC — MOMENTUM IS GETTING SERIOUS
Zcash just delivered a powerful expansion from the 1,520 zone, pushing into the 1,640–1,650 resistance area before cooling around 1,604.
The key detail is volume.
A major volume burst accompanied the breakout, showing that this was more than a quiet price drift. Now ZEC is consolidating near the highs, which makes the next reaction around 1,600–1,650 extremely important.
TRADE SETUP
Entry: 1,580 – 1,610
Stop Loss: 1,545
TP1: 1,650
TP2: 1,720
TP3: 1,800
Key support:
1,580
1,545
1,520
Key resistance:
1,650
1,720
1,800
The structure remains interesting while price holds above the recent breakout area. A clean move through 1,650 with strong volume would put the higher targets into focus, while losing 1,545 would weaken this setup.
The bigger story is also getting attention: Zcash holders backed faster 25-second blocks and continuation of the halving schedule, while Zcash ETF demand has brought significant capital into the market.
This is a high-volatility setup after a very large move, so position size and stop discipline matter.
Risk managed. Let the chart confirm the move.
Let’s go and Trade now
🤑🤑🤑🤑🤑🤑🤯🤯🤯🤯🤯🤯🤑🤑🤑🤑🤑🤑🤑🤑🤑🤑🤑🤑🤑🤑🤑🤑🤑🤑
#market_tips #AIStocksWhatNext #DogecoinRises15% #BNBMarketCapPassesBNYMellon #MuseOvertakesChatGPTAsTopFreeIOSApp
Zcash just delivered a powerful expansion from the 1,520 zone, pushing into the 1,640–1,650 resistance area before cooling around 1,604.
The key detail is volume.
A major volume burst accompanied the breakout, showing that this was more than a quiet price drift. Now ZEC is consolidating near the highs, which makes the next reaction around 1,600–1,650 extremely important.
TRADE SETUP
Entry: 1,580 – 1,610
Stop Loss: 1,545
TP1: 1,650
TP2: 1,720
TP3: 1,800
Key support:
1,580
1,545
1,520
Key resistance:
1,650
1,720
1,800
The structure remains interesting while price holds above the recent breakout area. A clean move through 1,650 with strong volume would put the higher targets into focus, while losing 1,545 would weaken this setup.
The bigger story is also getting attention: Zcash holders backed faster 25-second blocks and continuation of the halving schedule, while Zcash ETF demand has brought significant capital into the market.
This is a high-volatility setup after a very large move, so position size and stop discipline matter.
Risk managed. Let the chart confirm the move.
Let’s go and Trade now
🤑🤑🤑🤑🤑🤑🤯🤯🤯🤯🤯🤯🤑🤑🤑🤑🤑🤑🤑🤑🤑🤑🤑🤑🤑🤑🤑🤑🤑🤑
#market_tips #AIStocksWhatNext #DogecoinRises15% #BNBMarketCapPassesBNYMellon #MuseOvertakesChatGPTAsTopFreeIOSApp
LONG
43%
SHORT
43%
ZEC
14%
Let’s go and Trade now $ZEC
0%
14 votes • Voting closed
539

·
--
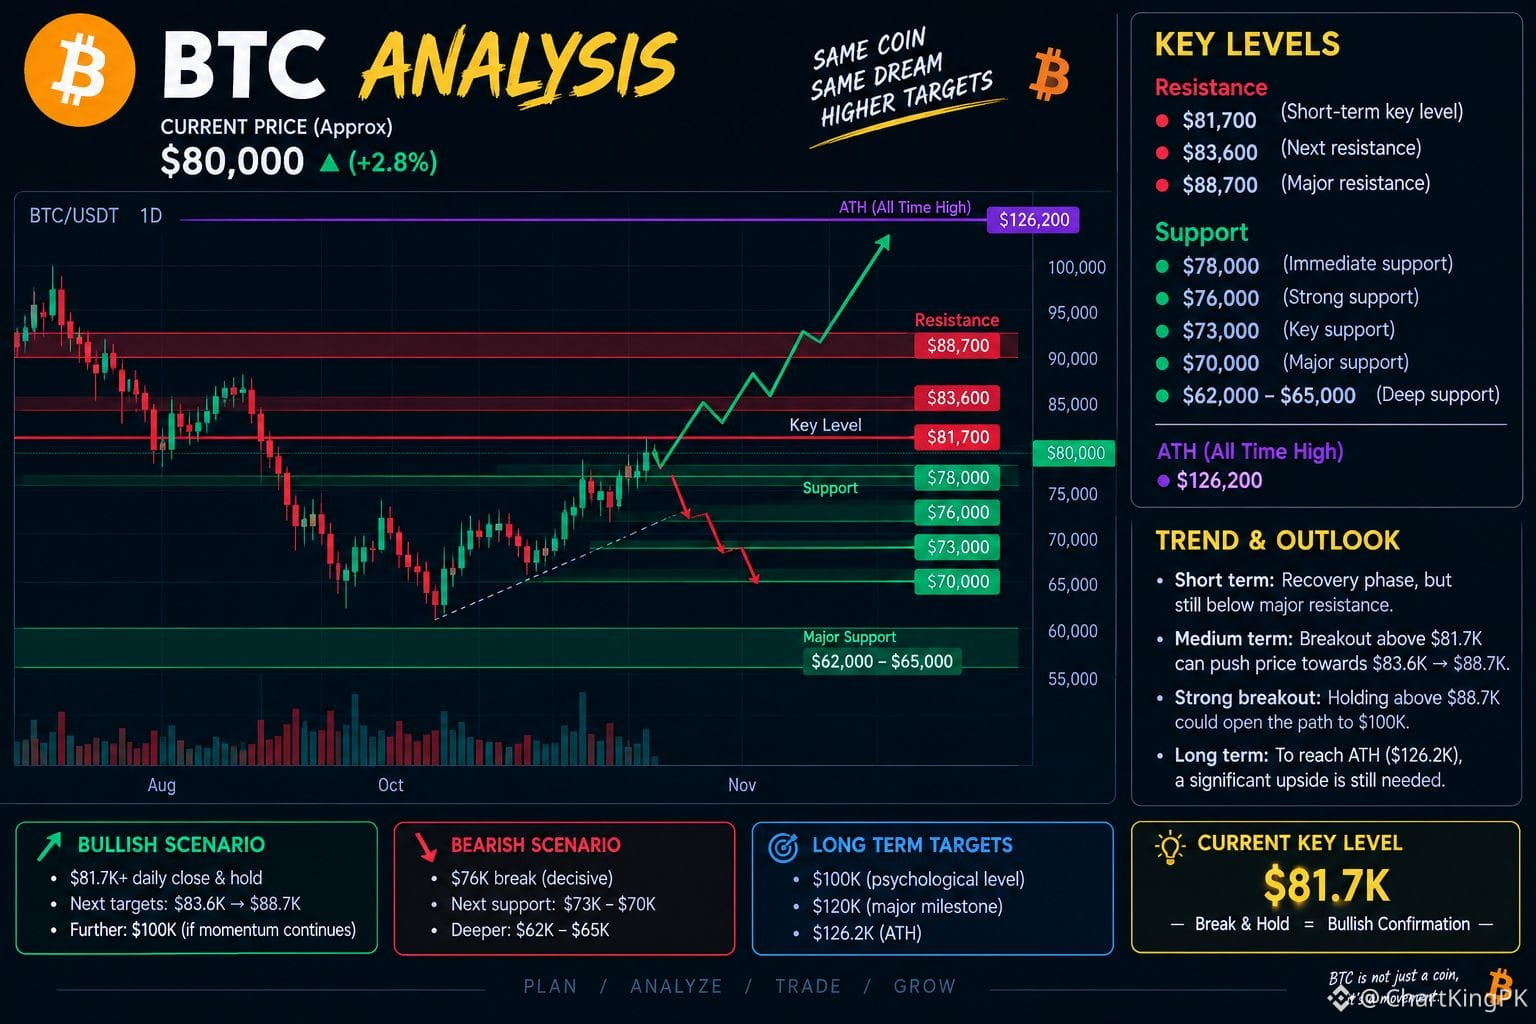
#BTC $BTC Analysis
Current trend: BTC is currently in a recovery phase, but it is still below major resistance.
Resistance: $81.7K → $83.6K → $88.7K
Support: $78K → $76K → $73K → $70K
Bullish scenario: A strong daily close above $81.7K and a hold could push BTC to $83.6K, then $88.7K becomes the key target.
Strong breakout: If it sustains above $88.7K, the market could move toward the $100K zone.
Bearish scenario: If $76K is decisively broken, the $73K–$70K zone may be retested.
ATH: ~ $126.2K. To return to ATH, substantial upside is needed from the current level.
Main level: Right now, $81.7K is the most important short-term confirmation level. #Binance #market_tips
#BTC $BTC Analysis
Current trend: BTC is currently in a recovery phase, but it is still below major resistance.
Resistance: $81.7K → $83.6K → $88.7K
Support: $78K → $76K → $73K → $70K
Bullish scenario: A strong daily close above $81.7K and a hold could push BTC to $83.6K, then $88.7K becomes the key target.
Strong breakout: If it sustains above $88.7K, the market could move toward the $100K zone.
Bearish scenario: If $76K is decisively broken, the $73K–$70K zone may be retested.
ATH: ~ $126.2K. To return to ATH, substantial upside is needed from the current level.
Main level: Right now, $81.7K is the most important short-term confirmation level. #Binance #market_tips
Current trend: BTC is currently in a recovery phase, but it is still below major resistance.
Resistance: $81.7K → $83.6K → $88.7K
Support: $78K → $76K → $73K → $70K
Bullish scenario: A strong daily close above $81.7K and a hold could push BTC to $83.6K, then $88.7K becomes the key target.
Strong breakout: If it sustains above $88.7K, the market could move toward the $100K zone.
Bearish scenario: If $76K is decisively broken, the $73K–$70K zone may be retested.
ATH: ~ $126.2K. To return to ATH, substantial upside is needed from the current level.
Main level: Right now, $81.7K is the most important short-term confirmation level. #Binance #market_tips
94

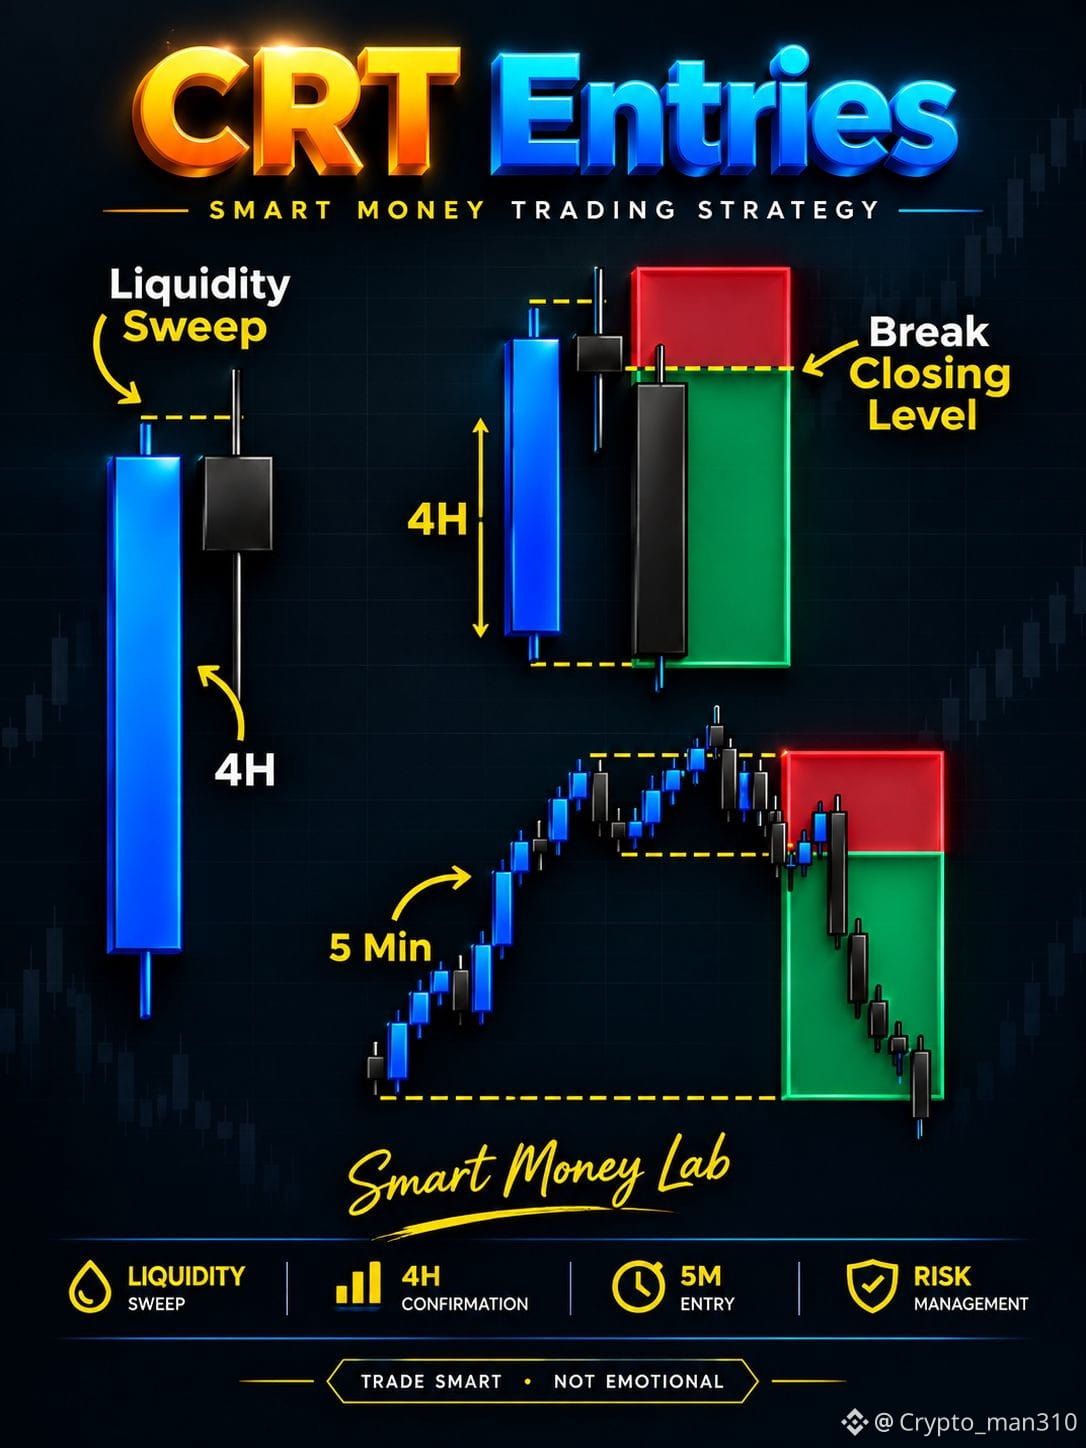
💡 Smart Money Concept for Serious Learners & Traders
📌 CRT = Liquidity → Confirmation → Entry
🧲 1️⃣ LIQUIDITY SWEEP
Price takes liquidity from a previous high/low before making the real move. 👀💧
⏰ 2️⃣ 4H CONFIRMATION
Wait for the 4H candle reaction and a clear break of the important closing level. 📊🔓
⚡ 3️⃣ 5 MIN ENTRY
After the higher-timeframe setup is confirmed, drop to 5M and wait for clean price-action confirmation. 🎯📈
💰 BTC QUICK SNAPSHOT
₿ $BTC : ~$76.4K–$76.9K
📊 24H Volume: ~$29.6B–$30.1B
🔺 24H High: ~$77.08K
🔻 24H Low: ~$75.00K
🧠🔥 THE CRT CHECKLIST
💧 Liquidity Sweep
⬇️ 4H Reaction
🔓 Break of Level
⏱️ 5M Confirmation
🎯 Defined Entry
🛡️ Risk Management
🚫 Don't FOMO.
🚫 Don't chase the candle.
🚫 Don't enter without confirmation.
✅ Study the setup.
✅ Wait for confirmation.
✅ Protect your capital.
✅ Execute with discipline. 🧠📚📈
#BTC #Write2Earn #market_tips #Price-Prediction
$BTC
{spot}(BTCUSDT)
💡 Smart Money Concept for Serious Learners & Traders
📌 CRT = Liquidity → Confirmation → Entry
🧲 1️⃣ LIQUIDITY SWEEP
Price takes liquidity from a previous high/low before making the real move. 👀💧
⏰ 2️⃣ 4H CONFIRMATION
Wait for the 4H candle reaction and a clear break of the important closing level. 📊🔓
⚡ 3️⃣ 5 MIN ENTRY
After the higher-timeframe setup is confirmed, drop to 5M and wait for clean price-action confirmation. 🎯📈
💰 BTC QUICK SNAPSHOT
₿ $BTC : ~$76.4K–$76.9K
📊 24H Volume: ~$29.6B–$30.1B
🔺 24H High: ~$77.08K
🔻 24H Low: ~$75.00K
🧠🔥 THE CRT CHECKLIST
💧 Liquidity Sweep
⬇️ 4H Reaction
🔓 Break of Level
⏱️ 5M Confirmation
🎯 Defined Entry
🛡️ Risk Management
🚫 Don't FOMO.
🚫 Don't chase the candle.
🚫 Don't enter without confirmation.
✅ Study the setup.
✅ Wait for confirmation.
✅ Protect your capital.
✅ Execute with discipline. 🧠📚📈
#BTC #Write2Earn #market_tips #Price-Prediction
$BTC
📌 CRT = Liquidity → Confirmation → Entry
🧲 1️⃣ LIQUIDITY SWEEP
Price takes liquidity from a previous high/low before making the real move. 👀💧
⏰ 2️⃣ 4H CONFIRMATION
Wait for the 4H candle reaction and a clear break of the important closing level. 📊🔓
⚡ 3️⃣ 5 MIN ENTRY
After the higher-timeframe setup is confirmed, drop to 5M and wait for clean price-action confirmation. 🎯📈
💰 BTC QUICK SNAPSHOT
₿ $BTC : ~$76.4K–$76.9K
📊 24H Volume: ~$29.6B–$30.1B
🔺 24H High: ~$77.08K
🔻 24H Low: ~$75.00K
🧠🔥 THE CRT CHECKLIST
💧 Liquidity Sweep
⬇️ 4H Reaction
🔓 Break of Level
⏱️ 5M Confirmation
🎯 Defined Entry
🛡️ Risk Management
🚫 Don't FOMO.
🚫 Don't chase the candle.
🚫 Don't enter without confirmation.
✅ Study the setup.
✅ Wait for confirmation.
✅ Protect your capital.
✅ Execute with discipline. 🧠📚📈
#BTC #Write2Earn #market_tips #Price-Prediction
$BTC
85

·
--
XRP ETFs Top $1.7B Inflows as 21Shares Flags Utility vs Holder Value Gap#CryptoNewss
$XRP
{spot}(XRPUSDT)
$GOOGLB
{spot}(GOOGLBUSDT)
$NVDAB
{spot}(NVDABUSDT)
#Market_Update Asset manager 21Shares has published a formal XRP investment case, outlining four pillars it says justify holding the token.
#market_tips The report arrives as U.S. spot XRP ETFs have drawn more than $1.7 billion in cumulative net inflows, yet the token’s price continues to trade well below its 2025 peak.
#MarketAnalysis Four Pillars, One Open Question
21Shares breaks the XRP investment case into four parts: regulatory clarity, institutional access, measurable utility, and fixed supply.
The first pillar is done. Ripple’s four-year SEC battle ended in August 2025, removing the compliance block that had kept regulated funds and banks away from the token.
The SEC case against Ripple ended in August 2025, clearing one of the biggest regulatory hurdles in the market. The question now, as 21Shares frames it, is whether the remaining three pillars hold up.
Institutional access followed quickly. Seven U.S. spot XRP ETFs launched from November 2025, pulling in $1.3 billion in their first month alone.
Goldman Sachs emerged as the largest XRP ETF holder with $153.8 million in its Q4 2025 filing, though it later exited the full position.
Meanwhile, Citadel built a large bullish XRP ETF position, showing that institutional interest runs deeper than a single name.
The utility pillar is where 21Shares draws the sharpest line. The XRP Ledger settled close to half a trillion dollars in on-chain value over the past 12 months.
Ripple’s RLUSD stablecoin grew from $72 million to roughly $1.6 billion since launch.
XRPL tokenized real-world assets now stand near $4 billion, with JPMorgan and Ondo completing a cross-border tokenized treasury settlement on the ledger.
The Multi-Purpose Token standard rolled out on mainnet lets institutions embed compliance rules directly at the protocol level.
XRP ETFs Top $1.7B Inflows as 21Shares Flags Utility vs Holder Value Gap#CryptoNewss
$XRP
$GOOGLB
$NVDAB
#Market_Update Asset manager 21Shares has published a formal XRP investment case, outlining four pillars it says justify holding the token.
#market_tips The report arrives as U.S. spot XRP ETFs have drawn more than $1.7 billion in cumulative net inflows, yet the token’s price continues to trade well below its 2025 peak.
#MarketAnalysis Four Pillars, One Open Question
21Shares breaks the XRP investment case into four parts: regulatory clarity, institutional access, measurable utility, and fixed supply.
The first pillar is done. Ripple’s four-year SEC battle ended in August 2025, removing the compliance block that had kept regulated funds and banks away from the token.
The SEC case against Ripple ended in August 2025, clearing one of the biggest regulatory hurdles in the market. The question now, as 21Shares frames it, is whether the remaining three pillars hold up.
Institutional access followed quickly. Seven U.S. spot XRP ETFs launched from November 2025, pulling in $1.3 billion in their first month alone.
Goldman Sachs emerged as the largest XRP ETF holder with $153.8 million in its Q4 2025 filing, though it later exited the full position.
Meanwhile, Citadel built a large bullish XRP ETF position, showing that institutional interest runs deeper than a single name.
The utility pillar is where 21Shares draws the sharpest line. The XRP Ledger settled close to half a trillion dollars in on-chain value over the past 12 months.
Ripple’s RLUSD stablecoin grew from $72 million to roughly $1.6 billion since launch.
XRPL tokenized real-world assets now stand near $4 billion, with JPMorgan and Ondo completing a cross-border tokenized treasury settlement on the ledger.
The Multi-Purpose Token standard rolled out on mainnet lets institutions embed compliance rules directly at the protocol level.
$XRP
$GOOGLB
$NVDAB
#Market_Update Asset manager 21Shares has published a formal XRP investment case, outlining four pillars it says justify holding the token.
#market_tips The report arrives as U.S. spot XRP ETFs have drawn more than $1.7 billion in cumulative net inflows, yet the token’s price continues to trade well below its 2025 peak.
#MarketAnalysis Four Pillars, One Open Question
21Shares breaks the XRP investment case into four parts: regulatory clarity, institutional access, measurable utility, and fixed supply.
The first pillar is done. Ripple’s four-year SEC battle ended in August 2025, removing the compliance block that had kept regulated funds and banks away from the token.
The SEC case against Ripple ended in August 2025, clearing one of the biggest regulatory hurdles in the market. The question now, as 21Shares frames it, is whether the remaining three pillars hold up.
Institutional access followed quickly. Seven U.S. spot XRP ETFs launched from November 2025, pulling in $1.3 billion in their first month alone.
Goldman Sachs emerged as the largest XRP ETF holder with $153.8 million in its Q4 2025 filing, though it later exited the full position.
Meanwhile, Citadel built a large bullish XRP ETF position, showing that institutional interest runs deeper than a single name.
The utility pillar is where 21Shares draws the sharpest line. The XRP Ledger settled close to half a trillion dollars in on-chain value over the past 12 months.
Ripple’s RLUSD stablecoin grew from $72 million to roughly $1.6 billion since launch.
XRPL tokenized real-world assets now stand near $4 billion, with JPMorgan and Ondo completing a cross-border tokenized treasury settlement on the ledger.
The Multi-Purpose Token standard rolled out on mainnet lets institutions embed compliance rules directly at the protocol level.
1
170

The irony of this business is Position Size. If trade position size is not correct,it will lead to high cortisol, fear, revenge trading and ultimately trader will end with capital wipe out. Trading is all about mindset. The more early one learn to calculate position size and follow consistentcy then profits are next.
#Binance #altcoins #squarecreator #market_tips #tradinprofit
The irony of this business is Position Size. If trade position size is not correct,it will lead to high cortisol, fear, revenge trading and ultimately trader will end with capital wipe out. Trading is all about mindset. The more early one learn to calculate position size and follow consistentcy then profits are next.
#Binance #altcoins #squarecreator #market_tips #tradinprofit
#Binance #altcoins #squarecreator #market_tips #tradinprofit

1
74

·
--
Big difference .....🧠 There is a difference between someone who simply enters the market and someone who knows how to manage the battle within it.
📊 Trading is not just about numbers moving on a screen; not every rise is a buying opportunity, and not every drop is a selling opportunity.
🎯 A true trader bases their decisions on vision, analysis, and discipline.
⏳ They understand that waiting for the right opportunity is part of the trade itself, and that protecting capital is more important than chasing quick profits.
🔎 You might see dozens of market movements throughout the day, but you don't need to act on all of them.
🧠 You simply need to know which opportunity warrants your decision and which ones are best left to pass by.
🔥 Don't let the market drive you; learn how to steer your own decisions within it.
📈 True strength in trading isn't about winning every trade; it’s about having a methodology that tells you when to enter, why to enter, and when to exit.
💎 Sharpen your tools, strengthen your decisions, and build a mindset that remains unshaken by every market fluctuation.
🚀 Because a professional trader doesn't rely on luck—they build an edge and know exactly how to capitalize on it when the opportunity arises.
#CryptoAMA #newsdaily #InformedInvesting #market_tips #Market_Update
Big difference .....
🧠 There is a difference between someone who simply enters the market and someone who knows how to manage the battle within it.
📊 Trading is not just about numbers moving on a screen; not every rise is a buying opportunity, and not every drop is a selling opportunity.
🎯 A true trader bases their decisions on vision, analysis, and discipline.
⏳ They understand that waiting for the right opportunity is part of the trade itself, and that protecting capital is more important than chasing quick profits.
🔎 You might see dozens of market movements throughout the day, but you don't need to act on all of them.
🧠 You simply need to know which opportunity warrants your decision and which ones are best left to pass by.
🔥 Don't let the market drive you; learn how to steer your own decisions within it.
📈 True strength in trading isn't about winning every trade; it’s about having a methodology that tells you when to enter, why to enter, and when to exit.
💎 Sharpen your tools, strengthen your decisions, and build a mindset that remains unshaken by every market fluctuation.
🚀 Because a professional trader doesn't rely on luck—they build an edge and know exactly how to capitalize on it when the opportunity arises.
#CryptoAMA #newsdaily #InformedInvesting #market_tips #Market_Update
📊 Trading is not just about numbers moving on a screen; not every rise is a buying opportunity, and not every drop is a selling opportunity.
🎯 A true trader bases their decisions on vision, analysis, and discipline.
⏳ They understand that waiting for the right opportunity is part of the trade itself, and that protecting capital is more important than chasing quick profits.
🔎 You might see dozens of market movements throughout the day, but you don't need to act on all of them.
🧠 You simply need to know which opportunity warrants your decision and which ones are best left to pass by.
🔥 Don't let the market drive you; learn how to steer your own decisions within it.
📈 True strength in trading isn't about winning every trade; it’s about having a methodology that tells you when to enter, why to enter, and when to exit.
💎 Sharpen your tools, strengthen your decisions, and build a mindset that remains unshaken by every market fluctuation.
🚀 Because a professional trader doesn't rely on luck—they build an edge and know exactly how to capitalize on it when the opportunity arises.
#CryptoAMA #newsdaily #InformedInvesting #market_tips #Market_Update
71

·
--
Take some profits when the market gives you the chance. Then, when fear takes over and everyone starts rushing for the exit, that’s when I look for opportunities to buy back in.
Keep the strategy simple: take profits during strength, accumulate during weakness, and stay patient. ✨
#BinanceSquareTalks #market_tips
Take some profits when the market gives you the chance. Then, when fear takes over and everyone starts rushing for the exit, that’s when I look for opportunities to buy back in.
Keep the strategy simple: take profits during strength, accumulate during weakness, and stay patient. ✨
#BinanceSquareTalks #market_tips
Keep the strategy simple: take profits during strength, accumulate during weakness, and stay patient. ✨
#BinanceSquareTalks #market_tips
2
168
·
--
Article
Zcash Is Having a Moment Bitcoin Traders Cannot IgnoreFor months, Bitcoin has been the name everyone talks about.
Every move gets analysed. Every breakout gets a headline. Every dip becomes a debate about whether the bull market is back or already finished.
But something very different has been happening underneath the surface.
While Bitcoin has been working its way higher, Zcash has gone absolutely wild.
And at this point, it is getting harder to treat the ZEC rally as just another random altcoin pump.
The numbers are simply too big.
Look at What Actually Happened
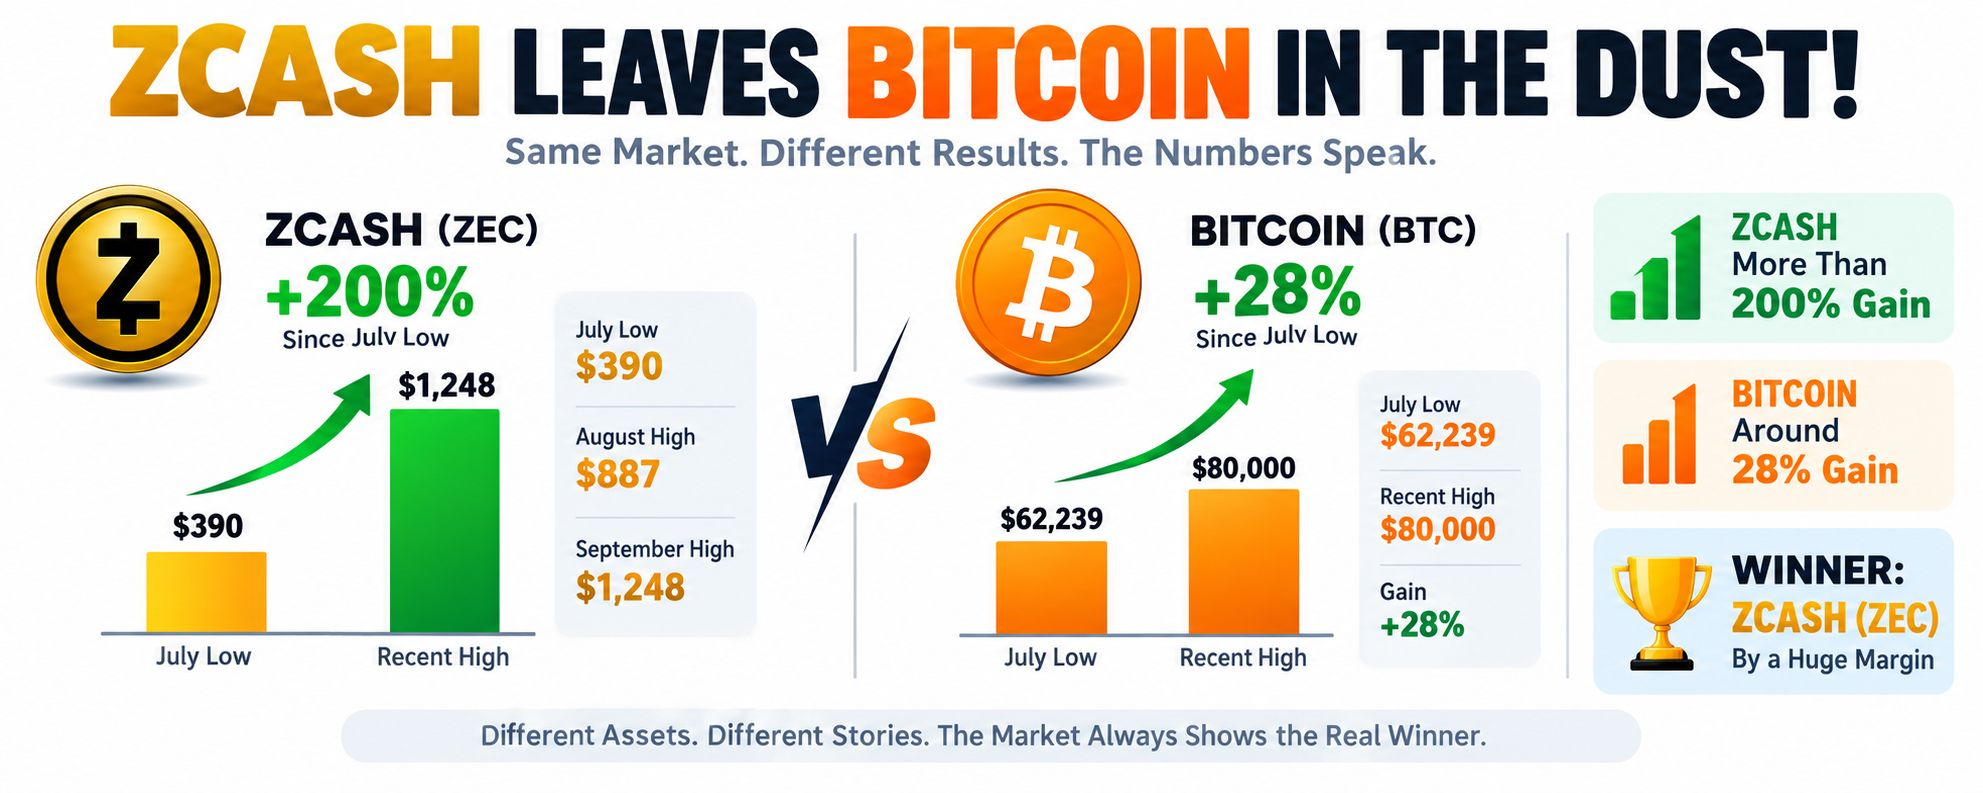
Back in July, Zcash was trading around the $390 area at its lowest point for the month.
It did not look like the obvious winner at the time.
There was no guarantee that ZEC would suddenly become one of the strongest performers in the market.
But then the momentum changed.
Zcash finished July around $457, gained another 85% during August, and then continued its climb into September. Historical data shows ZEC reaching above $1,000 and eventually hitting an intraday high of approximately $1,248.77 on September 6.
From roughly $390 to more than $1,200, that is a move of more than 200%.
Read that again.
More than 200%.
That is not a small difference.
That is the kind of move that forces traders to stop scrolling past the chart and actually ask:
What is happening with Zcash?
And Bitcoin?
Bitcoin has also had a very strong recovery.
Reuters reported that Bitcoin had climbed roughly 30% during its recent rally, breaking above several important moving averages and recovering from the weakness seen earlier in the year.
That is a serious move for an asset as large as Bitcoin.
But here is where the comparison becomes interesting.
Bitcoin has been recovering.
Zcash has been accelerating.
That is the difference.
Bitcoin is moving like a giant market.
Zcash is moving like a much smaller asset suddenly attracting a huge amount of attention.
August Was the Turning Point
The August ZEC move deserves special attention.
Zcash started August around $457.
By the end of the month, it was around $848.
That works out to roughly an 85% monthly increase.
And the move didn't stop there.
September started with ZEC around $830-$848.
Then came the breakout.
On September 3, Zcash jumped more than 16%.
On September 4, it gained another 7% and pushed above $1,000.
Then on September 6, things became even more aggressive.
ZEC opened around $1,026, reached nearly $1,249, and closed around $1,228 — a gain of almost 20% in one day.
That is the kind of price action that gets traders' attention very quickly.
This Is Bigger Than One Green Candle
It would be easy to look at the chart and say:
“Zcash pumped.”
But that doesn't really explain what is happening.
The rally has been building for months.
ZEC was around $190-$220 earlier in the year.
It climbed toward $400.
It pushed above $500.
Then $700.
Then $800.
Then $1,000.
And now the market has seen prices above $1,200.
That is a completely different story from a single-day spike.
It is a sustained change in momentum.
And once an asset starts making higher highs at this speed, traders naturally start looking for the reason behind it.
Why Are People Suddenly Interested in Zcash?
One obvious part of the story is privacy.
Zcash has always had a different identity from Bitcoin.
Bitcoin transactions are publicly visible on the blockchain.
Zcash, meanwhile, was designed to give users the option of shielded transactions using zero-knowledge technology.
That difference has always existed.
But market narratives change.
When privacy becomes a bigger topic in crypto, an asset that was built around privacy can suddenly become much more interesting.
And that appears to be happening now.
Recent coverage has highlighted Zcash's huge rally, increasing market capitalization and growing attention around the privacy-coin narrative. ZEC has even moved into the upper ranks of the cryptocurrency market by market cap during this surge.
There Is Another Reason the Move Looks So Explosive
Size matters.
Bitcoin is enormous.
Zcash is much smaller.
When billions of dollars move around Bitcoin, the percentage impact can be relatively modest because the market is so large.
A similar amount of attention and capital entering a smaller asset can have a much bigger effect.
That is one reason ZEC can move 10%, 20%, or more in a short period while Bitcoin moves at a slower pace.
But there is a catch.
The same thing that creates explosive upside can create explosive downside.
If the money leaves just as quickly, Zcash can fall just as violently.
That is something nobody should forget while celebrating the rally.
The Motley Fool Angle Is Worth Clarifying
There has also been criticism online about financial media supposedly ignoring Zcash while focusing on Bitcoin.
But there is an important detail here.
The Motley Fool has actually published bullish coverage specifically discussing Zcash and its potential.
So the argument should not be that every major publication is pretending Zcash doesn't exist.
The more interesting point is that Zcash's performance is becoming impossible to overlook.
The market itself is creating the headline.
You don't need to manufacture a narrative when the chart has already gone from roughly $390 to above $1,200.
Zcash Has Not “Killed” Bitcoin
And this is where the conversation should remain realistic.
Zcash outperforming Bitcoin over a particular period does not mean Bitcoin is finished.
It does not mean ZEC has replaced BTC.
And it certainly doesn't mean Zcash is suddenly the safer asset.
Bitcoin remains the dominant cryptocurrency by market size, liquidity and institutional importance.
Reuters' recent market analysis also shows that Bitcoin's recovery has been substantial, with the asset breaking through several technical levels during its latest advance.
So this isn't really a story about Bitcoin losing.
It is a story about Zcash winning the performance race during this particular phase of the market.
And those are two very different things.
The Real Question Now
After a move this large, the question changes.
Nobody is wondering whether Zcash can move.
It already has.
The question is whether ZEC can hold the gains.
Can it remain above $1,000?
Can the market absorb profit-taking?
Can demand continue after such a huge run?
Can the privacy narrative attract fresh capital?
And perhaps most importantly:
Was this the beginning of a larger trend, or was the market simply moving too fast?
Nobody knows the answer yet.
That is what makes the current situation so interesting.
The Numbers Have Changed the Conversation
Think about where Zcash was only a few months ago.
ZEC was trading below $300 earlier in 2026.
Then it moved through $400.
Then $500.
Then $800.
Then $1,000.
And now the market has seen it trade above $1,200.
The journey has been incredibly aggressive.
Recent data shows ZEC's July low near $390.07, August's high near $887.74, and September's recent high near $1,248.77.
Those aren't predictions.
Those are the numbers that actually appeared on the market.
Bitcoin Has the Crown, But Zcash Has the Spotlight
Bitcoin still has the crown.
There is no need to pretend otherwise.
But markets don't always reward the biggest asset with the biggest percentage gain.
Sometimes money rotates.
Sometimes traders look for a new narrative.
Sometimes an old project suddenly becomes interesting again.
And sometimes an asset that spent years outside the centre of attention suddenly finds itself at the centre of the conversation.
That is exactly where Zcash appears to be right now.
The privacy narrative is back.
The price momentum is enormous.
Trading interest has increased.
And the chart has gone from around $390 to above $1,200.
The Bottom Line
The most interesting part of this story isn't whether someone likes Bitcoin or Zcash.
Crypto doesn't care about tribal arguments.
The chart doesn't care about maximalists.
The market simply shows where the money is moving.
Bitcoin has delivered a powerful recovery.
But Zcash has delivered a far more explosive percentage move.
From the July low around $390 to above $1,200, ZEC has gained more than 200%.
And after climbing roughly 85% in August alone, the coin continued its explosive run into September.
That doesn't guarantee another 200% move.
It doesn't make Zcash risk-free.
And it doesn't make Bitcoin irrelevant.
But it does make one thing very clear:
Zcash is no longer a coin the market can casually ignore.
For years, Bitcoin dominated the conversation.
Right now, Zcash has forced its way into it.
And after a move from the $390 area to above $1,200, pretending nothing interesting is happening would be much harder than simply looking at the chart.
$ZEC $BTC
#market_tips #BTC #ZEC/USDT
Zcash Is Having a Moment Bitcoin Traders Cannot Ignore
For months, Bitcoin has been the name everyone talks about.
Every move gets analysed. Every breakout gets a headline. Every dip becomes a debate about whether the bull market is back or already finished.
But something very different has been happening underneath the surface.
While Bitcoin has been working its way higher, Zcash has gone absolutely wild.
And at this point, it is getting harder to treat the ZEC rally as just another random altcoin pump.
The numbers are simply too big.
Look at What Actually Happened
Back in July, Zcash was trading around the $390 area at its lowest point for the month.
It did not look like the obvious winner at the time.
There was no guarantee that ZEC would suddenly become one of the strongest performers in the market.
But then the momentum changed.
Zcash finished July around $457, gained another 85% during August, and then continued its climb into September. Historical data shows ZEC reaching above $1,000 and eventually hitting an intraday high of approximately $1,248.77 on September 6.
From roughly $390 to more than $1,200, that is a move of more than 200%.
Read that again.
More than 200%.
That is not a small difference.
That is the kind of move that forces traders to stop scrolling past the chart and actually ask:
What is happening with Zcash?
And Bitcoin?
Bitcoin has also had a very strong recovery.
Reuters reported that Bitcoin had climbed roughly 30% during its recent rally, breaking above several important moving averages and recovering from the weakness seen earlier in the year.
That is a serious move for an asset as large as Bitcoin.
But here is where the comparison becomes interesting.
Bitcoin has been recovering.
Zcash has been accelerating.
That is the difference.
Bitcoin is moving like a giant market.
Zcash is moving like a much smaller asset suddenly attracting a huge amount of attention.
August Was the Turning Point
The August ZEC move deserves special attention.
Zcash started August around $457.
By the end of the month, it was around $848.
That works out to roughly an 85% monthly increase.
And the move didn't stop there.
September started with ZEC around $830-$848.
Then came the breakout.
On September 3, Zcash jumped more than 16%.
On September 4, it gained another 7% and pushed above $1,000.
Then on September 6, things became even more aggressive.
ZEC opened around $1,026, reached nearly $1,249, and closed around $1,228 — a gain of almost 20% in one day.
That is the kind of price action that gets traders' attention very quickly.
This Is Bigger Than One Green Candle
It would be easy to look at the chart and say:
“Zcash pumped.”
But that doesn't really explain what is happening.
The rally has been building for months.
ZEC was around $190-$220 earlier in the year.
It climbed toward $400.
It pushed above $500.
Then $700.
Then $800.
Then $1,000.
And now the market has seen prices above $1,200.
That is a completely different story from a single-day spike.
It is a sustained change in momentum.
And once an asset starts making higher highs at this speed, traders naturally start looking for the reason behind it.
Why Are People Suddenly Interested in Zcash?
One obvious part of the story is privacy.
Zcash has always had a different identity from Bitcoin.
Bitcoin transactions are publicly visible on the blockchain.
Zcash, meanwhile, was designed to give users the option of shielded transactions using zero-knowledge technology.
That difference has always existed.
But market narratives change.
When privacy becomes a bigger topic in crypto, an asset that was built around privacy can suddenly become much more interesting.
And that appears to be happening now.
Recent coverage has highlighted Zcash's huge rally, increasing market capitalization and growing attention around the privacy-coin narrative. ZEC has even moved into the upper ranks of the cryptocurrency market by market cap during this surge.
There Is Another Reason the Move Looks So Explosive
Size matters.
Bitcoin is enormous.
Zcash is much smaller.
When billions of dollars move around Bitcoin, the percentage impact can be relatively modest because the market is so large.
A similar amount of attention and capital entering a smaller asset can have a much bigger effect.
That is one reason ZEC can move 10%, 20%, or more in a short period while Bitcoin moves at a slower pace.
But there is a catch.
The same thing that creates explosive upside can create explosive downside.
If the money leaves just as quickly, Zcash can fall just as violently.
That is something nobody should forget while celebrating the rally.
The Motley Fool Angle Is Worth Clarifying
There has also been criticism online about financial media supposedly ignoring Zcash while focusing on Bitcoin.
But there is an important detail here.
The Motley Fool has actually published bullish coverage specifically discussing Zcash and its potential.
So the argument should not be that every major publication is pretending Zcash doesn't exist.
The more interesting point is that Zcash's performance is becoming impossible to overlook.
The market itself is creating the headline.
You don't need to manufacture a narrative when the chart has already gone from roughly $390 to above $1,200.
Zcash Has Not “Killed” Bitcoin
And this is where the conversation should remain realistic.
Zcash outperforming Bitcoin over a particular period does not mean Bitcoin is finished.
It does not mean ZEC has replaced BTC.
And it certainly doesn't mean Zcash is suddenly the safer asset.
Bitcoin remains the dominant cryptocurrency by market size, liquidity and institutional importance.
Reuters' recent market analysis also shows that Bitcoin's recovery has been substantial, with the asset breaking through several technical levels during its latest advance.
So this isn't really a story about Bitcoin losing.
It is a story about Zcash winning the performance race during this particular phase of the market.
And those are two very different things.
The Real Question Now
After a move this large, the question changes.
Nobody is wondering whether Zcash can move.
It already has.
The question is whether ZEC can hold the gains.
Can it remain above $1,000?
Can the market absorb profit-taking?
Can demand continue after such a huge run?
Can the privacy narrative attract fresh capital?
And perhaps most importantly:
Was this the beginning of a larger trend, or was the market simply moving too fast?
Nobody knows the answer yet.
That is what makes the current situation so interesting.
The Numbers Have Changed the Conversation
Think about where Zcash was only a few months ago.
ZEC was trading below $300 earlier in 2026.
Then it moved through $400.
Then $500.
Then $800.
Then $1,000.
And now the market has seen it trade above $1,200.
The journey has been incredibly aggressive.
Recent data shows ZEC's July low near $390.07, August's high near $887.74, and September's recent high near $1,248.77.
Those aren't predictions.
Those are the numbers that actually appeared on the market.
Bitcoin Has the Crown, But Zcash Has the Spotlight
Bitcoin still has the crown.
There is no need to pretend otherwise.
But markets don't always reward the biggest asset with the biggest percentage gain.
Sometimes money rotates.
Sometimes traders look for a new narrative.
Sometimes an old project suddenly becomes interesting again.
And sometimes an asset that spent years outside the centre of attention suddenly finds itself at the centre of the conversation.
That is exactly where Zcash appears to be right now.
The privacy narrative is back.
The price momentum is enormous.
Trading interest has increased.
And the chart has gone from around $390 to above $1,200.
The Bottom Line
The most interesting part of this story isn't whether someone likes Bitcoin or Zcash.
Crypto doesn't care about tribal arguments.
The chart doesn't care about maximalists.
The market simply shows where the money is moving.
Bitcoin has delivered a powerful recovery.
But Zcash has delivered a far more explosive percentage move.
From the July low around $390 to above $1,200, ZEC has gained more than 200%.
And after climbing roughly 85% in August alone, the coin continued its explosive run into September.
That doesn't guarantee another 200% move.
It doesn't make Zcash risk-free.
And it doesn't make Bitcoin irrelevant.
But it does make one thing very clear:
Zcash is no longer a coin the market can casually ignore.
For years, Bitcoin dominated the conversation.
Right now, Zcash has forced its way into it.
And after a move from the $390 area to above $1,200, pretending nothing interesting is happening would be much harder than simply looking at the chart.
$ZEC $BTC
#market_tips #BTC #ZEC/USDT
Every move gets analysed. Every breakout gets a headline. Every dip becomes a debate about whether the bull market is back or already finished.
But something very different has been happening underneath the surface.
While Bitcoin has been working its way higher, Zcash has gone absolutely wild.
And at this point, it is getting harder to treat the ZEC rally as just another random altcoin pump.
The numbers are simply too big.
Look at What Actually Happened
Back in July, Zcash was trading around the $390 area at its lowest point for the month.
It did not look like the obvious winner at the time.
There was no guarantee that ZEC would suddenly become one of the strongest performers in the market.
But then the momentum changed.
Zcash finished July around $457, gained another 85% during August, and then continued its climb into September. Historical data shows ZEC reaching above $1,000 and eventually hitting an intraday high of approximately $1,248.77 on September 6.
From roughly $390 to more than $1,200, that is a move of more than 200%.
Read that again.
More than 200%.
That is not a small difference.
That is the kind of move that forces traders to stop scrolling past the chart and actually ask:
What is happening with Zcash?
And Bitcoin?
Bitcoin has also had a very strong recovery.
Reuters reported that Bitcoin had climbed roughly 30% during its recent rally, breaking above several important moving averages and recovering from the weakness seen earlier in the year.
That is a serious move for an asset as large as Bitcoin.
But here is where the comparison becomes interesting.
Bitcoin has been recovering.
Zcash has been accelerating.
That is the difference.
Bitcoin is moving like a giant market.
Zcash is moving like a much smaller asset suddenly attracting a huge amount of attention.
August Was the Turning Point
The August ZEC move deserves special attention.
Zcash started August around $457.
By the end of the month, it was around $848.
That works out to roughly an 85% monthly increase.
And the move didn't stop there.
September started with ZEC around $830-$848.
Then came the breakout.
On September 3, Zcash jumped more than 16%.
On September 4, it gained another 7% and pushed above $1,000.
Then on September 6, things became even more aggressive.
ZEC opened around $1,026, reached nearly $1,249, and closed around $1,228 — a gain of almost 20% in one day.
That is the kind of price action that gets traders' attention very quickly.
This Is Bigger Than One Green Candle
It would be easy to look at the chart and say:
“Zcash pumped.”
But that doesn't really explain what is happening.
The rally has been building for months.
ZEC was around $190-$220 earlier in the year.
It climbed toward $400.
It pushed above $500.
Then $700.
Then $800.
Then $1,000.
And now the market has seen prices above $1,200.
That is a completely different story from a single-day spike.
It is a sustained change in momentum.
And once an asset starts making higher highs at this speed, traders naturally start looking for the reason behind it.
Why Are People Suddenly Interested in Zcash?
One obvious part of the story is privacy.
Zcash has always had a different identity from Bitcoin.
Bitcoin transactions are publicly visible on the blockchain.
Zcash, meanwhile, was designed to give users the option of shielded transactions using zero-knowledge technology.
That difference has always existed.
But market narratives change.
When privacy becomes a bigger topic in crypto, an asset that was built around privacy can suddenly become much more interesting.
And that appears to be happening now.
Recent coverage has highlighted Zcash's huge rally, increasing market capitalization and growing attention around the privacy-coin narrative. ZEC has even moved into the upper ranks of the cryptocurrency market by market cap during this surge.
There Is Another Reason the Move Looks So Explosive
Size matters.
Bitcoin is enormous.
Zcash is much smaller.
When billions of dollars move around Bitcoin, the percentage impact can be relatively modest because the market is so large.
A similar amount of attention and capital entering a smaller asset can have a much bigger effect.
That is one reason ZEC can move 10%, 20%, or more in a short period while Bitcoin moves at a slower pace.
But there is a catch.
The same thing that creates explosive upside can create explosive downside.
If the money leaves just as quickly, Zcash can fall just as violently.
That is something nobody should forget while celebrating the rally.
The Motley Fool Angle Is Worth Clarifying
There has also been criticism online about financial media supposedly ignoring Zcash while focusing on Bitcoin.
But there is an important detail here.
The Motley Fool has actually published bullish coverage specifically discussing Zcash and its potential.
So the argument should not be that every major publication is pretending Zcash doesn't exist.
The more interesting point is that Zcash's performance is becoming impossible to overlook.
The market itself is creating the headline.
You don't need to manufacture a narrative when the chart has already gone from roughly $390 to above $1,200.
Zcash Has Not “Killed” Bitcoin
And this is where the conversation should remain realistic.
Zcash outperforming Bitcoin over a particular period does not mean Bitcoin is finished.
It does not mean ZEC has replaced BTC.
And it certainly doesn't mean Zcash is suddenly the safer asset.
Bitcoin remains the dominant cryptocurrency by market size, liquidity and institutional importance.
Reuters' recent market analysis also shows that Bitcoin's recovery has been substantial, with the asset breaking through several technical levels during its latest advance.
So this isn't really a story about Bitcoin losing.
It is a story about Zcash winning the performance race during this particular phase of the market.
And those are two very different things.
The Real Question Now
After a move this large, the question changes.
Nobody is wondering whether Zcash can move.
It already has.
The question is whether ZEC can hold the gains.
Can it remain above $1,000?
Can the market absorb profit-taking?
Can demand continue after such a huge run?
Can the privacy narrative attract fresh capital?
And perhaps most importantly:
Was this the beginning of a larger trend, or was the market simply moving too fast?
Nobody knows the answer yet.
That is what makes the current situation so interesting.
The Numbers Have Changed the Conversation
Think about where Zcash was only a few months ago.
ZEC was trading below $300 earlier in 2026.
Then it moved through $400.
Then $500.
Then $800.
Then $1,000.
And now the market has seen it trade above $1,200.
The journey has been incredibly aggressive.
Recent data shows ZEC's July low near $390.07, August's high near $887.74, and September's recent high near $1,248.77.
Those aren't predictions.
Those are the numbers that actually appeared on the market.
Bitcoin Has the Crown, But Zcash Has the Spotlight
Bitcoin still has the crown.
There is no need to pretend otherwise.
But markets don't always reward the biggest asset with the biggest percentage gain.
Sometimes money rotates.
Sometimes traders look for a new narrative.
Sometimes an old project suddenly becomes interesting again.
And sometimes an asset that spent years outside the centre of attention suddenly finds itself at the centre of the conversation.
That is exactly where Zcash appears to be right now.
The privacy narrative is back.
The price momentum is enormous.
Trading interest has increased.
And the chart has gone from around $390 to above $1,200.
The Bottom Line
The most interesting part of this story isn't whether someone likes Bitcoin or Zcash.
Crypto doesn't care about tribal arguments.
The chart doesn't care about maximalists.
The market simply shows where the money is moving.
Bitcoin has delivered a powerful recovery.
But Zcash has delivered a far more explosive percentage move.
From the July low around $390 to above $1,200, ZEC has gained more than 200%.
And after climbing roughly 85% in August alone, the coin continued its explosive run into September.
That doesn't guarantee another 200% move.
It doesn't make Zcash risk-free.
And it doesn't make Bitcoin irrelevant.
But it does make one thing very clear:
Zcash is no longer a coin the market can casually ignore.
For years, Bitcoin dominated the conversation.
Right now, Zcash has forced its way into it.
And after a move from the $390 area to above $1,200, pretending nothing interesting is happening would be much harder than simply looking at the chart.
$ZEC $BTC
#market_tips #BTC #ZEC/USDT
211
·
--
Crypto price predictions: Dogecoin, XRP, Venice Token (VVV)#CryptoNewss
$XRP
{spot}(XRPUSDT)
$RE
{spot}(REUSDT)
$DOGE
{spot}(DOGEUSDT)
#Market_Update XRP price forecast
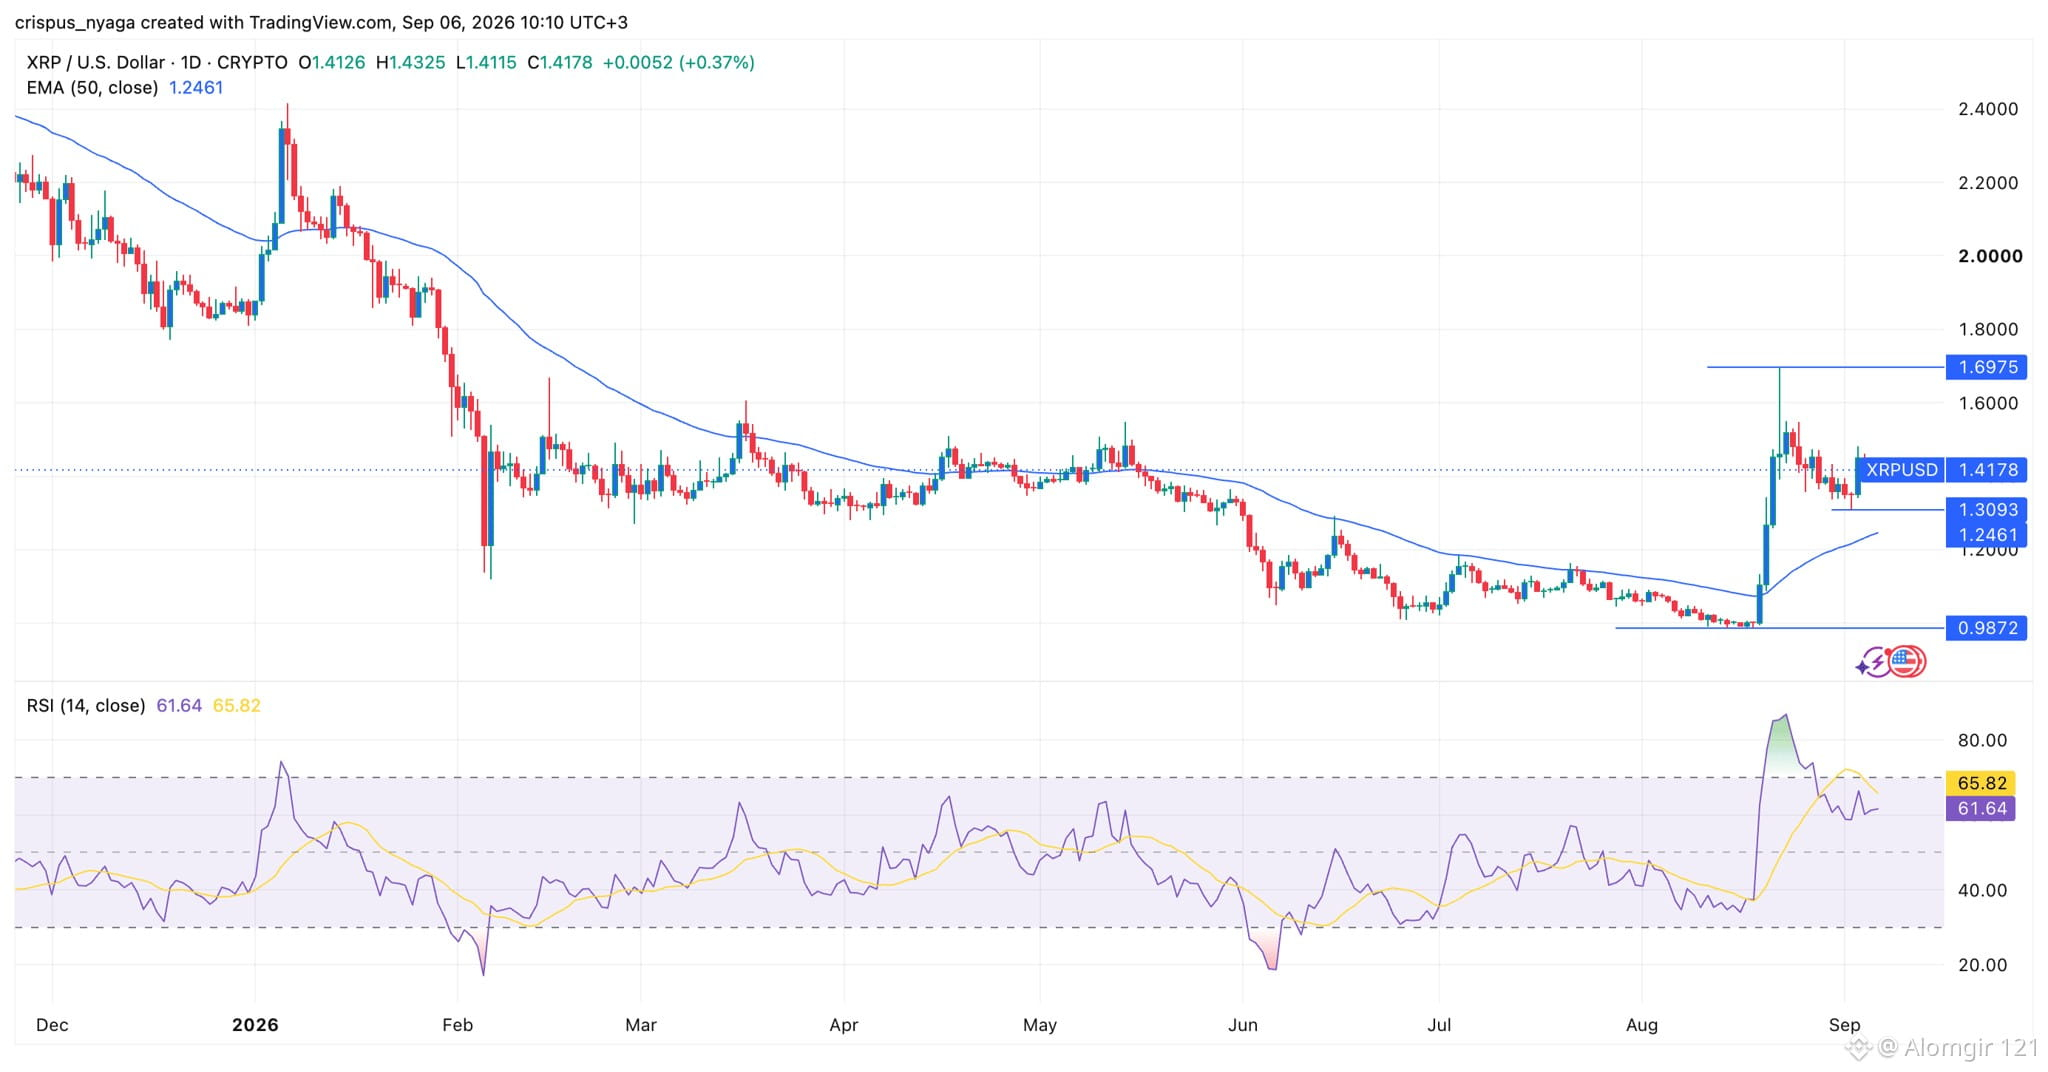
XRP token has held steady in the past few weeks and is hovering near its highest level in August. This rebound happened after it formed a falling wedge pattern, which is made up of two descending and converging trendlines. This pattern normally leads to a strong bullish breakout.#CryptoAnalysis"
The token’s rally has coincided with the ongoing demand for its ETFs. XRP ETF inflows jumped by over $159 million last month and have already added over $13 million this month. The supply in key exchanges like Binance and Coinbase has continued to fall.
Technically, XRP has moved above the 50-day moving average, a sign that bulls are in control for now. It has formed a bullish flag pattern. Therefore, there is a likelihood that the coin will have a strong bullish breakout, potentially to this month’s high of $1.6975.
Dogecoin price prediction#market_tips #
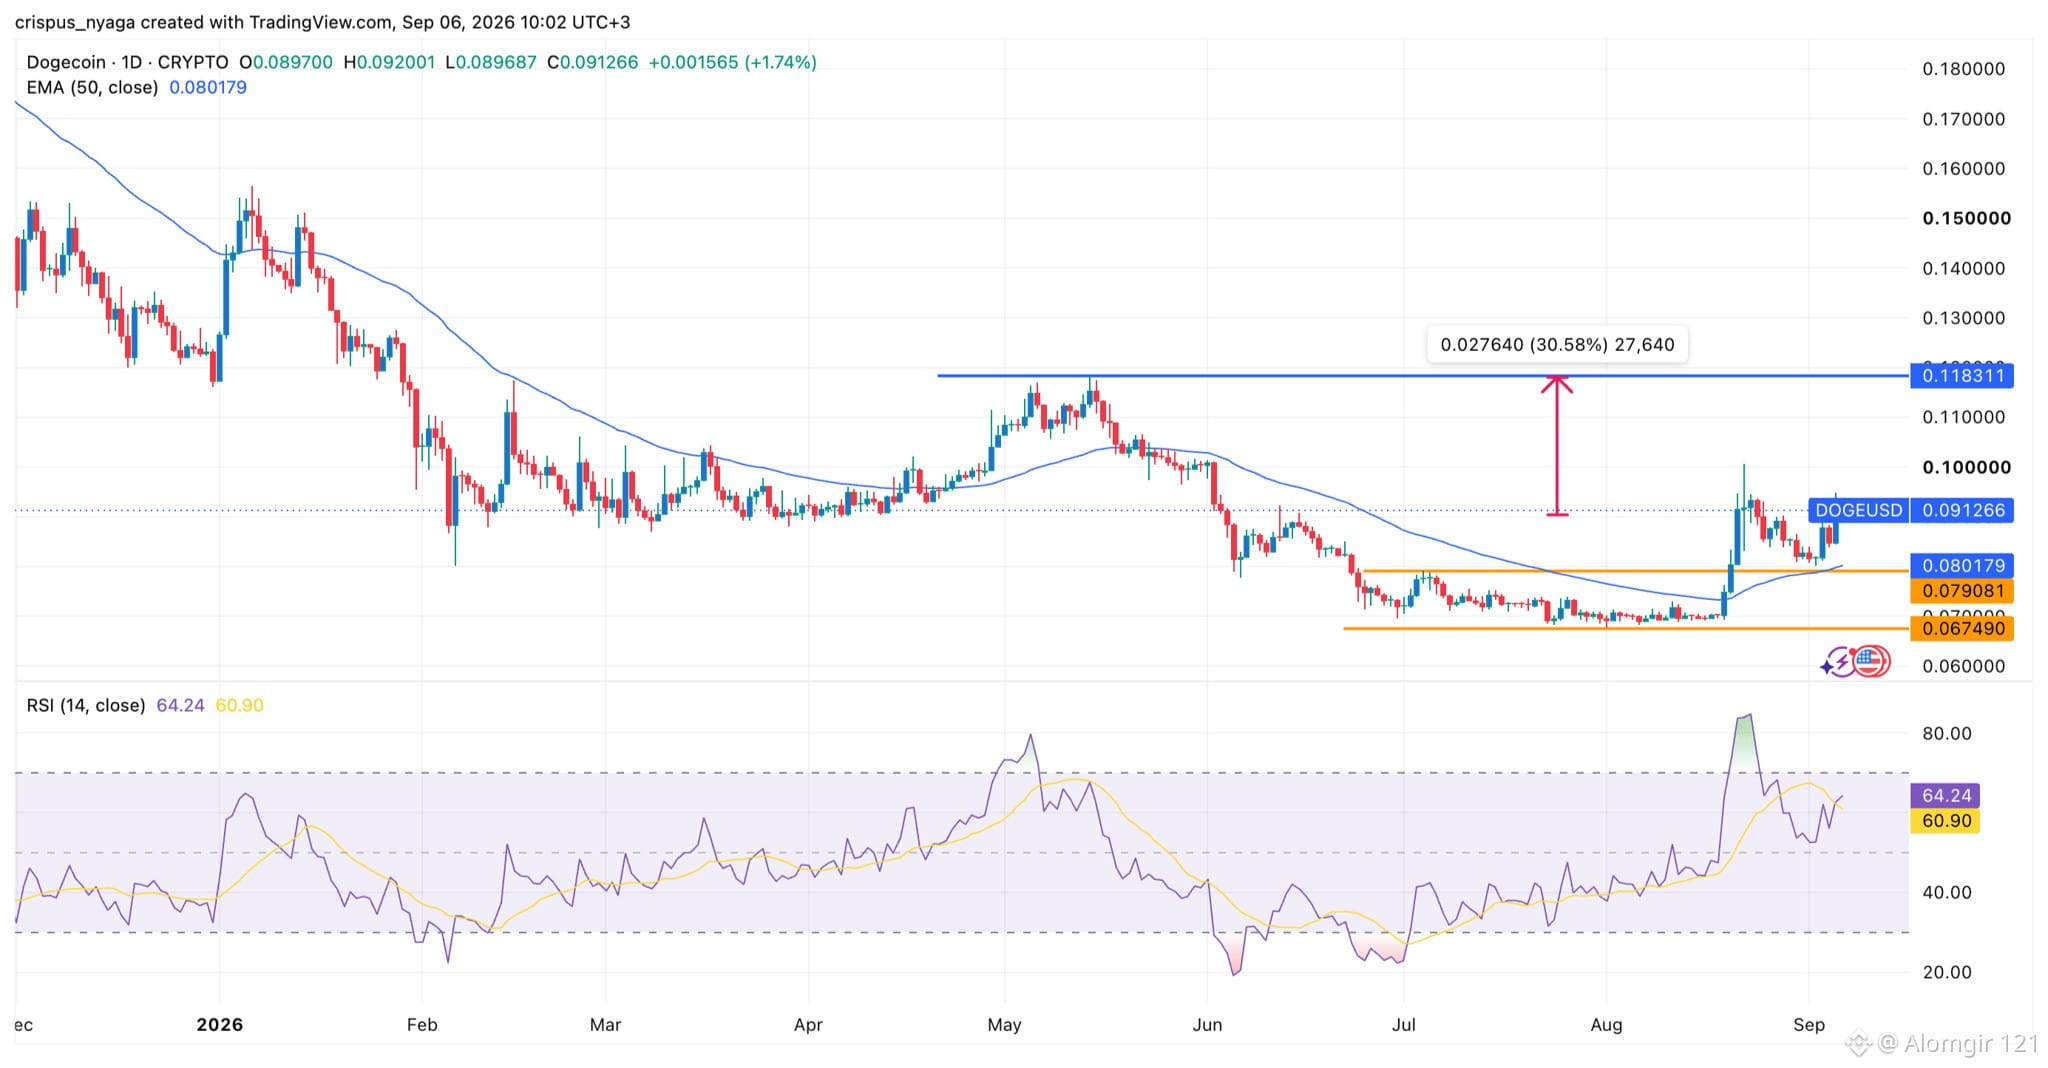
The daily chart shows that the DOGE price has remained inside a narrow range in the past few months. It remained between the support and resistance levels of $0.067 and $0.0790 between June 24 and August 20th. In some instances, this consolidation is usually a sign that investors are accumulating the token.
DOGE price has now moved above the important resistance level of $0.0790, confirming a bullish breakout. It has also retested it, in a process known as a break-and-retest, which is a common continuation sign in technical analysis.
The token has remained above the 50-day Exponential Moving Average (EMA), while the Relative Strength Index (RSI) has jumped above the neutral level of 50.
This performance has coincided with the higher volume, with the 24-hour figure rising to over $1.49 billion. Its futures open interest have risen, a sign that investor demand is rising. However, DOGE ETF inflows have struggled, with their outflows hitting $343k this month...
Crypto price predictions: Dogecoin, XRP, Venice Token (VVV)#CryptoNewss
$XRP
$RE
$DOGE
#Market_Update XRP price forecast
XRP token has held steady in the past few weeks and is hovering near its highest level in August. This rebound happened after it formed a falling wedge pattern, which is made up of two descending and converging trendlines. This pattern normally leads to a strong bullish breakout.#CryptoAnalysis"
The token’s rally has coincided with the ongoing demand for its ETFs. XRP ETF inflows jumped by over $159 million last month and have already added over $13 million this month. The supply in key exchanges like Binance and Coinbase has continued to fall.
Technically, XRP has moved above the 50-day moving average, a sign that bulls are in control for now. It has formed a bullish flag pattern. Therefore, there is a likelihood that the coin will have a strong bullish breakout, potentially to this month’s high of $1.6975.
Dogecoin price prediction#market_tips #
The daily chart shows that the DOGE price has remained inside a narrow range in the past few months. It remained between the support and resistance levels of $0.067 and $0.0790 between June 24 and August 20th. In some instances, this consolidation is usually a sign that investors are accumulating the token.
DOGE price has now moved above the important resistance level of $0.0790, confirming a bullish breakout. It has also retested it, in a process known as a break-and-retest, which is a common continuation sign in technical analysis.
The token has remained above the 50-day Exponential Moving Average (EMA), while the Relative Strength Index (RSI) has jumped above the neutral level of 50.
This performance has coincided with the higher volume, with the 24-hour figure rising to over $1.49 billion. Its futures open interest have risen, a sign that investor demand is rising. However, DOGE ETF inflows have struggled, with their outflows hitting $343k this month...
$XRP
$RE
$DOGE
#Market_Update XRP price forecast
XRP token has held steady in the past few weeks and is hovering near its highest level in August. This rebound happened after it formed a falling wedge pattern, which is made up of two descending and converging trendlines. This pattern normally leads to a strong bullish breakout.#CryptoAnalysis"
The token’s rally has coincided with the ongoing demand for its ETFs. XRP ETF inflows jumped by over $159 million last month and have already added over $13 million this month. The supply in key exchanges like Binance and Coinbase has continued to fall.
Technically, XRP has moved above the 50-day moving average, a sign that bulls are in control for now. It has formed a bullish flag pattern. Therefore, there is a likelihood that the coin will have a strong bullish breakout, potentially to this month’s high of $1.6975.
Dogecoin price prediction#market_tips #
The daily chart shows that the DOGE price has remained inside a narrow range in the past few months. It remained between the support and resistance levels of $0.067 and $0.0790 between June 24 and August 20th. In some instances, this consolidation is usually a sign that investors are accumulating the token.
DOGE price has now moved above the important resistance level of $0.0790, confirming a bullish breakout. It has also retested it, in a process known as a break-and-retest, which is a common continuation sign in technical analysis.
The token has remained above the 50-day Exponential Moving Average (EMA), while the Relative Strength Index (RSI) has jumped above the neutral level of 50.
This performance has coincided with the higher volume, with the 24-hour figure rising to over $1.49 billion. Its futures open interest have risen, a sign that investor demand is rising. However, DOGE ETF inflows have struggled, with their outflows hitting $343k this month...
262
·
--
Bullish
$UNI LONG BUYERS JUST FLIPPED THE WHOLE STRUCTURE
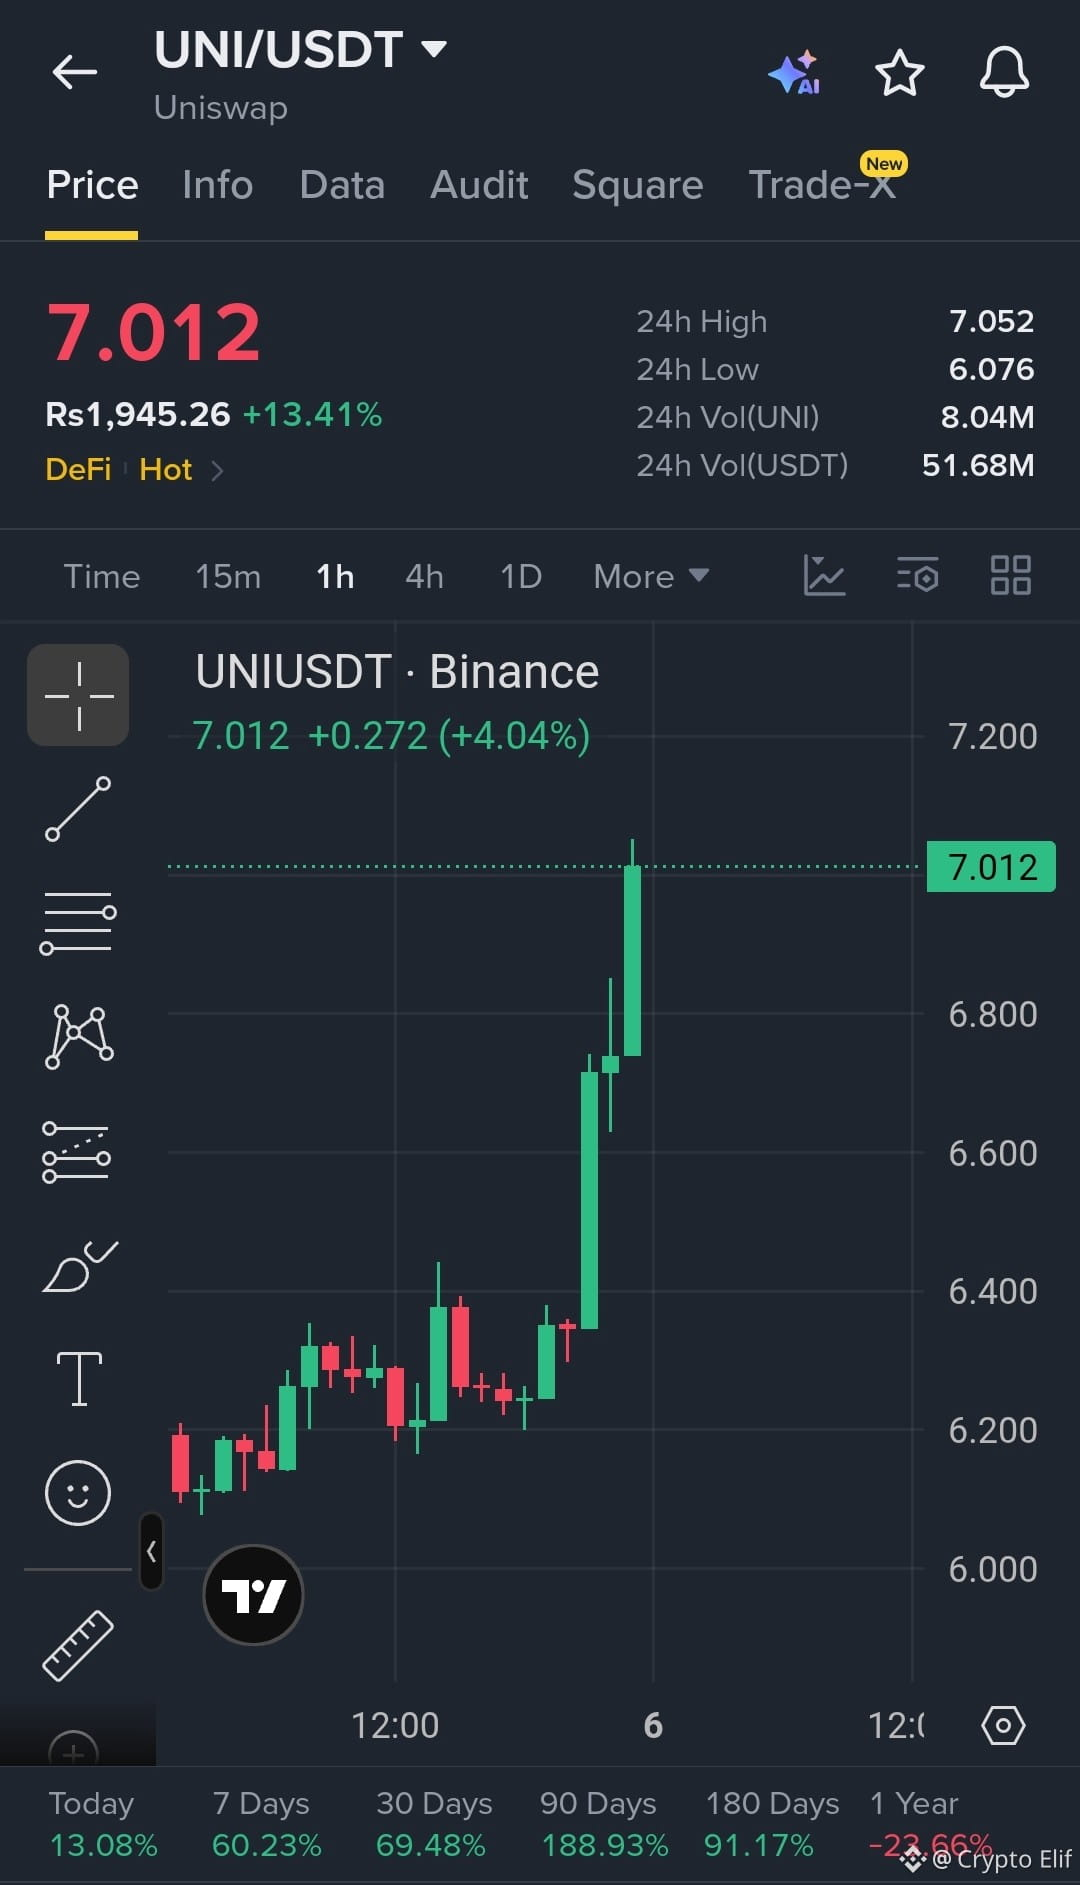
Guys, $UNI is moving with serious strength on the 1H chart. Price has pushed through the previous resistance zone and is now trading around 7.01, with the breakout candle showing strong buyer participation.
Entry: 6.90 – 7.02
TP1: 7.20
TP2: 7.50
TP3: 8.00
SL: 6.70
As long as 6.70–6.80 holds as support, the bullish structure remains intact. A clean break above the 7.05 area could trigger another momentum leg, so I’m watching this one closely. Don't chase blindly after the pump; a retest can offer the cleaner entry.
#ZECHitsANewAllTimeHigh #UNI #market_tips #MarketUpdate
{spot}(UNIUSDT)
$UNI LONG BUYERS JUST FLIPPED THE WHOLE STRUCTURE
Guys, $UNI is moving with serious strength on the 1H chart. Price has pushed through the previous resistance zone and is now trading around 7.01, with the breakout candle showing strong buyer participation.
Entry: 6.90 – 7.02
TP1: 7.20
TP2: 7.50
TP3: 8.00
SL: 6.70
As long as 6.70–6.80 holds as support, the bullish structure remains intact. A clean break above the 7.05 area could trigger another momentum leg, so I’m watching this one closely. Don't chase blindly after the pump; a retest can offer the cleaner entry.
#ZECHitsANewAllTimeHigh #UNI #market_tips #MarketUpdate
Guys, $UNI is moving with serious strength on the 1H chart. Price has pushed through the previous resistance zone and is now trading around 7.01, with the breakout candle showing strong buyer participation.
Entry: 6.90 – 7.02
TP1: 7.20
TP2: 7.50
TP3: 8.00
SL: 6.70
As long as 6.70–6.80 holds as support, the bullish structure remains intact. A clean break above the 7.05 area could trigger another momentum leg, so I’m watching this one closely. Don't chase blindly after the pump; a retest can offer the cleaner entry.
#ZECHitsANewAllTimeHigh #UNI #market_tips #MarketUpdate
4
52

·
--
Article
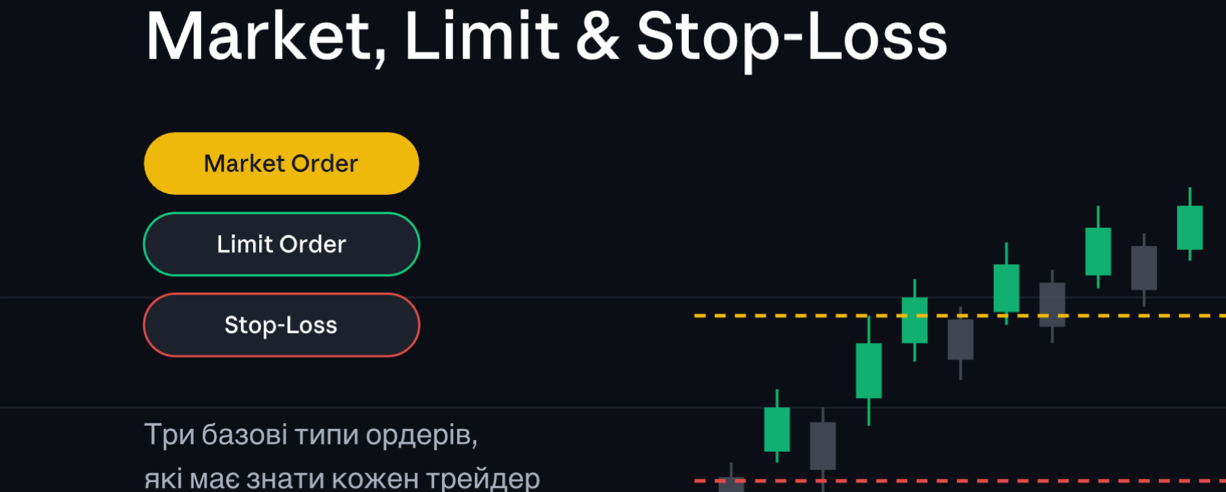
What Are Market Orders, Limit Orders, and Stop-Loss?Market Order, Limit Order, and Stop-Loss are three terms every crypto beginner should understand.
If you have ever opened Binance and seen buttons like Buy, Sell, Limit, Market, and Stop-Loss and thought:
“Wait… what exactly am I supposed to click?”
Don’t worry.
In this guide, we’ll break everything down in simple language — no complicated trading terminology and no unnecessary theory.
By the end, you’ll understand the difference between Market and Limit Orders, how Stop-Loss works, and why choosing the wrong order type can cost you money.
First: What Is an Order?
An order is basically an instruction you give an exchange to buy or sell an asset under certain conditions.
For example, you might say:
“Buy Bitcoin for me right now.”
That’s a Market Order.
Or:
“Buy Bitcoin only if the price drops to $95,000.”
That’s a Limit Order.
Or:
“If Bitcoin drops to a certain level, sell my position to limit my potential loss.”
That’s the basic idea behind a Stop-Loss.
So the difference is actually quite simple.
🟢 1. Market Order — “Buy It Now”
A Market Order tells the exchange to buy or sell an asset as quickly as possible at the best available market price.
Imagine Bitcoin is currently trading around:
$100,000
You select:
Buy → Market
You are essentially telling the exchange:
“I want to buy now. The exact price is less important than getting the order executed.”
The exchange matches your order with available orders in the market.
The main advantage?
⚡ Speed.
You don't have to wait for Bitcoin to reach a specific price.
But there is an important detail.
The final execution price may not be exactly the price you see on your screen.
During periods of high volatility or low liquidity, you can experience slippage — the difference between the expected price and the actual execution price.
So remember:
Market = “I want execution now.”
🔵 2. Limit Order — “Buy It, But Only at My Price”
Now imagine Bitcoin is trading at:
$100,000
But you only want to buy if the price drops to:
$95,000
You could place a:
Limit Buy → $95,000
Now the exchange waits.
If the market reaches your specified price, your order may be executed.
But what if Bitcoin goes:
$100K → $105K → $110K?
Your $95,000 order may simply remain unfilled.
That’s because a Limit Order gives you price control, but execution is not guaranteed.
So:
Limit = “I’m willing to wait for my price.”
🟠 Market vs. Limit
Here’s the easiest way to remember the difference:
Market OrderLimit OrderExecutionAs quickly as possibleOnly when conditions are metPriceBest available market priceYou specify the pricePrice control❌ Lower✅ HigherExecution guaranteed?Generally prioritized for execution❌ NoBest forImmediate tradesTargeting a specific price
In one sentence:
Want to trade now? → Market.
Want a specific price? → Limit.
🔴 3. Stop-Loss — Your “Emergency Exit”
Now we get to one of the most important concepts in trading:
Stop-Loss.
Imagine you bought Bitcoin at:
$100,000
You don't want to sit in front of the chart all day.
But you also don't want to wake up tomorrow and discover Bitcoin has dropped dramatically.
So you can define a price level where you want to exit the position if the market moves against you.
For example:
Stop-Loss = $95,000
If the relevant trigger condition is reached, the system can activate the order according to the type of stop order you selected.
In simple terms:
Stop-Loss = “If the market moves against me to this level, get me out.”
The purpose isn't to guarantee a profit.
It's to help you manage risk.
⚠️ Important: Stop-Loss Doesn't Guarantee Your Exact Exit Price
This is one of the biggest things beginners misunderstand.
Imagine you set a Stop-Loss at:
$95,000
But the market suddenly moves:
$96K → $94K → $92K
Depending on the order type and market conditions, your actual execution price can differ from your stop level.
This is particularly important with stop-market orders because once triggered, they become market orders.
So:
Stop-Loss is a risk-management tool — not a guarantee of a specific execution price.
🧠 Stop-Market vs. Stop-Limit
This is where things can get confusing.
Stop-Market
You define a:
Stop Price
When the trigger is reached, a Market Order is activated.
The focus is:
“Get the order into the market.”
But the exact execution price isn't guaranteed.
Stop-Limit
Here you have two prices:
Stop Price → Limit Price
When the stop price is reached, a Limit Order is placed.
For example:
Stop Price: $95,000
Limit Price: $94,500
If the stop is triggered, a Limit Order is placed at the specified limit price.
This gives you more control over the price, but introduces another risk:
If the market moves below your limit price too quickly, the order may not be filled.
So:
Stop-Market → greater focus on execution.
Stop-Limit → greater price control, but potentially greater risk of non-execution.
📊 Let's Look at a Simple Example
Imagine you buy Bitcoin at:
Entry: $100,000
You decide:
Take Profit: $110,000
Stop-Loss: $95,000
Now there are two basic scenarios.
🚀 Scenario #1 — Bitcoin Goes Up
$100K → $103K → $107K → $110K
You reach your target and can choose to take profit.
📉 Scenario #2 — Bitcoin Goes Down
$100K → $98K → $96K → $95K
Your Stop-Loss level is reached.
Your predefined exit mechanism is triggered.
You may take a loss — but the entire purpose of the Stop-Loss was to avoid allowing a potentially larger loss to continue unchecked.
❌ 5 Mistakes Beginners Make
1. Using Market Orders Without Understanding Them
Market doesn't mean:
“Buy exactly at the price I see.”
It means:
“Execute my order using the available market liquidity.”
2. Thinking Every Limit Order Will Be Filled
It won't.
If the market never reaches your specified price, your order may remain unfilled.
3. Assuming Stop-Loss Guarantees an Exact Price
It doesn't.
Fast-moving markets can cause the actual execution price to differ from your stop level.
4. Setting Stop-Loss Randomly
There is no universal rule like:
“Always set your Stop-Loss at -5%.”
The appropriate level depends on the asset, volatility, strategy, and how much risk you're willing to accept.
5. Jumping Straight Into Futures
This is especially important for beginners.
Leverage can magnify both gains and losses.
Before experimenting with Futures, make sure you actually understand basic Spot trading, order types, and risk management.
🎯 Which Order Should You Use?
Here's your cheat sheet:
I want to buy or sell immediately:
→ MARKET
I want to buy or sell at a specific price:
→ LIMIT
I want to automatically exit if the market moves against me:
→ STOP-LOSS
I want to control both the trigger and the execution price:
→ STOP-LIMIT
Easy, right?
💡 Quick Quiz
Let's see if you really understood it.
Bitcoin is currently trading at:
$100,000
You want to buy Bitcoin only if the price drops to $95,000.
Which order would you use?
A. Market
B. Limit
C. Stop-Loss
D. Futures
👇 Drop your answer in the comments.
Now here's the second question:
You bought BTC at $100,000 and want to automatically exit if the market moves below a certain level.
Which tool would you use?
A, B, C, or D?
Let's see how many people can get both answers right. 👀
🔥 The Most Important Rule
Trading isn't just about knowing:
“When should I buy?”
It's also about knowing:
What price am I willing to pay?
When will I take profit?
Where will I exit if I'm wrong?
How much am I willing to lose?
That's exactly why different order types exist.
Market gives you speed.
Limit gives you price control.
Stop-Loss helps you manage risk.
And the better you understand these tools, the less likely you are to make an expensive mistake when the market suddenly moves.
🚀 Want to Learn Binance Step by Step?
Follow this profile if you're learning crypto from the ground up.
Next, we can break down:
OCO Orders
Take Profit
Trailing Stop
Order Book
Spread
Slippage
and the other Binance tools that beginners often see but don't fully understand.
And now it's your turn:
👇 Which order do you use more often — Market or Limit?
If you're completely new to crypto, comment:
“BEGINNER”
Let's see how many beginners are here. 👇
#market_tips #Binance #TradingCommunity #TradingSignals #TradeSignal
What Are Market Orders, Limit Orders, and Stop-Loss?
Market Order, Limit Order, and Stop-Loss are three terms every crypto beginner should understand.
If you have ever opened Binance and seen buttons like Buy, Sell, Limit, Market, and Stop-Loss and thought:
“Wait… what exactly am I supposed to click?”
Don’t worry.
In this guide, we’ll break everything down in simple language — no complicated trading terminology and no unnecessary theory.
By the end, you’ll understand the difference between Market and Limit Orders, how Stop-Loss works, and why choosing the wrong order type can cost you money.
First: What Is an Order?
An order is basically an instruction you give an exchange to buy or sell an asset under certain conditions.
For example, you might say:
“Buy Bitcoin for me right now.”
That’s a Market Order.
Or:
“Buy Bitcoin only if the price drops to $95,000.”
That’s a Limit Order.
Or:
“If Bitcoin drops to a certain level, sell my position to limit my potential loss.”
That’s the basic idea behind a Stop-Loss.
So the difference is actually quite simple.
🟢 1. Market Order — “Buy It Now”
A Market Order tells the exchange to buy or sell an asset as quickly as possible at the best available market price.
Imagine Bitcoin is currently trading around:
$100,000
You select:
Buy → Market
You are essentially telling the exchange:
“I want to buy now. The exact price is less important than getting the order executed.”
The exchange matches your order with available orders in the market.
The main advantage?
⚡ Speed.
You don't have to wait for Bitcoin to reach a specific price.
But there is an important detail.
The final execution price may not be exactly the price you see on your screen.
During periods of high volatility or low liquidity, you can experience slippage — the difference between the expected price and the actual execution price.
So remember:
Market = “I want execution now.”
🔵 2. Limit Order — “Buy It, But Only at My Price”
Now imagine Bitcoin is trading at:
$100,000
But you only want to buy if the price drops to:
$95,000
You could place a:
Limit Buy → $95,000
Now the exchange waits.
If the market reaches your specified price, your order may be executed.
But what if Bitcoin goes:
$100K → $105K → $110K?
Your $95,000 order may simply remain unfilled.
That’s because a Limit Order gives you price control, but execution is not guaranteed.
So:
Limit = “I’m willing to wait for my price.”
🟠 Market vs. Limit
Here’s the easiest way to remember the difference:
Market OrderLimit OrderExecutionAs quickly as possibleOnly when conditions are metPriceBest available market priceYou specify the pricePrice control❌ Lower✅ HigherExecution guaranteed?Generally prioritized for execution❌ NoBest forImmediate tradesTargeting a specific price
In one sentence:
Want to trade now? → Market.
Want a specific price? → Limit.
🔴 3. Stop-Loss — Your “Emergency Exit”
Now we get to one of the most important concepts in trading:
Stop-Loss.
Imagine you bought Bitcoin at:
$100,000
You don't want to sit in front of the chart all day.
But you also don't want to wake up tomorrow and discover Bitcoin has dropped dramatically.
So you can define a price level where you want to exit the position if the market moves against you.
For example:
Stop-Loss = $95,000
If the relevant trigger condition is reached, the system can activate the order according to the type of stop order you selected.
In simple terms:
Stop-Loss = “If the market moves against me to this level, get me out.”
The purpose isn't to guarantee a profit.
It's to help you manage risk.
⚠️ Important: Stop-Loss Doesn't Guarantee Your Exact Exit Price
This is one of the biggest things beginners misunderstand.
Imagine you set a Stop-Loss at:
$95,000
But the market suddenly moves:
$96K → $94K → $92K
Depending on the order type and market conditions, your actual execution price can differ from your stop level.
This is particularly important with stop-market orders because once triggered, they become market orders.
So:
Stop-Loss is a risk-management tool — not a guarantee of a specific execution price.
🧠 Stop-Market vs. Stop-Limit
This is where things can get confusing.
Stop-Market
You define a:
Stop Price
When the trigger is reached, a Market Order is activated.
The focus is:
“Get the order into the market.”
But the exact execution price isn't guaranteed.
Stop-Limit
Here you have two prices:
Stop Price → Limit Price
When the stop price is reached, a Limit Order is placed.
For example:
Stop Price: $95,000
Limit Price: $94,500
If the stop is triggered, a Limit Order is placed at the specified limit price.
This gives you more control over the price, but introduces another risk:
If the market moves below your limit price too quickly, the order may not be filled.
So:
Stop-Market → greater focus on execution.
Stop-Limit → greater price control, but potentially greater risk of non-execution.
📊 Let's Look at a Simple Example
Imagine you buy Bitcoin at:
Entry: $100,000
You decide:
Take Profit: $110,000
Stop-Loss: $95,000
Now there are two basic scenarios.
🚀 Scenario #1 — Bitcoin Goes Up
$100K → $103K → $107K → $110K
You reach your target and can choose to take profit.
📉 Scenario #2 — Bitcoin Goes Down
$100K → $98K → $96K → $95K
Your Stop-Loss level is reached.
Your predefined exit mechanism is triggered.
You may take a loss — but the entire purpose of the Stop-Loss was to avoid allowing a potentially larger loss to continue unchecked.
❌ 5 Mistakes Beginners Make
1. Using Market Orders Without Understanding Them
Market doesn't mean:
“Buy exactly at the price I see.”
It means:
“Execute my order using the available market liquidity.”
2. Thinking Every Limit Order Will Be Filled
It won't.
If the market never reaches your specified price, your order may remain unfilled.
3. Assuming Stop-Loss Guarantees an Exact Price
It doesn't.
Fast-moving markets can cause the actual execution price to differ from your stop level.
4. Setting Stop-Loss Randomly
There is no universal rule like:
“Always set your Stop-Loss at -5%.”
The appropriate level depends on the asset, volatility, strategy, and how much risk you're willing to accept.
5. Jumping Straight Into Futures
This is especially important for beginners.
Leverage can magnify both gains and losses.
Before experimenting with Futures, make sure you actually understand basic Spot trading, order types, and risk management.
🎯 Which Order Should You Use?
Here's your cheat sheet:
I want to buy or sell immediately:
→ MARKET
I want to buy or sell at a specific price:
→ LIMIT
I want to automatically exit if the market moves against me:
→ STOP-LOSS
I want to control both the trigger and the execution price:
→ STOP-LIMIT
Easy, right?
💡 Quick Quiz
Let's see if you really understood it.
Bitcoin is currently trading at:
$100,000
You want to buy Bitcoin only if the price drops to $95,000.
Which order would you use?
A. Market
B. Limit
C. Stop-Loss
D. Futures
👇 Drop your answer in the comments.
Now here's the second question:
You bought BTC at $100,000 and want to automatically exit if the market moves below a certain level.
Which tool would you use?
A, B, C, or D?
Let's see how many people can get both answers right. 👀
🔥 The Most Important Rule
Trading isn't just about knowing:
“When should I buy?”
It's also about knowing:
What price am I willing to pay?
When will I take profit?
Where will I exit if I'm wrong?
How much am I willing to lose?
That's exactly why different order types exist.
Market gives you speed.
Limit gives you price control.
Stop-Loss helps you manage risk.
And the better you understand these tools, the less likely you are to make an expensive mistake when the market suddenly moves.
🚀 Want to Learn Binance Step by Step?
Follow this profile if you're learning crypto from the ground up.
Next, we can break down:
OCO Orders
Take Profit
Trailing Stop
Order Book
Spread
Slippage
and the other Binance tools that beginners often see but don't fully understand.
And now it's your turn:
👇 Which order do you use more often — Market or Limit?
If you're completely new to crypto, comment:
“BEGINNER”
Let's see how many beginners are here. 👇
#market_tips #Binance #TradingCommunity #TradingSignals #TradeSignal
If you have ever opened Binance and seen buttons like Buy, Sell, Limit, Market, and Stop-Loss and thought:
“Wait… what exactly am I supposed to click?”
Don’t worry.
In this guide, we’ll break everything down in simple language — no complicated trading terminology and no unnecessary theory.
By the end, you’ll understand the difference between Market and Limit Orders, how Stop-Loss works, and why choosing the wrong order type can cost you money.
First: What Is an Order?
An order is basically an instruction you give an exchange to buy or sell an asset under certain conditions.
For example, you might say:
“Buy Bitcoin for me right now.”
That’s a Market Order.
Or:
“Buy Bitcoin only if the price drops to $95,000.”
That’s a Limit Order.
Or:
“If Bitcoin drops to a certain level, sell my position to limit my potential loss.”
That’s the basic idea behind a Stop-Loss.
So the difference is actually quite simple.
🟢 1. Market Order — “Buy It Now”
A Market Order tells the exchange to buy or sell an asset as quickly as possible at the best available market price.
Imagine Bitcoin is currently trading around:
$100,000
You select:
Buy → Market
You are essentially telling the exchange:
“I want to buy now. The exact price is less important than getting the order executed.”
The exchange matches your order with available orders in the market.
The main advantage?
⚡ Speed.
You don't have to wait for Bitcoin to reach a specific price.
But there is an important detail.
The final execution price may not be exactly the price you see on your screen.
During periods of high volatility or low liquidity, you can experience slippage — the difference between the expected price and the actual execution price.
So remember:
Market = “I want execution now.”
🔵 2. Limit Order — “Buy It, But Only at My Price”
Now imagine Bitcoin is trading at:
$100,000
But you only want to buy if the price drops to:
$95,000
You could place a:
Limit Buy → $95,000
Now the exchange waits.
If the market reaches your specified price, your order may be executed.
But what if Bitcoin goes:
$100K → $105K → $110K?
Your $95,000 order may simply remain unfilled.
That’s because a Limit Order gives you price control, but execution is not guaranteed.
So:
Limit = “I’m willing to wait for my price.”
🟠 Market vs. Limit
Here’s the easiest way to remember the difference:
Market OrderLimit OrderExecutionAs quickly as possibleOnly when conditions are metPriceBest available market priceYou specify the pricePrice control❌ Lower✅ HigherExecution guaranteed?Generally prioritized for execution❌ NoBest forImmediate tradesTargeting a specific price
In one sentence:
Want to trade now? → Market.
Want a specific price? → Limit.
🔴 3. Stop-Loss — Your “Emergency Exit”
Now we get to one of the most important concepts in trading:
Stop-Loss.
Imagine you bought Bitcoin at:
$100,000
You don't want to sit in front of the chart all day.
But you also don't want to wake up tomorrow and discover Bitcoin has dropped dramatically.
So you can define a price level where you want to exit the position if the market moves against you.
For example:
Stop-Loss = $95,000
If the relevant trigger condition is reached, the system can activate the order according to the type of stop order you selected.
In simple terms:
Stop-Loss = “If the market moves against me to this level, get me out.”
The purpose isn't to guarantee a profit.
It's to help you manage risk.
⚠️ Important: Stop-Loss Doesn't Guarantee Your Exact Exit Price
This is one of the biggest things beginners misunderstand.
Imagine you set a Stop-Loss at:
$95,000
But the market suddenly moves:
$96K → $94K → $92K
Depending on the order type and market conditions, your actual execution price can differ from your stop level.
This is particularly important with stop-market orders because once triggered, they become market orders.
So:
Stop-Loss is a risk-management tool — not a guarantee of a specific execution price.
🧠 Stop-Market vs. Stop-Limit
This is where things can get confusing.
Stop-Market
You define a:
Stop Price
When the trigger is reached, a Market Order is activated.
The focus is:
“Get the order into the market.”
But the exact execution price isn't guaranteed.
Stop-Limit
Here you have two prices:
Stop Price → Limit Price
When the stop price is reached, a Limit Order is placed.
For example:
Stop Price: $95,000
Limit Price: $94,500
If the stop is triggered, a Limit Order is placed at the specified limit price.
This gives you more control over the price, but introduces another risk:
If the market moves below your limit price too quickly, the order may not be filled.
So:
Stop-Market → greater focus on execution.
Stop-Limit → greater price control, but potentially greater risk of non-execution.
📊 Let's Look at a Simple Example
Imagine you buy Bitcoin at:
Entry: $100,000
You decide:
Take Profit: $110,000
Stop-Loss: $95,000
Now there are two basic scenarios.
🚀 Scenario #1 — Bitcoin Goes Up
$100K → $103K → $107K → $110K
You reach your target and can choose to take profit.
📉 Scenario #2 — Bitcoin Goes Down
$100K → $98K → $96K → $95K
Your Stop-Loss level is reached.
Your predefined exit mechanism is triggered.
You may take a loss — but the entire purpose of the Stop-Loss was to avoid allowing a potentially larger loss to continue unchecked.
❌ 5 Mistakes Beginners Make
1. Using Market Orders Without Understanding Them
Market doesn't mean:
“Buy exactly at the price I see.”
It means:
“Execute my order using the available market liquidity.”
2. Thinking Every Limit Order Will Be Filled
It won't.
If the market never reaches your specified price, your order may remain unfilled.
3. Assuming Stop-Loss Guarantees an Exact Price
It doesn't.
Fast-moving markets can cause the actual execution price to differ from your stop level.
4. Setting Stop-Loss Randomly
There is no universal rule like:
“Always set your Stop-Loss at -5%.”
The appropriate level depends on the asset, volatility, strategy, and how much risk you're willing to accept.
5. Jumping Straight Into Futures
This is especially important for beginners.
Leverage can magnify both gains and losses.
Before experimenting with Futures, make sure you actually understand basic Spot trading, order types, and risk management.
🎯 Which Order Should You Use?
Here's your cheat sheet:
I want to buy or sell immediately:
→ MARKET
I want to buy or sell at a specific price:
→ LIMIT
I want to automatically exit if the market moves against me:
→ STOP-LOSS
I want to control both the trigger and the execution price:
→ STOP-LIMIT
Easy, right?
💡 Quick Quiz
Let's see if you really understood it.
Bitcoin is currently trading at:
$100,000
You want to buy Bitcoin only if the price drops to $95,000.
Which order would you use?
A. Market
B. Limit
C. Stop-Loss
D. Futures
👇 Drop your answer in the comments.
Now here's the second question:
You bought BTC at $100,000 and want to automatically exit if the market moves below a certain level.
Which tool would you use?
A, B, C, or D?
Let's see how many people can get both answers right. 👀
🔥 The Most Important Rule
Trading isn't just about knowing:
“When should I buy?”
It's also about knowing:
What price am I willing to pay?
When will I take profit?
Where will I exit if I'm wrong?
How much am I willing to lose?
That's exactly why different order types exist.
Market gives you speed.
Limit gives you price control.
Stop-Loss helps you manage risk.
And the better you understand these tools, the less likely you are to make an expensive mistake when the market suddenly moves.
🚀 Want to Learn Binance Step by Step?
Follow this profile if you're learning crypto from the ground up.
Next, we can break down:
OCO Orders
Take Profit
Trailing Stop
Order Book
Spread
Slippage
and the other Binance tools that beginners often see but don't fully understand.
And now it's your turn:
👇 Which order do you use more often — Market or Limit?
If you're completely new to crypto, comment:
“BEGINNER”
Let's see how many beginners are here. 👇
#market_tips #Binance #TradingCommunity #TradingSignals #TradeSignal
50

·
--
> 📊 What is market cap?
> Market cap is generally calculated as price × circulating supply.
> That's why you shouldn't judge whether a coin is “cheap” just by looking at its price
#market_tips #Market_Update #MarketCapRace
> 📊 What is market cap?
> Market cap is generally calculated as price × circulating supply.
> That's why you shouldn't judge whether a coin is “cheap” just by looking at its price
#market_tips #Market_Update #MarketCapRace
> Market cap is generally calculated as price × circulating supply.
> That's why you shouldn't judge whether a coin is “cheap” just by looking at its price
#market_tips #Market_Update #MarketCapRace
87
·
--
XRP’s 700% Rally Forecaster Says Ethereum Is Now Crypto’s Cleanest Chart#market_tips
DonAlt says Ethereum has crypto’s cleanest chart as ETH holds a major breakout, while XRP cools after its sharp August rally.#CryptoNewss
$XRP
{spot}(XRPUSDT)
$WIF
{spot}(WIFUSDT)
$XLM
{spot}(XLMUSDT)
#Market_Update Trader DonAlt, known for identifying XRP’s major 2024–2025 rally early, is turning his attention to Ethereum, arguing that ETH now offers one of the clearest technical setups in the cryptocurrency market.
The trader described Ethereum’s daily structure as the “cleanest chart in crypto right now,” pointing to consolidation immediately above a major breakout level. His view is notable because he also sees ETH as a potential guide for the wider altcoin market rather than as an isolated trade.
Ethereum was trading around $2,455-$2,460 on Aug. 30, after holding above the $2,400 area despite a 2.7% decline on Aug. 28. The token has climbed roughly 30% from the $1,880 area where it traded in mid-August.
Ethereum Holds the Breakout DonAlt Was Waiting For
DonAlt began publicly building an ETH position around Aug. 13 at approximately $1,878. Ethereum subsequently accelerated through $2,000 and reached above $2,500 before moving into its current consolidation range.
The structure now revolves around $2,400 support. Holding that level would keep the recent breakout intact, while the next important resistance identified by the trader sits near $2,816. A move from roughly $2,460 to that area would represent another gain of about 14%.
That differs from the roughly 30% advance ETH has already produced since DonAlt’s entry zone. Coinpaper recently tracked the same ETH breakout, when Ethereum pushed through $2,400 alongside $220.77 million in U.S. spot ETF inflows.
The institutional backdrop has also improved. Ethereum’s late-August rally coincided with stronger ETF demand, giving the breakout a source of spot-market support beyond purely technical positioning.
XRP’s 700% Rally Forecaster Says Ethereum Is Now Crypto’s Cleanest Chart#market_tips
DonAlt says Ethereum has crypto’s cleanest chart as ETH holds a major breakout, while XRP cools after its sharp August rally.#CryptoNewss
$XRP
$WIF
$XLM
#Market_Update Trader DonAlt, known for identifying XRP’s major 2024–2025 rally early, is turning his attention to Ethereum, arguing that ETH now offers one of the clearest technical setups in the cryptocurrency market.
The trader described Ethereum’s daily structure as the “cleanest chart in crypto right now,” pointing to consolidation immediately above a major breakout level. His view is notable because he also sees ETH as a potential guide for the wider altcoin market rather than as an isolated trade.
Ethereum was trading around $2,455-$2,460 on Aug. 30, after holding above the $2,400 area despite a 2.7% decline on Aug. 28. The token has climbed roughly 30% from the $1,880 area where it traded in mid-August.
Ethereum Holds the Breakout DonAlt Was Waiting For
DonAlt began publicly building an ETH position around Aug. 13 at approximately $1,878. Ethereum subsequently accelerated through $2,000 and reached above $2,500 before moving into its current consolidation range.
The structure now revolves around $2,400 support. Holding that level would keep the recent breakout intact, while the next important resistance identified by the trader sits near $2,816. A move from roughly $2,460 to that area would represent another gain of about 14%.
That differs from the roughly 30% advance ETH has already produced since DonAlt’s entry zone. Coinpaper recently tracked the same ETH breakout, when Ethereum pushed through $2,400 alongside $220.77 million in U.S. spot ETF inflows.
The institutional backdrop has also improved. Ethereum’s late-August rally coincided with stronger ETF demand, giving the breakout a source of spot-market support beyond purely technical positioning.
DonAlt says Ethereum has crypto’s cleanest chart as ETH holds a major breakout, while XRP cools after its sharp August rally.#CryptoNewss
$XRP
$WIF
$XLM
#Market_Update Trader DonAlt, known for identifying XRP’s major 2024–2025 rally early, is turning his attention to Ethereum, arguing that ETH now offers one of the clearest technical setups in the cryptocurrency market.
The trader described Ethereum’s daily structure as the “cleanest chart in crypto right now,” pointing to consolidation immediately above a major breakout level. His view is notable because he also sees ETH as a potential guide for the wider altcoin market rather than as an isolated trade.
Ethereum was trading around $2,455-$2,460 on Aug. 30, after holding above the $2,400 area despite a 2.7% decline on Aug. 28. The token has climbed roughly 30% from the $1,880 area where it traded in mid-August.
Ethereum Holds the Breakout DonAlt Was Waiting For
DonAlt began publicly building an ETH position around Aug. 13 at approximately $1,878. Ethereum subsequently accelerated through $2,000 and reached above $2,500 before moving into its current consolidation range.
The structure now revolves around $2,400 support. Holding that level would keep the recent breakout intact, while the next important resistance identified by the trader sits near $2,816. A move from roughly $2,460 to that area would represent another gain of about 14%.
That differs from the roughly 30% advance ETH has already produced since DonAlt’s entry zone. Coinpaper recently tracked the same ETH breakout, when Ethereum pushed through $2,400 alongside $220.77 million in U.S. spot ETF inflows.
The institutional backdrop has also improved. Ethereum’s late-August rally coincided with stronger ETF demand, giving the breakout a source of spot-market support beyond purely technical positioning.
115

·
--
🔥 $BTC
{spot}(BTCUSDT)
$BTC / USDT Market Update & Short-Term Outlook 📊
Bitcoin (BTC) is currently consolidating around the $77,500 – $77,800 zone after touching the $81k milestone earlier this week. The market is experiencing a healthy cool-off period and profit-taking pressure.
🔍 Key Levels to Watch:
🟢 Support Zone: $76,500 – $77,000 (Crucial to hold for the bulls)
🔴 Resistance Zone: $79,500 – $80,000 (Needs a volume breakout to flip bullish again)
💡 Trading Insight:
Short-term charts are showing sideways movement. Avoid aggressive FOMO buying or high-leverage positions right now. Patience is key—wait for a clear breakout above resistance or a solid bounce from support before entering new trades. Always manage your risk with a strict Stop-Loss! 📉⚡️
#cryptotradingpro #BinanceSquare #market_tips #cryptosignals
@BTC-
🔥 $BTC
$BTC / USDT Market Update & Short-Term Outlook 📊
Bitcoin (BTC) is currently consolidating around the $77,500 – $77,800 zone after touching the $81k milestone earlier this week. The market is experiencing a healthy cool-off period and profit-taking pressure.
🔍 Key Levels to Watch:
🟢 Support Zone: $76,500 – $77,000 (Crucial to hold for the bulls)
🔴 Resistance Zone: $79,500 – $80,000 (Needs a volume breakout to flip bullish again)
💡 Trading Insight:
Short-term charts are showing sideways movement. Avoid aggressive FOMO buying or high-leverage positions right now. Patience is key—wait for a clear breakout above resistance or a solid bounce from support before entering new trades. Always manage your risk with a strict Stop-Loss! 📉⚡️
#cryptotradingpro #BinanceSquare #market_tips #cryptosignals
@BTC -
$BTC / USDT Market Update & Short-Term Outlook 📊
Bitcoin (BTC) is currently consolidating around the $77,500 – $77,800 zone after touching the $81k milestone earlier this week. The market is experiencing a healthy cool-off period and profit-taking pressure.
🔍 Key Levels to Watch:
🟢 Support Zone: $76,500 – $77,000 (Crucial to hold for the bulls)
🔴 Resistance Zone: $79,500 – $80,000 (Needs a volume breakout to flip bullish again)
💡 Trading Insight:
Short-term charts are showing sideways movement. Avoid aggressive FOMO buying or high-leverage positions right now. Patience is key—wait for a clear breakout above resistance or a solid bounce from support before entering new trades. Always manage your risk with a strict Stop-Loss! 📉⚡️
#cryptotradingpro #BinanceSquare #market_tips #cryptosignals
@BTC -
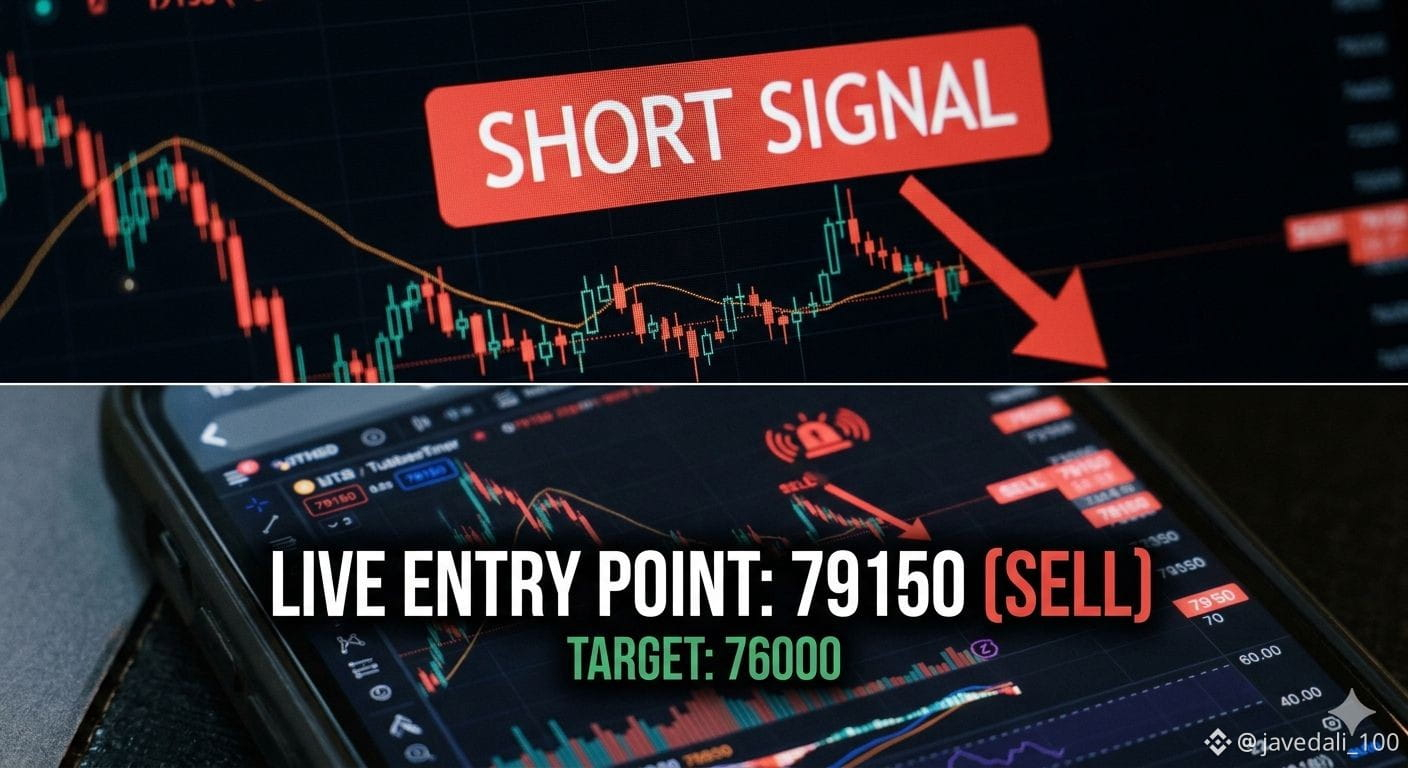
36

·
--
Bullish
🚨 THIS GUY TURNED $620 INTO $4.2 MILLION 🤯
A wallet holding 2,000 ETH for over 10 YEARS just moved funds after staying inactive since the Ethereum presale.
💰 Bought ETH at just $0.31
📈 Current gain: 6,800x
🔥 Value today: Over $4.2M
Big lesson from this story:
Real wealth in crypto is often made through PATIENCE, not nonstop trading.
Most people panic during dips…
Legends hold through the noise. 🚀
$BTC
$ETH
#Write2Earn
#market_tips
🚨 THIS GUY TURNED $620 INTO $4.2 MILLION 🤯
A wallet holding 2,000 ETH for over 10 YEARS just moved funds after staying inactive since the Ethereum presale.
💰 Bought ETH at just $0.31
📈 Current gain: 6,800x
🔥 Value today: Over $4.2M
Big lesson from this story:
Real wealth in crypto is often made through PATIENCE, not nonstop trading.
Most people panic during dips…
Legends hold through the noise. 🚀
$BTC
$ETH
#Write2Earn
#market_tips
A wallet holding 2,000 ETH for over 10 YEARS just moved funds after staying inactive since the Ethereum presale.
💰 Bought ETH at just $0.31
📈 Current gain: 6,800x
🔥 Value today: Over $4.2M
Big lesson from this story:
Real wealth in crypto is often made through PATIENCE, not nonstop trading.
Most people panic during dips…
Legends hold through the noise. 🚀
$BTC
$ETH
#Write2Earn
#market_tips
96
Bitcoin 🚩Market Update 📊
$BTC is currently showing a cautious structure. A retest of the major support zone is still possible, and if BTC holds that area, the 1H bullish divergence could remain valid, giving buyers a chance to regain momentum.
For now, chasing a long position is risky. The better approach is to wait for a confirmed trendline breakout with strong volume confirmation before entering. A breakout without volume may become a fake move.
Key Levels to Watch:
🟢 Support Zone:
• BTC needs to defend the current support area to maintain the bullish setup.
• A successful bounce could attract buyers and push price toward resistance levels.
🔴 Resistance Zone:
• BTC must reclaim nearby resistance and close above the descending trendline to confirm a short-term trend reversal.
• A breakout above resistance could open the way for another bullish move.
Market Sentiment:
📈 Bullish divergence suggests weakening selling pressure.
⚠️ Weekend/low-volume conditions can create fake breakouts.
🐂 Buyers need confirmation before taking control.
🐻 Losing support could lead to another correction.
Trading Plan: ✅ Wait for trendline breakout
✅ Confirm with volume + candle close
✅ Avoid emotional entries
✅ Manage risk with proper stop-loss
Conclusion:
BTC is sitting at a decision point. The bullish structure is still alive, but confirmation is needed. Patience remains the best strategy — the market will provide opportunities for those who wait.
#BİNANCE #BTC #market_tips #CryptoNewss
$BTC
{spot}(BTCUSDT)
Bitcoin 🚩Market Update 📊
$BTC is currently showing a cautious structure. A retest of the major support zone is still possible, and if BTC holds that area, the 1H bullish divergence could remain valid, giving buyers a chance to regain momentum.
For now, chasing a long position is risky. The better approach is to wait for a confirmed trendline breakout with strong volume confirmation before entering. A breakout without volume may become a fake move.
Key Levels to Watch:
🟢 Support Zone:
• BTC needs to defend the current support area to maintain the bullish setup.
• A successful bounce could attract buyers and push price toward resistance levels.
🔴 Resistance Zone:
• BTC must reclaim nearby resistance and close above the descending trendline to confirm a short-term trend reversal.
• A breakout above resistance could open the way for another bullish move.
Market Sentiment:
📈 Bullish divergence suggests weakening selling pressure.
⚠️ Weekend/low-volume conditions can create fake breakouts.
🐂 Buyers need confirmation before taking control.
🐻 Losing support could lead to another correction.
Trading Plan: ✅ Wait for trendline breakout
✅ Confirm with volume + candle close
✅ Avoid emotional entries
✅ Manage risk with proper stop-loss
Conclusion:
BTC is sitting at a decision point. The bullish structure is still alive, but confirmation is needed. Patience remains the best strategy — the market will provide opportunities for those who wait.
#BİNANCE #BTC #market_tips #CryptoNewss
$BTC
$BTC is currently showing a cautious structure. A retest of the major support zone is still possible, and if BTC holds that area, the 1H bullish divergence could remain valid, giving buyers a chance to regain momentum.
For now, chasing a long position is risky. The better approach is to wait for a confirmed trendline breakout with strong volume confirmation before entering. A breakout without volume may become a fake move.
Key Levels to Watch:
🟢 Support Zone:
• BTC needs to defend the current support area to maintain the bullish setup.
• A successful bounce could attract buyers and push price toward resistance levels.
🔴 Resistance Zone:
• BTC must reclaim nearby resistance and close above the descending trendline to confirm a short-term trend reversal.
• A breakout above resistance could open the way for another bullish move.
Market Sentiment:
📈 Bullish divergence suggests weakening selling pressure.
⚠️ Weekend/low-volume conditions can create fake breakouts.
🐂 Buyers need confirmation before taking control.
🐻 Losing support could lead to another correction.
Trading Plan: ✅ Wait for trendline breakout
✅ Confirm with volume + candle close
✅ Avoid emotional entries
✅ Manage risk with proper stop-loss
Conclusion:
BTC is sitting at a decision point. The bullish structure is still alive, but confirmation is needed. Patience remains the best strategy — the market will provide opportunities for those who wait.
#BİNANCE #BTC #market_tips #CryptoNewss
$BTC
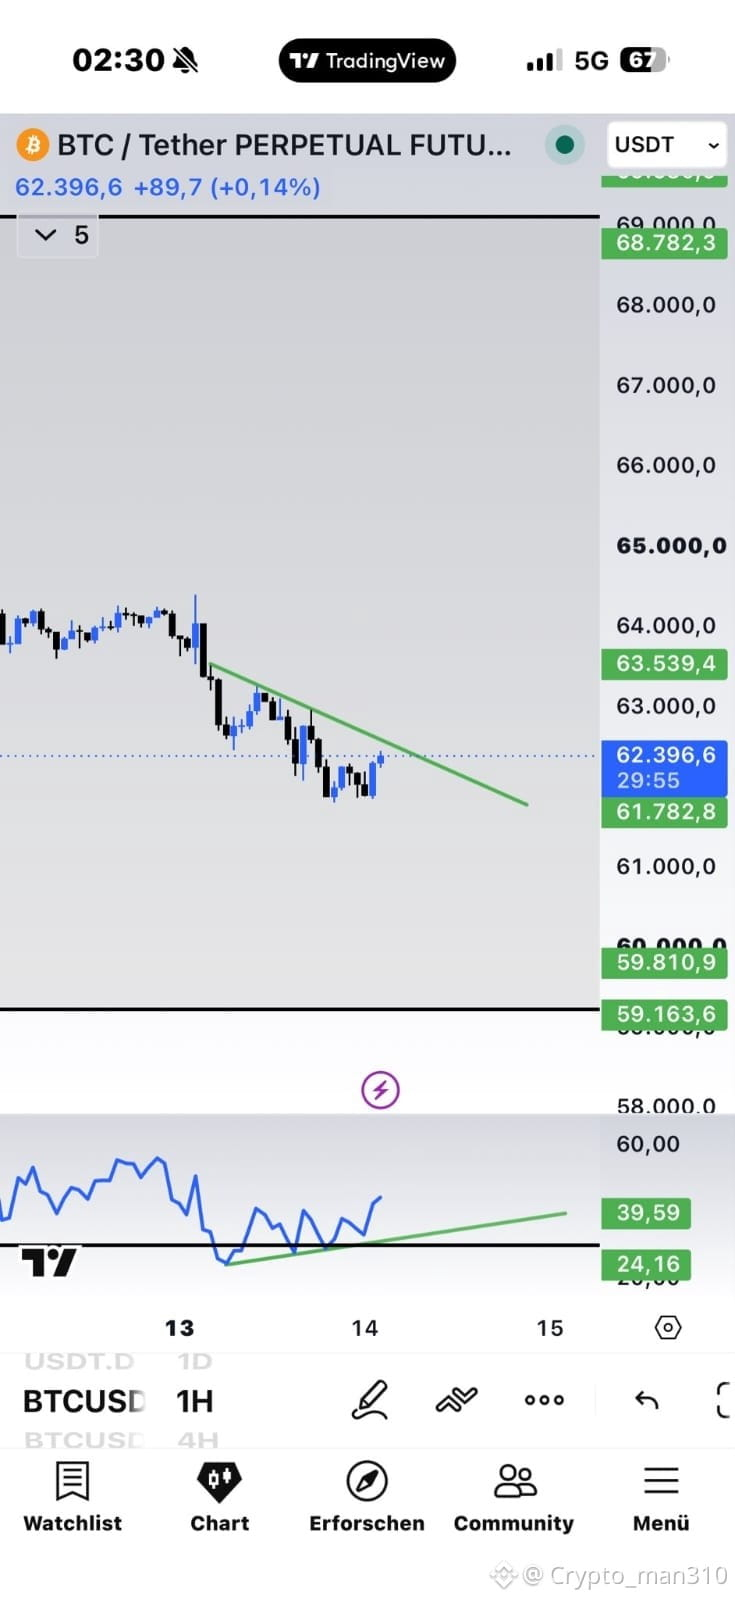
75

#ColdcardTheftInvestigationAdvances #ColdcardTheftInvestigationAdvances #dusk $DUSK @Dusk_Foundation #market_tips #DUSKARMY.
market tip dusk <100 <100 +0
15
#ColdcardTheftInvestigationAdvances #ColdcardTheftInvestigationAdvances #dusk $DUSK @Dusk #market_tips #DUSKARMY.
market tip dusk <100 <100 +0
15
market tip dusk <100 <100 +0
15
61

Whatever You Do As a Trader Never Forget This!
Whatever pressures are driving you to come into the market to trade, whether it's to make money or solve certain problems, the market doesn't care.
The market is just a pool of transactions taking place at specific points in time. Whether those transactions make you money or cause you to lose money is none of the market's business.
That's the main reason you shouldn't bring your emotions into the market. The market doesn't care whether you live or die at the end of its move. That's not its concern.
Its only concern is to accept and execute orders efficiently.
Please don't forget to follow, like and share. Together, we will make it.
#market_tips
Whatever You Do As a Trader Never Forget This!
Whatever pressures are driving you to come into the market to trade, whether it's to make money or solve certain problems, the market doesn't care.
The market is just a pool of transactions taking place at specific points in time. Whether those transactions make you money or cause you to lose money is none of the market's business.
That's the main reason you shouldn't bring your emotions into the market. The market doesn't care whether you live or die at the end of its move. That's not its concern.
Its only concern is to accept and execute orders efficiently.
Please don't forget to follow, like and share. Together, we will make it.
#market_tips
Whatever pressures are driving you to come into the market to trade, whether it's to make money or solve certain problems, the market doesn't care.
The market is just a pool of transactions taking place at specific points in time. Whether those transactions make you money or cause you to lose money is none of the market's business.
That's the main reason you shouldn't bring your emotions into the market. The market doesn't care whether you live or die at the end of its move. That's not its concern.
Its only concern is to accept and execute orders efficiently.
Please don't forget to follow, like and share. Together, we will make it.
#market_tips
177
Log in to explore more content
Join global crypto users on Binance Square
⚡️ Get latest and useful information about crypto.
💬 Trusted by the world’s largest crypto exchange.
👍 Discover real insights from verified creators.
Email / Phone number
Trending Topics
1
#BTCFallsBelow$83000
331 views
34 Discussing
2
#FedProposesPaymentStablecoinRules
7,413 views
198 Discussing
3
#ChinaMayLetAlibabaByteDanceBuyNvidiaChips
10,242 views
279 Discussing
4
#USChinaRelease$30BTariffCutProductLists
1,856 views
33 Discussing
5
#SKoreaFSCConsidersVirtualAssetMarketMaker
8,869 views
238 Discussing
6
#ChinaIndustrialProfitGrowthSlowsFourthMonth
9,720 views
246 Discussing
7
#BitwiseFilesFinalNEARSpotETFProspectus
123,886 views
1,794 Discussing
8
#BitgetHackerMoves$83MStolenXRP
40,808 views
178 Discussing
9
#SOLSpotETFWeeklyInflow$188M
25,592 views
141 Discussing
10
#DogecoinETFsPostBiggestWeekSinceLaunch
70,468 views
1,139 Discussing