My
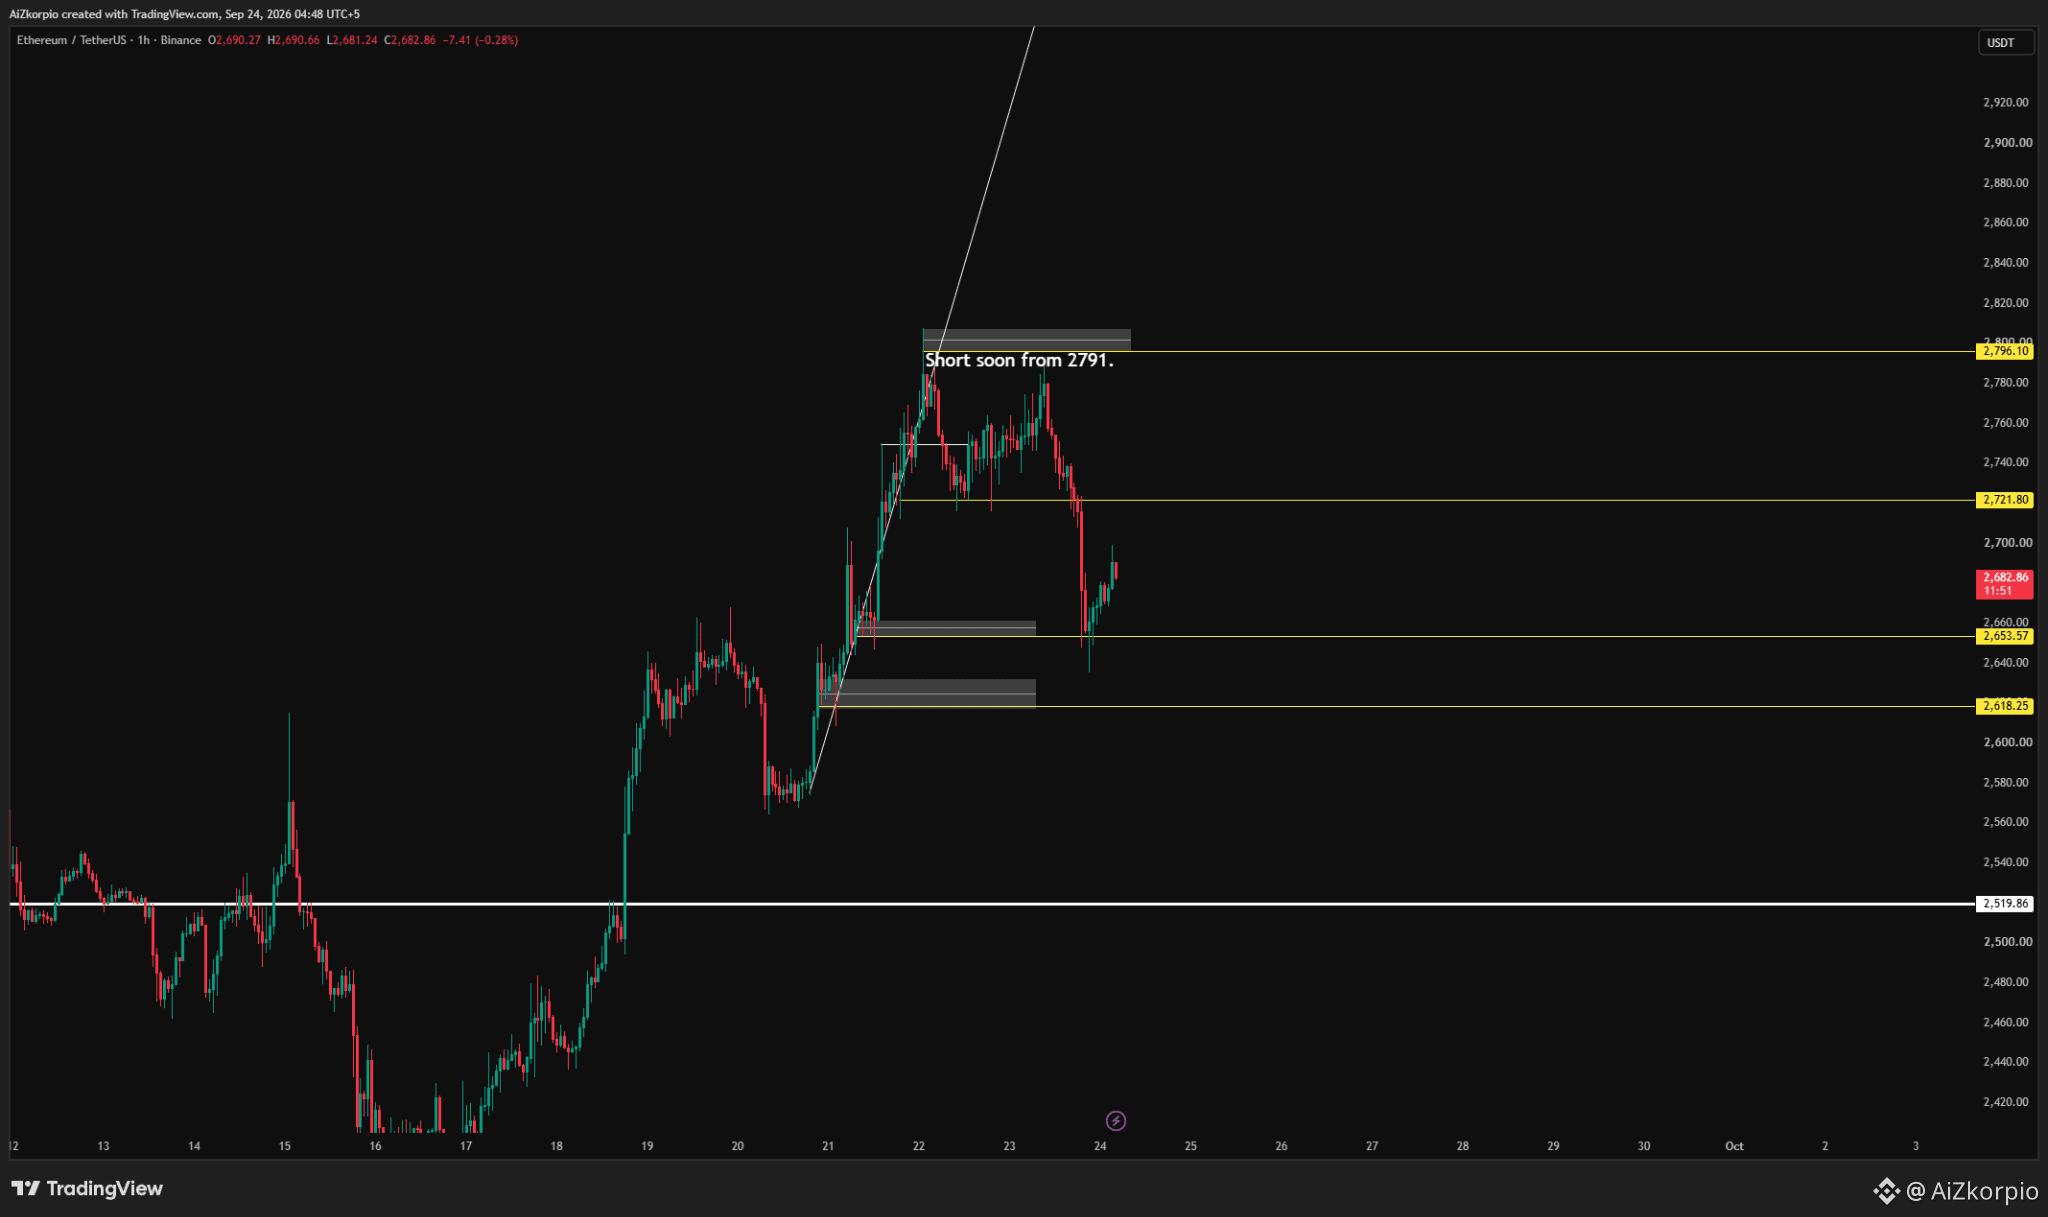
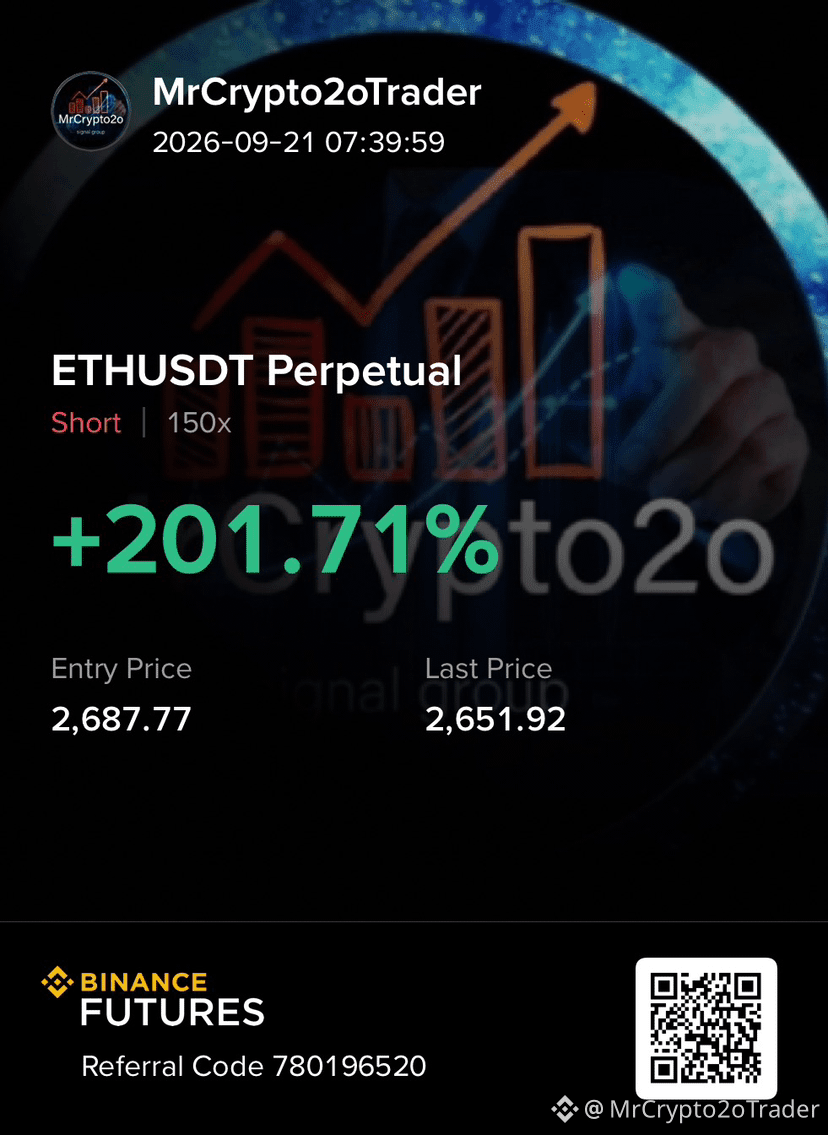
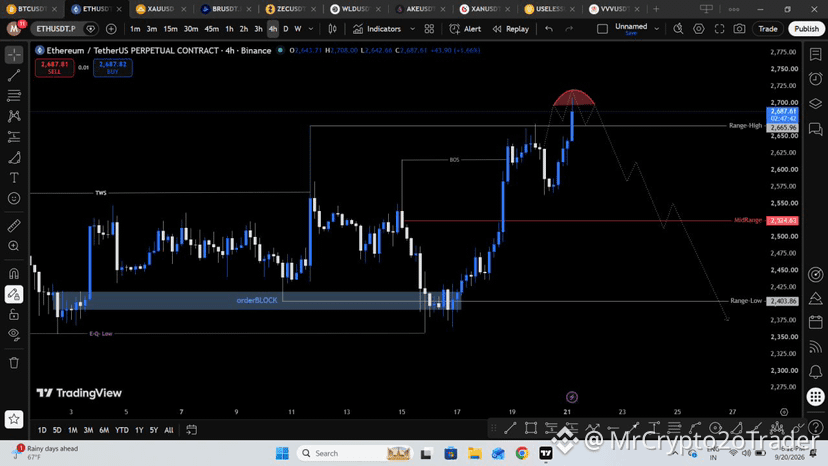
$ETH charts, explained simply 👇
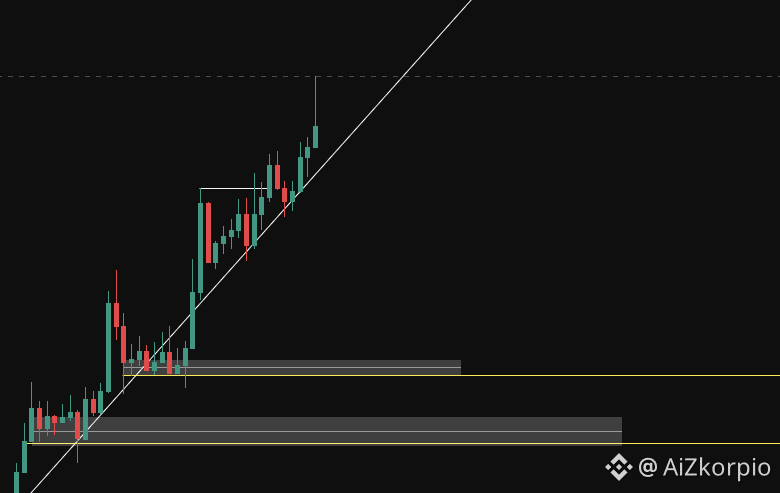
⬜ Grey boxes mark areas where buyers (demand) or sellers (supply) may step in.
🟨 Yellow lines help confirm my entry:
• BUY/LONG: price dips below the line, recovers above it, and holds.
• SHORT: candles close below the line.
📈 I also check the trend: higher highs and lows support buys; lower highs and lows support shorts. Chart 15m timeframe ( best )
Mark the area. Wait for price. Watch the reaction. Any setup can still fail.
What should I explain next: finding the boxes or confirming an entry?
#Ethereum #TechnicalAnalysis #TradingStrategy #Free