
#etc
etc
1.8M views
7,619 Discussing
Hot
Latest

·
--
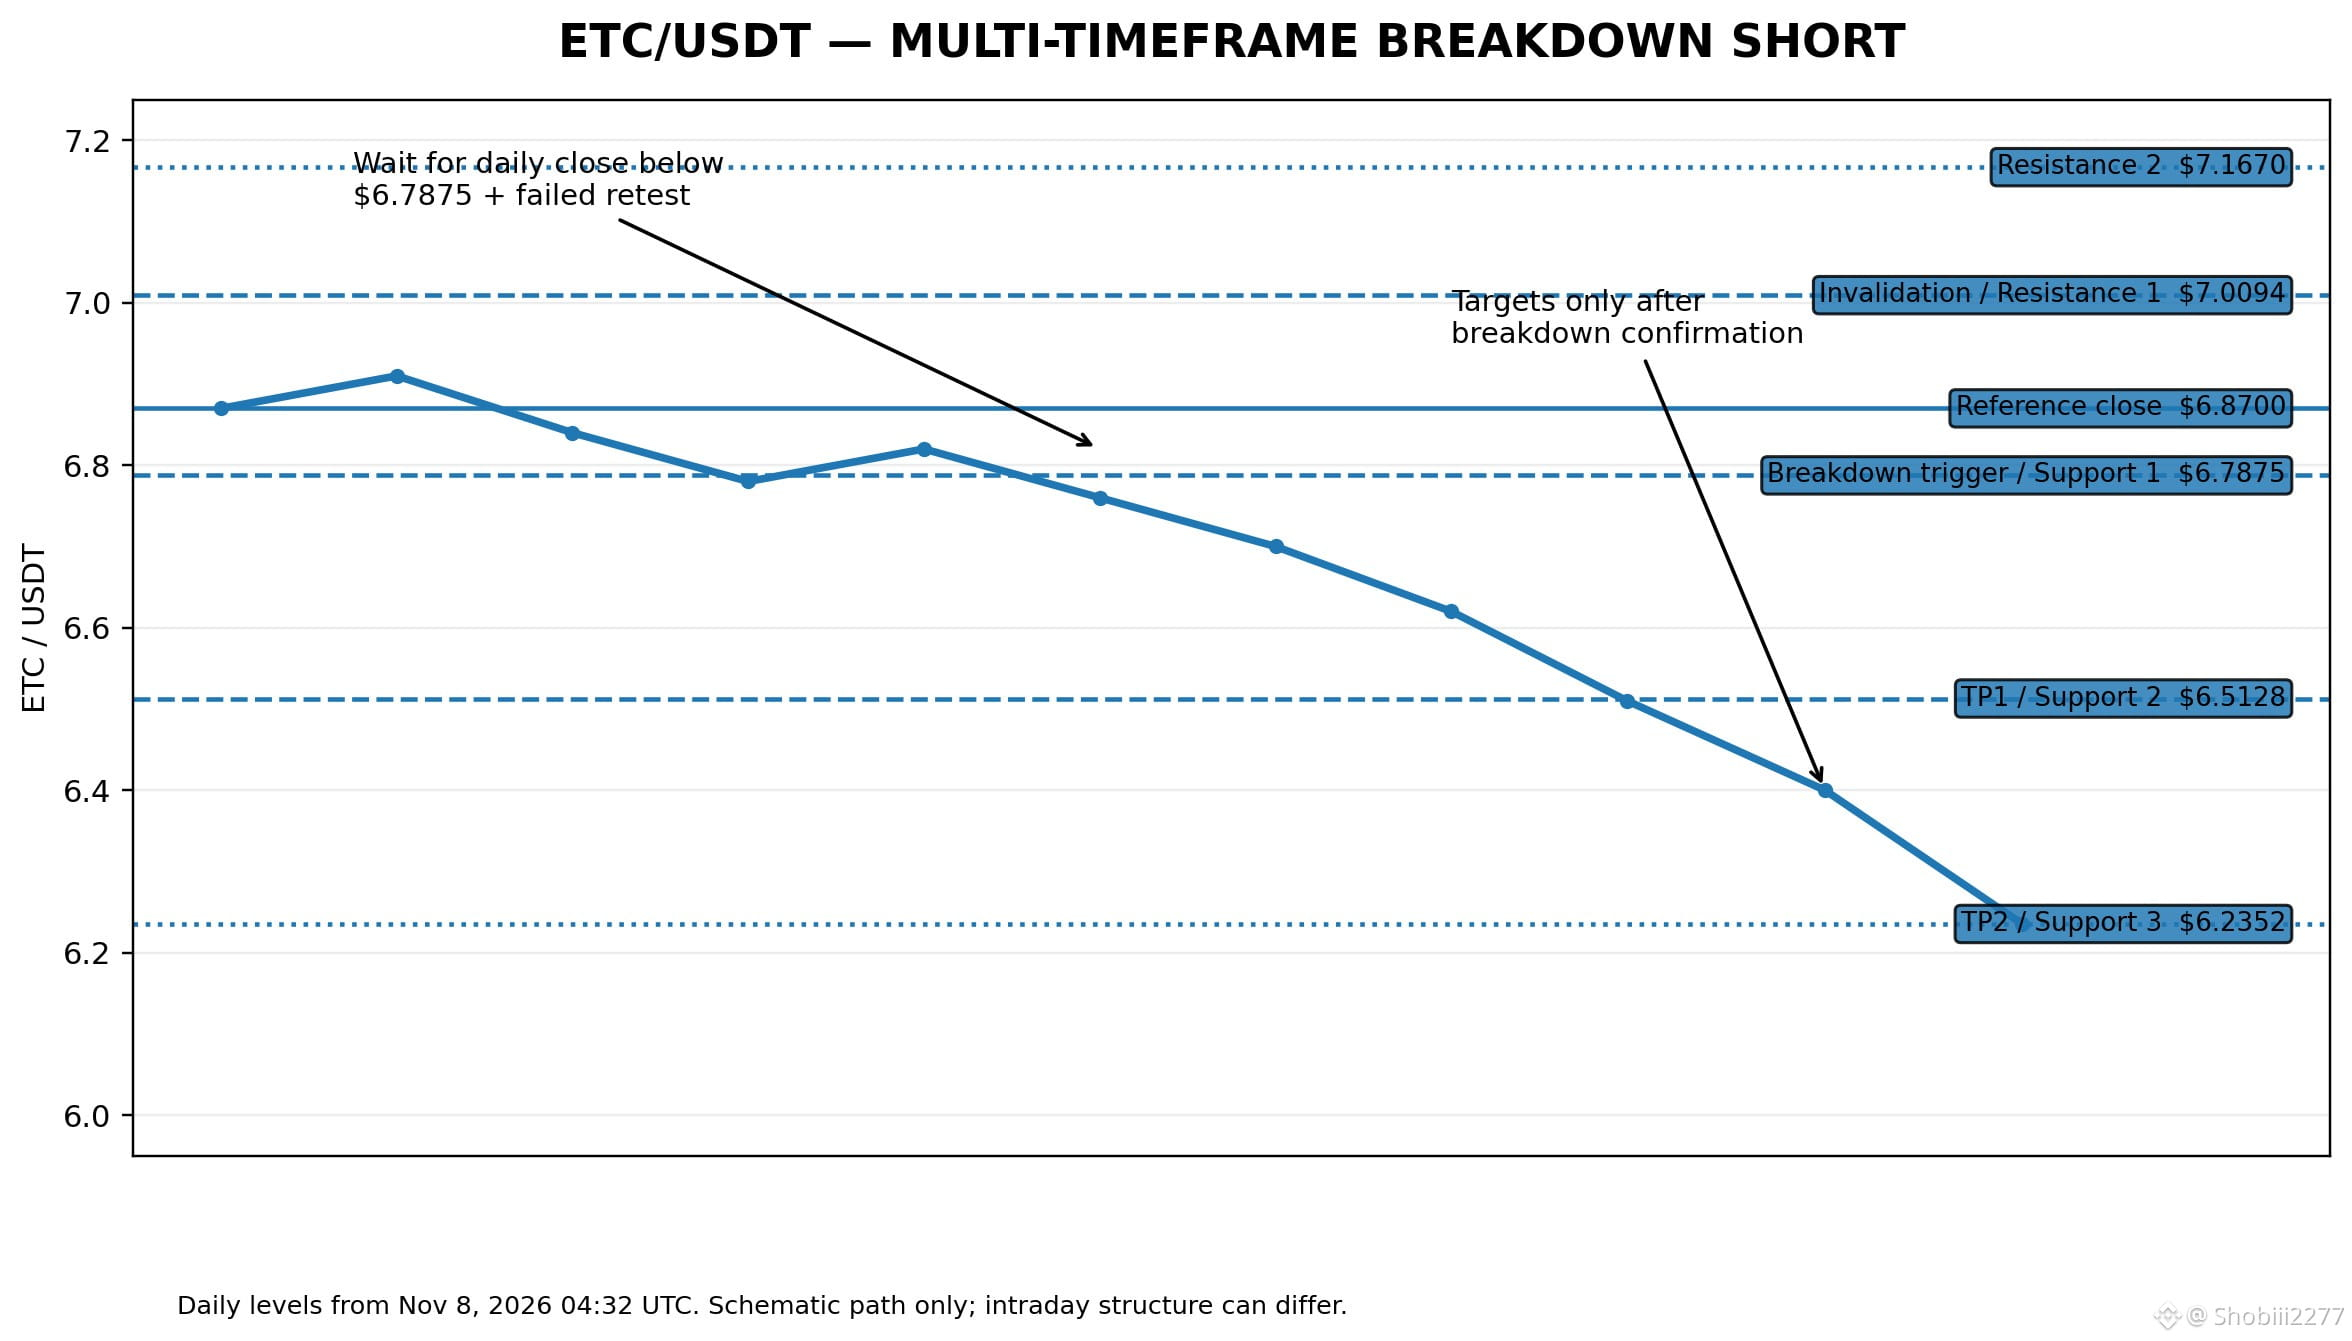
🚨 ETC/USDT — STRONG BEARISH SETUP! 📉🔥
Ethereum Classic is showing bearish alignment across multiple timeframes.
🔴 TRADE DIRECTION: SHORT
📍 ENTRY TRIGGER: Below $6.7875 Retest zone: $6.77–$6.79
🛑 STOP LOSS: $7.0094
🎯 PROFIT TARGETS:
🥇 TP1: $6.5128 🥈 TP2: $6.2352 🥉 Extended: $5.8155
📊 TECHNICAL CONFIRMATION:
✅ Daily RSI: 36.9 ✅ 4H RSI: 40.0 ✅ Weekly RSI: 41.7 ✅ Bearish Supertrend ✅ Price below Ichimoku cloud ✅ Strong bearish multi-timeframe structure
⚡ Strategy: Wait for a confirmed support breakdown and failed retest.
No FOMO. No blind entries. Risk management first.
Are you watching ETC? 👀
Follow for more professional crypto signals and technical analysis!
#ETC #EthereumClassic #cryptosignals #BinanceFutures #TechnicalAnalysis
🚨 ETC/USDT — STRONG BEARISH SETUP! 📉🔥
Ethereum Classic is showing bearish alignment across multiple timeframes.
🔴 TRADE DIRECTION: SHORT
📍 ENTRY TRIGGER: Below $6.7875 Retest zone: $6.77–$6.79
🛑 STOP LOSS: $7.0094
🎯 PROFIT TARGETS:
🥇 TP1: $6.5128 🥈 TP2: $6.2352 🥉 Extended: $5.8155
📊 TECHNICAL CONFIRMATION:
✅ Daily RSI: 36.9 ✅ 4H RSI: 40.0 ✅ Weekly RSI: 41.7 ✅ Bearish Supertrend ✅ Price below Ichimoku cloud ✅ Strong bearish multi-timeframe structure
⚡ Strategy: Wait for a confirmed support breakdown and failed retest.
No FOMO. No blind entries. Risk management first.
Are you watching ETC? 👀
Follow for more professional crypto signals and technical analysis!
#ETC #EthereumClassic #cryptosignals #BinanceFutures #TechnicalAnalysis
Ethereum Classic is showing bearish alignment across multiple timeframes.
🔴 TRADE DIRECTION: SHORT
📍 ENTRY TRIGGER: Below $6.7875 Retest zone: $6.77–$6.79
🛑 STOP LOSS: $7.0094
🎯 PROFIT TARGETS:
🥇 TP1: $6.5128 🥈 TP2: $6.2352 🥉 Extended: $5.8155
📊 TECHNICAL CONFIRMATION:
✅ Daily RSI: 36.9 ✅ 4H RSI: 40.0 ✅ Weekly RSI: 41.7 ✅ Bearish Supertrend ✅ Price below Ichimoku cloud ✅ Strong bearish multi-timeframe structure
⚡ Strategy: Wait for a confirmed support breakdown and failed retest.
No FOMO. No blind entries. Risk management first.
Are you watching ETC? 👀
Follow for more professional crypto signals and technical analysis!
#ETC #EthereumClassic #cryptosignals #BinanceFutures #TechnicalAnalysis
55

$ETC BREAKS A 1-YEAR FALLING WEDGE ON THE WEEKLY CHART! 💥 📈
Target: 25 🚀
After an agonizing full year of compression, $ETC has finally shattered its weekly falling wedge pattern with undeniable authority. 📊 The coiled spring is unwinding fast as patient accumulation converts directly into aggressive buying momentum.
Multi-month consolidation structures of this caliber rarely offer second chances once expansion begins. 💡 Order flow is aggressively lifting asks, signaling that smart capital is positioning for a full-scale macro run toward the upper expansion target.
Sellers are running out of runway while market participants rush to catch this weekly breakout before velocity accelerates. 💬 Will you ride this weekly trend shift early or end up chasing the vertical impulse near the target zone? 👇
⚠️ Not financial advice. Always manage your risk. 🛡️
🏷️ #ETC #Breakout #WeeklyChart #Altcoins #Crypto
🔥 ⚡
$ETC BREAKS A 1-YEAR FALLING WEDGE ON THE WEEKLY CHART! 💥 📈
Target: 25 🚀
After an agonizing full year of compression, $ETC has finally shattered its weekly falling wedge pattern with undeniable authority. 📊 The coiled spring is unwinding fast as patient accumulation converts directly into aggressive buying momentum.
Multi-month consolidation structures of this caliber rarely offer second chances once expansion begins. 💡 Order flow is aggressively lifting asks, signaling that smart capital is positioning for a full-scale macro run toward the upper expansion target.
Sellers are running out of runway while market participants rush to catch this weekly breakout before velocity accelerates. 💬 Will you ride this weekly trend shift early or end up chasing the vertical impulse near the target zone? 👇
⚠️ Not financial advice. Always manage your risk. 🛡️
🏷️ #ETC #Breakout #WeeklyChart #Altcoins #Crypto
🔥 ⚡
Target: 25 🚀
After an agonizing full year of compression, $ETC has finally shattered its weekly falling wedge pattern with undeniable authority. 📊 The coiled spring is unwinding fast as patient accumulation converts directly into aggressive buying momentum.
Multi-month consolidation structures of this caliber rarely offer second chances once expansion begins. 💡 Order flow is aggressively lifting asks, signaling that smart capital is positioning for a full-scale macro run toward the upper expansion target.
Sellers are running out of runway while market participants rush to catch this weekly breakout before velocity accelerates. 💬 Will you ride this weekly trend shift early or end up chasing the vertical impulse near the target zone? 👇
⚠️ Not financial advice. Always manage your risk. 🛡️
🏷️ #ETC #Breakout #WeeklyChart #Altcoins #Crypto
🔥 ⚡
13

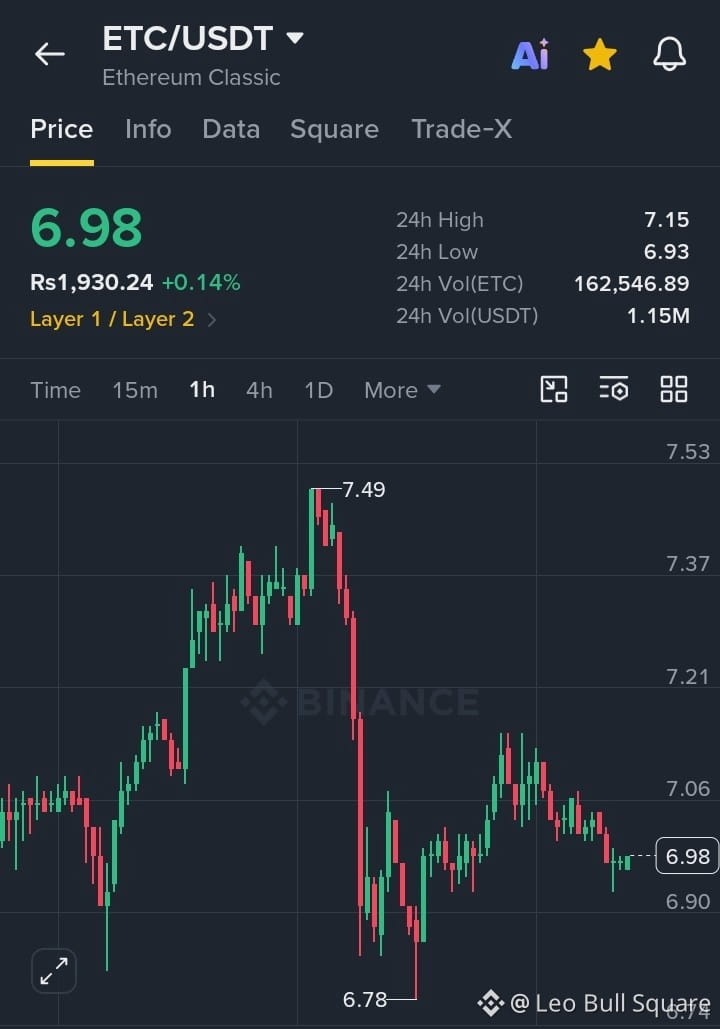
🚀 $ETC /USDT – BULLISH BREAKOUT LOADING? $7.15 IS THE KEY LEVEL!
$ETC is currently trading around $6.98 after recovering from a sharp liquidity sweep near $6.78, but buyers are still struggling to regain full control. On the 1H chart, price is consolidating below the $7.06–$7.10 resistance zone, making this a critical area for the next move. A confirmed breakout and successful retest could trigger bullish continuation toward TP1: $7.15, TP2: $7.21, and TP3: $7.37, with a stop loss below $6.90. However, rejection from resistance could send price back toward $6.93 and potentially $6.78. Watch for a strong BOS, increasing volume, and bullish confirmation before entering. Patience is key—let the market confirm the breakout! 🔥 #ETCUSDT #EthereumClassic #CryptoTrading #BreakoutSetup #BinanceSquare
#ETC
{spot}(ETCUSDT)
🚀 $ETC /USDT – BULLISH BREAKOUT LOADING? $7.15 IS THE KEY LEVEL!
$ETC is currently trading around $6.98 after recovering from a sharp liquidity sweep near $6.78, but buyers are still struggling to regain full control. On the 1H chart, price is consolidating below the $7.06–$7.10 resistance zone, making this a critical area for the next move. A confirmed breakout and successful retest could trigger bullish continuation toward TP1: $7.15, TP2: $7.21, and TP3: $7.37, with a stop loss below $6.90. However, rejection from resistance could send price back toward $6.93 and potentially $6.78. Watch for a strong BOS, increasing volume, and bullish confirmation before entering. Patience is key—let the market confirm the breakout! 🔥 #ETCUSDT #EthereumClassic #CryptoTrading #BreakoutSetup #BinanceSquare
#ETC
$ETC is currently trading around $6.98 after recovering from a sharp liquidity sweep near $6.78, but buyers are still struggling to regain full control. On the 1H chart, price is consolidating below the $7.06–$7.10 resistance zone, making this a critical area for the next move. A confirmed breakout and successful retest could trigger bullish continuation toward TP1: $7.15, TP2: $7.21, and TP3: $7.37, with a stop loss below $6.90. However, rejection from resistance could send price back toward $6.93 and potentially $6.78. Watch for a strong BOS, increasing volume, and bullish confirmation before entering. Patience is key—let the market confirm the breakout! 🔥 #ETCUSDT #EthereumClassic #CryptoTrading #BreakoutSetup #BinanceSquare
#ETC
2
43


·
--
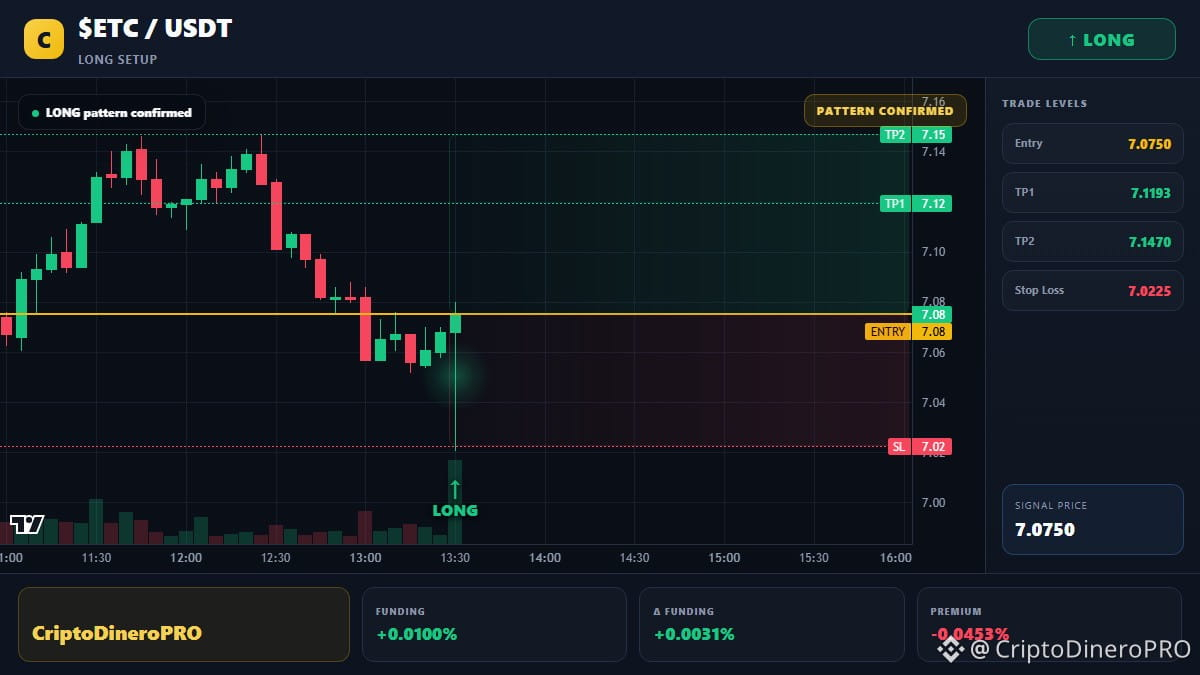
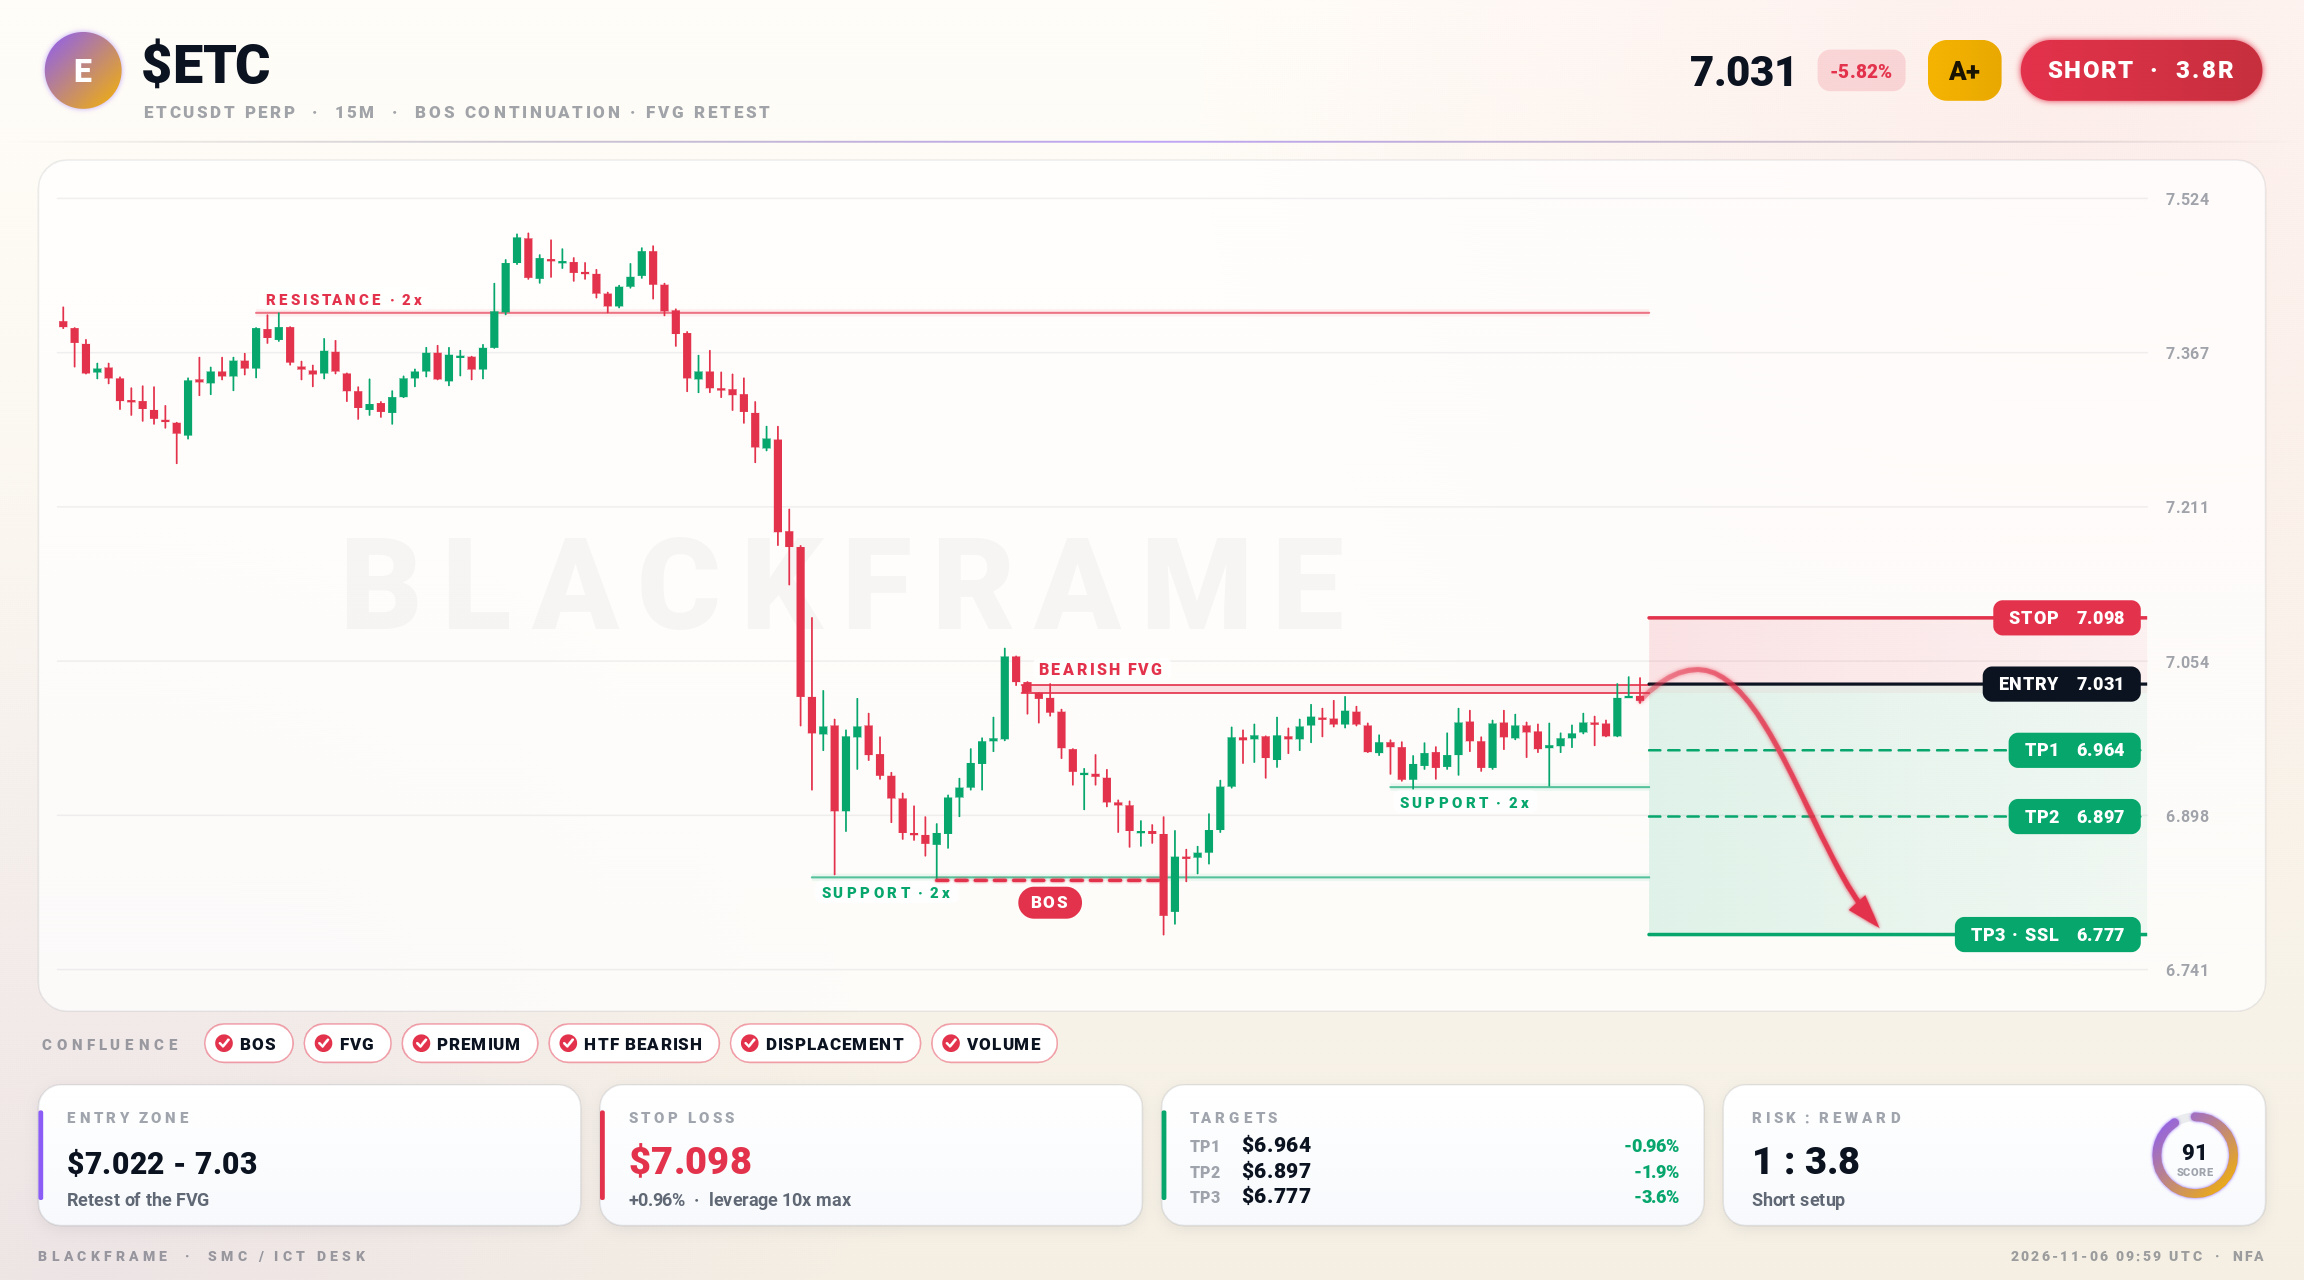
🔻 $ETC slides into bearish zone
SHORT · 15M
Entry: $7.022 - $7.031
TP1: $6.964
TP2: $6.897
TP3: $6.777
SL: $7.098
Price hit the bearish FVG and a BOS on the 15M confirmed the downtrend. Selling from premium aligns with HTF bias and London killzone pressure. Target is $6.777 with stop at $7.098; invalidate if price reclaims $7.031.
#ETC #TradingSignals · NFA
🔻 $ETC slides into bearish zone
SHORT · 15M
Entry: $7.022 - $7.031
TP1: $6.964
TP2: $6.897
TP3: $6.777
SL: $7.098
Price hit the bearish FVG and a BOS on the 15M confirmed the downtrend. Selling from premium aligns with HTF bias and London killzone pressure. Target is $6.777 with stop at $7.098; invalidate if price reclaims $7.031.
#ETC #TradingSignals · NFA
SHORT · 15M
Entry: $7.022 - $7.031
TP1: $6.964
TP2: $6.897
TP3: $6.777
SL: $7.098
Price hit the bearish FVG and a BOS on the 15M confirmed the downtrend. Selling from premium aligns with HTF bias and London killzone pressure. Target is $6.777 with stop at $7.098; invalidate if price reclaims $7.031.
#ETC #TradingSignals · NFA
75

·
--
🚨 MASSIVE LIQUIDITY GRAB: $ETC
CVD showing AGGRESSIVE distribution. Institutional sell-walls are stacking at the current range. Price is trapping retail longs before a sharp flush to reclaim the value area. MOMENTUM IS SHIFTING.
EXECUTION:
ENTRY: 6.875 $ETC
SL: 7.211
TP1: 6.500
TP2: 6.200
RR: 1:2.5
Is $ETC failing the breakout or just hunting stops before a reversal?
#ETC #BinanceSquare #SlowSclap #TradingAnalysis
🚨 MASSIVE LIQUIDITY GRAB: $ETC
CVD showing AGGRESSIVE distribution. Institutional sell-walls are stacking at the current range. Price is trapping retail longs before a sharp flush to reclaim the value area. MOMENTUM IS SHIFTING.
EXECUTION:
ENTRY: 6.875 $ETC
SL: 7.211
TP1: 6.500
TP2: 6.200
RR: 1:2.5
Is $ETC failing the breakout or just hunting stops before a reversal?
#ETC #BinanceSquare #SlowSclap #TradingAnalysis
CVD showing AGGRESSIVE distribution. Institutional sell-walls are stacking at the current range. Price is trapping retail longs before a sharp flush to reclaim the value area. MOMENTUM IS SHIFTING.
EXECUTION:
ENTRY: 6.875 $ETC
SL: 7.211
TP1: 6.500
TP2: 6.200
RR: 1:2.5
Is $ETC failing the breakout or just hunting stops before a reversal?
#ETC #BinanceSquare #SlowSclap #TradingAnalysis
8

·
--
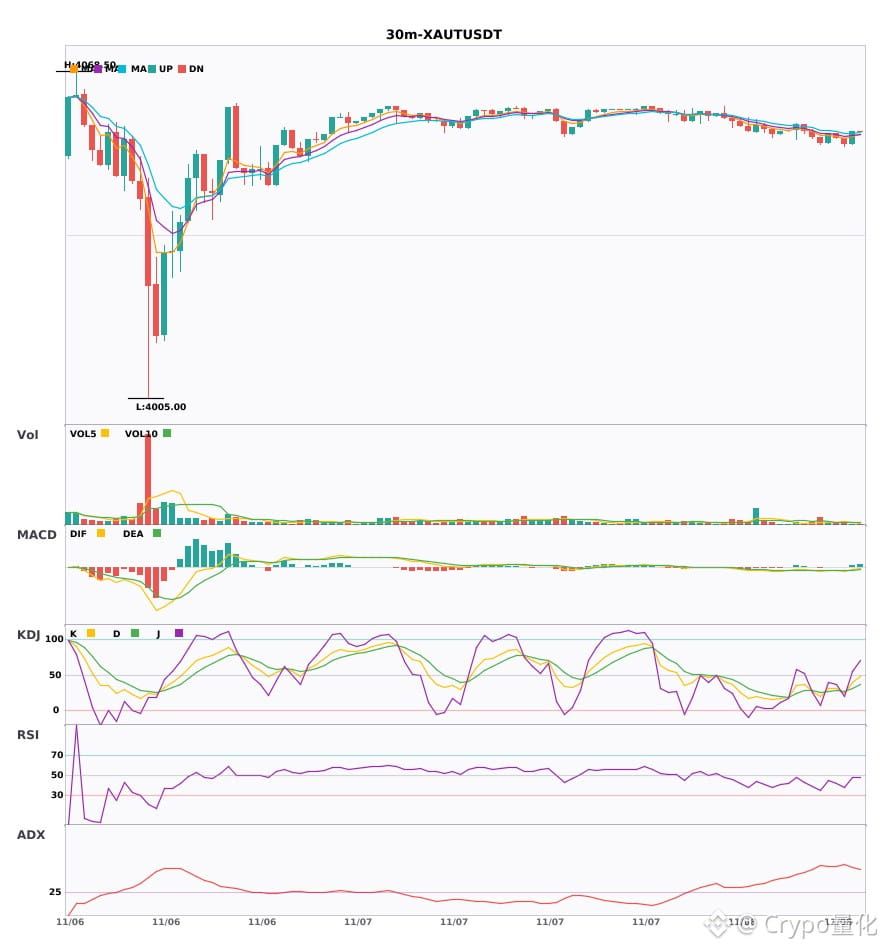
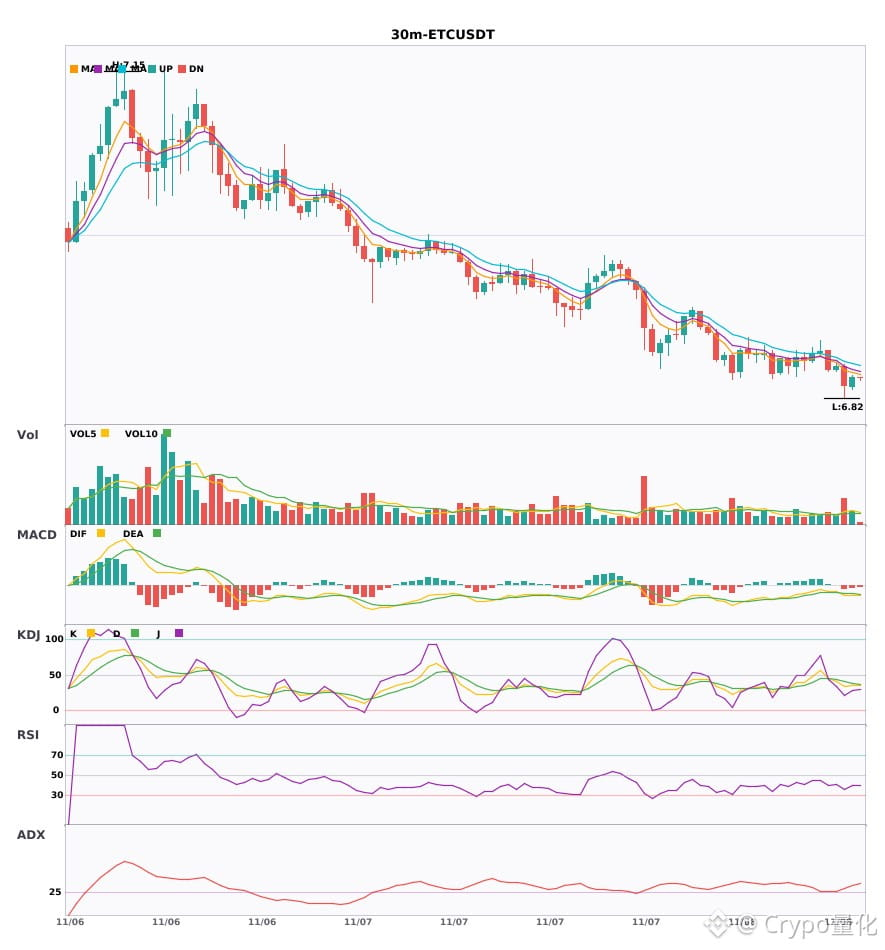
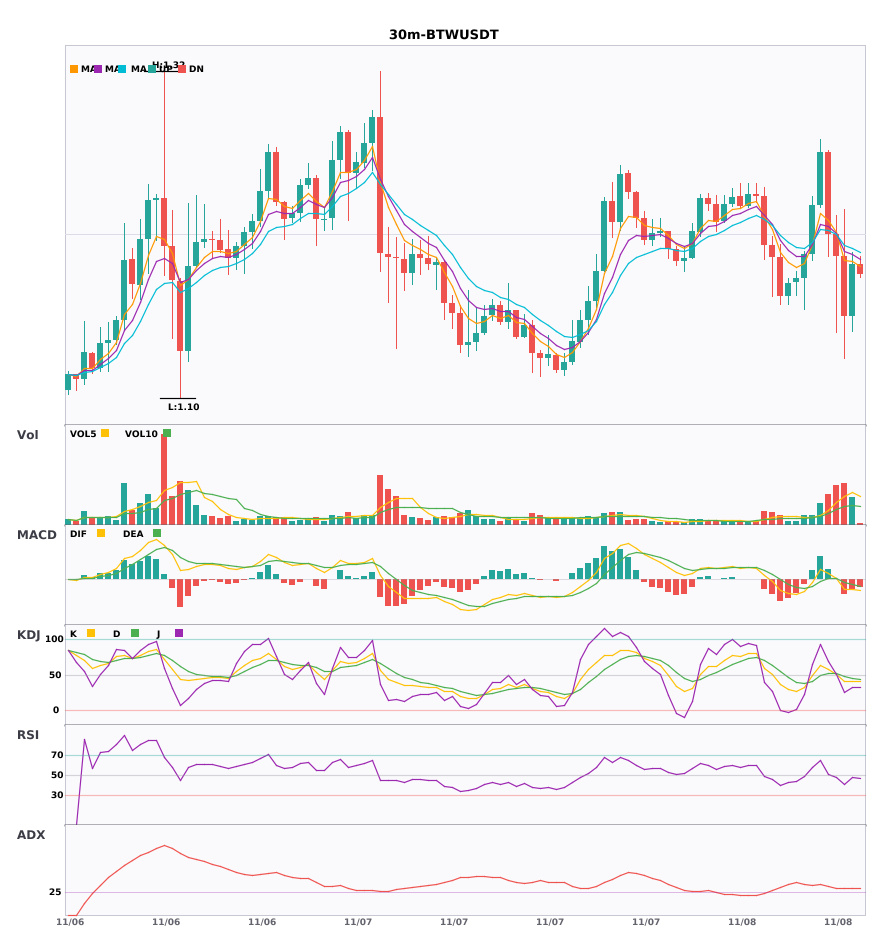
3 30-minute short alerts: $XAUT / $ETC / $BTW🔥
════════════════════
🟢 $XAUT 30-minute short signal
⚠️Technical analysis: ADX(59): Very strong trend (beware of an overheated pullback) | MACD bearish crossover below zero, bearish momentum accelerating | EMA5 < EMA8 < EMA13, bearish alignment | KDJ bearish crossover, bearish outlook in the short term (K: 24.7, D: 27.3) | Volume increased (1.5x)
════════════════════
🟢 $ETC 30-minute short signal
⚠️Technical analysis: ADX(29): Trend is forming; potential entry opportunity | MACD bearish crossover below zero, bearish momentum accelerating | EMA5 < EMA8 < EMA13, bearish alignment | KDJ showing weakness, bears in control (K: 34.0, D: 40.4) | Volume increased (2.3x)
════════════════════
🟢 $BTW 30-minute short signal
⚠️Technical analysis: ADX(32): Clear trending market | MACD DIF fell below the zero line, trend turning bearish | EMA5 crossed below EMA8, short-term outlook turning bearish | KDJ showing weakness, bears in control (K: 40.6, D: 47.9) | Volume surged (2.6x)
════════════════════
🔔 Follow for the latest market moves 🔔
#技术分析 #XAUT #ETC #BTW
📌 When trading, pay attention to whether the candlestick pattern confirms the signal
3 30-minute short alerts: $XAUT / $ETC / $BTW 🔥
════════════════════
🟢 $XAUT 30-minute short signal
⚠️Technical analysis: ADX(59): Very strong trend (beware of an overheated pullback) | MACD bearish crossover below zero, bearish momentum accelerating | EMA5 < EMA8 < EMA13, bearish alignment | KDJ bearish crossover, bearish outlook in the short term (K: 24.7, D: 27.3) | Volume increased (1.5x)
════════════════════
🟢 $ETC 30-minute short signal
⚠️Technical analysis: ADX(29): Trend is forming; potential entry opportunity | MACD bearish crossover below zero, bearish momentum accelerating | EMA5 < EMA8 < EMA13, bearish alignment | KDJ showing weakness, bears in control (K: 34.0, D: 40.4) | Volume increased (2.3x)
════════════════════
🟢 $BTW 30-minute short signal
⚠️Technical analysis: ADX(32): Clear trending market | MACD DIF fell below the zero line, trend turning bearish | EMA5 crossed below EMA8, short-term outlook turning bearish | KDJ showing weakness, bears in control (K: 40.6, D: 47.9) | Volume surged (2.6x)
════════════════════
🔔 Follow for the latest market moves 🔔
#技术分析 #XAUT #ETC #BTW
📌 When trading, pay attention to whether the candlestick pattern confirms the signal
════════════════════
🟢 $XAUT 30-minute short signal
⚠️Technical analysis: ADX(59): Very strong trend (beware of an overheated pullback) | MACD bearish crossover below zero, bearish momentum accelerating | EMA5 < EMA8 < EMA13, bearish alignment | KDJ bearish crossover, bearish outlook in the short term (K: 24.7, D: 27.3) | Volume increased (1.5x)
════════════════════
🟢 $ETC 30-minute short signal
⚠️Technical analysis: ADX(29): Trend is forming; potential entry opportunity | MACD bearish crossover below zero, bearish momentum accelerating | EMA5 < EMA8 < EMA13, bearish alignment | KDJ showing weakness, bears in control (K: 34.0, D: 40.4) | Volume increased (2.3x)
════════════════════
🟢 $BTW 30-minute short signal
⚠️Technical analysis: ADX(32): Clear trending market | MACD DIF fell below the zero line, trend turning bearish | EMA5 crossed below EMA8, short-term outlook turning bearish | KDJ showing weakness, bears in control (K: 40.6, D: 47.9) | Volume surged (2.6x)
════════════════════
🔔 Follow for the latest market moves 🔔
#技术分析 #XAUT #ETC #BTW
📌 When trading, pay attention to whether the candlestick pattern confirms the signal
2

·
--
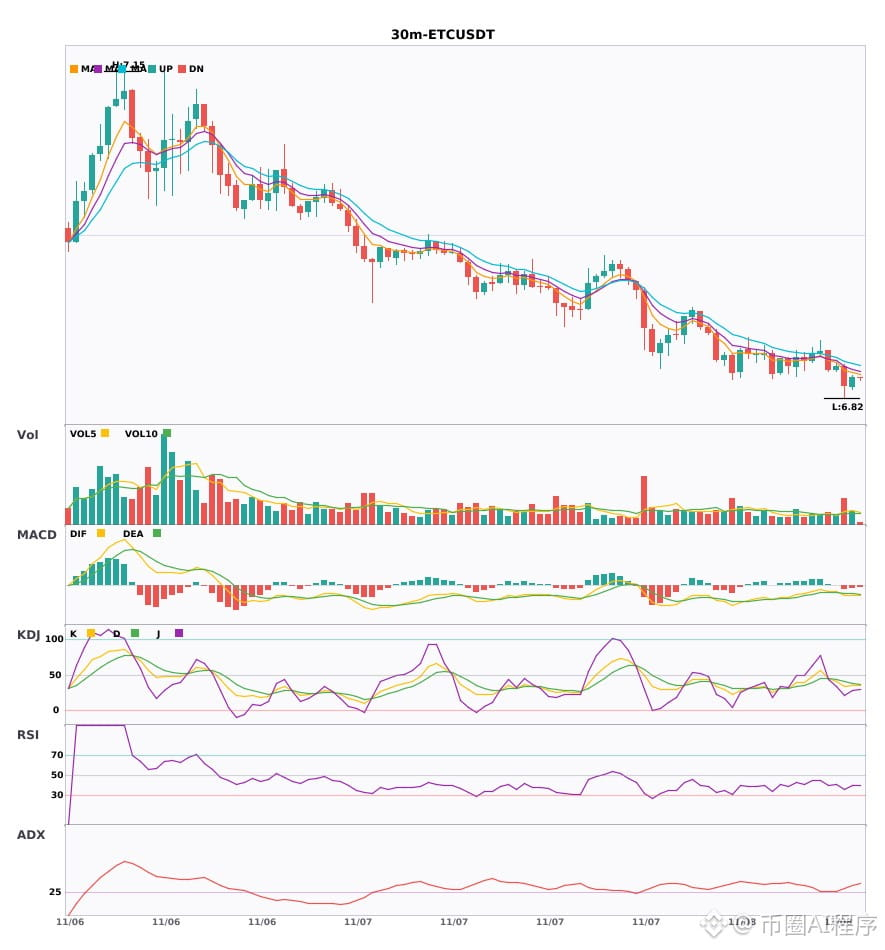
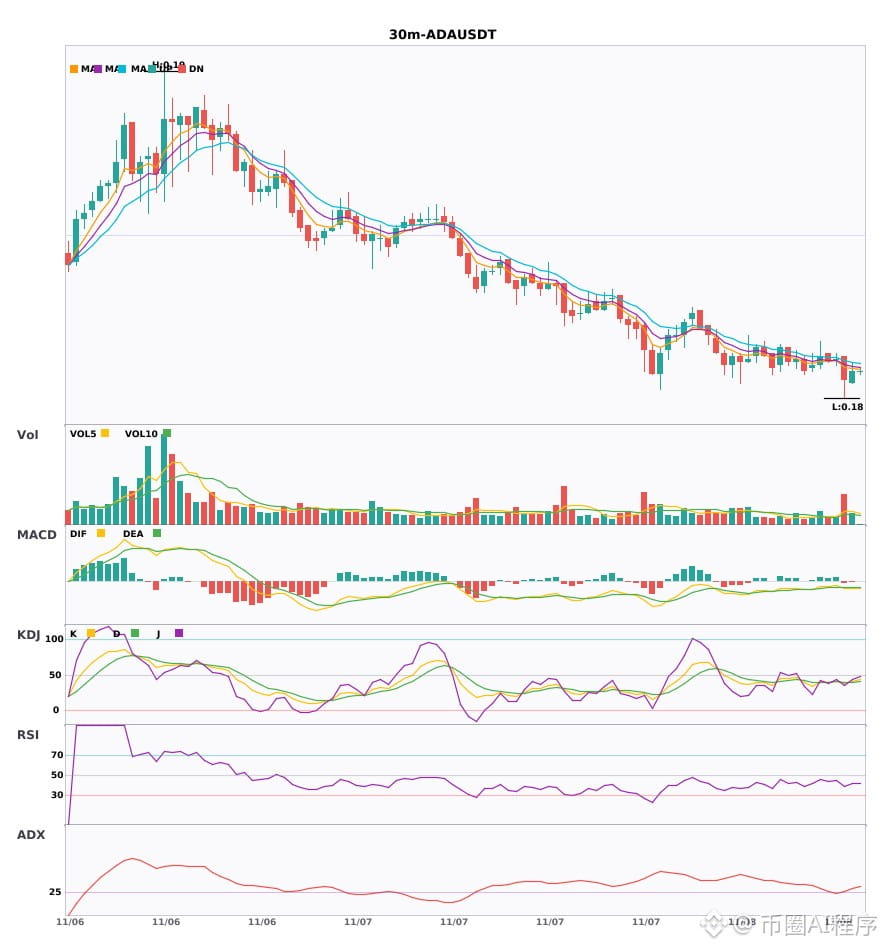
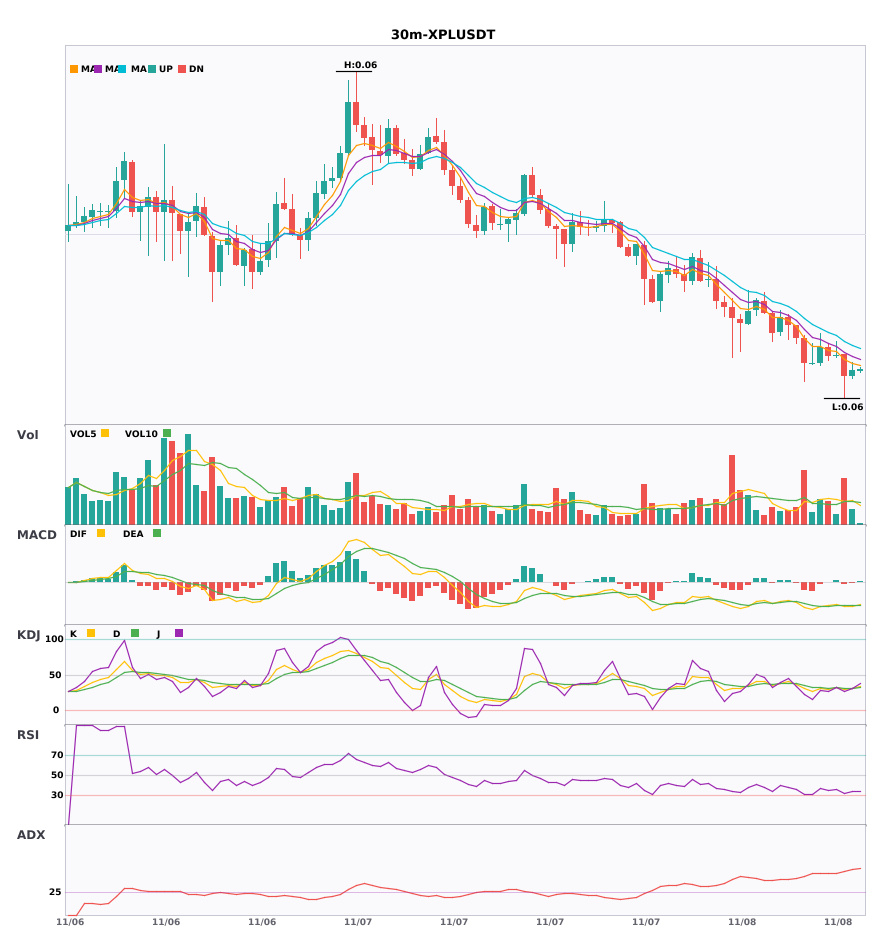
$ETC / $ADA / $XPL 30 30-minute bearish + 4-hour bearish in the same direction, multi-timeframe resonance turns bearish 🔥
════════════════════
🟢 $ETC 30-minute bearish signal
⚠️ Technicals: 4-hour bearish resonance confirmed | 30-minute entry MACD bearish crossover below zero, bearish momentum accelerating | EMA5 less than EMA8 less than EMA13 bearish alignment | KDJ weak trend, bears in control (K=34.0 D=40.4) | Volume expanded (2.3x)
════════════════════
🟢 $ADA 30-minute bearish signal
⚠️ Technicals: 4-hour bearish resonance confirmed | 30-minute entry MACD bearish crossover below zero, bearish momentum accelerating | EMA5 less than EMA8 less than EMA13 bearish alignment | KDJ bearish crossover, short-term bearish (K=38.1 D=39.6) | Volume surged (3.0x)
════════════════════
🟢 $XPL 30-minute bearish signal
⚠️ Technicals: 4-hour bearish resonance confirmed | 30-minute entry MACD bearish crossover below zero, bearish momentum accelerating | EMA5 less than EMA8 less than EMA13 bearish alignment | KDJ bearish crossover, short-term bearish (K=30.0 D=31.2) | Volume expanded (2.0x)
════════════════════
🔔 Follow to get the first-hand market moves 🔔
#多周期共振 #ETC #ADA #XPL
📌 When trading, pay attention to whether the candlestick pattern matches
$ETC / $ADA / $XPL 30 30-minute bearish + 4-hour bearish in the same direction, multi-timeframe resonance turns bearish 🔥
════════════════════
🟢 $ETC 30-minute bearish signal
⚠️ Technicals: 4-hour bearish resonance confirmed | 30-minute entry MACD bearish crossover below zero, bearish momentum accelerating | EMA5 less than EMA8 less than EMA13 bearish alignment | KDJ weak trend, bears in control (K=34.0 D=40.4) | Volume expanded (2.3x)
════════════════════
🟢 $ADA 30-minute bearish signal
⚠️ Technicals: 4-hour bearish resonance confirmed | 30-minute entry MACD bearish crossover below zero, bearish momentum accelerating | EMA5 less than EMA8 less than EMA13 bearish alignment | KDJ bearish crossover, short-term bearish (K=38.1 D=39.6) | Volume surged (3.0x)
════════════════════
🟢 $XPL 30-minute bearish signal
⚠️ Technicals: 4-hour bearish resonance confirmed | 30-minute entry MACD bearish crossover below zero, bearish momentum accelerating | EMA5 less than EMA8 less than EMA13 bearish alignment | KDJ bearish crossover, short-term bearish (K=30.0 D=31.2) | Volume expanded (2.0x)
════════════════════
🔔 Follow to get the first-hand market moves 🔔
#多周期共振 #ETC #ADA #XPL
📌 When trading, pay attention to whether the candlestick pattern matches
════════════════════
🟢 $ETC 30-minute bearish signal
⚠️ Technicals: 4-hour bearish resonance confirmed | 30-minute entry MACD bearish crossover below zero, bearish momentum accelerating | EMA5 less than EMA8 less than EMA13 bearish alignment | KDJ weak trend, bears in control (K=34.0 D=40.4) | Volume expanded (2.3x)
════════════════════
🟢 $ADA 30-minute bearish signal
⚠️ Technicals: 4-hour bearish resonance confirmed | 30-minute entry MACD bearish crossover below zero, bearish momentum accelerating | EMA5 less than EMA8 less than EMA13 bearish alignment | KDJ bearish crossover, short-term bearish (K=38.1 D=39.6) | Volume surged (3.0x)
════════════════════
🟢 $XPL 30-minute bearish signal
⚠️ Technicals: 4-hour bearish resonance confirmed | 30-minute entry MACD bearish crossover below zero, bearish momentum accelerating | EMA5 less than EMA8 less than EMA13 bearish alignment | KDJ bearish crossover, short-term bearish (K=30.0 D=31.2) | Volume expanded (2.0x)
════════════════════
🔔 Follow to get the first-hand market moves 🔔
#多周期共振 #ETC #ADA #XPL
📌 When trading, pay attention to whether the candlestick pattern matches
53
·
--
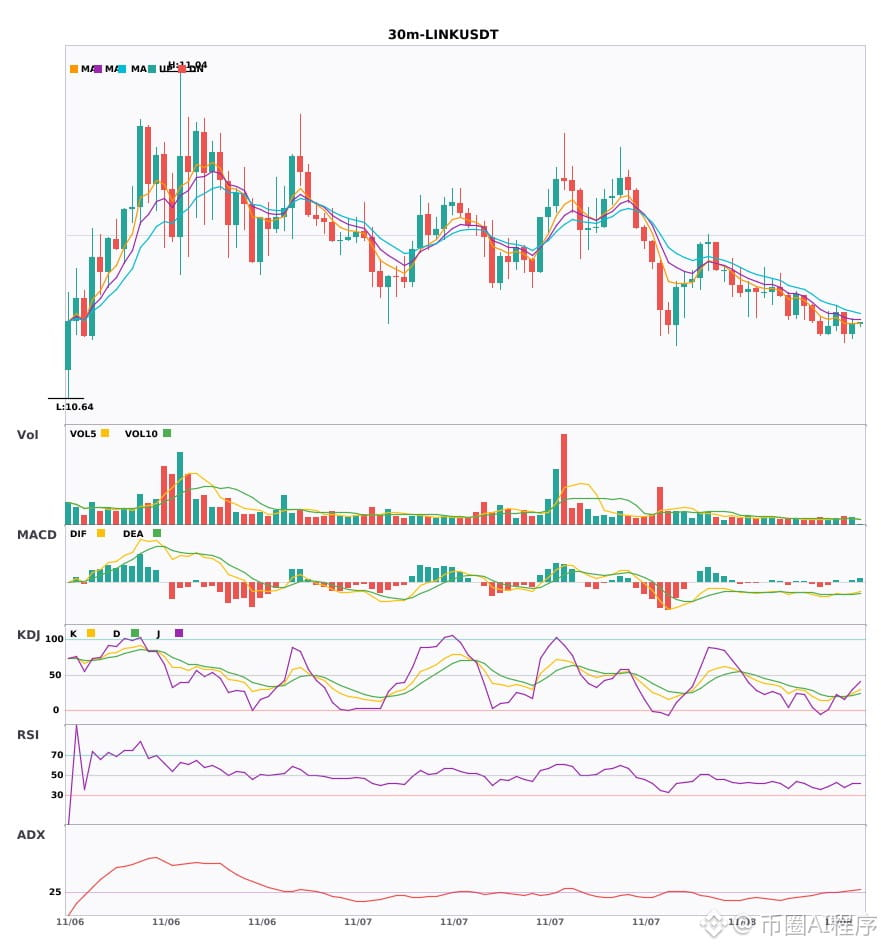
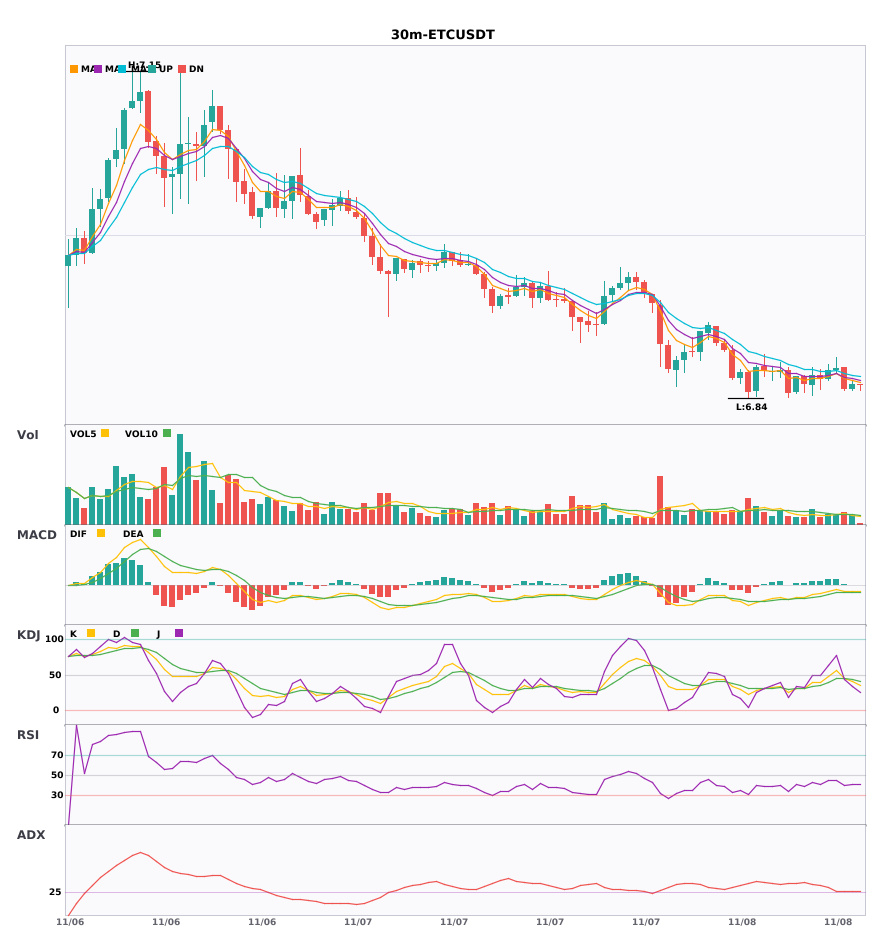
Multi-timeframe confluence: $LINK / $WIF / $ETC 30-minute charts weakening; 4-hour bearish trend confirmed 🔥
════════════════════
🟢 $LINK 30-minute bearish signal
⚠️Technical analysis: 4-hour bearish confluence confirmed | 30-minute entry: MACD bearish crossover below zero, bearish momentum accelerating | EMA5 < EMA8 < EMA13, bearish alignment | KDJ bearish crossover, short-term outlook bearish (K: 18.2, D: 19.6) | Normal volume (1.4x)
════════════════════
🟢 $WIF 30-minute bearish signal
⚠️Technical analysis: 4-hour bearish confluence confirmed | 30-minute entry: MACD bearish crossover below zero, bearish momentum accelerating | EMA5 < EMA8 < EMA13, bearish alignment | KDJ bearish crossover, short-term outlook bearish (K: 45.1, D: 50.5) | Normal volume (1.2x)
════════════════════
🟢 $ETC 30-minute bearish signal
⚠️Technical analysis: 4-hour bearish confluence confirmed | 30-minute entry: EMA5 crossed below EMA8, short-term outlook turns bearish | KDJ bearish crossover, short-term outlook bearish (K: 44.6, D: 45.0) | Normal volume (1.3x)
════════════════════
🔔 Follow for the latest market movements 🔔
#多周期共振 #LINK #WIF #ETC
📌 When trading, pay attention to whether the candlestick pattern aligns
Multi-timeframe confluence: $LINK / $WIF / $ETC 30-minute charts weakening; 4-hour bearish trend confirmed 🔥
════════════════════
🟢 $LINK 30-minute bearish signal
⚠️Technical analysis: 4-hour bearish confluence confirmed | 30-minute entry: MACD bearish crossover below zero, bearish momentum accelerating | EMA5 < EMA8 < EMA13, bearish alignment | KDJ bearish crossover, short-term outlook bearish (K: 18.2, D: 19.6) | Normal volume (1.4x)
════════════════════
🟢 $WIF 30-minute bearish signal
⚠️Technical analysis: 4-hour bearish confluence confirmed | 30-minute entry: MACD bearish crossover below zero, bearish momentum accelerating | EMA5 < EMA8 < EMA13, bearish alignment | KDJ bearish crossover, short-term outlook bearish (K: 45.1, D: 50.5) | Normal volume (1.2x)
════════════════════
🟢 $ETC 30-minute bearish signal
⚠️Technical analysis: 4-hour bearish confluence confirmed | 30-minute entry: EMA5 crossed below EMA8, short-term outlook turns bearish | KDJ bearish crossover, short-term outlook bearish (K: 44.6, D: 45.0) | Normal volume (1.3x)
════════════════════
🔔 Follow for the latest market movements 🔔
#多周期共振 #LINK #WIF #ETC
📌 When trading, pay attention to whether the candlestick pattern aligns
════════════════════
🟢 $LINK 30-minute bearish signal
⚠️Technical analysis: 4-hour bearish confluence confirmed | 30-minute entry: MACD bearish crossover below zero, bearish momentum accelerating | EMA5 < EMA8 < EMA13, bearish alignment | KDJ bearish crossover, short-term outlook bearish (K: 18.2, D: 19.6) | Normal volume (1.4x)
════════════════════
🟢 $WIF 30-minute bearish signal
⚠️Technical analysis: 4-hour bearish confluence confirmed | 30-minute entry: MACD bearish crossover below zero, bearish momentum accelerating | EMA5 < EMA8 < EMA13, bearish alignment | KDJ bearish crossover, short-term outlook bearish (K: 45.1, D: 50.5) | Normal volume (1.2x)
════════════════════
🟢 $ETC 30-minute bearish signal
⚠️Technical analysis: 4-hour bearish confluence confirmed | 30-minute entry: EMA5 crossed below EMA8, short-term outlook turns bearish | KDJ bearish crossover, short-term outlook bearish (K: 44.6, D: 45.0) | Normal volume (1.3x)
════════════════════
🔔 Follow for the latest market movements 🔔
#多周期共振 #LINK #WIF #ETC
📌 When trading, pay attention to whether the candlestick pattern aligns
15

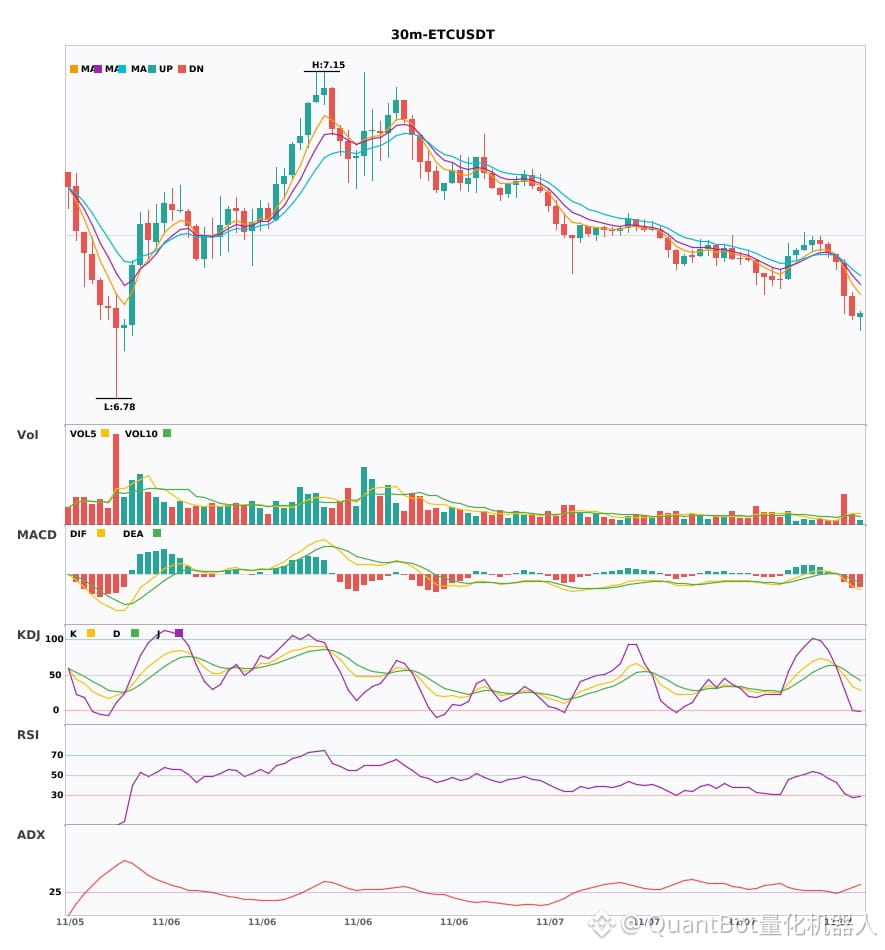
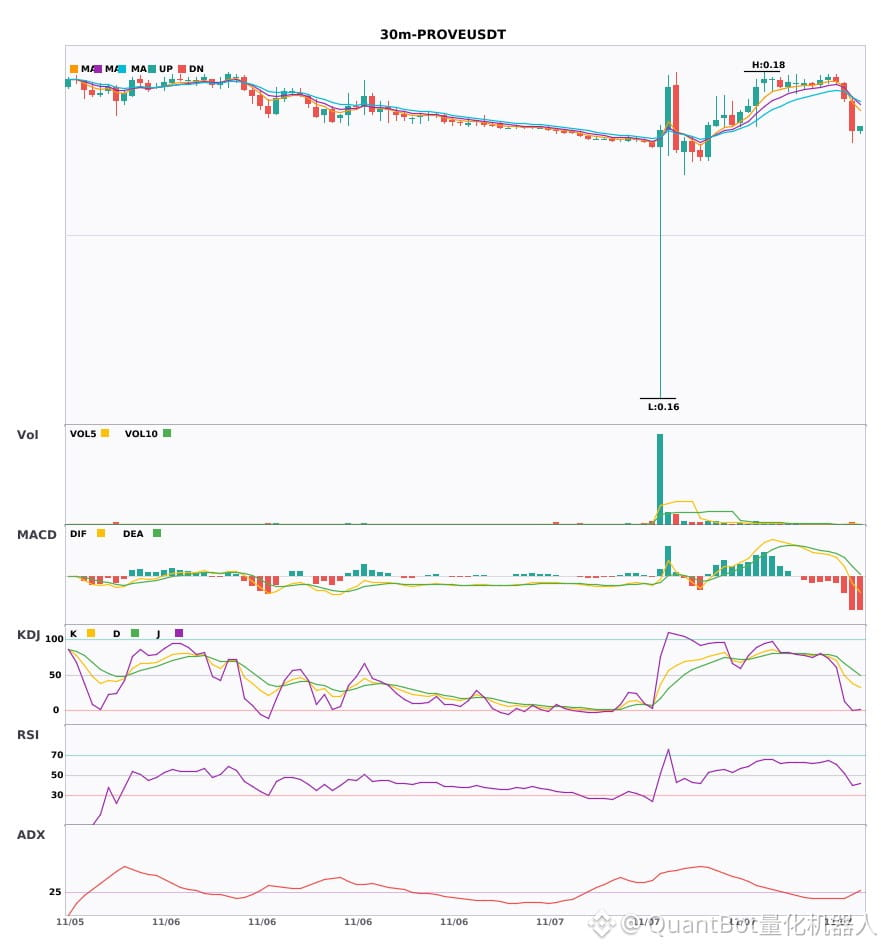
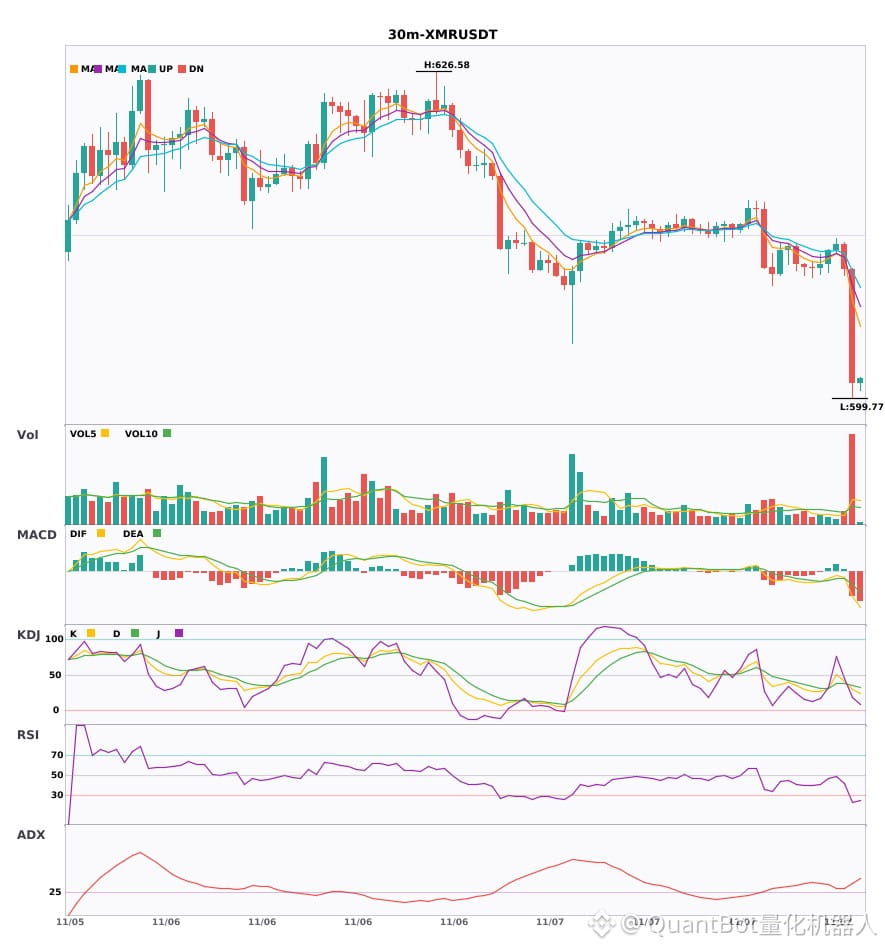
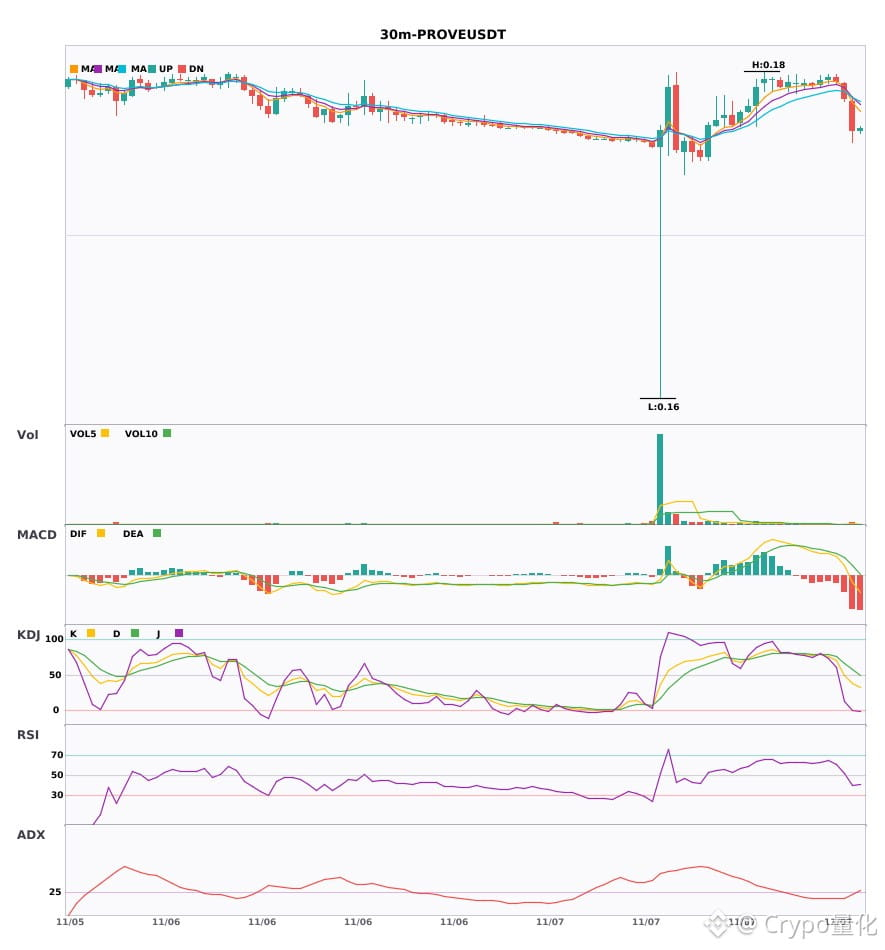
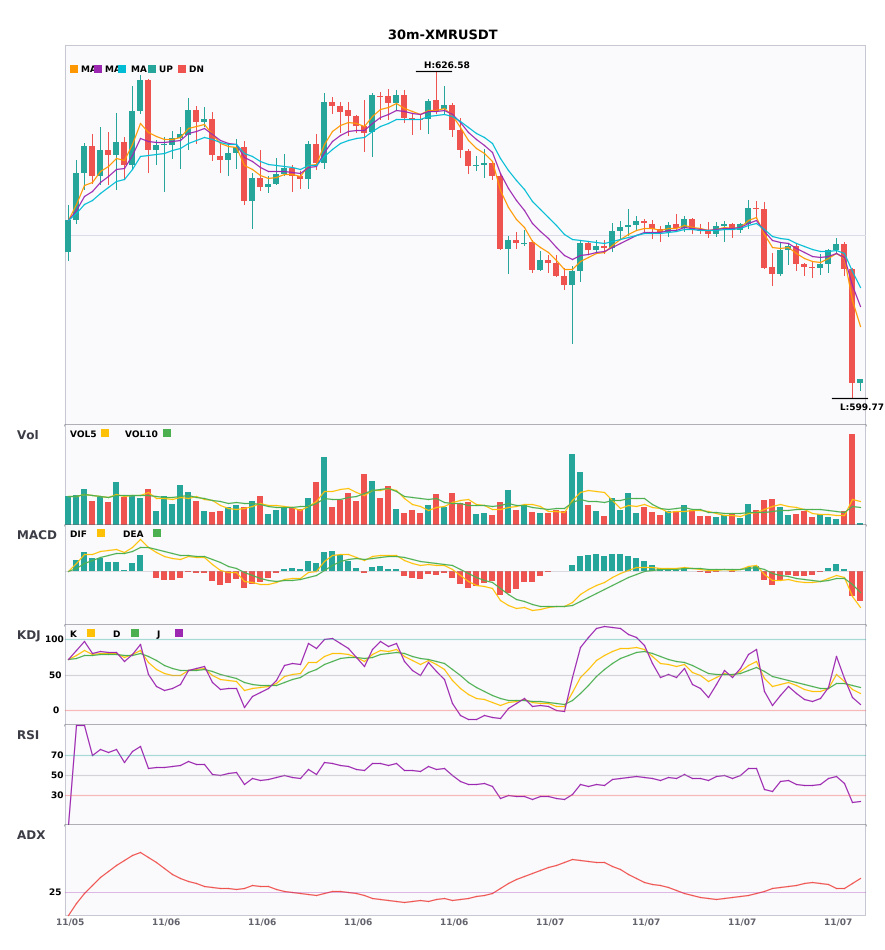
$ETC / $PROVE / $XMR 30-minute confluence turns bearish, with bearish signals appearing simultaneously
📉 $ETC | 30-minute bearish signal
━━━━━━━━━━━━━━━━━━
Technical analysis: ADX(29) Trend is forming; participation is possible | MACDDIF fell below the zero line, trend turns bearish | EMA5 crossed below EMA8, short-term trend turns bearish | Volume surge (3.3x)
Price change: -0.5500%
📉 $PROVE | 30-minute bearish signal
━━━━━━━━━━━━━━━━━━
Technical analysis: ADX(28) Trend is forming; participation is possible | MACDDIF fell below the zero line, trend turns bearish | EMA5 < EMA8 < EMA13, bearish alignment | Volume surge (3.2x)
Price change: -1.1100%
📉 $XMR | 30-minute bearish signal
━━━━━━━━━━━━━━━━━━
Technical analysis: ADX(37) Clear trending market | MACD bearish crossover below zero, bearish momentum accelerating | EMA5 < EMA8 < EMA13, bearish alignment | KDJ bearish crossover, short-term outlook is bearish (K: 30.2, D: 35.7) | Volume surge (4.8x)
Price change: -1.5400%
━━━━━━━━━━━━━━━━━━
#技术分析 #ETC #PROVE #XMR
📌 The above content is for reference only and does not constitute investment advice
$ETC / $PROVE / $XMR 30-minute confluence turns bearish, with bearish signals appearing simultaneously
📉 $ETC | 30-minute bearish signal
━━━━━━━━━━━━━━━━━━
Technical analysis: ADX(29) Trend is forming; participation is possible | MACDDIF fell below the zero line, trend turns bearish | EMA5 crossed below EMA8, short-term trend turns bearish | Volume surge (3.3x)
Price change: -0.5500%
📉 $PROVE | 30-minute bearish signal
━━━━━━━━━━━━━━━━━━
Technical analysis: ADX(28) Trend is forming; participation is possible | MACDDIF fell below the zero line, trend turns bearish | EMA5 < EMA8 < EMA13, bearish alignment | Volume surge (3.2x)
Price change: -1.1100%
📉 $XMR | 30-minute bearish signal
━━━━━━━━━━━━━━━━━━
Technical analysis: ADX(37) Clear trending market | MACD bearish crossover below zero, bearish momentum accelerating | EMA5 < EMA8 < EMA13, bearish alignment | KDJ bearish crossover, short-term outlook is bearish (K: 30.2, D: 35.7) | Volume surge (4.8x)
Price change: -1.5400%
━━━━━━━━━━━━━━━━━━
#技术分析 #ETC #PROVE #XMR
📌 The above content is for reference only and does not constitute investment advice
📉 $ETC | 30-minute bearish signal
━━━━━━━━━━━━━━━━━━
Technical analysis: ADX(29) Trend is forming; participation is possible | MACDDIF fell below the zero line, trend turns bearish | EMA5 crossed below EMA8, short-term trend turns bearish | Volume surge (3.3x)
Price change: -0.5500%
📉 $PROVE | 30-minute bearish signal
━━━━━━━━━━━━━━━━━━
Technical analysis: ADX(28) Trend is forming; participation is possible | MACDDIF fell below the zero line, trend turns bearish | EMA5 < EMA8 < EMA13, bearish alignment | Volume surge (3.2x)
Price change: -1.1100%
📉 $XMR | 30-minute bearish signal
━━━━━━━━━━━━━━━━━━
Technical analysis: ADX(37) Clear trending market | MACD bearish crossover below zero, bearish momentum accelerating | EMA5 < EMA8 < EMA13, bearish alignment | KDJ bearish crossover, short-term outlook is bearish (K: 30.2, D: 35.7) | Volume surge (4.8x)
Price change: -1.5400%
━━━━━━━━━━━━━━━━━━
#技术分析 #ETC #PROVE #XMR
📌 The above content is for reference only and does not constitute investment advice
6
·
--
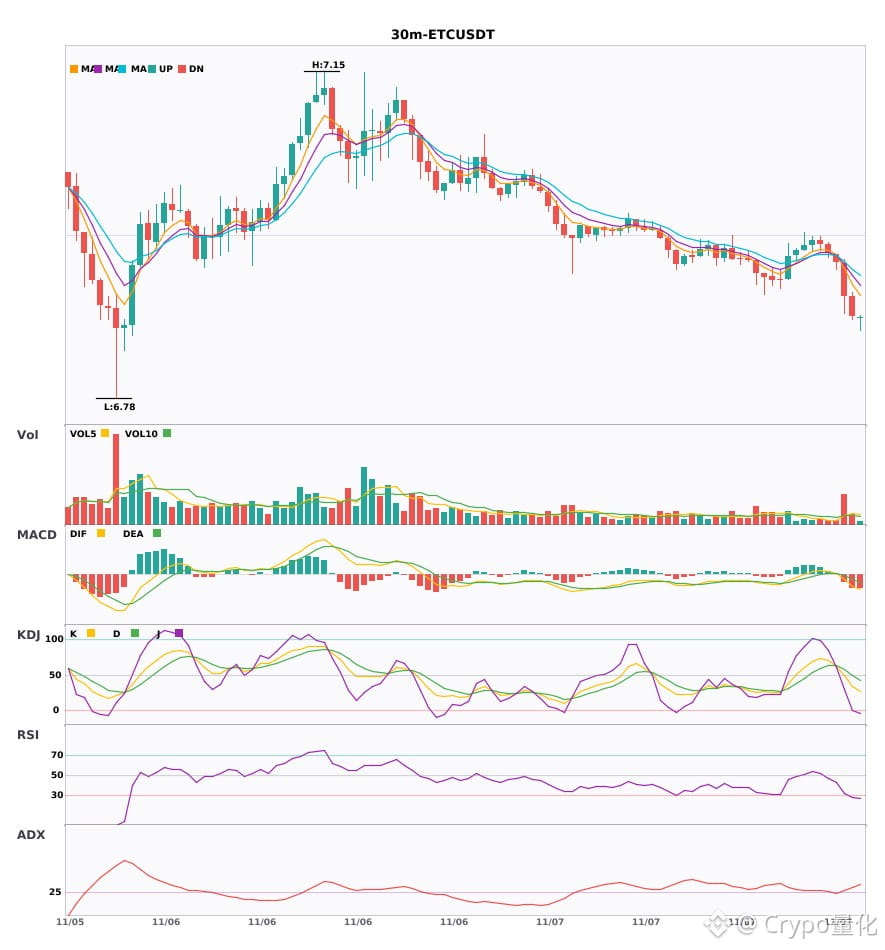
3 thirty-minute bearish alerts: $ETC / $PROVE / $XMR🔥
════════════════════
🟢 $ETC 30-minute bearish signal
⚠️Technical analysis: ADX(29) Trend is forming; opportunity to participate | MACD DIF fell below the zero line; trend turns bearish | EMA5 crossed below EMA8; short-term bearish | Volume surge (3.3x)
════════════════════
🟢 $PROVE 30-minute bearish signal
⚠️Technical analysis: ADX(28) Trend is forming; opportunity to participate | MACD DIF fell below the zero line; trend turns bearish | EMA5 < EMA8 < EMA13; bearish alignment | Volume surge (3.2x)
════════════════════
🟢 $XMR 30-minute bearish signal
⚠️Technical analysis: ADX(37) Clear trending market | MACD bearish crossover below zero; bearish momentum accelerating | EMA5 < EMA8 < EMA13; bearish alignment | KDJ bearish crossover; short-term outlook is bearish (K is 30.2, D is 35.7) | Volume surge (4.8x)
════════════════════
🔔 Follow for the latest market movements 🔔
#技术分析 #ETC #PROVE #XMR
📌 When trading, pay attention to whether the candlestick pattern confirms the signal
3 thirty-minute bearish alerts: $ETC / $PROVE / $XMR 🔥
════════════════════
🟢 $ETC 30-minute bearish signal
⚠️Technical analysis: ADX(29) Trend is forming; opportunity to participate | MACD DIF fell below the zero line; trend turns bearish | EMA5 crossed below EMA8; short-term bearish | Volume surge (3.3x)
════════════════════
🟢 $PROVE 30-minute bearish signal
⚠️Technical analysis: ADX(28) Trend is forming; opportunity to participate | MACD DIF fell below the zero line; trend turns bearish | EMA5 < EMA8 < EMA13; bearish alignment | Volume surge (3.2x)
════════════════════
🟢 $XMR 30-minute bearish signal
⚠️Technical analysis: ADX(37) Clear trending market | MACD bearish crossover below zero; bearish momentum accelerating | EMA5 < EMA8 < EMA13; bearish alignment | KDJ bearish crossover; short-term outlook is bearish (K is 30.2, D is 35.7) | Volume surge (4.8x)
════════════════════
🔔 Follow for the latest market movements 🔔
#技术分析 #ETC #PROVE #XMR
📌 When trading, pay attention to whether the candlestick pattern confirms the signal
════════════════════
🟢 $ETC 30-minute bearish signal
⚠️Technical analysis: ADX(29) Trend is forming; opportunity to participate | MACD DIF fell below the zero line; trend turns bearish | EMA5 crossed below EMA8; short-term bearish | Volume surge (3.3x)
════════════════════
🟢 $PROVE 30-minute bearish signal
⚠️Technical analysis: ADX(28) Trend is forming; opportunity to participate | MACD DIF fell below the zero line; trend turns bearish | EMA5 < EMA8 < EMA13; bearish alignment | Volume surge (3.2x)
════════════════════
🟢 $XMR 30-minute bearish signal
⚠️Technical analysis: ADX(37) Clear trending market | MACD bearish crossover below zero; bearish momentum accelerating | EMA5 < EMA8 < EMA13; bearish alignment | KDJ bearish crossover; short-term outlook is bearish (K is 30.2, D is 35.7) | Volume surge (4.8x)
════════════════════
🔔 Follow for the latest market movements 🔔
#技术分析 #ETC #PROVE #XMR
📌 When trading, pay attention to whether the candlestick pattern confirms the signal
11
·
--
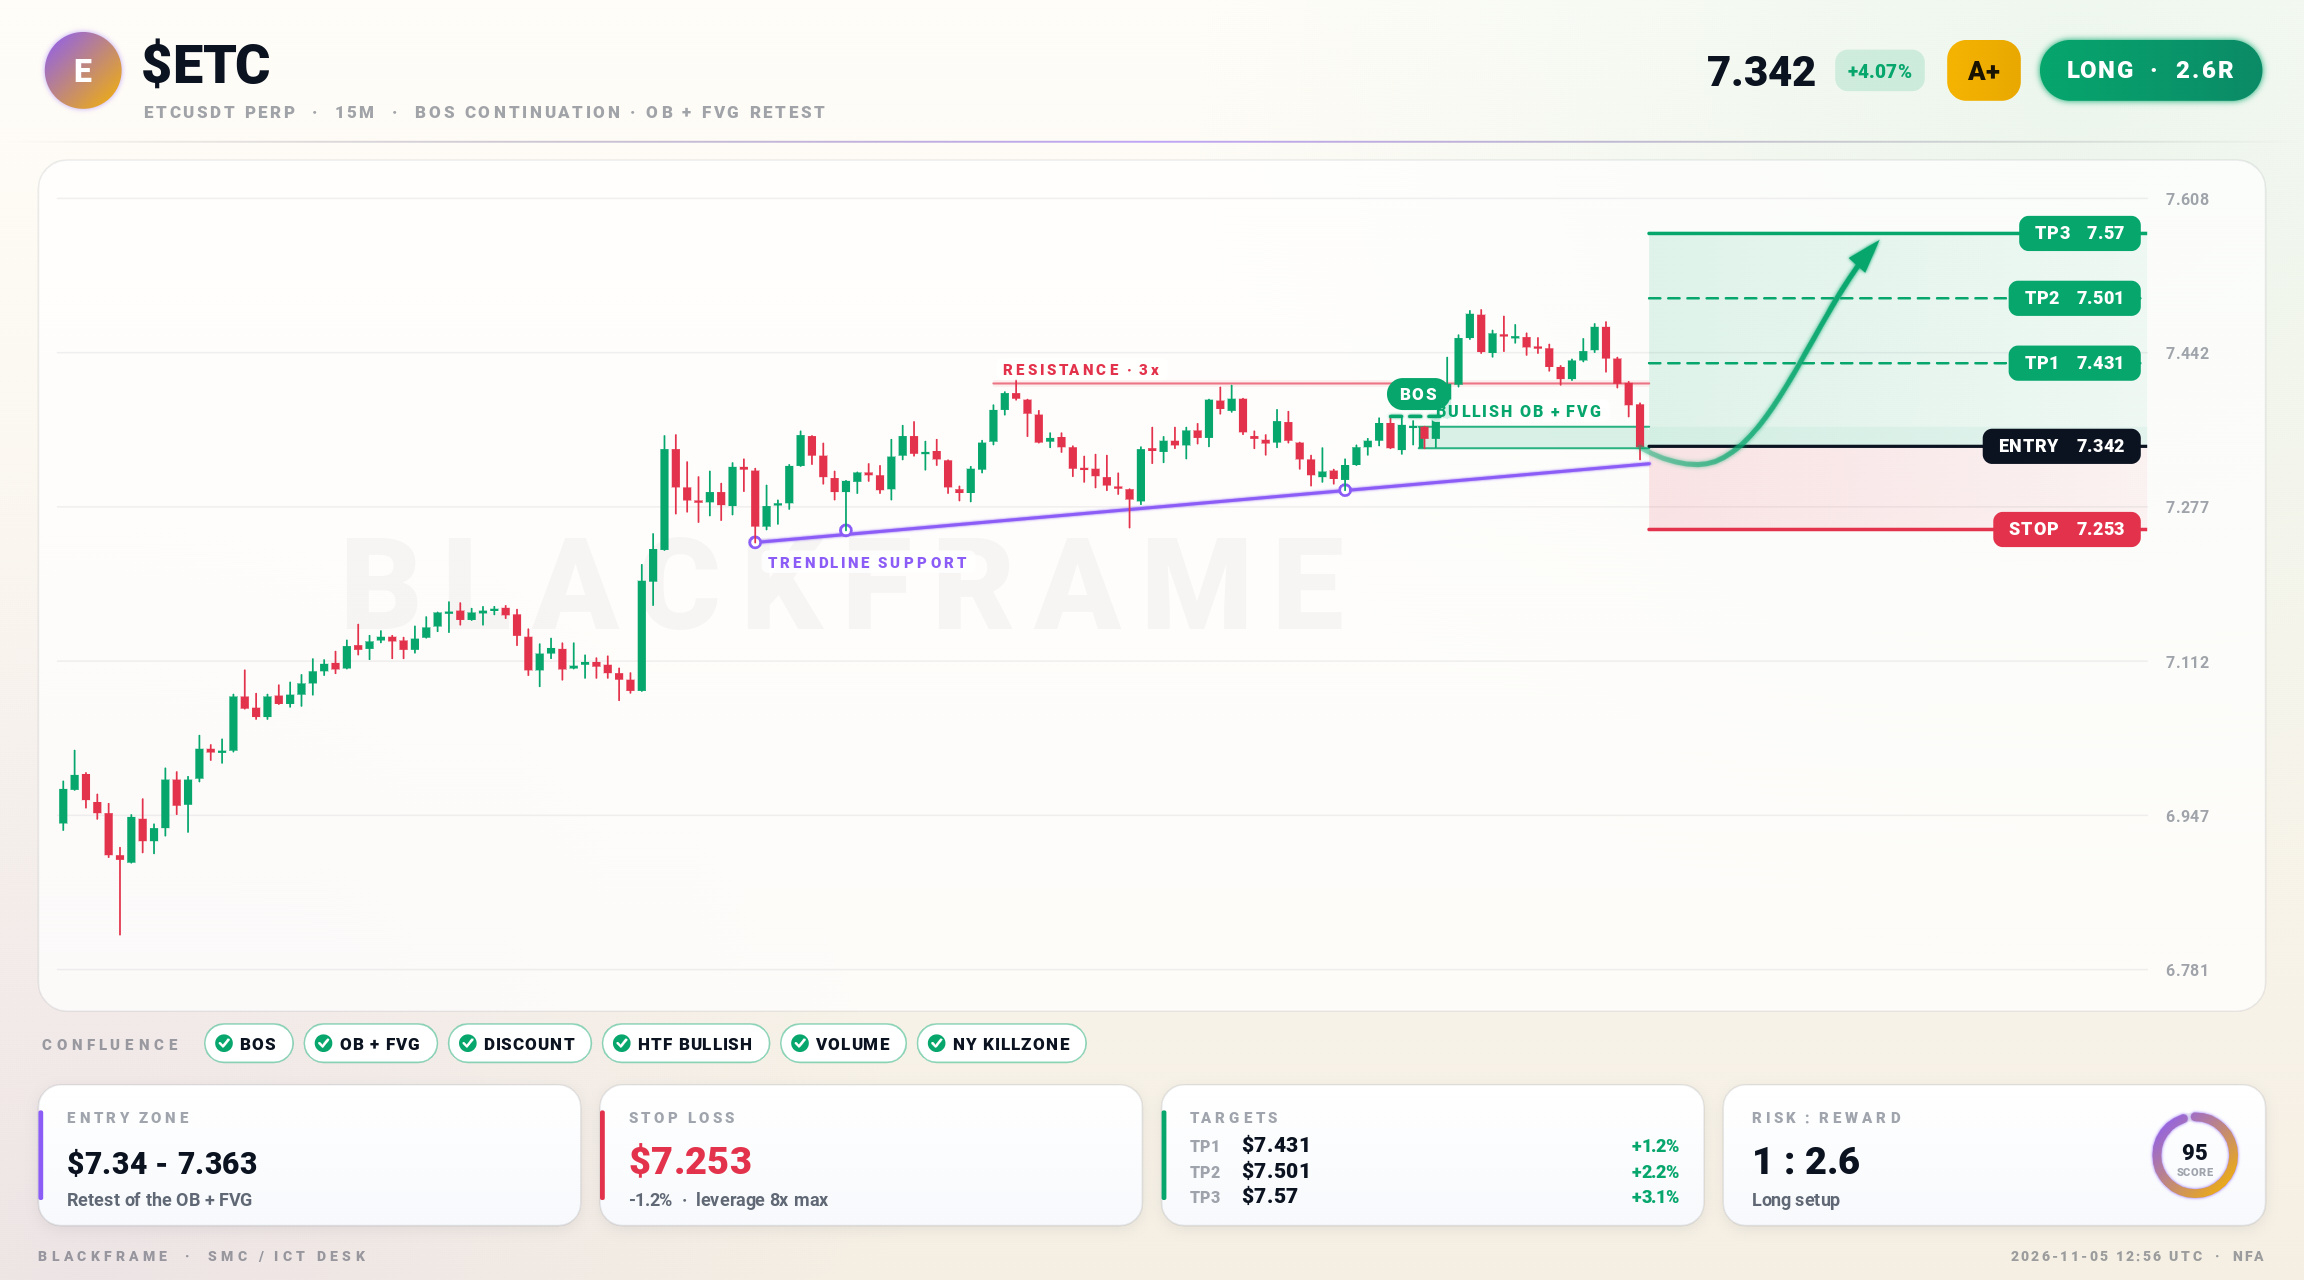
🚀 $ETC hits bullish CHoCH on 15M
LONG · 15M
Entry: $7.342 - $7.363
TP1: $7.431
TP2: $7.501
TP3: $7.57
SL: $7.253
BOS on 15M confirms uptrend, OB and FVG stacked at $7.34-7.363 provide strong entry. Buying from discount aligns with HTF bias and volume expansion. Target is $7.57, stop at $7.253.
#ETC #CryptoTrading · NFA
🚀 $ETC hits bullish CHoCH on 15M
LONG · 15M
Entry: $7.342 - $7.363
TP1: $7.431
TP2: $7.501
TP3: $7.57
SL: $7.253
BOS on 15M confirms uptrend, OB and FVG stacked at $7.34-7.363 provide strong entry. Buying from discount aligns with HTF bias and volume expansion. Target is $7.57, stop at $7.253.
#ETC #CryptoTrading · NFA
LONG · 15M
Entry: $7.342 - $7.363
TP1: $7.431
TP2: $7.501
TP3: $7.57
SL: $7.253
BOS on 15M confirms uptrend, OB and FVG stacked at $7.34-7.363 provide strong entry. Buying from discount aligns with HTF bias and volume expansion. Target is $7.57, stop at $7.253.
#ETC #CryptoTrading · NFA
88
·
--
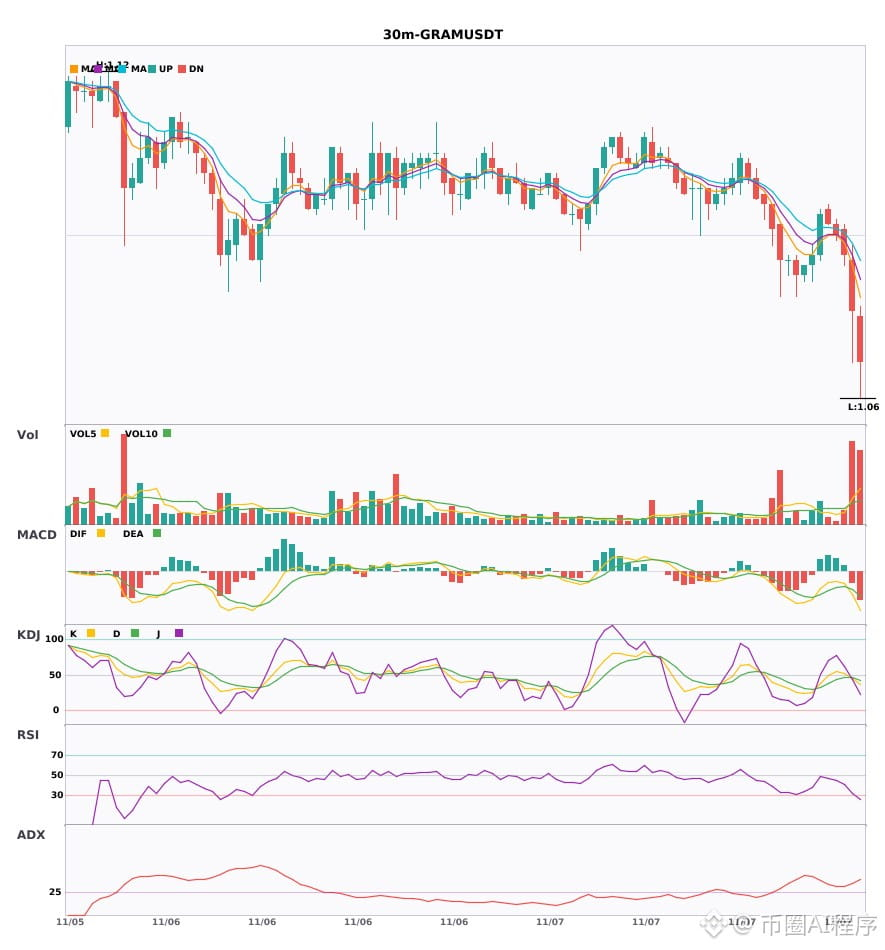
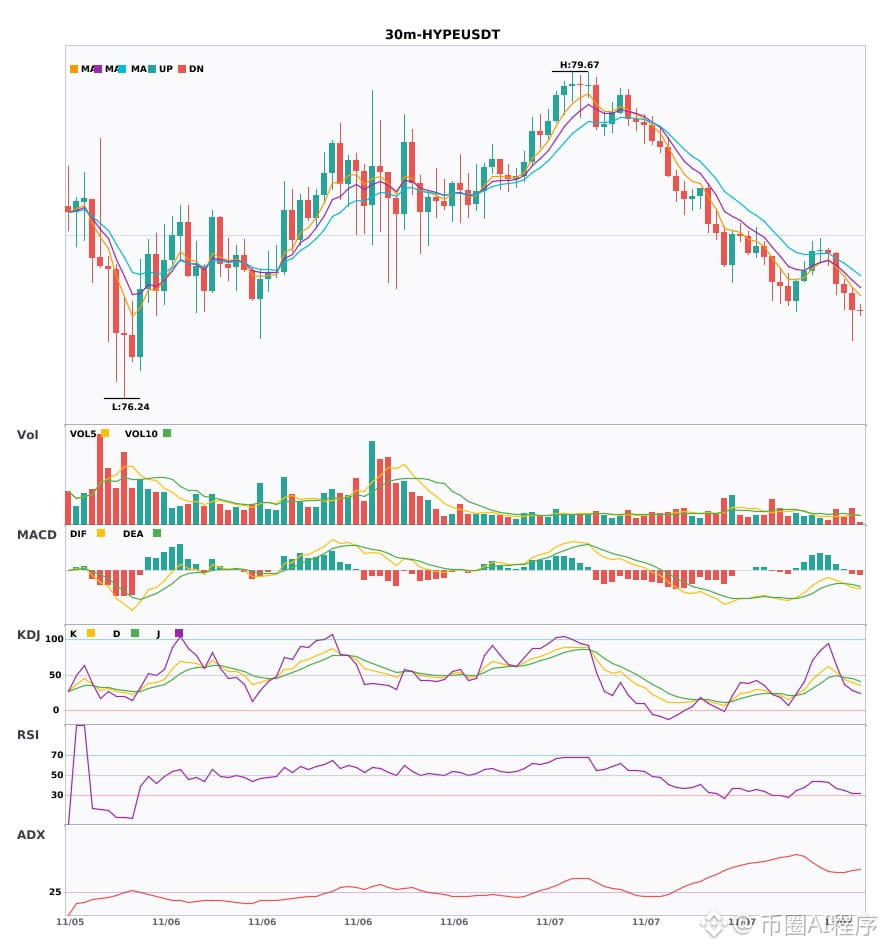
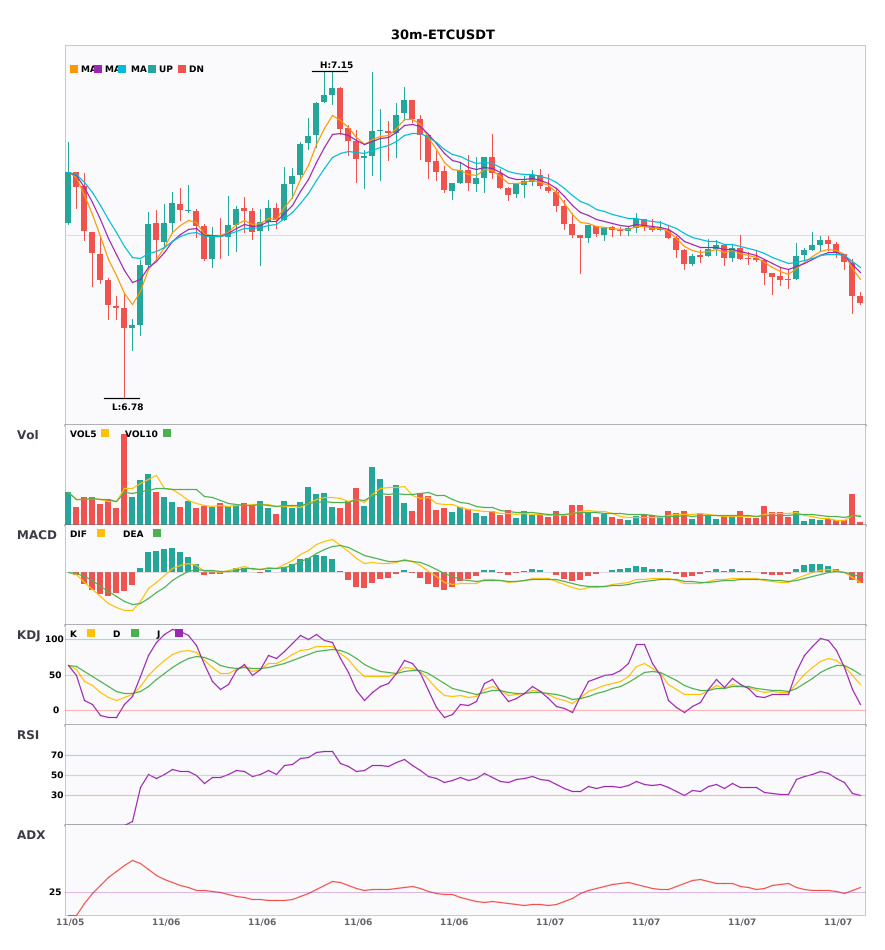
$GRAM / $HYPE / $ETC 30-minute short + 4-hour short signals aligned; multi-timeframe resonance turns bearish 🔥
════════════════════
🟢 $GRAM 30-minute short signal
⚠️Technical analysis: 4-hour bearish resonance confirmed | 30-minute entry: MACD death cross below zero, bearish momentum accelerating | EMA5 < EMA8 < EMA13, bearish alignment | KDJ death cross, short-term outlook bearish (K: 45.1, D: 45.9) | Volume surge (3.7x)
════════════════════
🟢 $HYPE 30-minute short signal
⚠️Technical analysis: 4-hour bearish resonance confirmed | 30-minute entry: MACD death cross below zero, bearish momentum accelerating | EMA5 < EMA8 < EMA13, bearish alignment | KDJ in weak territory, bears have the upper hand (K: 39.1, D: 44.5) | Increased volume (1.6x)
════════════════════
🟢 $ETC 30-minute short signal
⚠️Technical analysis: 4-hour bearish resonance confirmed | 30-minute entry: MACD DIF falls below the zero line, trend turns bearish | EMA5 crosses below EMA8, short-term outlook turns bearish | Volume surge (3.3x)
════════════════════
🔔 Follow for first-hand market movement alerts 🔔
#多周期共振 #GRAM #HYPE #ETC
📌 When trading, pay attention to whether the candlestick patterns align
$GRAM / $HYPE / $ETC 30-minute short + 4-hour short signals aligned; multi-timeframe resonance turns bearish 🔥
════════════════════
🟢 $GRAM 30-minute short signal
⚠️Technical analysis: 4-hour bearish resonance confirmed | 30-minute entry: MACD death cross below zero, bearish momentum accelerating | EMA5 < EMA8 < EMA13, bearish alignment | KDJ death cross, short-term outlook bearish (K: 45.1, D: 45.9) | Volume surge (3.7x)
════════════════════
🟢 $HYPE 30-minute short signal
⚠️Technical analysis: 4-hour bearish resonance confirmed | 30-minute entry: MACD death cross below zero, bearish momentum accelerating | EMA5 < EMA8 < EMA13, bearish alignment | KDJ in weak territory, bears have the upper hand (K: 39.1, D: 44.5) | Increased volume (1.6x)
════════════════════
🟢 $ETC 30-minute short signal
⚠️Technical analysis: 4-hour bearish resonance confirmed | 30-minute entry: MACD DIF falls below the zero line, trend turns bearish | EMA5 crosses below EMA8, short-term outlook turns bearish | Volume surge (3.3x)
════════════════════
🔔 Follow for first-hand market movement alerts 🔔
#多周期共振 #GRAM #HYPE #ETC
📌 When trading, pay attention to whether the candlestick patterns align
════════════════════
🟢 $GRAM 30-minute short signal
⚠️Technical analysis: 4-hour bearish resonance confirmed | 30-minute entry: MACD death cross below zero, bearish momentum accelerating | EMA5 < EMA8 < EMA13, bearish alignment | KDJ death cross, short-term outlook bearish (K: 45.1, D: 45.9) | Volume surge (3.7x)
════════════════════
🟢 $HYPE 30-minute short signal
⚠️Technical analysis: 4-hour bearish resonance confirmed | 30-minute entry: MACD death cross below zero, bearish momentum accelerating | EMA5 < EMA8 < EMA13, bearish alignment | KDJ in weak territory, bears have the upper hand (K: 39.1, D: 44.5) | Increased volume (1.6x)
════════════════════
🟢 $ETC 30-minute short signal
⚠️Technical analysis: 4-hour bearish resonance confirmed | 30-minute entry: MACD DIF falls below the zero line, trend turns bearish | EMA5 crosses below EMA8, short-term outlook turns bearish | Volume surge (3.3x)
════════════════════
🔔 Follow for first-hand market movement alerts 🔔
#多周期共振 #GRAM #HYPE #ETC
📌 When trading, pay attention to whether the candlestick patterns align
7
·
--
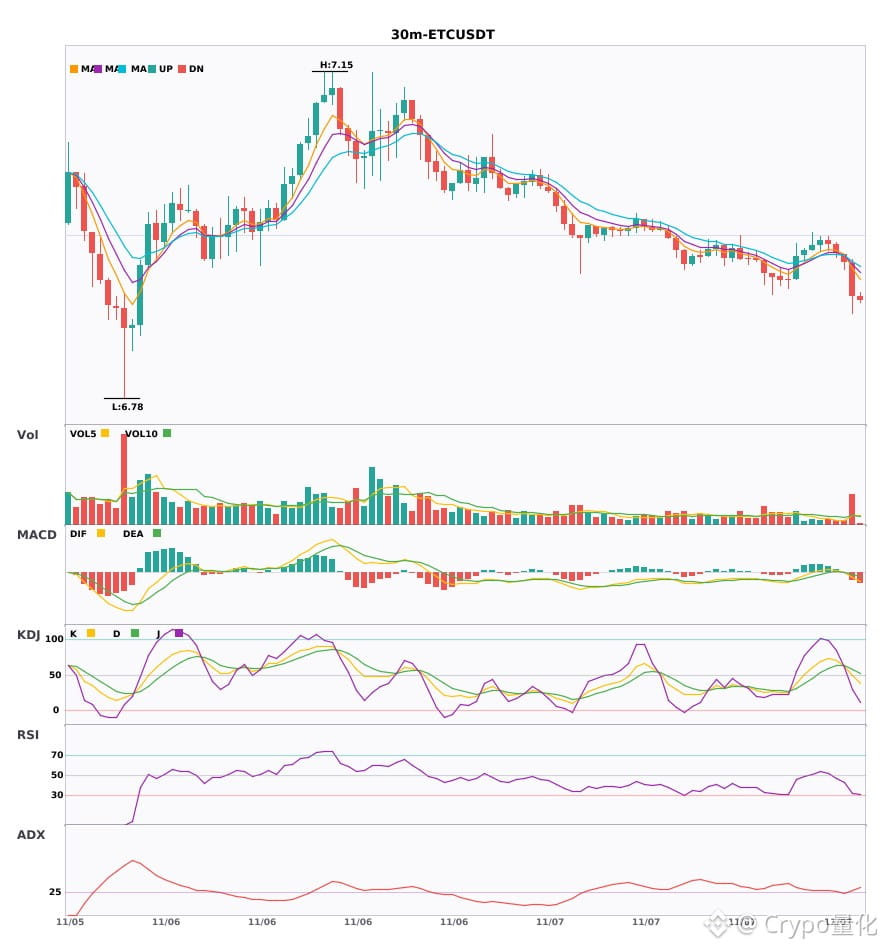
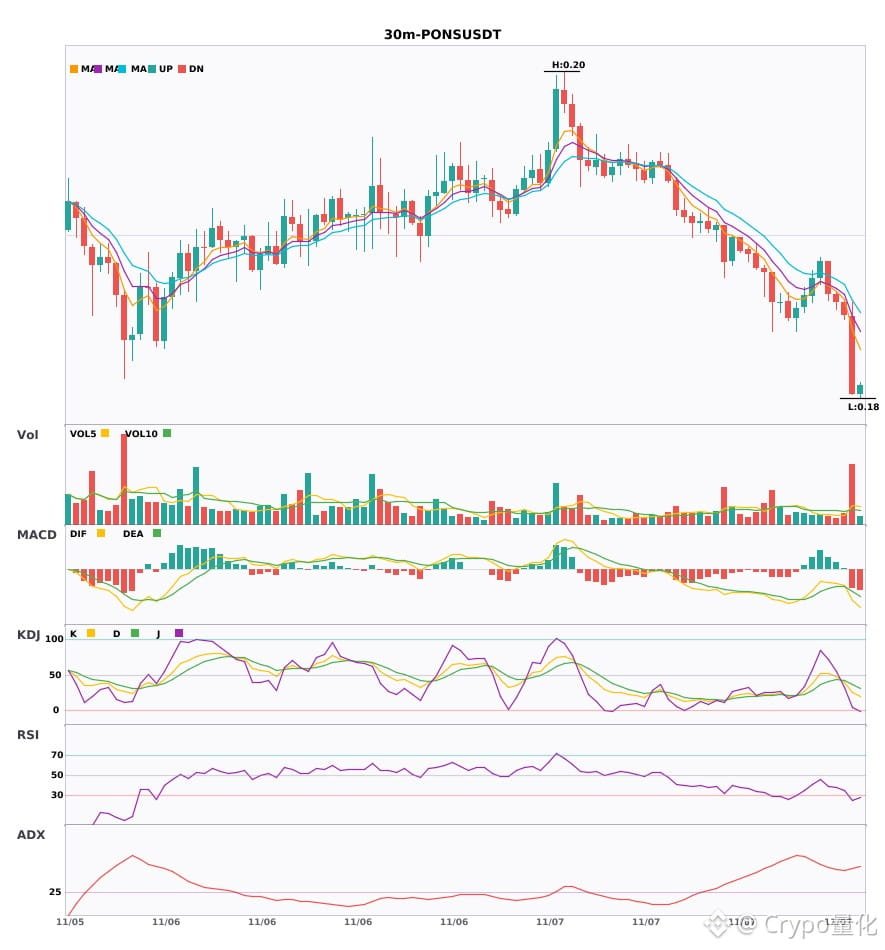
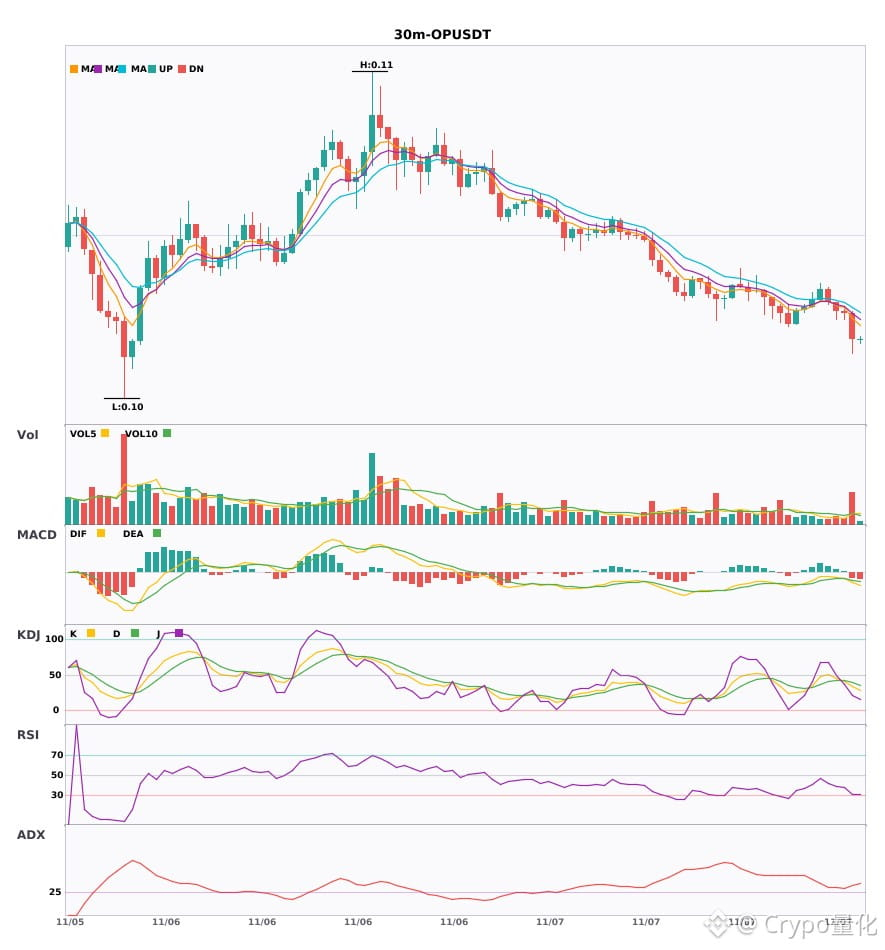
$ETC / $PONS / $OP 30-minute timeframe bearish, short-term under pressure 🔥
════════════════════
🟢 $ETC 30-minute bearish signal
⚠️Technical analysis: ADX(29) Trend is forming; opportunity to participate | MACD DIF falls below the zero line, trend turns bearish | EMA5 crosses below EMA8, short-term trend turns bearish | Volume surge (3.3x)
════════════════════
🟢 $PONS 30-minute bearish signal
⚠️Technical analysis: ADX(52) Very strong trend (beware of an overheated pullback) | MACD bearish crossover below zero, bearish momentum accelerating | EMA5 < EMA8 < EMA13, bearish alignment | KDJ trending weakly, bears in control (K: 25.9, D: 36.5) | Volume surge (3.8x)
════════════════════
🟢 $OP 30-minute bearish signal
⚠️Technical analysis: ADX(32) Clear trending market | MACD bearish crossover below zero, bearish momentum accelerating | EMA5 < EMA8 < EMA13, bearish alignment | KDJ trending weakly, bears in control (K: 33.3, D: 39.0) | Volume surge (2.8x)
════════════════════
🔔 Follow for first-hand market updates 🔔
#技术分析 #ETC #PONS #OP
📌 When trading, check whether the candlestick pattern confirms the signal
$ETC / $PONS / $OP 30-minute timeframe bearish, short-term under pressure 🔥
════════════════════
🟢 $ETC 30-minute bearish signal
⚠️Technical analysis: ADX(29) Trend is forming; opportunity to participate | MACD DIF falls below the zero line, trend turns bearish | EMA5 crosses below EMA8, short-term trend turns bearish | Volume surge (3.3x)
════════════════════
🟢 $PONS 30-minute bearish signal
⚠️Technical analysis: ADX(52) Very strong trend (beware of an overheated pullback) | MACD bearish crossover below zero, bearish momentum accelerating | EMA5 < EMA8 < EMA13, bearish alignment | KDJ trending weakly, bears in control (K: 25.9, D: 36.5) | Volume surge (3.8x)
════════════════════
🟢 $OP 30-minute bearish signal
⚠️Technical analysis: ADX(32) Clear trending market | MACD bearish crossover below zero, bearish momentum accelerating | EMA5 < EMA8 < EMA13, bearish alignment | KDJ trending weakly, bears in control (K: 33.3, D: 39.0) | Volume surge (2.8x)
════════════════════
🔔 Follow for first-hand market updates 🔔
#技术分析 #ETC #PONS #OP
📌 When trading, check whether the candlestick pattern confirms the signal
════════════════════
🟢 $ETC 30-minute bearish signal
⚠️Technical analysis: ADX(29) Trend is forming; opportunity to participate | MACD DIF falls below the zero line, trend turns bearish | EMA5 crosses below EMA8, short-term trend turns bearish | Volume surge (3.3x)
════════════════════
🟢 $PONS 30-minute bearish signal
⚠️Technical analysis: ADX(52) Very strong trend (beware of an overheated pullback) | MACD bearish crossover below zero, bearish momentum accelerating | EMA5 < EMA8 < EMA13, bearish alignment | KDJ trending weakly, bears in control (K: 25.9, D: 36.5) | Volume surge (3.8x)
════════════════════
🟢 $OP 30-minute bearish signal
⚠️Technical analysis: ADX(32) Clear trending market | MACD bearish crossover below zero, bearish momentum accelerating | EMA5 < EMA8 < EMA13, bearish alignment | KDJ trending weakly, bears in control (K: 33.3, D: 39.0) | Volume surge (2.8x)
════════════════════
🔔 Follow for first-hand market updates 🔔
#技术分析 #ETC #PONS #OP
📌 When trading, check whether the candlestick pattern confirms the signal
41


·
--
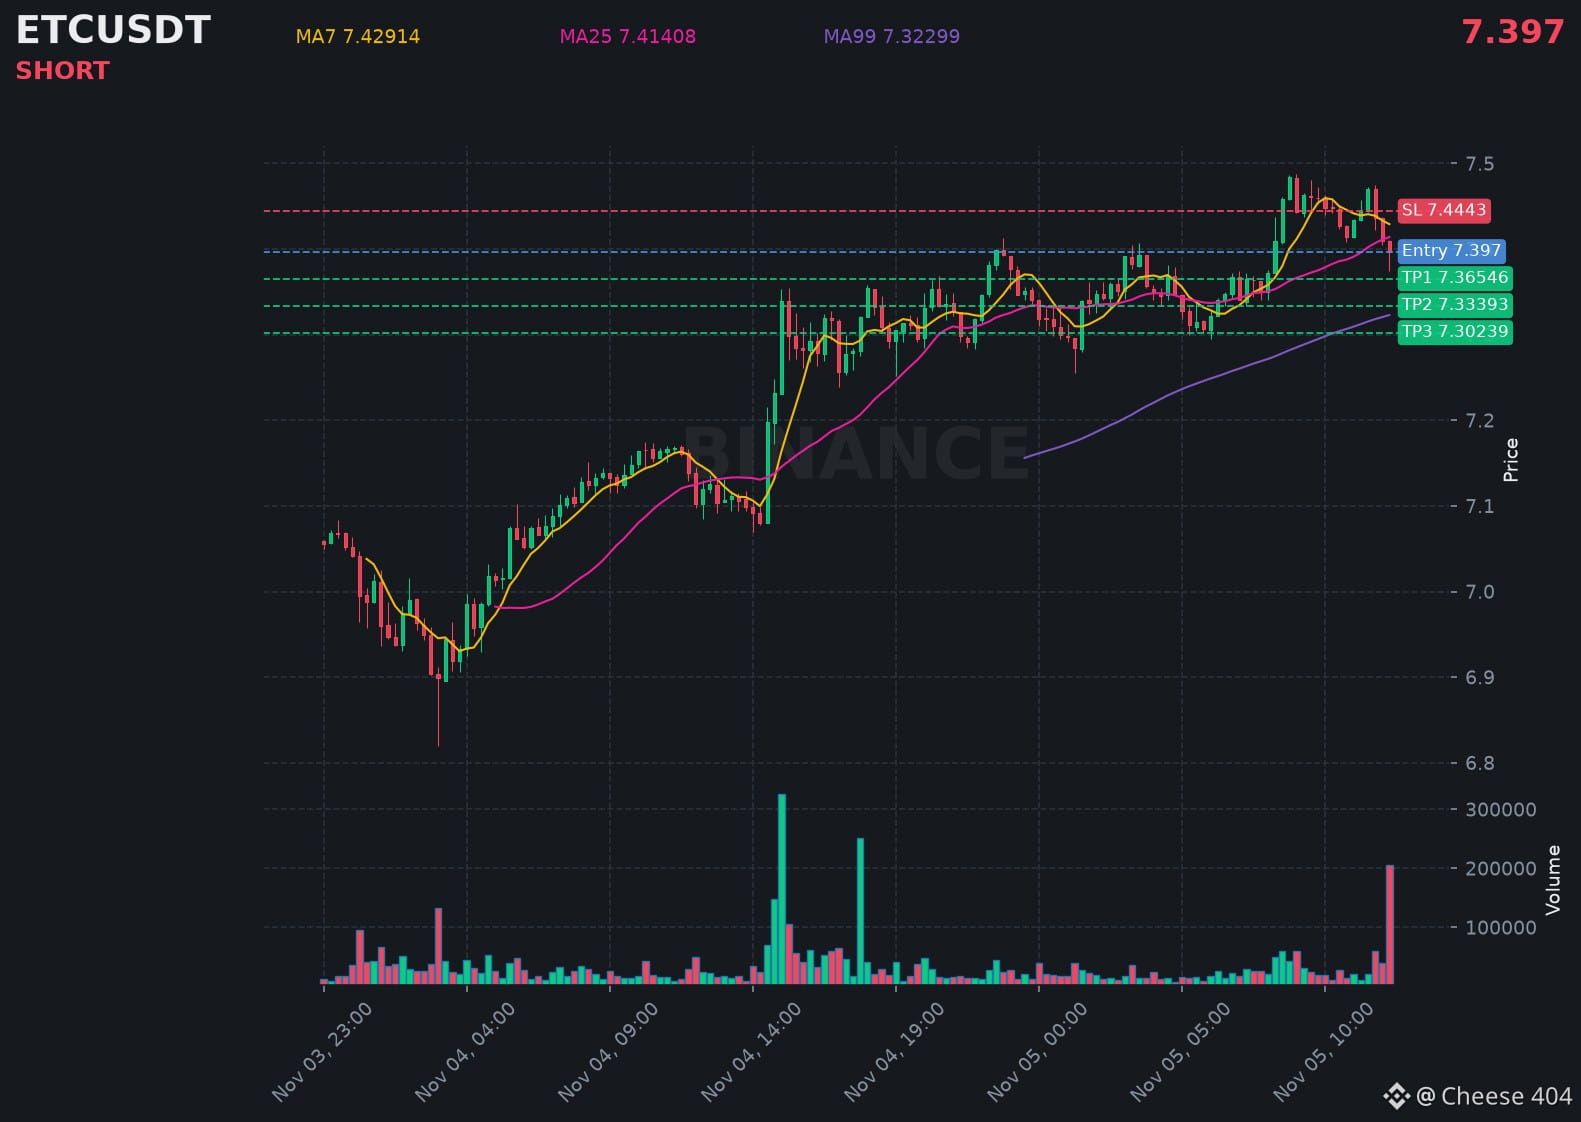
$ETC is struggling below resistance, hinting at another leg down in the coming hours.
📍 @ 7.397 | Volume: 1.52M USD
RSI 47 | EMA20: 7.41978 USD
📈 Trade Plan:
📈 Entry: 7.38754 – 7.40646
🛑 Stop Loss: 7.4443
🎯 TP1: 7.36546
🎯 TP2: 7.33393
🎯 TP3: 7.30239
Waiting for confirmation, then riding the downtrend.
👉 $ETC 👈 Catch it
#ETC
$ETC is struggling below resistance, hinting at another leg down in the coming hours.
📍 @ 7.397 | Volume: 1.52M USD
RSI 47 | EMA20: 7.41978 USD
📈 Trade Plan:
📈 Entry: 7.38754 – 7.40646
🛑 Stop Loss: 7.4443
🎯 TP1: 7.36546
🎯 TP2: 7.33393
🎯 TP3: 7.30239
Waiting for confirmation, then riding the downtrend.
👉 $ETC 👈 Catch it
#ETC
📍 @ 7.397 | Volume: 1.52M USD
RSI 47 | EMA20: 7.41978 USD
📈 Trade Plan:
📈 Entry: 7.38754 – 7.40646
🛑 Stop Loss: 7.4443
🎯 TP1: 7.36546
🎯 TP2: 7.33393
🎯 TP3: 7.30239
Waiting for confirmation, then riding the downtrend.
👉 $ETC 👈 Catch it
#ETC
63

·
--
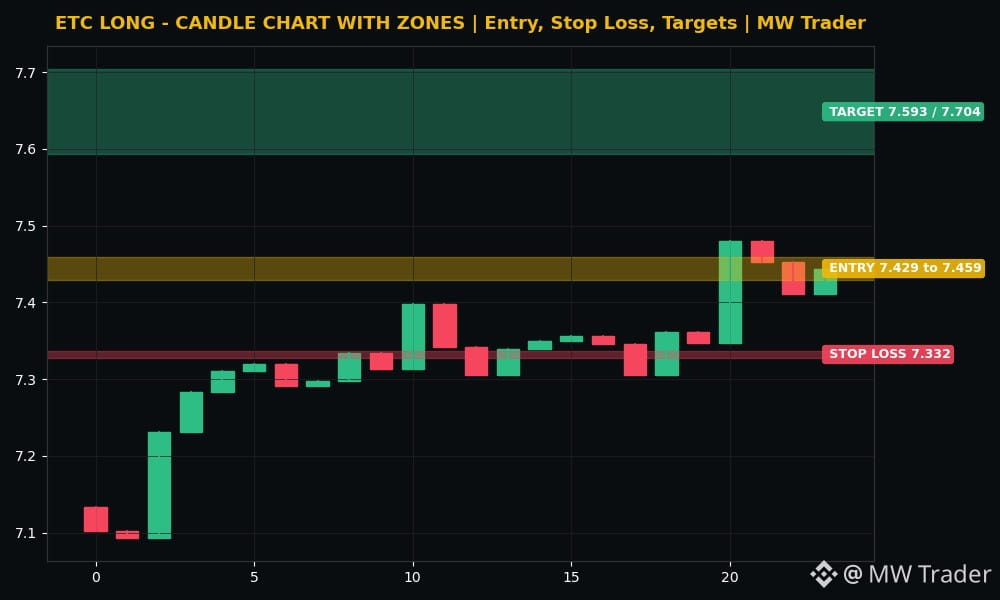
$ETC #ETC 🚀
Direction: LONG
Entry zone: 7.429 to 7.459
Stop loss: 7.332
Target 1: 7.593
Target 2: 7.704
Ethereum Classic is trading near 7.44 dollars, up 4.17 percent in 24 hours, inside a range of 7.07 to 7.48, and the recent closes show a push that held, 7.347, then 7.480, then 7.453, then 7.411, then 7.444. 📈 My reading is that ETC is one of the strongest coins in the evening batch, because it rose over 4 percent while sitting right under its 24 hour high instead of fading back toward 7.07. A long from the current zone, with a stop below 7.332, targets 7.593 first and then 7.704 if buyers push through the range high. A fall below 7.332 kills the idea without debate.
Futures trading is risky. Trade small, use a stop loss, and do your own research. This is my reading, not a guaranteed signal.
Does Ethereum Classic rise to 7.593 first, or fall below 7.332? 🤔
Follow for more trades.
#EthereumClassic #Crypto #FuturesTrading #TradingSignals
$ETC #ETC 🚀
Direction: LONG
Entry zone: 7.429 to 7.459
Stop loss: 7.332
Target 1: 7.593
Target 2: 7.704
Ethereum Classic is trading near 7.44 dollars, up 4.17 percent in 24 hours, inside a range of 7.07 to 7.48, and the recent closes show a push that held, 7.347, then 7.480, then 7.453, then 7.411, then 7.444. 📈 My reading is that ETC is one of the strongest coins in the evening batch, because it rose over 4 percent while sitting right under its 24 hour high instead of fading back toward 7.07. A long from the current zone, with a stop below 7.332, targets 7.593 first and then 7.704 if buyers push through the range high. A fall below 7.332 kills the idea without debate.
Futures trading is risky. Trade small, use a stop loss, and do your own research. This is my reading, not a guaranteed signal.
Does Ethereum Classic rise to 7.593 first, or fall below 7.332? 🤔
Follow for more trades.
#EthereumClassic #Crypto #FuturesTrading #TradingSignals
Direction: LONG
Entry zone: 7.429 to 7.459
Stop loss: 7.332
Target 1: 7.593
Target 2: 7.704
Ethereum Classic is trading near 7.44 dollars, up 4.17 percent in 24 hours, inside a range of 7.07 to 7.48, and the recent closes show a push that held, 7.347, then 7.480, then 7.453, then 7.411, then 7.444. 📈 My reading is that ETC is one of the strongest coins in the evening batch, because it rose over 4 percent while sitting right under its 24 hour high instead of fading back toward 7.07. A long from the current zone, with a stop below 7.332, targets 7.593 first and then 7.704 if buyers push through the range high. A fall below 7.332 kills the idea without debate.
Futures trading is risky. Trade small, use a stop loss, and do your own research. This is my reading, not a guaranteed signal.
Does Ethereum Classic rise to 7.593 first, or fall below 7.332? 🤔
Follow for more trades.
#EthereumClassic #Crypto #FuturesTrading #TradingSignals
9
·
--
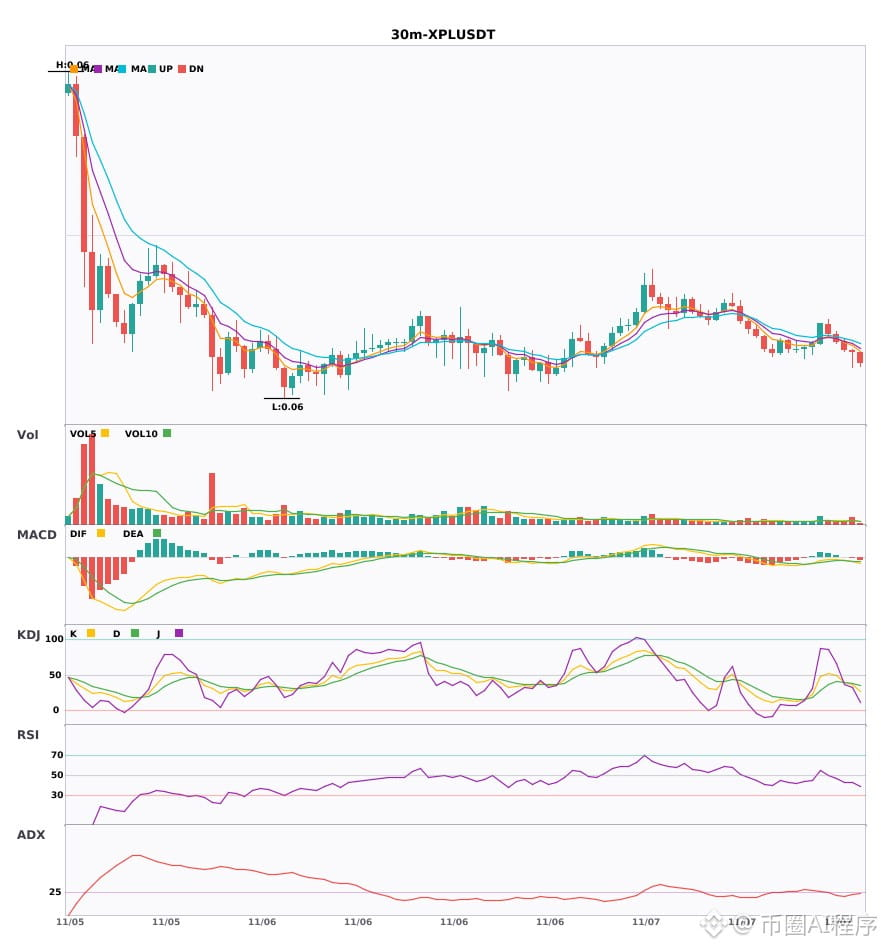
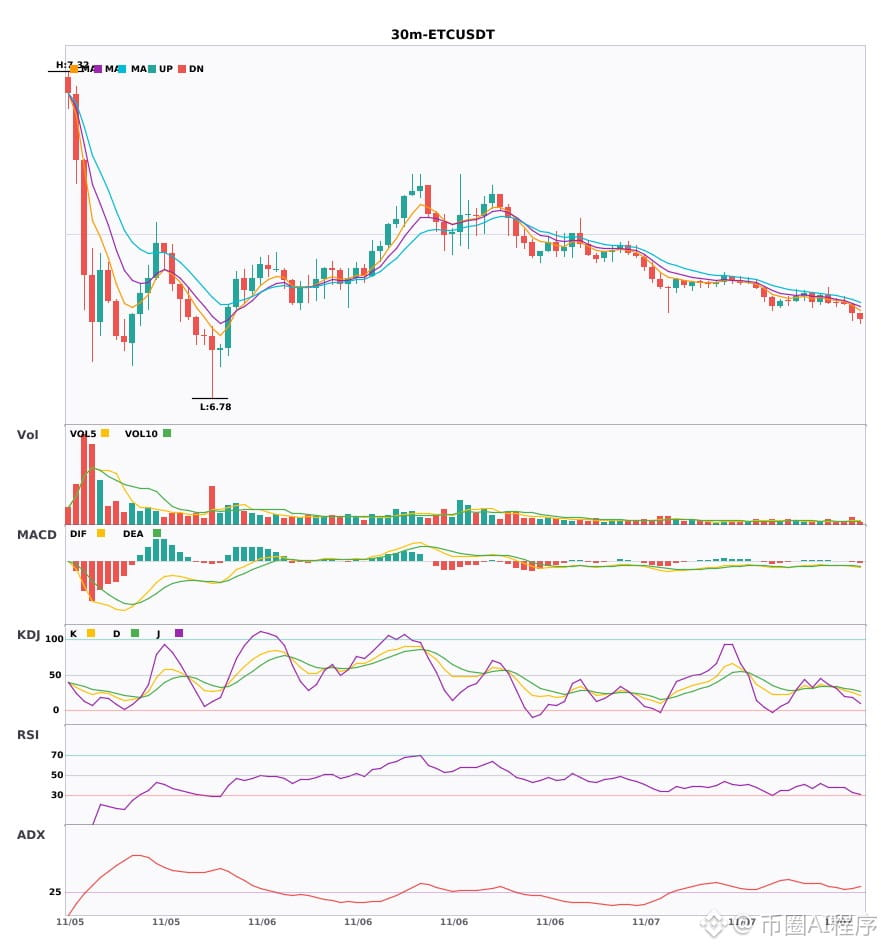
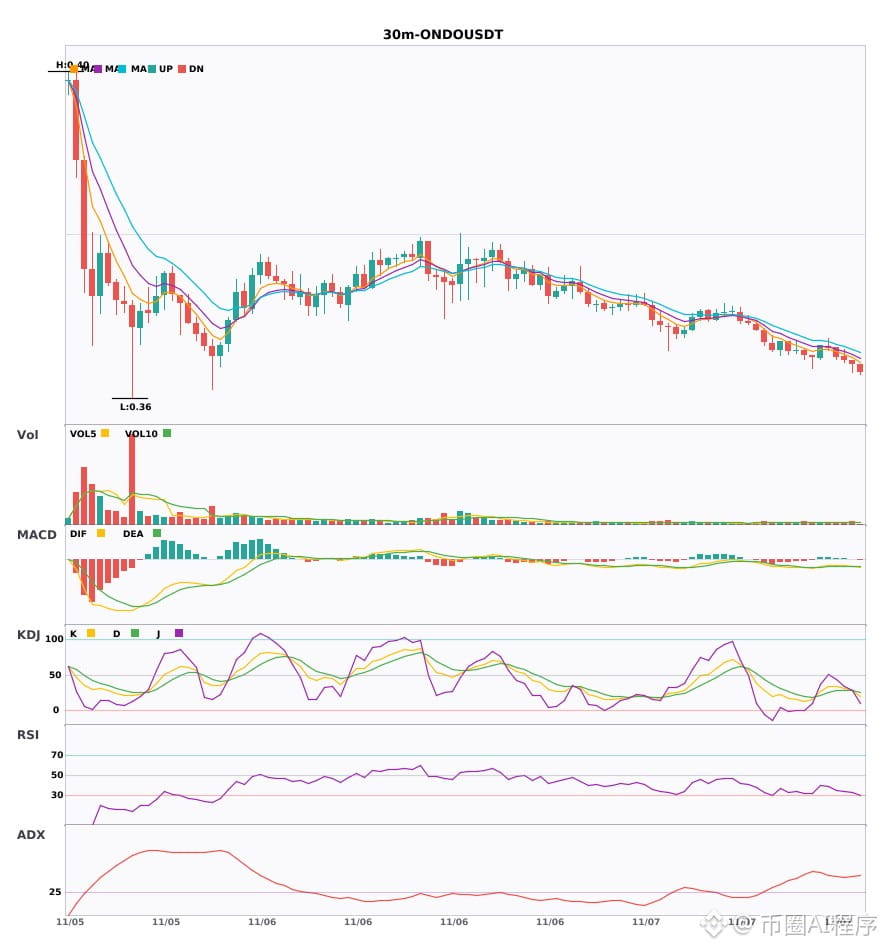
$XPL / $ETC / $ONDO 30-minute bearish signals, 4-hour bearish trend confirmed 🔥
════════════════════
🟢 $XPL 30-minute bearish signal
⚠️ Technical analysis: 4-hour bearish confluence confirmed | 30-minute entry: MACD bearish cross below zero, bearish momentum accelerating | EMA5 < EMA8 < EMA13, bearish alignment | KDJ weak, bears in control (K: 36.6, D: 38.8) | Volume increased (1.9x)
════════════════════
🟢 $ETC 30-minute bearish signal
⚠️ Technical analysis: 4-hour bearish confluence confirmed | 30-minute entry: MACD bearish cross below zero, bearish momentum accelerating | EMA5 < EMA8 < EMA13, bearish alignment | KDJ weak, bears in control (K: 25.7, D: 29.6) | Volume increased (2.0x)
════════════════════
🟢 $ONDO 30-minute bearish signal
⚠️ Technical analysis: 4-hour bearish confluence confirmed | 30-minute entry: MACD bearish cross below zero, bearish momentum accelerating | EMA5 < EMA8 < EMA13, bearish alignment | KDJ bearish crossover, short-term outlook bearish (K: 28.6, D: 28.8) | Volume normal (1.2x)
════════════════════
🔔 Follow for real-time market alerts 🔔
#多周期共振 #XPL #ETC #ONDO
📌 When trading, pay attention to whether the candlestick pattern confirms the signal
$XPL / $ETC / $ONDO 30-minute bearish signals, 4-hour bearish trend confirmed 🔥
════════════════════
🟢 $XPL 30-minute bearish signal
⚠️ Technical analysis: 4-hour bearish confluence confirmed | 30-minute entry: MACD bearish cross below zero, bearish momentum accelerating | EMA5 < EMA8 < EMA13, bearish alignment | KDJ weak, bears in control (K: 36.6, D: 38.8) | Volume increased (1.9x)
════════════════════
🟢 $ETC 30-minute bearish signal
⚠️ Technical analysis: 4-hour bearish confluence confirmed | 30-minute entry: MACD bearish cross below zero, bearish momentum accelerating | EMA5 < EMA8 < EMA13, bearish alignment | KDJ weak, bears in control (K: 25.7, D: 29.6) | Volume increased (2.0x)
════════════════════
🟢 $ONDO 30-minute bearish signal
⚠️ Technical analysis: 4-hour bearish confluence confirmed | 30-minute entry: MACD bearish cross below zero, bearish momentum accelerating | EMA5 < EMA8 < EMA13, bearish alignment | KDJ bearish crossover, short-term outlook bearish (K: 28.6, D: 28.8) | Volume normal (1.2x)
════════════════════
🔔 Follow for real-time market alerts 🔔
#多周期共振 #XPL #ETC #ONDO
📌 When trading, pay attention to whether the candlestick pattern confirms the signal
════════════════════
🟢 $XPL 30-minute bearish signal
⚠️ Technical analysis: 4-hour bearish confluence confirmed | 30-minute entry: MACD bearish cross below zero, bearish momentum accelerating | EMA5 < EMA8 < EMA13, bearish alignment | KDJ weak, bears in control (K: 36.6, D: 38.8) | Volume increased (1.9x)
════════════════════
🟢 $ETC 30-minute bearish signal
⚠️ Technical analysis: 4-hour bearish confluence confirmed | 30-minute entry: MACD bearish cross below zero, bearish momentum accelerating | EMA5 < EMA8 < EMA13, bearish alignment | KDJ weak, bears in control (K: 25.7, D: 29.6) | Volume increased (2.0x)
════════════════════
🟢 $ONDO 30-minute bearish signal
⚠️ Technical analysis: 4-hour bearish confluence confirmed | 30-minute entry: MACD bearish cross below zero, bearish momentum accelerating | EMA5 < EMA8 < EMA13, bearish alignment | KDJ bearish crossover, short-term outlook bearish (K: 28.6, D: 28.8) | Volume normal (1.2x)
════════════════════
🔔 Follow for real-time market alerts 🔔
#多周期共振 #XPL #ETC #ONDO
📌 When trading, pay attention to whether the candlestick pattern confirms the signal
12
·
--
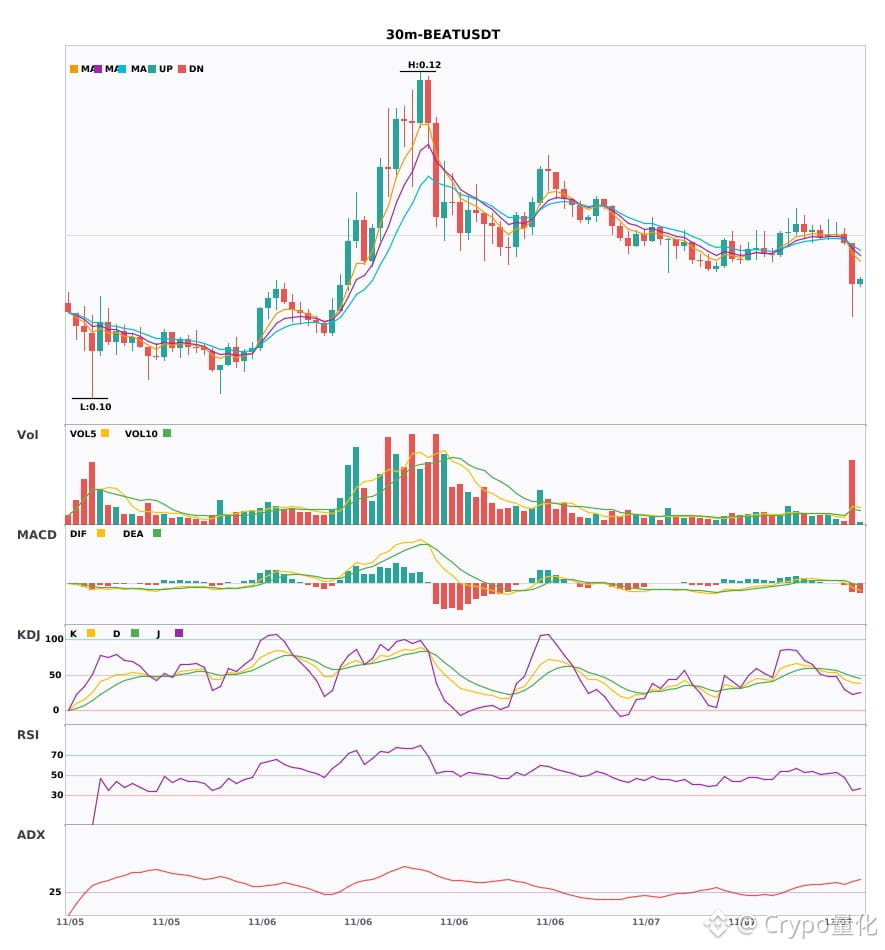
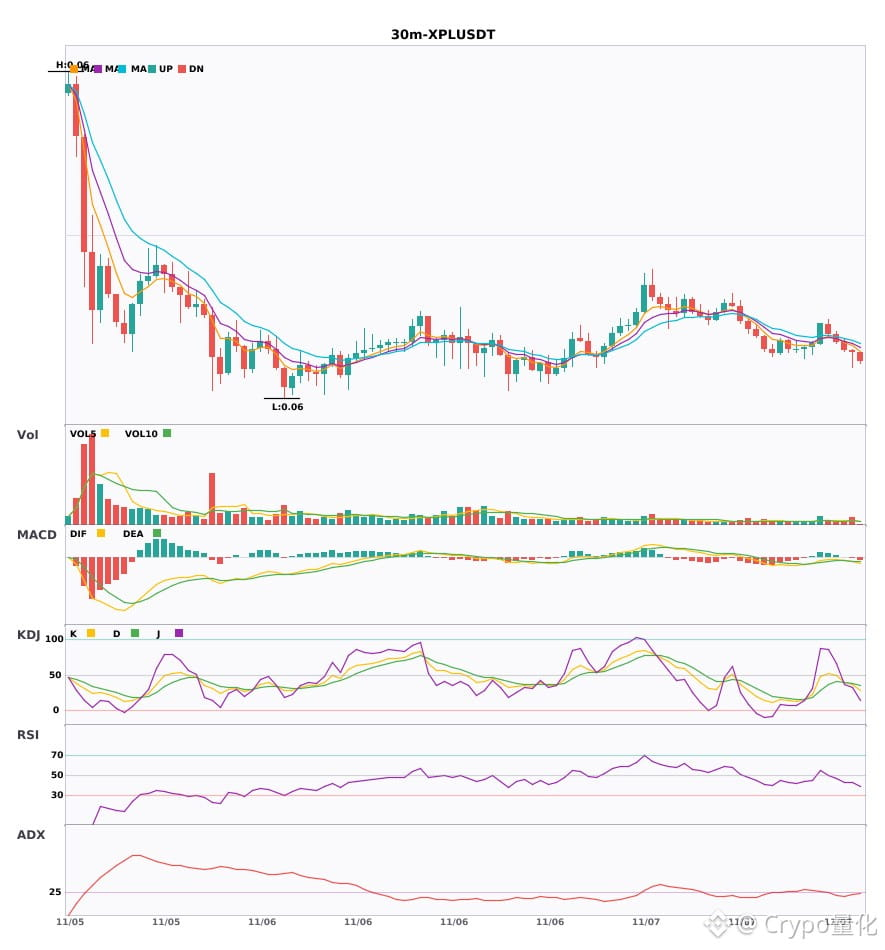
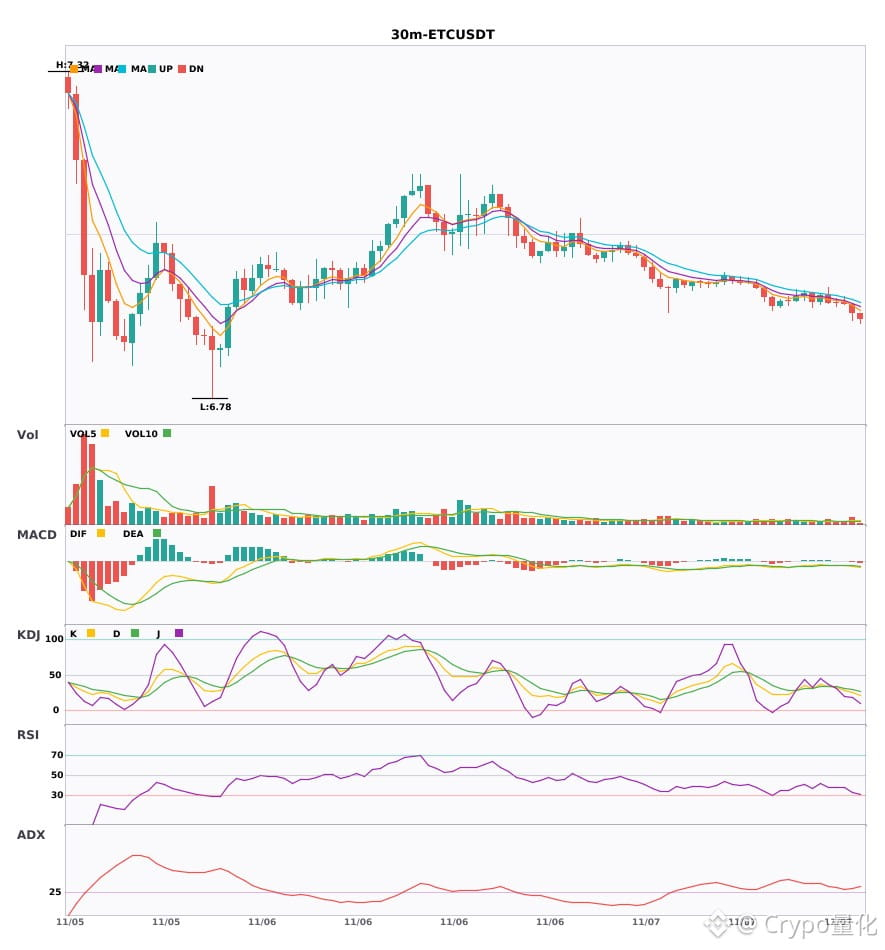
$BEAT / $XPL / $ETC 30-minute technical indicators are weakening in sync; watch out for risk 🔥
════════════════════
🟢 $BEAT 30-minute bearish signal
⚠️Technical analysis: ADX(41): strong trending market | MACD DIF falls below the zero line, turning the trend bearish | EMA5 crosses below EMA8, turning bearish in the short term | KDJ is weak, with bears in control (K: 39.5, D: 47.8) | Volume surge (4.3x)
════════════════════
🟢 $XPL 30-minute bearish signal
⚠️Technical analysis: ADX(25): trend is forming; entry is possible | MACD bearish crossover below zero, accelerating bearish momentum | EMA5 < EMA8 < EMA13: bearish alignment | KDJ is weak, with bears in control (K: 36.6, D: 38.8) | Volume increase (1.9x)
════════════════════
🟢 $ETC 30-minute bearish signal
⚠️Technical analysis: ADX(28): trend is forming; entry is possible | MACD bearish crossover below zero, accelerating bearish momentum | EMA5 < EMA8 < EMA13: bearish alignment | KDJ is weak, with bears in control (K: 25.7, D: 29.6) | Volume increase (2.0x)
════════════════════
🔔 Follow for first-hand market alerts 🔔
#技术分析 #BEAT #XPL #ETC
📌 When trading, check whether the candlestick pattern meets the criteria
$BEAT / $XPL / $ETC 30-minute technical indicators are weakening in sync; watch out for risk 🔥
════════════════════
🟢 $BEAT 30-minute bearish signal
⚠️Technical analysis: ADX(41): strong trending market | MACD DIF falls below the zero line, turning the trend bearish | EMA5 crosses below EMA8, turning bearish in the short term | KDJ is weak, with bears in control (K: 39.5, D: 47.8) | Volume surge (4.3x)
════════════════════
🟢 $XPL 30-minute bearish signal
⚠️Technical analysis: ADX(25): trend is forming; entry is possible | MACD bearish crossover below zero, accelerating bearish momentum | EMA5 < EMA8 < EMA13: bearish alignment | KDJ is weak, with bears in control (K: 36.6, D: 38.8) | Volume increase (1.9x)
════════════════════
🟢 $ETC 30-minute bearish signal
⚠️Technical analysis: ADX(28): trend is forming; entry is possible | MACD bearish crossover below zero, accelerating bearish momentum | EMA5 < EMA8 < EMA13: bearish alignment | KDJ is weak, with bears in control (K: 25.7, D: 29.6) | Volume increase (2.0x)
════════════════════
🔔 Follow for first-hand market alerts 🔔
#技术分析 #BEAT #XPL #ETC
📌 When trading, check whether the candlestick pattern meets the criteria
════════════════════
🟢 $BEAT 30-minute bearish signal
⚠️Technical analysis: ADX(41): strong trending market | MACD DIF falls below the zero line, turning the trend bearish | EMA5 crosses below EMA8, turning bearish in the short term | KDJ is weak, with bears in control (K: 39.5, D: 47.8) | Volume surge (4.3x)
════════════════════
🟢 $XPL 30-minute bearish signal
⚠️Technical analysis: ADX(25): trend is forming; entry is possible | MACD bearish crossover below zero, accelerating bearish momentum | EMA5 < EMA8 < EMA13: bearish alignment | KDJ is weak, with bears in control (K: 36.6, D: 38.8) | Volume increase (1.9x)
════════════════════
🟢 $ETC 30-minute bearish signal
⚠️Technical analysis: ADX(28): trend is forming; entry is possible | MACD bearish crossover below zero, accelerating bearish momentum | EMA5 < EMA8 < EMA13: bearish alignment | KDJ is weak, with bears in control (K: 25.7, D: 29.6) | Volume increase (2.0x)
════════════════════
🔔 Follow for first-hand market alerts 🔔
#技术分析 #BEAT #XPL #ETC
📌 When trading, check whether the candlestick pattern meets the criteria
9

·
--
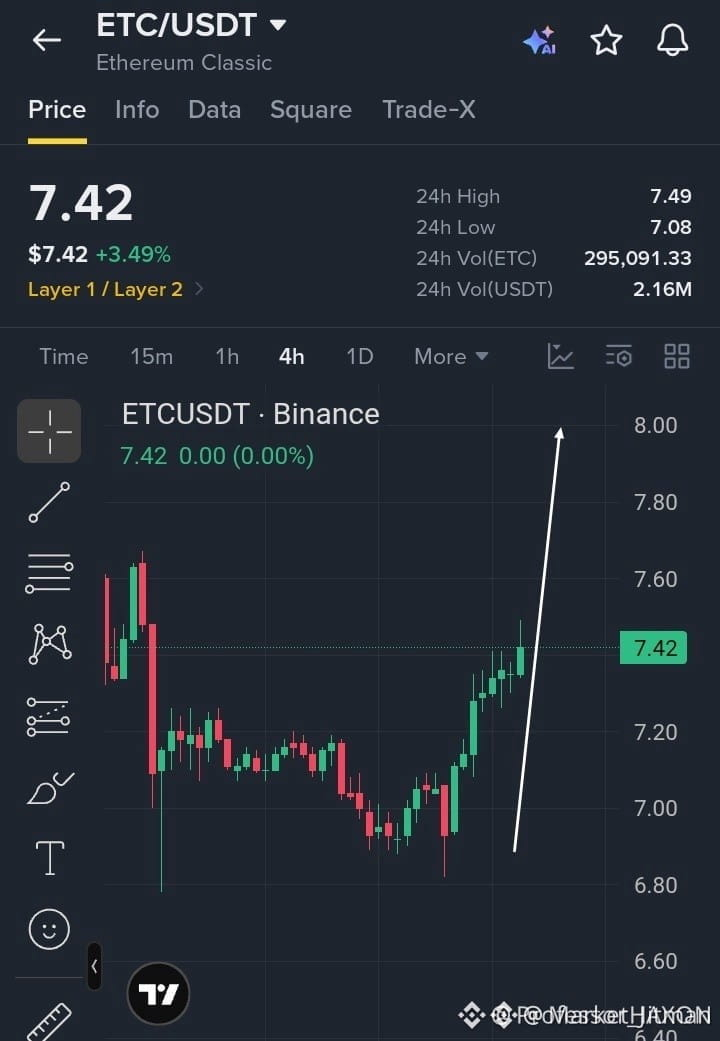
🚀 $ETC CHARGING TOWARD $8 RESISTANCE BREAKOUT! 🟢
Entry: 7.35-7.43 ⚡
Target: 7.60 🚀
Target: 7.80 🚀
Target: 8.00 🚀
Stop Loss: 7.18 ⚠️
📊 The 4H chart is stamping higher lows, a classic smart‑money signature that’s flushing out weak sellers. 🦈 Every push toward 7.50 tightens the liquidity pool, setting the stage for a clean break. ⚡ If the bulls lock above that line, the path to 7.80‑8.00 lights up, with the 7.18 zone acting as the hard stop. 📌 The risk‑to‑reward ratio looks crisp for a disciplined long.
💬 Are you ready to ride the wave or wait for the next liquidity trap? 👇
⚠️ Not financial advice. Always manage your risk. 🛡️
🏷️ #ETC #LongSetup #BullishBreakout #Crypto
🔥 💎
🚀 $ETC CHARGING TOWARD $8 RESISTANCE BREAKOUT! 🟢
Entry: 7.35-7.43 ⚡
Target: 7.60 🚀
Target: 7.80 🚀
Target: 8.00 🚀
Stop Loss: 7.18 ⚠️
📊 The 4H chart is stamping higher lows, a classic smart‑money signature that’s flushing out weak sellers. 🦈 Every push toward 7.50 tightens the liquidity pool, setting the stage for a clean break. ⚡ If the bulls lock above that line, the path to 7.80‑8.00 lights up, with the 7.18 zone acting as the hard stop. 📌 The risk‑to‑reward ratio looks crisp for a disciplined long.
💬 Are you ready to ride the wave or wait for the next liquidity trap? 👇
⚠️ Not financial advice. Always manage your risk. 🛡️
🏷️ #ETC #LongSetup #BullishBreakout #Crypto
🔥 💎
Entry: 7.35-7.43 ⚡
Target: 7.60 🚀
Target: 7.80 🚀
Target: 8.00 🚀
Stop Loss: 7.18 ⚠️
📊 The 4H chart is stamping higher lows, a classic smart‑money signature that’s flushing out weak sellers. 🦈 Every push toward 7.50 tightens the liquidity pool, setting the stage for a clean break. ⚡ If the bulls lock above that line, the path to 7.80‑8.00 lights up, with the 7.18 zone acting as the hard stop. 📌 The risk‑to‑reward ratio looks crisp for a disciplined long.
💬 Are you ready to ride the wave or wait for the next liquidity trap? 👇
⚠️ Not financial advice. Always manage your risk. 🛡️
🏷️ #ETC #LongSetup #BullishBreakout #Crypto
🔥 💎
10

·
--
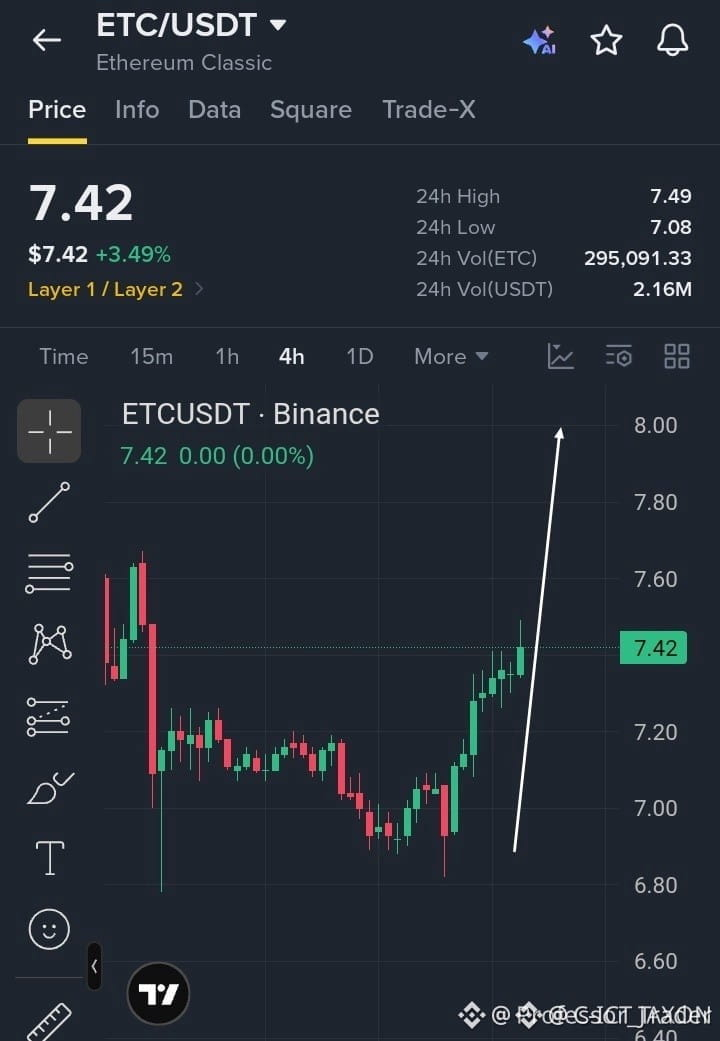
🚀 $ETC RACES TOWARD $8 RESISTANCE BREAKOUT! 🦈
Entry: 7.35-7.43 ⚡
Target: 8.00 🚀
Stop Loss: 7.18 ⚠️
Higher lows on the 4H are stitching a clean bullish staircase, and the 7.50 barrier now acts as a liquidity springboard. 📊 The order block around 7.35‑7.43 has already absorbed sell pressure three times, signaling institutional accumulation. 🦈
A decisive close above 7.50 could trigger a cascade toward the $8.00 resistance cluster, where smart money often plants the next liquidity trap. ⚡ Keep an eye on volume expansion as the catalyst for the next wave. 💬 Are you ready to ride the ETC ascent or waiting for the next pullback? 👇
⚠️ Not financial advice. Always manage your risk. 🛡️
🏷️ #ETC #LongSetup #Breakout #Crypto
🔥 💎
🚀 $ETC RACES TOWARD $8 RESISTANCE BREAKOUT! 🦈
Entry: 7.35-7.43 ⚡
Target: 8.00 🚀
Stop Loss: 7.18 ⚠️
Higher lows on the 4H are stitching a clean bullish staircase, and the 7.50 barrier now acts as a liquidity springboard. 📊 The order block around 7.35‑7.43 has already absorbed sell pressure three times, signaling institutional accumulation. 🦈
A decisive close above 7.50 could trigger a cascade toward the $8.00 resistance cluster, where smart money often plants the next liquidity trap. ⚡ Keep an eye on volume expansion as the catalyst for the next wave. 💬 Are you ready to ride the ETC ascent or waiting for the next pullback? 👇
⚠️ Not financial advice. Always manage your risk. 🛡️
🏷️ #ETC #LongSetup #Breakout #Crypto
🔥 💎
Entry: 7.35-7.43 ⚡
Target: 8.00 🚀
Stop Loss: 7.18 ⚠️
Higher lows on the 4H are stitching a clean bullish staircase, and the 7.50 barrier now acts as a liquidity springboard. 📊 The order block around 7.35‑7.43 has already absorbed sell pressure three times, signaling institutional accumulation. 🦈
A decisive close above 7.50 could trigger a cascade toward the $8.00 resistance cluster, where smart money often plants the next liquidity trap. ⚡ Keep an eye on volume expansion as the catalyst for the next wave. 💬 Are you ready to ride the ETC ascent or waiting for the next pullback? 👇
⚠️ Not financial advice. Always manage your risk. 🛡️
🏷️ #ETC #LongSetup #Breakout #Crypto
🔥 💎
11
Log in to explore more content
Join global crypto users on Binance Square
⚡️ Get latest and useful information about crypto.
💬 Trusted by the world’s largest crypto exchange.
👍 Discover real insights from verified creators.
Email / Phone number
Trending Topics
1
#BinanceReopensWithdrawalsForHYPE&APT
84,988 views
979 Discussing
2
#SouthKoreaDraftLawTargets15To20%ShareholderCap
86,036 views
643 Discussing
3
#TradFiForBeginners
182,538 views
1,848 Discussing
4
#KeplrAdvisesSocialLoginUsersToTransferAssets
46,489 views
516 Discussing
5
#TetherPlans€28.8MForJuventusCapitalIncrease
33,478 views
400 Discussing
6
#JobsReportRaisesHikeOdds
864,208 views
4,452 Discussing
7
#CPITestsDecemberRateOutlook
351,481 views
1,892 Discussing
8
#US Data Center Rules May Constrain AI Expansion
130,644 views
259 Discussing
9
#ARKPlans14ThematicETFsCoveringAIAndTokenizedMarkets
9,562 views
90 Discussing
10
#WillAnthropicListOnTime
273,346 views
1,883 Discussing