
#crcl
crcl
765,328 views
3,734 Discussing
Hot
Latest

·
--
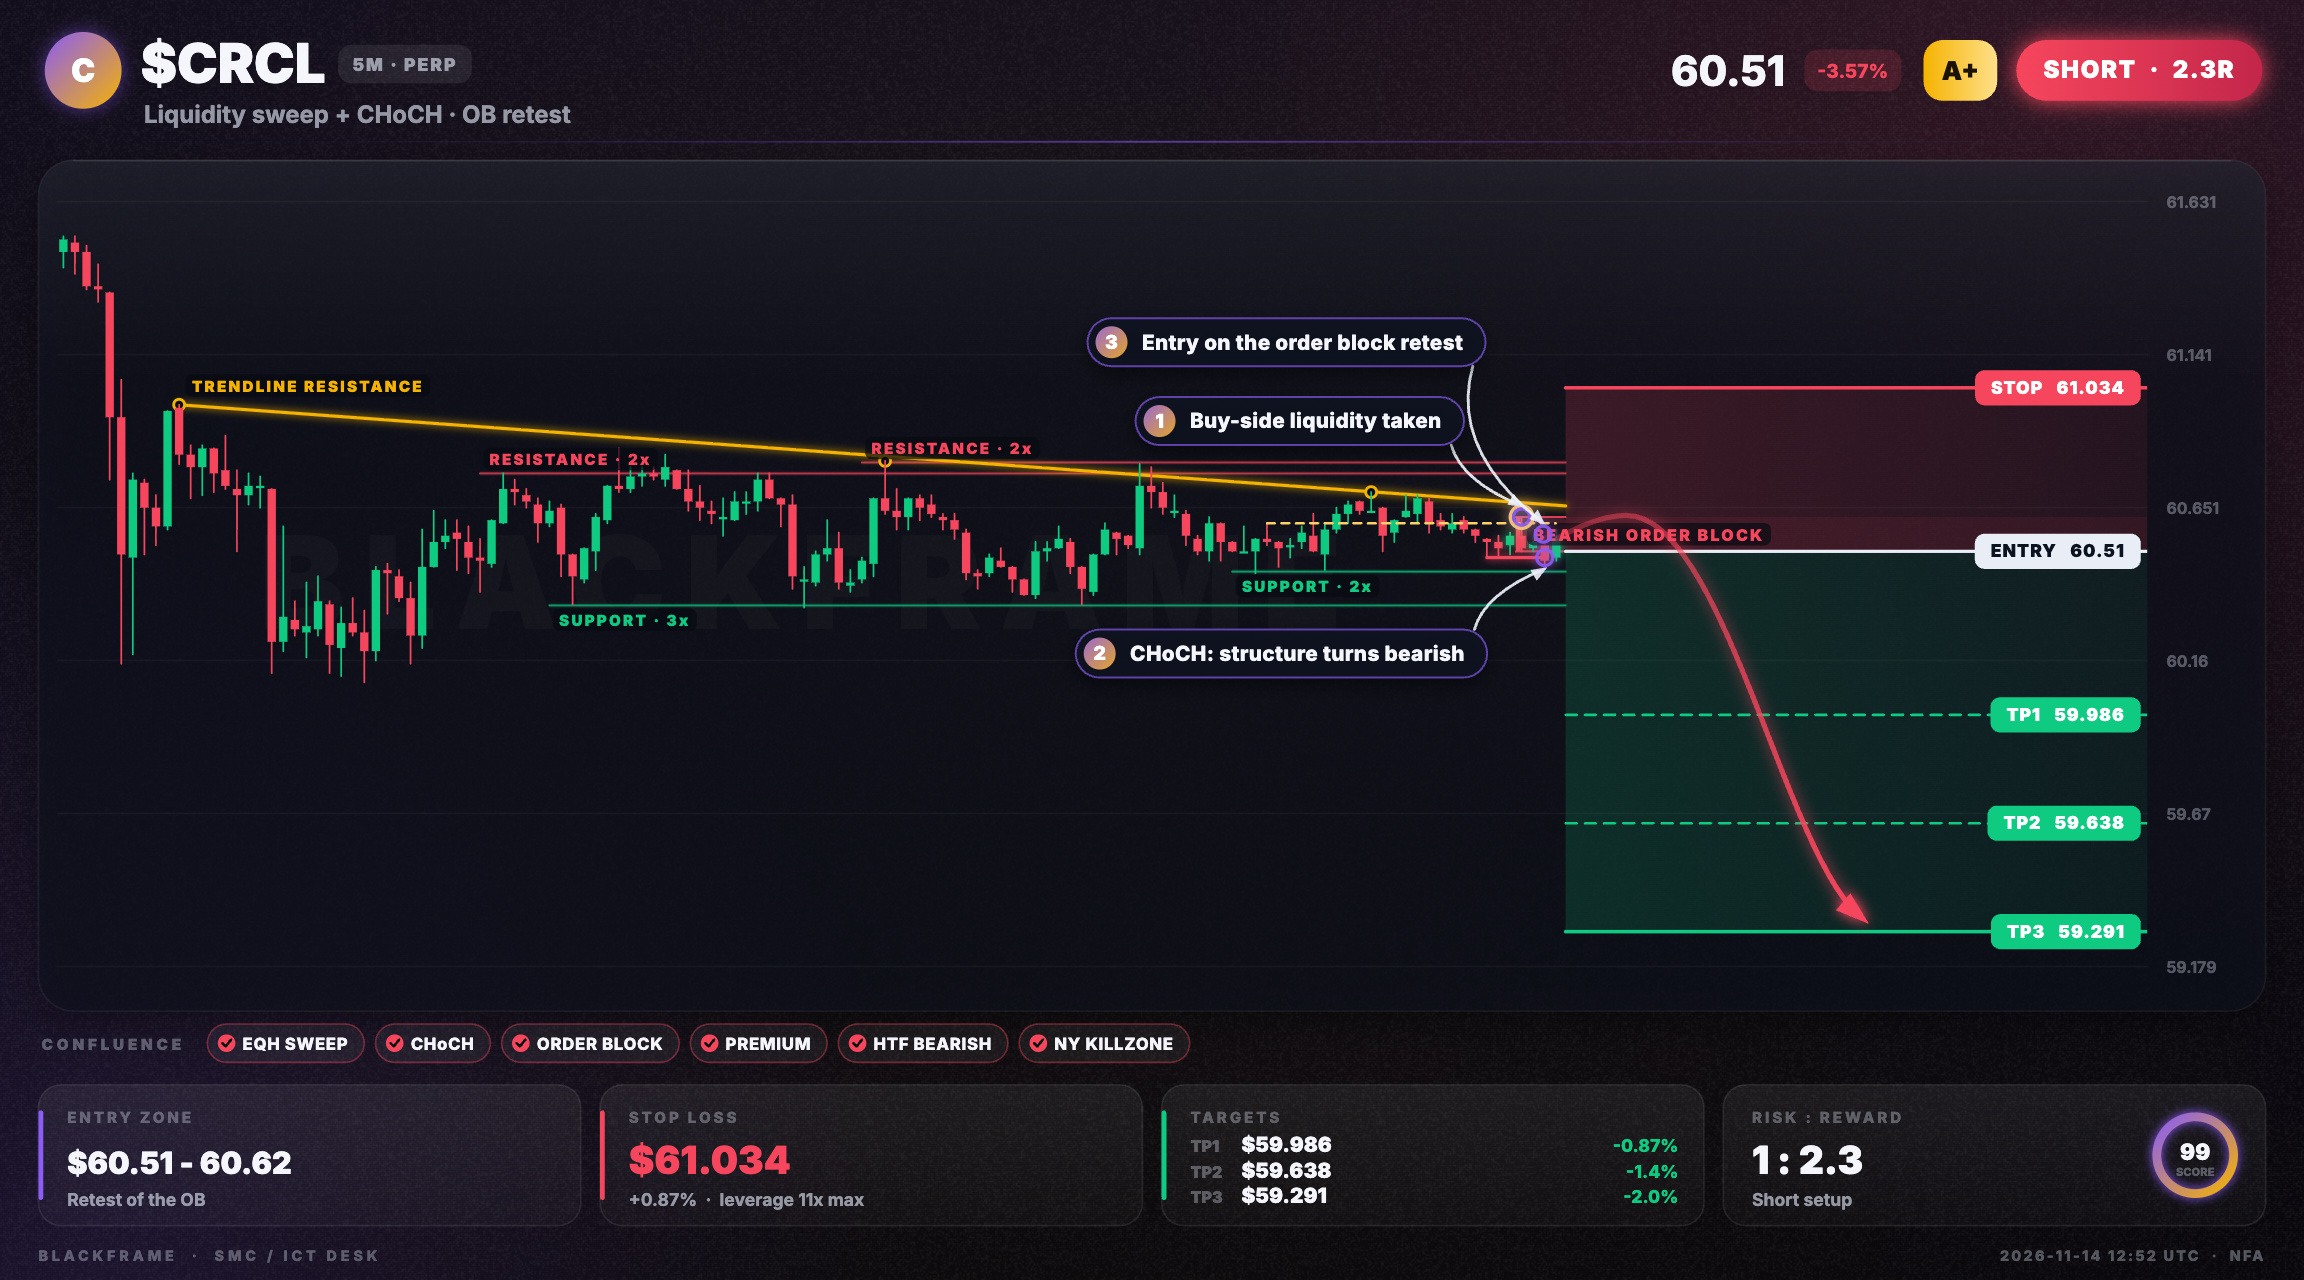
🧲 Buy-side taken on $CRCL. Structure just flipped down
SHORT · 5M
Entry: $60.51
TP1: $59.986
TP2: $59.638
TP3: $59.291
SL: $61.034
Buy-side liquidity above the equal highs was swept and price closed back inside. Structure then flipped bearish with a CHoCH on the 5M. Entry is the first retest of the fresh bearish order block in premium, targeting sell-side liquidity below.
#CRCL #TradingSignals · NFA
🧲 Buy-side taken on $CRCL . Structure just flipped down
SHORT · 5M
Entry: $60.51
TP1: $59.986
TP2: $59.638
TP3: $59.291
SL: $61.034
Buy-side liquidity above the equal highs was swept and price closed back inside. Structure then flipped bearish with a CHoCH on the 5M. Entry is the first retest of the fresh bearish order block in premium, targeting sell-side liquidity below.
#CRCL #TradingSignals · NFA
SHORT · 5M
Entry: $60.51
TP1: $59.986
TP2: $59.638
TP3: $59.291
SL: $61.034
Buy-side liquidity above the equal highs was swept and price closed back inside. Structure then flipped bearish with a CHoCH on the 5M. Entry is the first retest of the fresh bearish order block in premium, targeting sell-side liquidity below.
#CRCL #TradingSignals · NFA
57


·
--
I've been bearish lately and haven't told everyone to buy the dip. Today, the market is close to dropping to 60,000, so you can buy some undervalued coins. You can buy some CRCL, currently around 56U. You can open a 1x contract—it's just like buying spot!#CRCL
I've been bearish lately and haven't told everyone to buy the dip. Today, the market is close to dropping to 60,000, so you can buy some undervalued coins. You can buy some CRCL, currently around 56U. You can open a 1x contract—it's just like buying spot!#CRCL
Bnb shanshan:
你这种人就是说废话,谁不知道可以抄一些,叫人抄就算了,合约还推荐人开一倍,尽说废话
2
1
1.7k

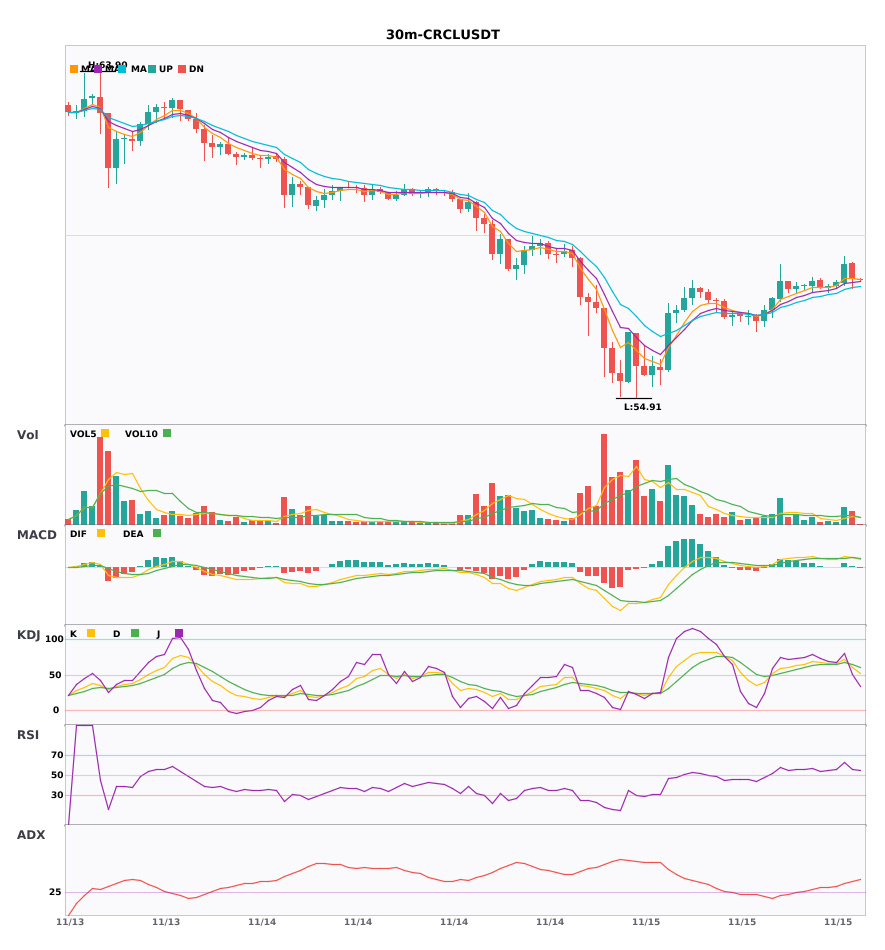
$CRCL 30-minute period triggered a bullish buy signal
📈 $CRCL | 30-minute bullish signal
━━━━━━━━━━━━━━━━━━
Technical analysis: ADX(40) indicates a significant trend, MACD golden cross above zero releases bullish momentum, EMA5>EMA8>EMA13 shows bullish alignment, KDJ is strong (K71.4 D67.4), and trading volume has increased 1.9-fold.
Price change: 0.8800%
━━━━━━━━━━━━━━━━━━
#技术分析 #CRCL
📌 The above content is for reference only and does not constitute investment advice
$CRCL 30-minute period triggered a bullish buy signal
📈 $CRCL | 30-minute bullish signal
━━━━━━━━━━━━━━━━━━
Technical analysis: ADX(40) indicates a significant trend, MACD golden cross above zero releases bullish momentum, EMA5>EMA8>EMA13 shows bullish alignment, KDJ is strong (K71.4 D67.4), and trading volume has increased 1.9-fold.
Price change: 0.8800%
━━━━━━━━━━━━━━━━━━
#技术分析 #CRCL
📌 The above content is for reference only and does not constitute investment advice
📈 $CRCL | 30-minute bullish signal
━━━━━━━━━━━━━━━━━━
Technical analysis: ADX(40) indicates a significant trend, MACD golden cross above zero releases bullish momentum, EMA5>EMA8>EMA13 shows bullish alignment, KDJ is strong (K71.4 D67.4), and trading volume has increased 1.9-fold.
Price change: 0.8800%
━━━━━━━━━━━━━━━━━━
#技术分析 #CRCL
📌 The above content is for reference only and does not constitute investment advice
21
·
--
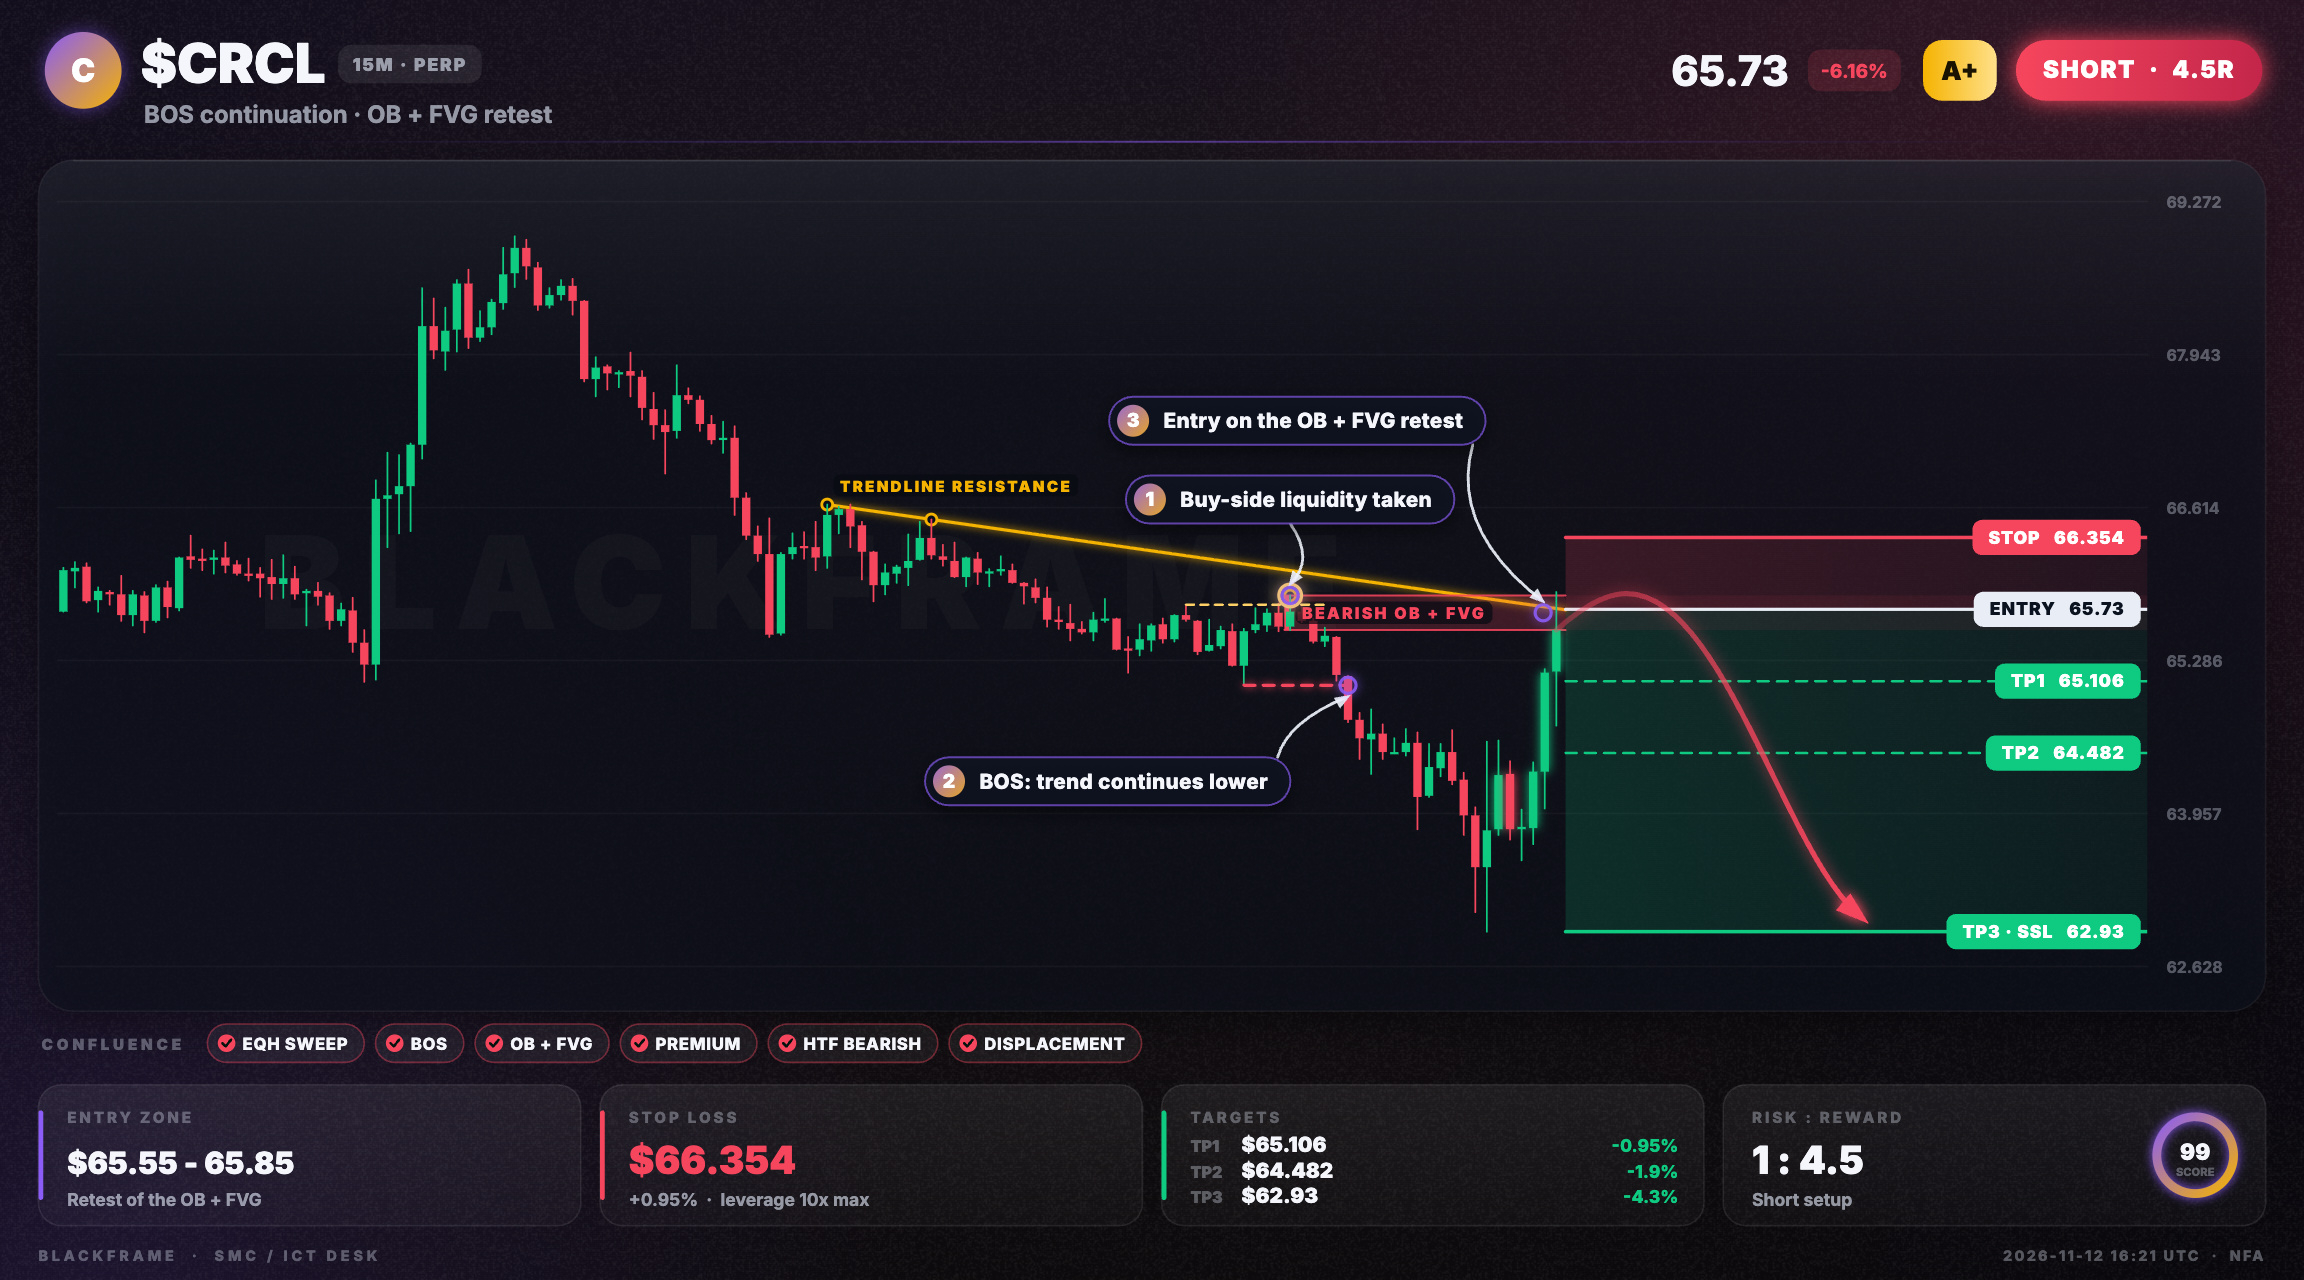
🚨 $CRCL liquidity sweep confirms bearish breakout
SHORT · 15M
Entry: $65.55 - $65.73
TP1: $65.106
TP2: $64.482
TP3: $62.93
SL: $66.354
Equal highs were swept, buying side taken. BOS on 15M aligns with the OB+FVG zone at $65.55-65.85, selling from premium. Target is $62.93 with stop at $66.354. Invalidates if price retakes $65.77.
#CRCL #ICT · NFA
🚨 $CRCL liquidity sweep confirms bearish breakout
SHORT · 15M
Entry: $65.55 - $65.73
TP1: $65.106
TP2: $64.482
TP3: $62.93
SL: $66.354
Equal highs were swept, buying side taken. BOS on 15M aligns with the OB+FVG zone at $65.55-65.85, selling from premium. Target is $62.93 with stop at $66.354. Invalidates if price retakes $65.77.
#CRCL #ICT · NFA
SHORT · 15M
Entry: $65.55 - $65.73
TP1: $65.106
TP2: $64.482
TP3: $62.93
SL: $66.354
Equal highs were swept, buying side taken. BOS on 15M aligns with the OB+FVG zone at $65.55-65.85, selling from premium. Target is $62.93 with stop at $66.354. Invalidates if price retakes $65.77.
#CRCL #ICT · NFA
38

·
--
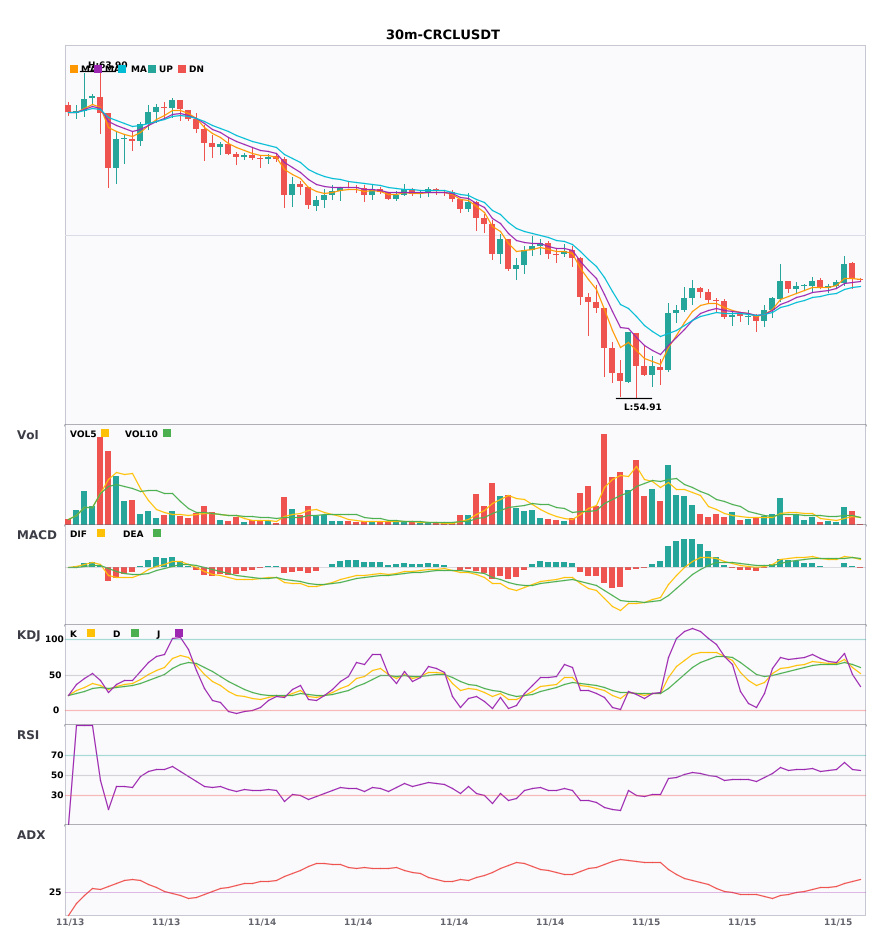
$CRCL 30-minute bullish alignment diverging upward—short-term surge ahead?🔥
════════════════════
🔴 $CRCL 30-minute bullish signal
⚠️Technical analysis: ADX indicates a clear trend. After a MACD golden cross, trading volume increased and the red bars continued to grow. The moving averages are in bullish alignment and trending upward. K has crossed above D on the KDJ and has not entered the overbought zone. Trading volume is up 1.9 times, indicating strong bullish momentum.
════════════════════
🔔 Follow to get the latest market moves 🔔
#技术分析 #CRCL
📌 When trading, pay attention to whether the candlestick pattern confirms the move
$CRCL 30-minute bullish alignment diverging upward—short-term surge ahead?🔥
════════════════════
🔴 $CRCL 30-minute bullish signal
⚠️Technical analysis: ADX indicates a clear trend. After a MACD golden cross, trading volume increased and the red bars continued to grow. The moving averages are in bullish alignment and trending upward. K has crossed above D on the KDJ and has not entered the overbought zone. Trading volume is up 1.9 times, indicating strong bullish momentum.
════════════════════
🔔 Follow to get the latest market moves 🔔
#技术分析 #CRCL
📌 When trading, pay attention to whether the candlestick pattern confirms the move
════════════════════
🔴 $CRCL 30-minute bullish signal
⚠️Technical analysis: ADX indicates a clear trend. After a MACD golden cross, trading volume increased and the red bars continued to grow. The moving averages are in bullish alignment and trending upward. K has crossed above D on the KDJ and has not entered the overbought zone. Trading volume is up 1.9 times, indicating strong bullish momentum.
════════════════════
🔔 Follow to get the latest market moves 🔔
#技术分析 #CRCL
📌 When trading, pay attention to whether the candlestick pattern confirms the move
9

·
--
🚀 CRYPTO MARKET UPDATE 📊
💎 $AGT | $CRCL | $ERA
{future}(ERAUSDT)
{future}(AGTUSDT)
{future}(CRCLUSDT)
🟢 AGT — +44.55% (Strong Bullish Momentum) 🔥
🔴 CRCL — -2.00% (Slight Market Pullback)
🟢 ERA — +13.05% (Positive Recovery) 📈
📊 AGT and ERA are showing strong gains, while CRCL is facing a small correction. Keep these three coins on your watchlist!
⚠️ Crypto is highly volatile. Always manage your risk!
#AGT #CRCL #ERA #Crypto #MarketUpdate
🚀 CRYPTO MARKET UPDATE 📊
💎 $AGT | $CRCL | $ERA
🟢 AGT — +44.55% (Strong Bullish Momentum) 🔥
🔴 CRCL — -2.00% (Slight Market Pullback)
🟢 ERA — +13.05% (Positive Recovery) 📈
📊 AGT and ERA are showing strong gains, while CRCL is facing a small correction. Keep these three coins on your watchlist!
⚠️ Crypto is highly volatile. Always manage your risk!
#AGT #CRCL #ERA #Crypto #MarketUpdate
💎 $AGT | $CRCL | $ERA
🟢 AGT — +44.55% (Strong Bullish Momentum) 🔥
🔴 CRCL — -2.00% (Slight Market Pullback)
🟢 ERA — +13.05% (Positive Recovery) 📈
📊 AGT and ERA are showing strong gains, while CRCL is facing a small correction. Keep these three coins on your watchlist!
⚠️ Crypto is highly volatile. Always manage your risk!
#AGT #CRCL #ERA #Crypto #MarketUpdate

721

·
--
At this morning’s 8:00 funding settlement, when the rate hit -0.4605%, was position $CRCL being reduced or increased?
The price touched 54.91 within the same 5-minute candle. It’s now around 57.0, already below Friday’s cash close of 62.20.
▪️ Open interest: around 1.362 million at 21:00 yesterday, 1.394 million at 6:00 this morning, up to 1.539 million by 8:00, and around 1.553 million now
▪️ Long accounts are still around 82%
▪️ $COIN hit a low of 113.74 this morning. The 8:00 funding rate was -0.1668%, and its open interest rose from 132,000 at 4:00 to around 149,000
Next, will this batch of new positions unwind first, or will shorts keep paying the funding rate?
#CRCL #COIN
At this morning’s 8:00 funding settlement, when the rate hit -0.4605%, was position $CRCL being reduced or increased?
The price touched 54.91 within the same 5-minute candle. It’s now around 57.0, already below Friday’s cash close of 62.20.
▪️ Open interest: around 1.362 million at 21:00 yesterday, 1.394 million at 6:00 this morning, up to 1.539 million by 8:00, and around 1.553 million now
▪️ Long accounts are still around 82%
▪️ $COIN hit a low of 113.74 this morning. The 8:00 funding rate was -0.1668%, and its open interest rose from 132,000 at 4:00 to around 149,000
Next, will this batch of new positions unwind first, or will shorts keep paying the funding rate?
#CRCL #COIN
The price touched 54.91 within the same 5-minute candle. It’s now around 57.0, already below Friday’s cash close of 62.20.
▪️ Open interest: around 1.362 million at 21:00 yesterday, 1.394 million at 6:00 this morning, up to 1.539 million by 8:00, and around 1.553 million now
▪️ Long accounts are still around 82%
▪️ $COIN hit a low of 113.74 this morning. The 8:00 funding rate was -0.1668%, and its open interest rose from 132,000 at 4:00 to around 149,000
Next, will this batch of new positions unwind first, or will shorts keep paying the funding rate?
#CRCL #COIN
135
·
--
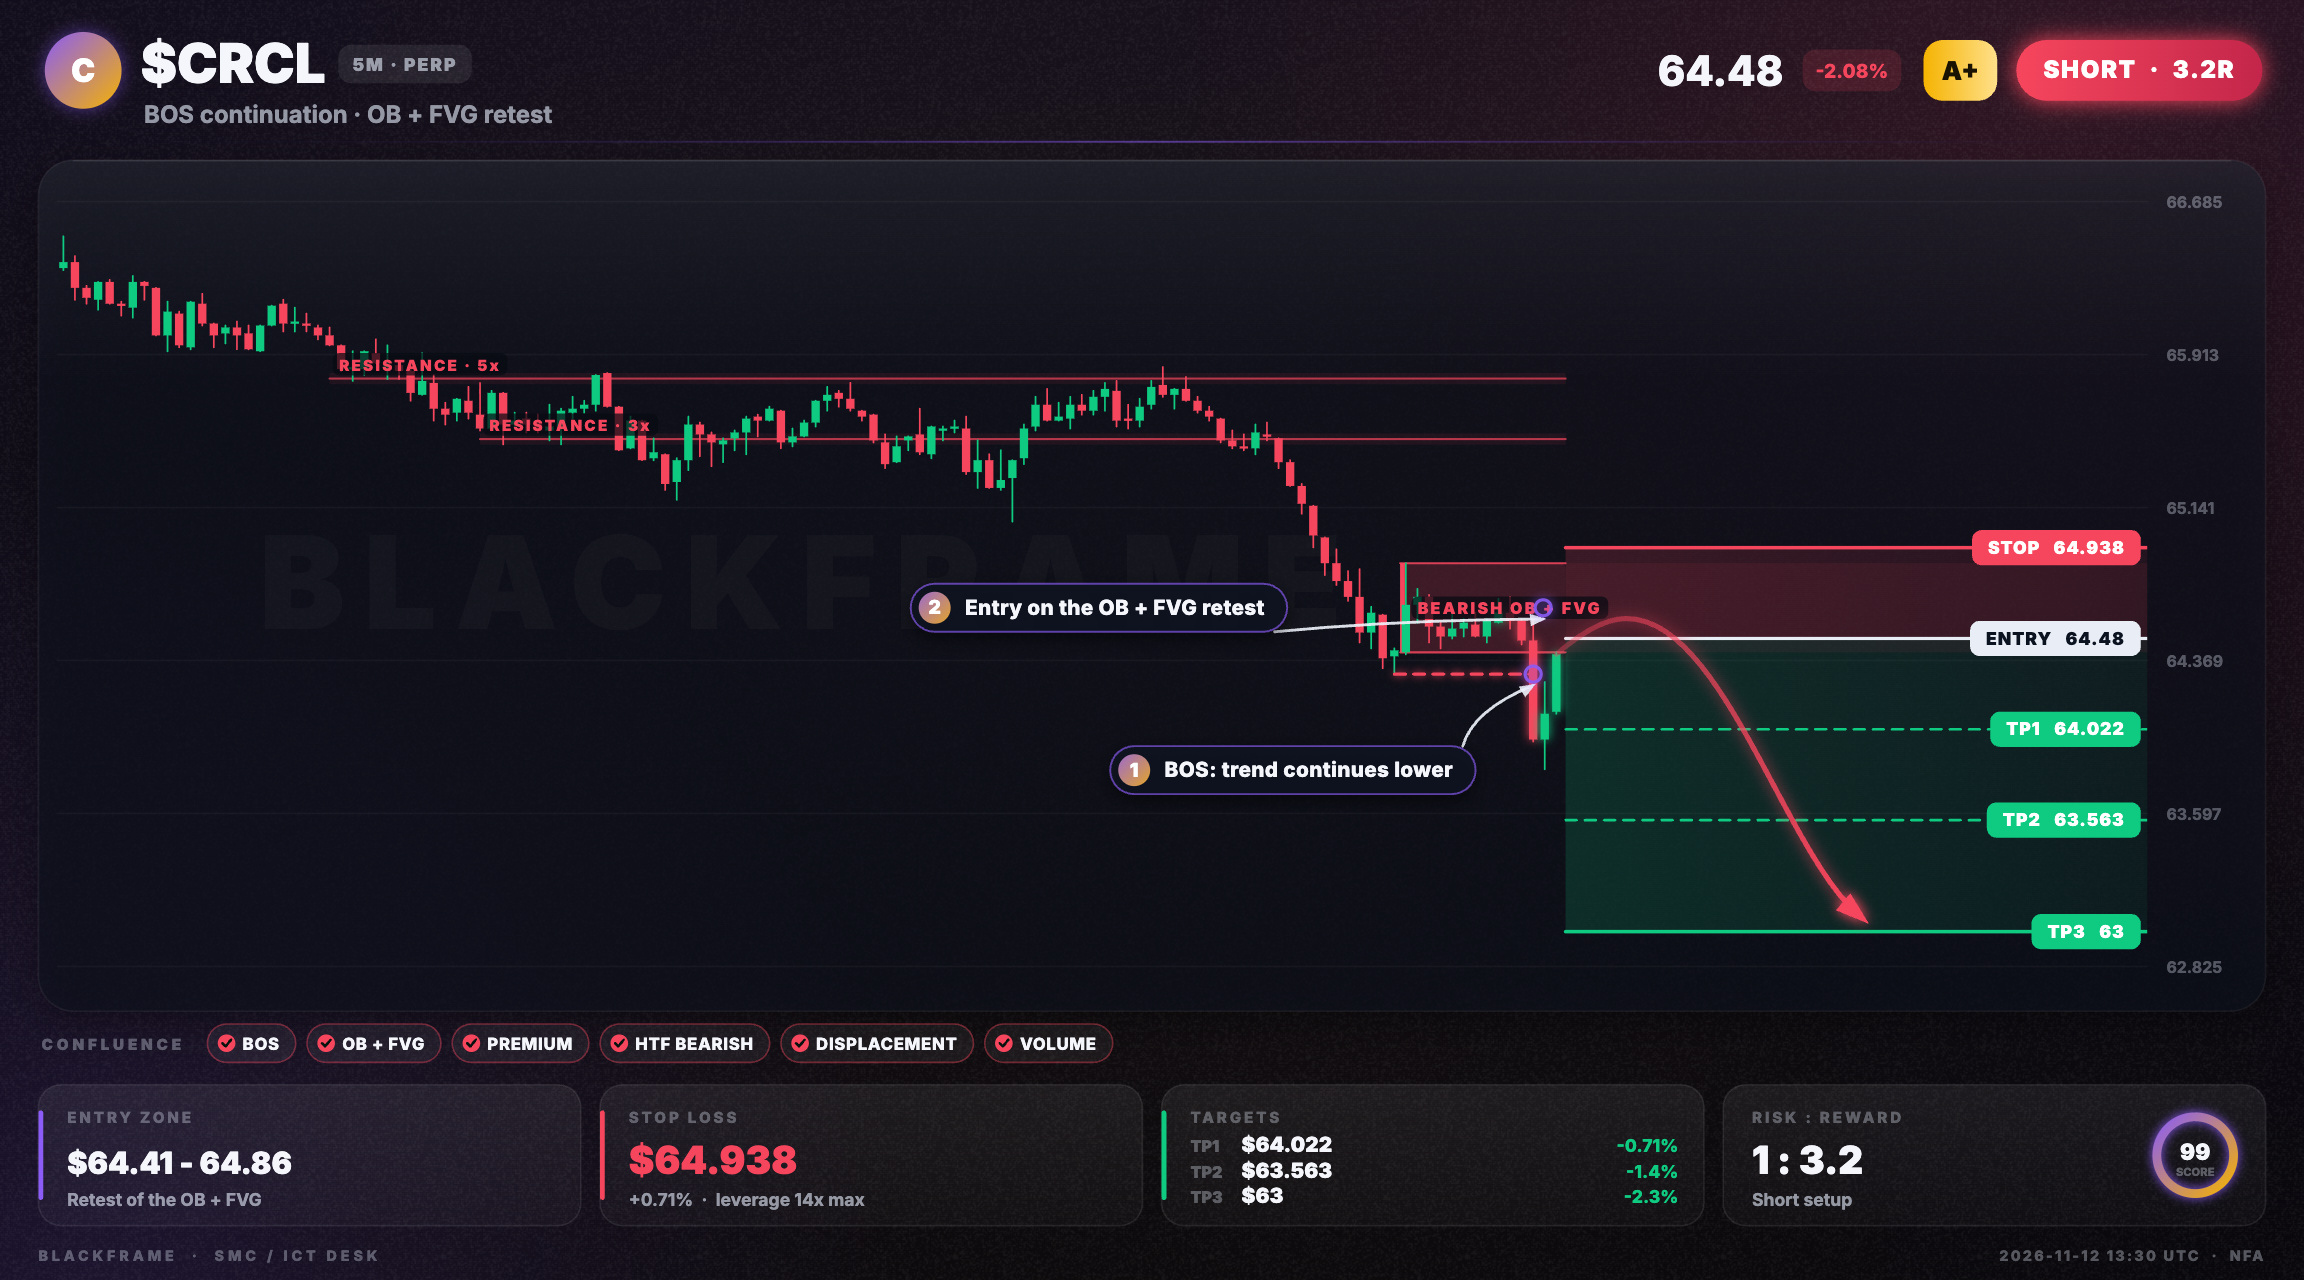
🔻 $CRCL bearish order flow intact
SHORT · 5M
Entry: $64.41 - $64.48
TP1: $64.022
TP2: $63.563
TP3: $63
SL: $64.938
Structure continues lower with a fresh BOS on the 5M. Entry is the first retest of the fresh bearish order block and FVG in premium, targeting sell-side liquidity below.
#CRCL #TradingSignals · NFA
🔻 $CRCL bearish order flow intact
SHORT · 5M
Entry: $64.41 - $64.48
TP1: $64.022
TP2: $63.563
TP3: $63
SL: $64.938
Structure continues lower with a fresh BOS on the 5M. Entry is the first retest of the fresh bearish order block and FVG in premium, targeting sell-side liquidity below.
#CRCL #TradingSignals · NFA
SHORT · 5M
Entry: $64.41 - $64.48
TP1: $64.022
TP2: $63.563
TP3: $63
SL: $64.938
Structure continues lower with a fresh BOS on the 5M. Entry is the first retest of the fresh bearish order block and FVG in premium, targeting sell-side liquidity below.
#CRCL #TradingSignals · NFA
67

·
--
$CRCL / $COIN / $SAMSUNG 30-minute weakness, 4-hour bearish confluence, price getting dumped 🔥
════════════════════
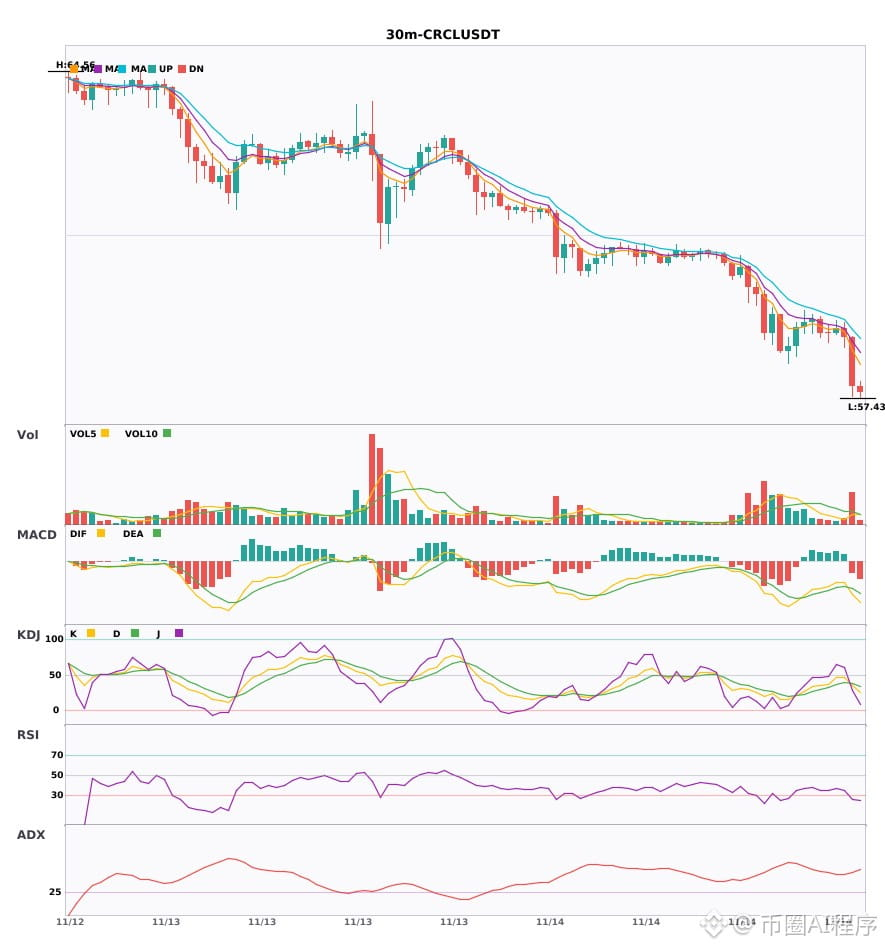
🟢 $CRCL 30-minute bearish signal
⚠️Technical analysis: Multi-timeframe bearish confluence signal! 4-hour bearish direction + 30-minute entry confirmation. MACD bearish cross below zero accelerating downward, EMA5<EMA8<EMA13 in bearish alignment, KDJ bearish cross without entering oversold territory (K34.9/D38.4), volume up 2.4x; short-term outlook is bearish.
════════════════════
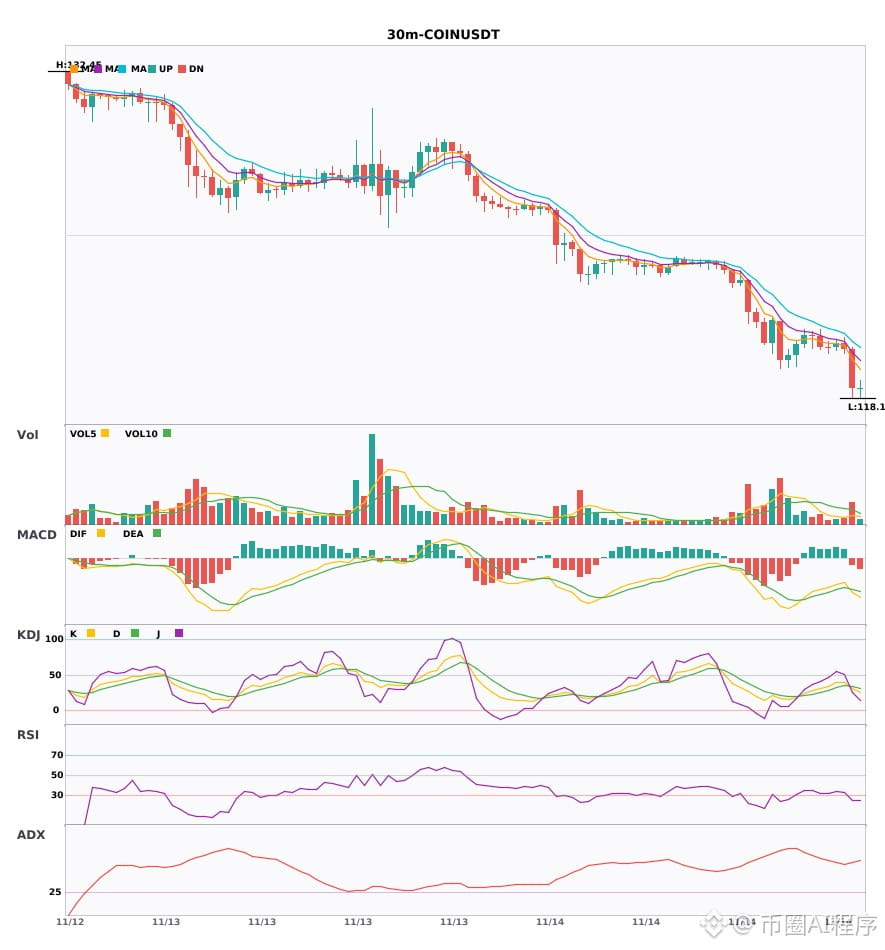
🟢 $COIN 30-minute bearish signal
⚠️Technical analysis: 4-hour bearish direction + 30-minute entry, with multi-timeframe bearish confluence. MACD green bars expanding after a bearish cross, moving averages in bearish alignment, KDJ bearish cross but not oversold, volume normal.
📢Market update: What is Canton Network? The privacy blockchain built for Wall Street—Canton Network is a privacy blockchain for banks and tokenized assets. Here's how it works and what Canton Coin (CC) is used for.
════════════════════
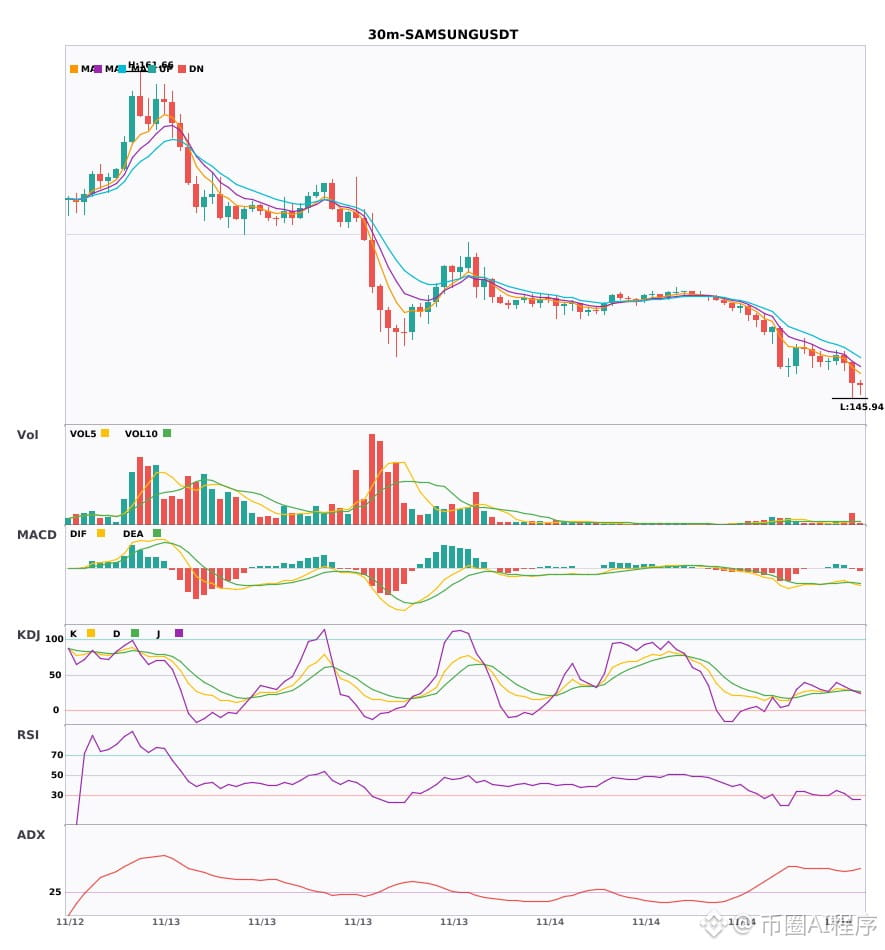
🟢 $SAMSUNG 30-minute bearish signal
⚠️Technical analysis: The 30-minute entry signal is confirmed by 4-hour bearish confluence. After a bearish MACD cross below zero, green bars are expanding; moving averages are bearishly diverging downward, K crosses below D at a low level on KDJ without being oversold, and volume is up 2.9x.
════════════════════
🔔 Follow for first-hand market alerts 🔔
#多周期共振 #CRCL #COIN #SAMSUNG
📌 When trading, pay attention to whether the candlestick pattern aligns
$CRCL / $COIN / $SAMSUNG 30-minute weakness, 4-hour bearish confluence, price getting dumped 🔥
════════════════════
🟢 $CRCL 30-minute bearish signal
⚠️Technical analysis: Multi-timeframe bearish confluence signal! 4-hour bearish direction + 30-minute entry confirmation. MACD bearish cross below zero accelerating downward, EMA5<EMA8<EMA13 in bearish alignment, KDJ bearish cross without entering oversold territory (K34.9/D38.4), volume up 2.4x; short-term outlook is bearish.
════════════════════
🟢 $COIN 30-minute bearish signal
⚠️Technical analysis: 4-hour bearish direction + 30-minute entry, with multi-timeframe bearish confluence. MACD green bars expanding after a bearish cross, moving averages in bearish alignment, KDJ bearish cross but not oversold, volume normal.
📢Market update: What is Canton Network? The privacy blockchain built for Wall Street—Canton Network is a privacy blockchain for banks and tokenized assets. Here's how it works and what Canton Coin (CC) is used for.
════════════════════
🟢 $SAMSUNG 30-minute bearish signal
⚠️Technical analysis: The 30-minute entry signal is confirmed by 4-hour bearish confluence. After a bearish MACD cross below zero, green bars are expanding; moving averages are bearishly diverging downward, K crosses below D at a low level on KDJ without being oversold, and volume is up 2.9x.
════════════════════
🔔 Follow for first-hand market alerts 🔔
#多周期共振 #CRCL #COIN #SAMSUNG
📌 When trading, pay attention to whether the candlestick pattern aligns
════════════════════
🟢 $CRCL 30-minute bearish signal
⚠️Technical analysis: Multi-timeframe bearish confluence signal! 4-hour bearish direction + 30-minute entry confirmation. MACD bearish cross below zero accelerating downward, EMA5<EMA8<EMA13 in bearish alignment, KDJ bearish cross without entering oversold territory (K34.9/D38.4), volume up 2.4x; short-term outlook is bearish.
════════════════════
🟢 $COIN 30-minute bearish signal
⚠️Technical analysis: 4-hour bearish direction + 30-minute entry, with multi-timeframe bearish confluence. MACD green bars expanding after a bearish cross, moving averages in bearish alignment, KDJ bearish cross but not oversold, volume normal.
📢Market update: What is Canton Network? The privacy blockchain built for Wall Street—Canton Network is a privacy blockchain for banks and tokenized assets. Here's how it works and what Canton Coin (CC) is used for.
════════════════════
🟢 $SAMSUNG 30-minute bearish signal
⚠️Technical analysis: The 30-minute entry signal is confirmed by 4-hour bearish confluence. After a bearish MACD cross below zero, green bars are expanding; moving averages are bearishly diverging downward, K crosses below D at a low level on KDJ without being oversold, and volume is up 2.9x.
════════════════════
🔔 Follow for first-hand market alerts 🔔
#多周期共振 #CRCL #COIN #SAMSUNG
📌 When trading, pay attention to whether the candlestick pattern aligns
25
·
--
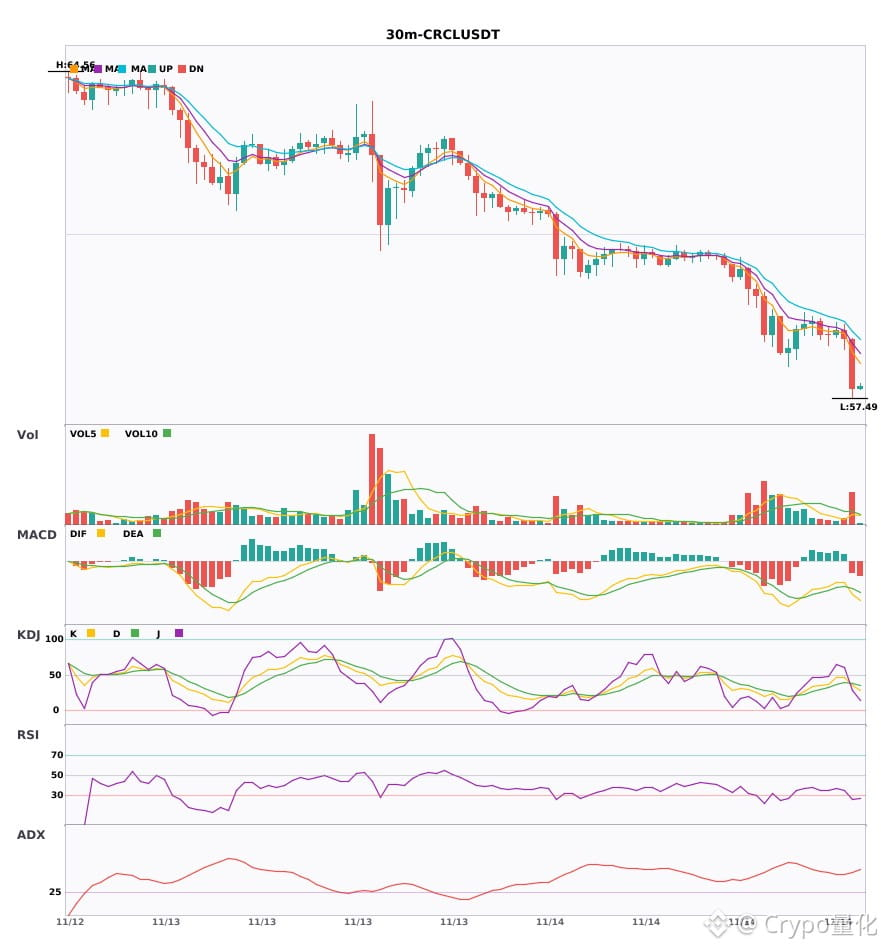
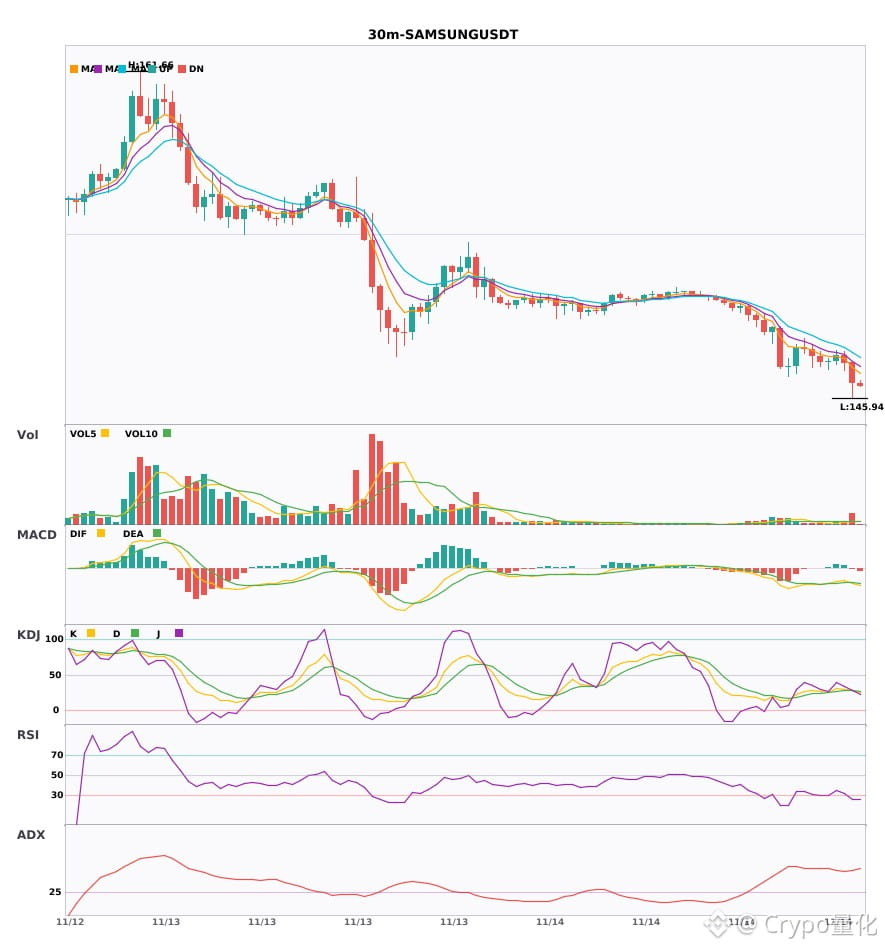
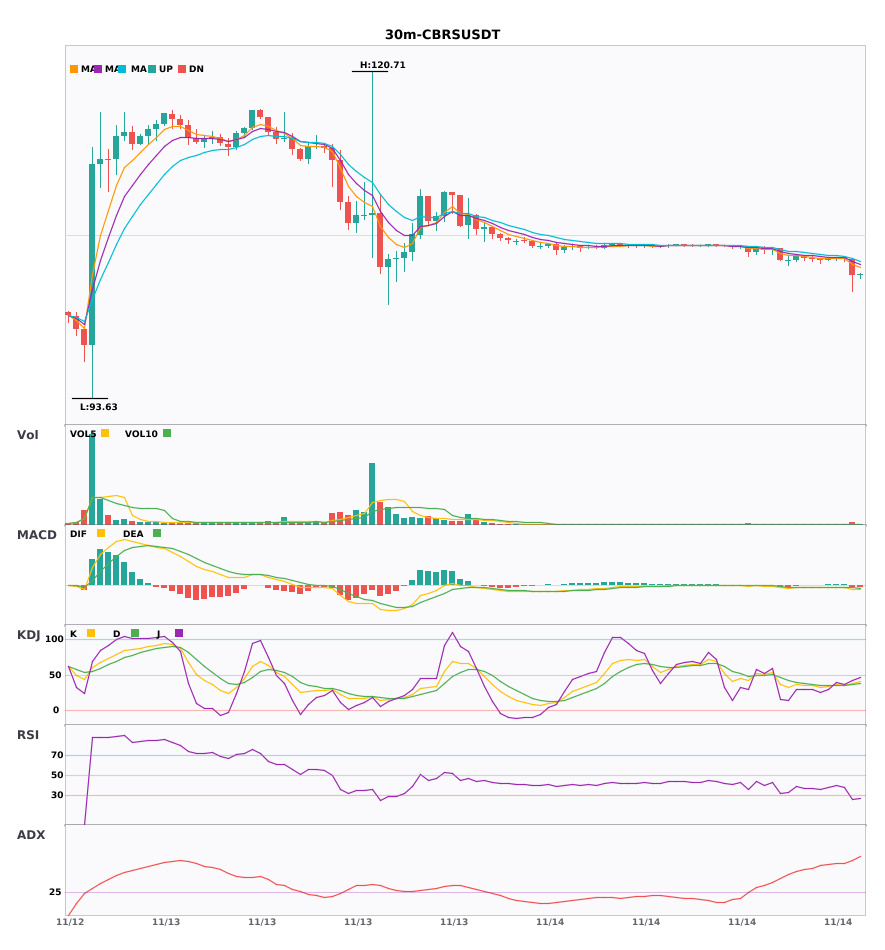
30-minute short signal alert! $CRCL $SAMSUNG $CBRS🔥
════════════════════
🟢 $CRCL 30-minute short signal
⚠️Technical analysis: ADX is as high as 46, indicating an extremely strong trend; watch out for an overheated pullback. MACD has formed a death cross below zero, and bearish momentum is accelerating. The moving averages are bearishly aligned and sloping downward. KDJ has formed a death cross, with K crossing below D and not yet oversold, suggesting a short-term bearish bias. Trading volume is up 2.4x.
════════════════════
🟢 $SAMSUNG 30-minute short signal
⚠️Technical analysis: ADX has surged to 51, signaling a very strong trend, but watch out for an overheated pullback. MACD has formed a death cross below zero, with the green histogram bars growing. The moving averages are bearishly aligned and sloping downward. KDJ is weakening, with K near D and bears in control. Volume is up 2.9x.
════════════════════
🟢 $CBRS 30-minute short signal
⚠️Technical analysis: ADX is exceptionally high, indicating a very strong trend, but watch out for an overheated pullback. MACD has formed a death cross, and bears are accelerating their sell-off. The moving averages are bearishly aligned and moving downward. KDJ is weak; K has not yet crossed above D, so bears are in control. Trading volume has surged to 4.7x, indicating heavy selling pressure.
════════════════════
🔔 Follow to get the latest market moves 🔔
#技术分析 #CRCL #SAMSUNG #CBRS
📌 When trading, pay attention to whether the candlestick pattern confirms the signal
30-minute short signal alert! $CRCL $SAMSUNG $CBRS 🔥
════════════════════
🟢 $CRCL 30-minute short signal
⚠️Technical analysis: ADX is as high as 46, indicating an extremely strong trend; watch out for an overheated pullback. MACD has formed a death cross below zero, and bearish momentum is accelerating. The moving averages are bearishly aligned and sloping downward. KDJ has formed a death cross, with K crossing below D and not yet oversold, suggesting a short-term bearish bias. Trading volume is up 2.4x.
════════════════════
🟢 $SAMSUNG 30-minute short signal
⚠️Technical analysis: ADX has surged to 51, signaling a very strong trend, but watch out for an overheated pullback. MACD has formed a death cross below zero, with the green histogram bars growing. The moving averages are bearishly aligned and sloping downward. KDJ is weakening, with K near D and bears in control. Volume is up 2.9x.
════════════════════
🟢 $CBRS 30-minute short signal
⚠️Technical analysis: ADX is exceptionally high, indicating a very strong trend, but watch out for an overheated pullback. MACD has formed a death cross, and bears are accelerating their sell-off. The moving averages are bearishly aligned and moving downward. KDJ is weak; K has not yet crossed above D, so bears are in control. Trading volume has surged to 4.7x, indicating heavy selling pressure.
════════════════════
🔔 Follow to get the latest market moves 🔔
#技术分析 #CRCL #SAMSUNG #CBRS
📌 When trading, pay attention to whether the candlestick pattern confirms the signal
════════════════════
🟢 $CRCL 30-minute short signal
⚠️Technical analysis: ADX is as high as 46, indicating an extremely strong trend; watch out for an overheated pullback. MACD has formed a death cross below zero, and bearish momentum is accelerating. The moving averages are bearishly aligned and sloping downward. KDJ has formed a death cross, with K crossing below D and not yet oversold, suggesting a short-term bearish bias. Trading volume is up 2.4x.
════════════════════
🟢 $SAMSUNG 30-minute short signal
⚠️Technical analysis: ADX has surged to 51, signaling a very strong trend, but watch out for an overheated pullback. MACD has formed a death cross below zero, with the green histogram bars growing. The moving averages are bearishly aligned and sloping downward. KDJ is weakening, with K near D and bears in control. Volume is up 2.9x.
════════════════════
🟢 $CBRS 30-minute short signal
⚠️Technical analysis: ADX is exceptionally high, indicating a very strong trend, but watch out for an overheated pullback. MACD has formed a death cross, and bears are accelerating their sell-off. The moving averages are bearishly aligned and moving downward. KDJ is weak; K has not yet crossed above D, so bears are in control. Trading volume has surged to 4.7x, indicating heavy selling pressure.
════════════════════
🔔 Follow to get the latest market moves 🔔
#技术分析 #CRCL #SAMSUNG #CBRS
📌 When trading, pay attention to whether the candlestick pattern confirms the signal
61
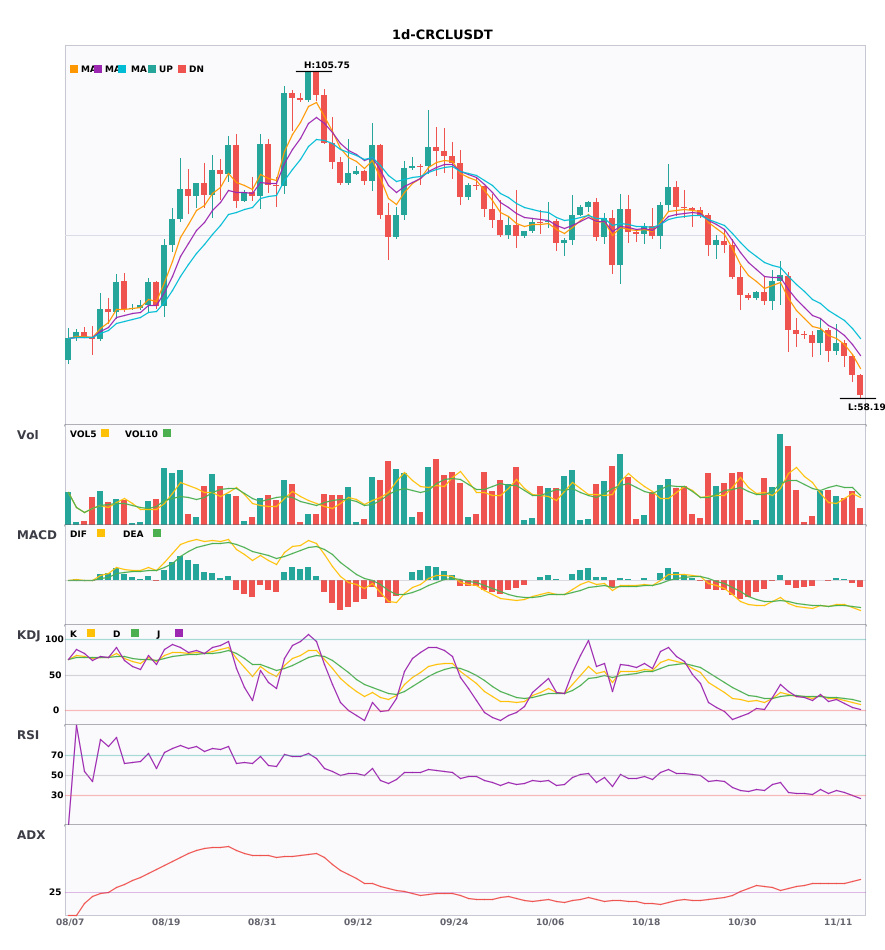
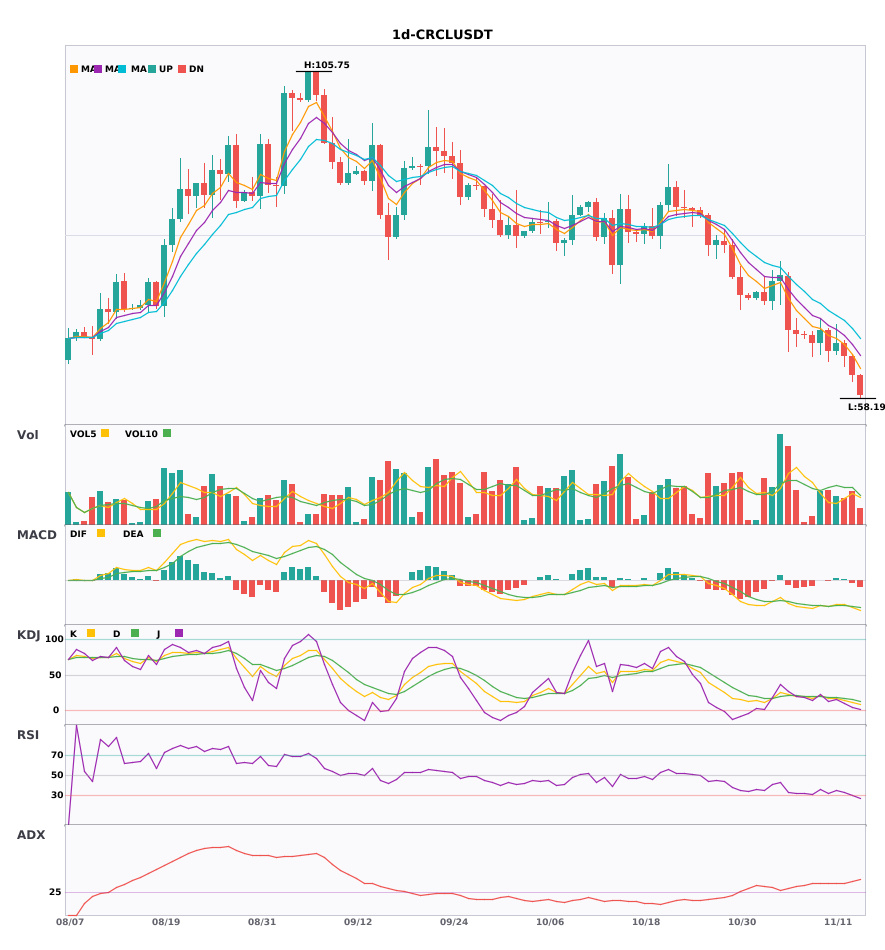
$CRCL Daily-Timeframe Bearish Signal Analysis
📉 $CRCL | Daily Bearish Signal
━━━━━━━━━━━━━━━━━━
Technical analysis: ADX 39, strong trend | MACD bearish crossover below zero, bearish momentum accelerating | EMA bearish alignment | KDJ oversold (K11.7/D15.5), watch for a rebound | Volume down to 0.9x
Price change: -4.3000%
━━━━━━━━━━━━━━━━━━
#技术分析 #CRCL
📌 The above is for reference only and does not constitute investment advice
$CRCL Daily-Timeframe Bearish Signal Analysis
📉 $CRCL | Daily Bearish Signal
━━━━━━━━━━━━━━━━━━
Technical analysis: ADX 39, strong trend | MACD bearish crossover below zero, bearish momentum accelerating | EMA bearish alignment | KDJ oversold (K11.7/D15.5), watch for a rebound | Volume down to 0.9x
Price change: -4.3000%
━━━━━━━━━━━━━━━━━━
#技术分析 #CRCL
📌 The above is for reference only and does not constitute investment advice
📉 $CRCL | Daily Bearish Signal
━━━━━━━━━━━━━━━━━━
Technical analysis: ADX 39, strong trend | MACD bearish crossover below zero, bearish momentum accelerating | EMA bearish alignment | KDJ oversold (K11.7/D15.5), watch for a rebound | Volume down to 0.9x
Price change: -4.3000%
━━━━━━━━━━━━━━━━━━
#技术分析 #CRCL
📌 The above is for reference only and does not constitute investment advice
25
·
--
$CRCL daily chart is turning bearish, under short-term pressure. Watch out for pullback risk 🔥
════════════════════
🟢 $CRCL daily chart: bearish signal
⚠️Technical analysis: ADX at 39 indicates a strong trend. MACD is below zero with a bearish crossover, showing strengthening selling pressure. Moving averages have just formed a bearish alignment. KDJ is oversold, so watch for a possible rebound. Volume is down to 0.9x.
════════════════════
🔔 Follow for the latest market moves 🔔
#技术分析 #CRCL
📌 When trading, pay attention to whether the candlestick patterns confirm the signal.
$CRCL daily chart is turning bearish, under short-term pressure. Watch out for pullback risk 🔥
════════════════════
🟢 $CRCL daily chart: bearish signal
⚠️Technical analysis: ADX at 39 indicates a strong trend. MACD is below zero with a bearish crossover, showing strengthening selling pressure. Moving averages have just formed a bearish alignment. KDJ is oversold, so watch for a possible rebound. Volume is down to 0.9x.
════════════════════
🔔 Follow for the latest market moves 🔔
#技术分析 #CRCL
📌 When trading, pay attention to whether the candlestick patterns confirm the signal.
════════════════════
🟢 $CRCL daily chart: bearish signal
⚠️Technical analysis: ADX at 39 indicates a strong trend. MACD is below zero with a bearish crossover, showing strengthening selling pressure. Moving averages have just formed a bearish alignment. KDJ is oversold, so watch for a possible rebound. Volume is down to 0.9x.
════════════════════
🔔 Follow for the latest market moves 🔔
#技术分析 #CRCL
📌 When trading, pay attention to whether the candlestick patterns confirm the signal.
17
·
--
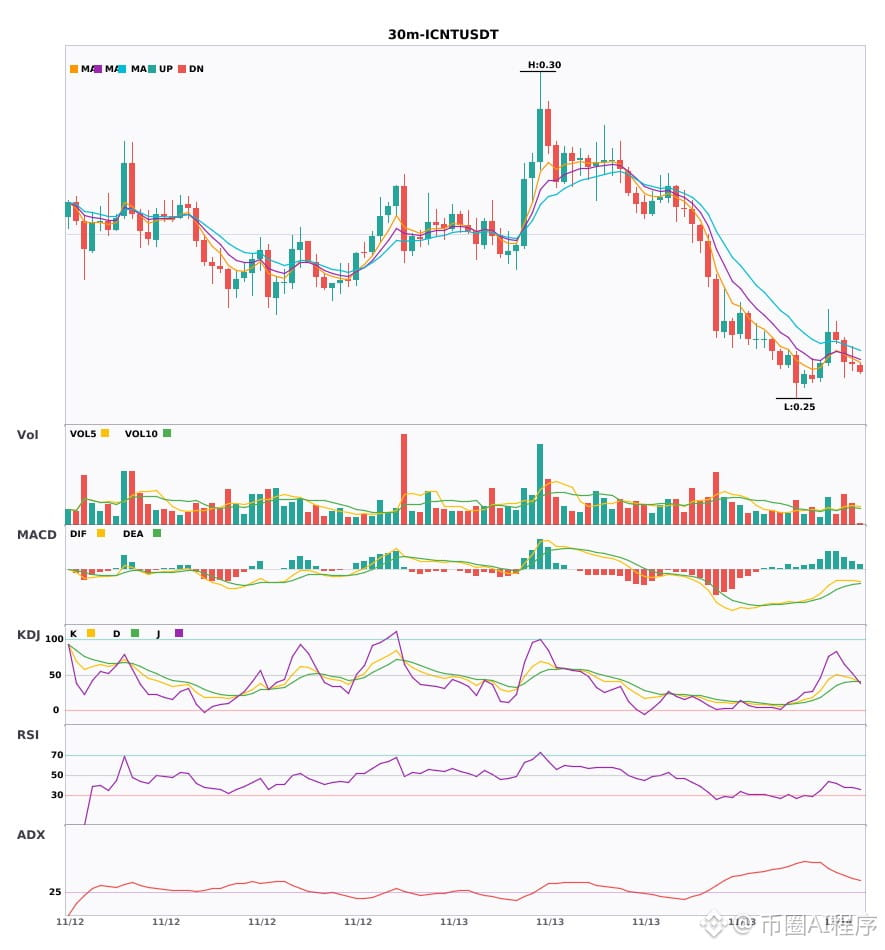
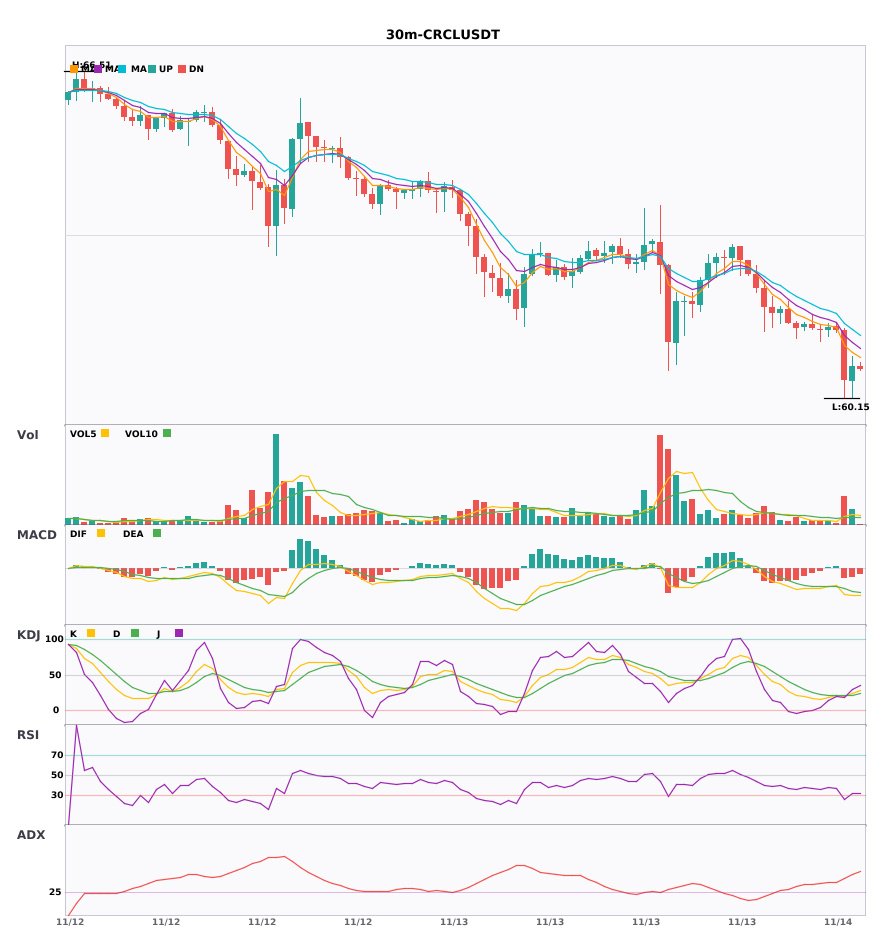
$W/$ICNT/$CRCL 30-minute weakness; 4-hour bears pushing prices lower 🔥
════════════════════
🟢 $W 30-minute bearish signal
⚠️Technical analysis: Multiple timeframes align bearishly: 4-hour bearish trend + 30-minute entry. MACD bearish crossover with rising volume; moving averages diverging downward in a bearish alignment; KDJ bearish crossover, not yet oversold; volume surges 5x.
════════════════════
🟢 $ICNT 30-minute bearish signal
⚠️Technical analysis: Multiple timeframes align bearishly: 4-hour bearish trend confirmed + 30-minute EMA5 crossing below EMA8, forming a bearish alignment; K crosses below D in KDJ, which is trending weakly; volume increases 1.8x. A confluence short signal.
════════════════════
🟢 $CRCL 30-minute bearish signal
⚠️Technical analysis: Multiple timeframes align for a short: 4-hour bearish trend + 30-minute confirmation. MACD bearish crossover below zero with rising volume; moving averages in a bearish alignment, diverging downward; KDJ is weak but not oversold; volume surges 3.9x, accelerating the bearish move.
════════════════════
🔔 Follow for first-hand updates on unusual market moves 🔔
#多周期共振 #W #ICNT #CRCL
📌 When trading, pay attention to whether the candlestick pattern confirms the setup
$W /$ICNT /$CRCL 30-minute weakness; 4-hour bears pushing prices lower 🔥
════════════════════
🟢 $W 30-minute bearish signal
⚠️Technical analysis: Multiple timeframes align bearishly: 4-hour bearish trend + 30-minute entry. MACD bearish crossover with rising volume; moving averages diverging downward in a bearish alignment; KDJ bearish crossover, not yet oversold; volume surges 5x.
════════════════════
🟢 $ICNT 30-minute bearish signal
⚠️Technical analysis: Multiple timeframes align bearishly: 4-hour bearish trend confirmed + 30-minute EMA5 crossing below EMA8, forming a bearish alignment; K crosses below D in KDJ, which is trending weakly; volume increases 1.8x. A confluence short signal.
════════════════════
🟢 $CRCL 30-minute bearish signal
⚠️Technical analysis: Multiple timeframes align for a short: 4-hour bearish trend + 30-minute confirmation. MACD bearish crossover below zero with rising volume; moving averages in a bearish alignment, diverging downward; KDJ is weak but not oversold; volume surges 3.9x, accelerating the bearish move.
════════════════════
🔔 Follow for first-hand updates on unusual market moves 🔔
#多周期共振 #W #ICNT #CRCL
📌 When trading, pay attention to whether the candlestick pattern confirms the setup
════════════════════
🟢 $W 30-minute bearish signal
⚠️Technical analysis: Multiple timeframes align bearishly: 4-hour bearish trend + 30-minute entry. MACD bearish crossover with rising volume; moving averages diverging downward in a bearish alignment; KDJ bearish crossover, not yet oversold; volume surges 5x.
════════════════════
🟢 $ICNT 30-minute bearish signal
⚠️Technical analysis: Multiple timeframes align bearishly: 4-hour bearish trend confirmed + 30-minute EMA5 crossing below EMA8, forming a bearish alignment; K crosses below D in KDJ, which is trending weakly; volume increases 1.8x. A confluence short signal.
════════════════════
🟢 $CRCL 30-minute bearish signal
⚠️Technical analysis: Multiple timeframes align for a short: 4-hour bearish trend + 30-minute confirmation. MACD bearish crossover below zero with rising volume; moving averages in a bearish alignment, diverging downward; KDJ is weak but not oversold; volume surges 3.9x, accelerating the bearish move.
════════════════════
🔔 Follow for first-hand updates on unusual market moves 🔔
#多周期共振 #W #ICNT #CRCL
📌 When trading, pay attention to whether the candlestick pattern confirms the setup
34
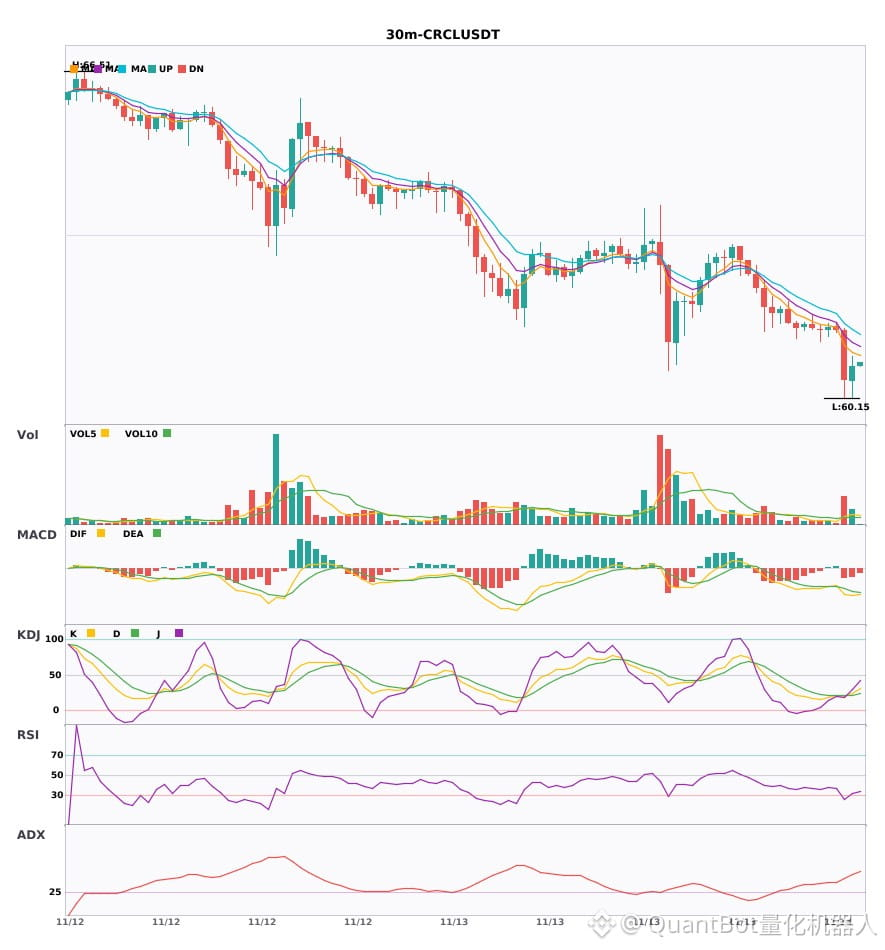
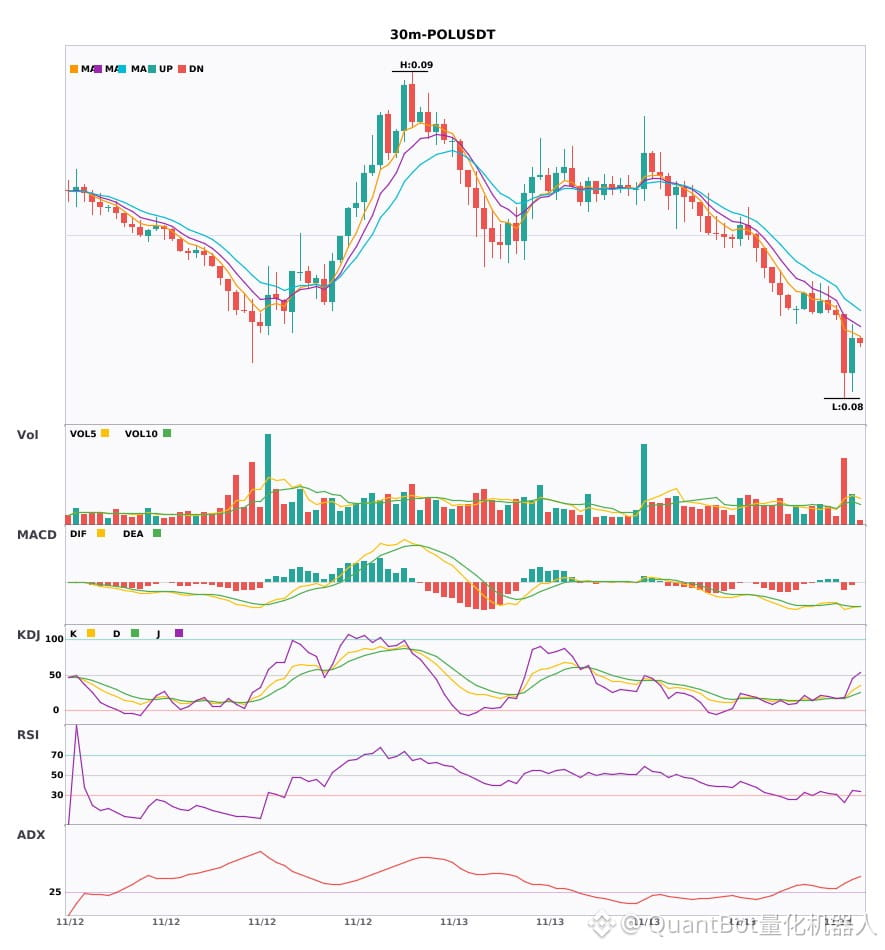
$W $CRCL $POL 30-minute bearish signals, short-term downward pressure
📉 $W | 30-minute bearish signal
━━━━━━━━━━━━━━━━━━
Technical analysis: ADX (36) indicates a strong trend; MACD bearish cross below zero accelerates downward momentum; EMA 5/8/13 are bearishly aligned; KDJ bearish (K27.6/D30.0); volume up 5.4x.
Price change: -2.0900%
📉 $CRCL | 30-minute bearish signal
━━━━━━━━━━━━━━━━━━
Technical analysis: ADX (44) indicates a significant trend; MACD bearish cross below zero favors bears; EMA5<EMA8<EMA13 are bearishly aligned; KDJ is weak (K19.9/D20.7); volume up 3.9x.
Price change: -1.5800%
📉 $POL | 30-minute bearish signal
━━━━━━━━━━━━━━━━━━
Technical analysis: ADX (37) indicates a clear trend; MACD bearish cross below zero; EMAs are bearishly aligned; KDJ is oversold (K17.6, D16.9); volume up 3.1x—watch for a rebound.
Price change: -1.5400%
━━━━━━━━━━━━━━━━━━
#技术分析 #W #CRCL #POL
📌 The above content is for reference only and does not constitute investment advice
$W $CRCL $POL 30-minute bearish signals, short-term downward pressure
📉 $W | 30-minute bearish signal
━━━━━━━━━━━━━━━━━━
Technical analysis: ADX (36) indicates a strong trend; MACD bearish cross below zero accelerates downward momentum; EMA 5/8/13 are bearishly aligned; KDJ bearish (K27.6/D30.0); volume up 5.4x.
Price change: -2.0900%
📉 $CRCL | 30-minute bearish signal
━━━━━━━━━━━━━━━━━━
Technical analysis: ADX (44) indicates a significant trend; MACD bearish cross below zero favors bears; EMA5<EMA8<EMA13 are bearishly aligned; KDJ is weak (K19.9/D20.7); volume up 3.9x.
Price change: -1.5800%
📉 $POL | 30-minute bearish signal
━━━━━━━━━━━━━━━━━━
Technical analysis: ADX (37) indicates a clear trend; MACD bearish cross below zero; EMAs are bearishly aligned; KDJ is oversold (K17.6, D16.9); volume up 3.1x—watch for a rebound.
Price change: -1.5400%
━━━━━━━━━━━━━━━━━━
#技术分析 #W #CRCL #POL
📌 The above content is for reference only and does not constitute investment advice
📉 $W | 30-minute bearish signal
━━━━━━━━━━━━━━━━━━
Technical analysis: ADX (36) indicates a strong trend; MACD bearish cross below zero accelerates downward momentum; EMA 5/8/13 are bearishly aligned; KDJ bearish (K27.6/D30.0); volume up 5.4x.
Price change: -2.0900%
📉 $CRCL | 30-minute bearish signal
━━━━━━━━━━━━━━━━━━
Technical analysis: ADX (44) indicates a significant trend; MACD bearish cross below zero favors bears; EMA5<EMA8<EMA13 are bearishly aligned; KDJ is weak (K19.9/D20.7); volume up 3.9x.
Price change: -1.5800%
📉 $POL | 30-minute bearish signal
━━━━━━━━━━━━━━━━━━
Technical analysis: ADX (37) indicates a clear trend; MACD bearish cross below zero; EMAs are bearishly aligned; KDJ is oversold (K17.6, D16.9); volume up 3.1x—watch for a rebound.
Price change: -1.5400%
━━━━━━━━━━━━━━━━━━
#技术分析 #W #CRCL #POL
📌 The above content is for reference only and does not constitute investment advice
6
·
--
$W/$CRCL/$POL 30-minute short signal, beware of a pullback🔥
════════════════════
🟢 $W 30-minute short signal
⚠️Technical analysis: ADX indicates a clear trend. The MACD bearish crossover is followed by expanding green bars, accelerating the downtrend. Moving averages are bearishly aligned and diverging downward. KDJ bearish crossover; K is at 27.6, not yet oversold. Trading volume has surged more than 5-fold.
════════════════════
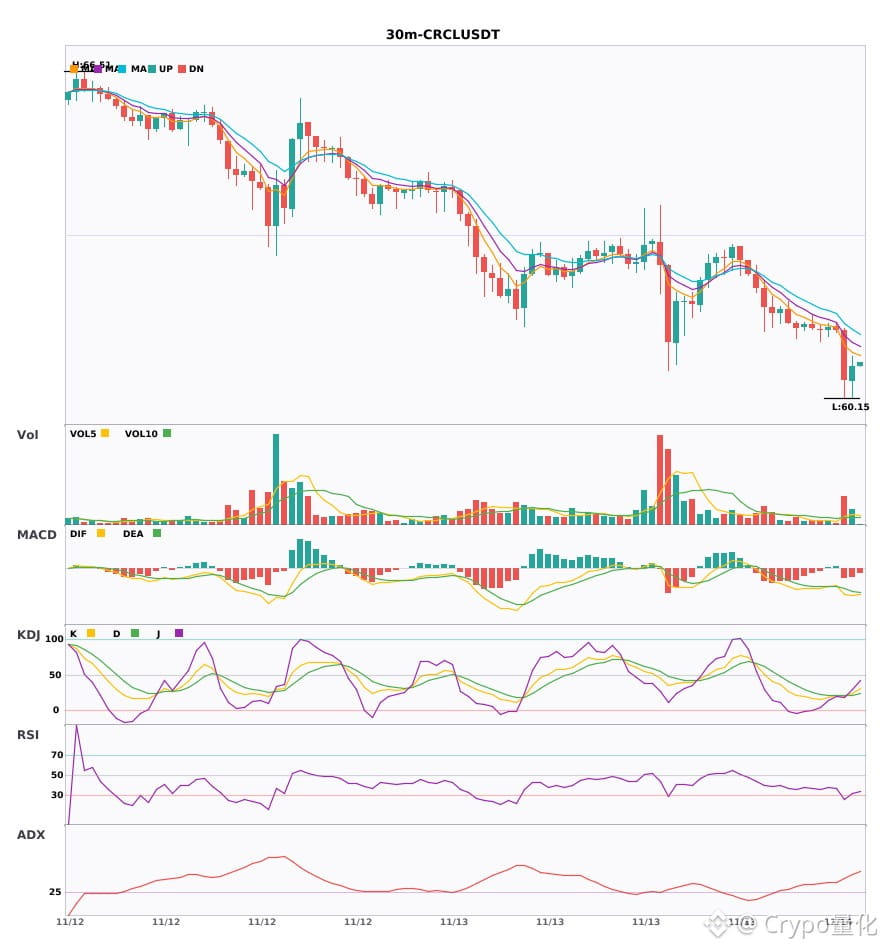
🟢 $CRCL 30-minute short signal
⚠️Technical analysis: ADX at 44 indicates a clear trend. The MACD bearish crossover below zero is accelerating the downtrend. Moving averages are bearishly aligned. KDJ is weak, with K below D (19.9/20.7). Volume is up 3.9-fold; bears are in control.
════════════════════
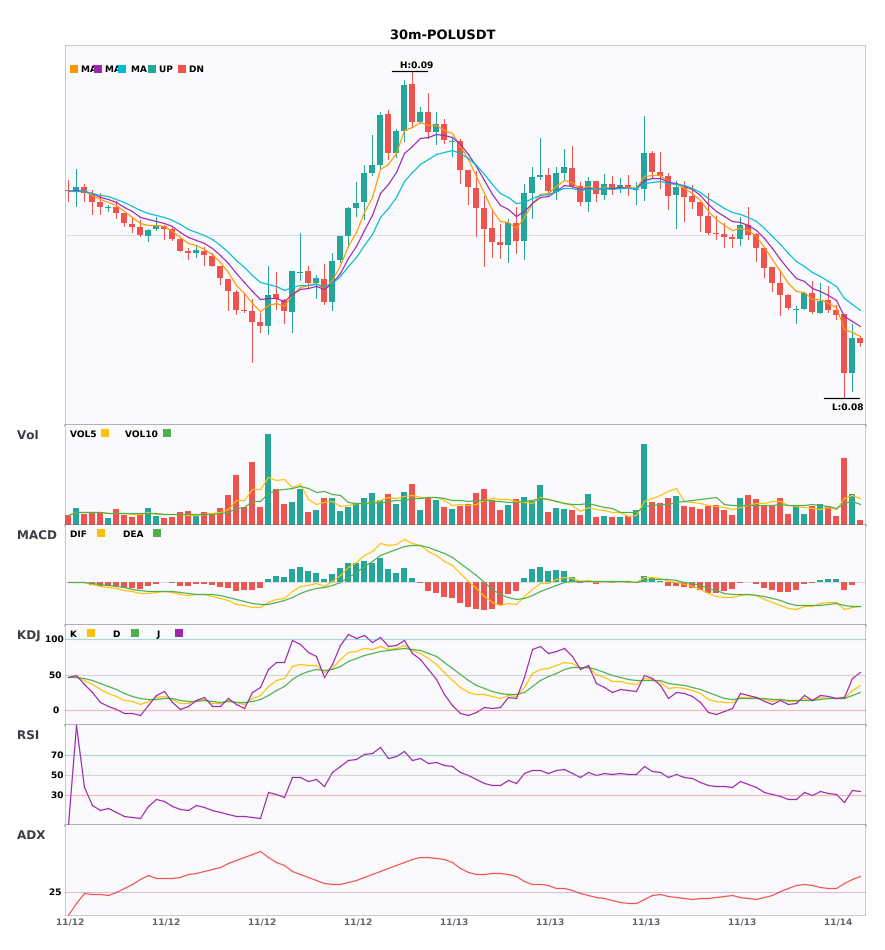
🟢 $POL 30-minute short signal
⚠️Technical analysis: Clear trend. The MACD bearish crossover is driving a high-volume decline. Moving averages have just formed a bearish alignment. KDJ has entered the oversold zone, and K crossing above D hints at a possible rebound. Volume has surged more than 3-fold.
════════════════════
🔔 Follow for first-hand market updates and unusual moves 🔔
#技术分析 #W #CRCL #POL
📌 When trading, pay attention to whether the candlestick pattern confirms the signal.
$W /$CRCL /$POL 30-minute short signal, beware of a pullback🔥
════════════════════
🟢 $W 30-minute short signal
⚠️Technical analysis: ADX indicates a clear trend. The MACD bearish crossover is followed by expanding green bars, accelerating the downtrend. Moving averages are bearishly aligned and diverging downward. KDJ bearish crossover; K is at 27.6, not yet oversold. Trading volume has surged more than 5-fold.
════════════════════
🟢 $CRCL 30-minute short signal
⚠️Technical analysis: ADX at 44 indicates a clear trend. The MACD bearish crossover below zero is accelerating the downtrend. Moving averages are bearishly aligned. KDJ is weak, with K below D (19.9/20.7). Volume is up 3.9-fold; bears are in control.
════════════════════
🟢 $POL 30-minute short signal
⚠️Technical analysis: Clear trend. The MACD bearish crossover is driving a high-volume decline. Moving averages have just formed a bearish alignment. KDJ has entered the oversold zone, and K crossing above D hints at a possible rebound. Volume has surged more than 3-fold.
════════════════════
🔔 Follow for first-hand market updates and unusual moves 🔔
#技术分析 #W #CRCL #POL
📌 When trading, pay attention to whether the candlestick pattern confirms the signal.
════════════════════
🟢 $W 30-minute short signal
⚠️Technical analysis: ADX indicates a clear trend. The MACD bearish crossover is followed by expanding green bars, accelerating the downtrend. Moving averages are bearishly aligned and diverging downward. KDJ bearish crossover; K is at 27.6, not yet oversold. Trading volume has surged more than 5-fold.
════════════════════
🟢 $CRCL 30-minute short signal
⚠️Technical analysis: ADX at 44 indicates a clear trend. The MACD bearish crossover below zero is accelerating the downtrend. Moving averages are bearishly aligned. KDJ is weak, with K below D (19.9/20.7). Volume is up 3.9-fold; bears are in control.
════════════════════
🟢 $POL 30-minute short signal
⚠️Technical analysis: Clear trend. The MACD bearish crossover is driving a high-volume decline. Moving averages have just formed a bearish alignment. KDJ has entered the oversold zone, and K crossing above D hints at a possible rebound. Volume has surged more than 3-fold.
════════════════════
🔔 Follow for first-hand market updates and unusual moves 🔔
#技术分析 #W #CRCL #POL
📌 When trading, pay attention to whether the candlestick pattern confirms the signal.
35

·
--
Bullish
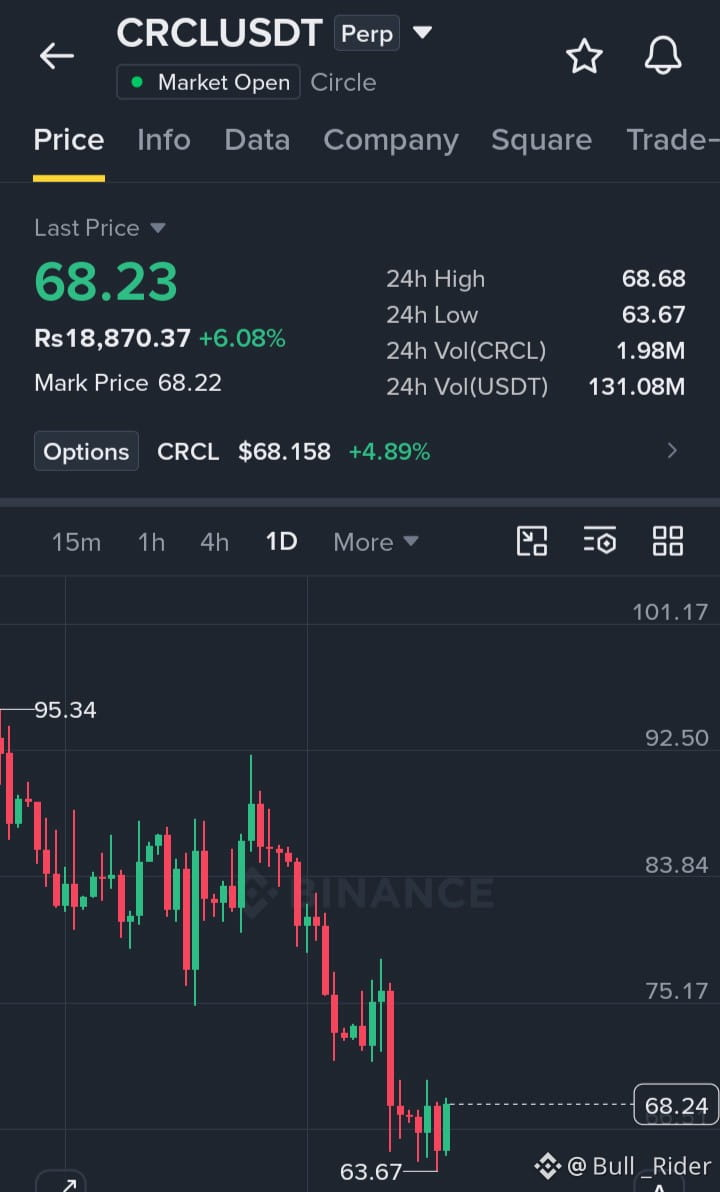
$CRCL is showing strength from support, with buyers gradually taking control and momentum building for a potential continuation move.
Entry: 68.20–69.00
TP1: 75.17
TP2: 83.84
TP3: 92.50
SL: 63.50
Buy and Trade $GRAM
#CRCL $AGT
{alpha}(560x5dbde81fce337ff4bcaaee4ca3466c00aecae274)
{future}(CRCLUSDT)
{future}(GRAMUSDT)
$CRCL is showing strength from support, with buyers gradually taking control and momentum building for a potential continuation move.
Entry: 68.20–69.00
TP1: 75.17
TP2: 83.84
TP3: 92.50
SL: 63.50
Buy and Trade $GRAM
#CRCL $AGT
Entry: 68.20–69.00
TP1: 75.17
TP2: 83.84
TP3: 92.50
SL: 63.50
Buy and Trade $GRAM
#CRCL $AGT
1
67

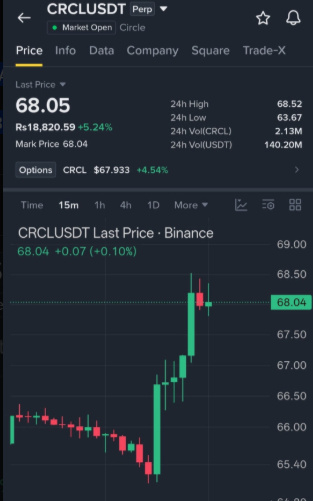
🚀 $CRCL – BULLISH BREAKOUT ALERT!
Buyers are showing strength, and CRCL is setting up for a potential bullish continuation.
🟢 LONG ENTRY: $67.80 – $68.10
🎯 TAKE PROFIT TARGETS:
TP1: $68.50
TP2: $69.00
TP3: $69.50
🛑 STOP LOSS: $67.30
📈 Momentum is favoring buyers. Watch for strong breakout confirmation and sustained support above the entry zone.
⚠️ Manage risk carefully and avoid chasing the price.
#CRCL #LONG #BullishBreakout #TradingSignals #CryptoTrading #BinanceSquare
🚀 $CRCL – BULLISH BREAKOUT ALERT!
Buyers are showing strength, and CRCL is setting up for a potential bullish continuation.
🟢 LONG ENTRY: $67.80 – $68.10
🎯 TAKE PROFIT TARGETS:
TP1: $68.50
TP2: $69.00
TP3: $69.50
🛑 STOP LOSS: $67.30
📈 Momentum is favoring buyers. Watch for strong breakout confirmation and sustained support above the entry zone.
⚠️ Manage risk carefully and avoid chasing the price.
#CRCL #LONG #BullishBreakout #TradingSignals #CryptoTrading #BinanceSquare
Buyers are showing strength, and CRCL is setting up for a potential bullish continuation.
🟢 LONG ENTRY: $67.80 – $68.10
🎯 TAKE PROFIT TARGETS:
TP1: $68.50
TP2: $69.00
TP3: $69.50
🛑 STOP LOSS: $67.30
📈 Momentum is favoring buyers. Watch for strong breakout confirmation and sustained support above the entry zone.
⚠️ Manage risk carefully and avoid chasing the price.
#CRCL #LONG #BullishBreakout #TradingSignals #CryptoTrading #BinanceSquare
142

$CRCL SHORT
The signal is based only on zones.
The signal has no RSI, VOL, or OI.
🏁Entry: 63.37
💰Target 1: 62.51786528 (+1.34%)
💰Target 2: 61.35573057 (+3.18%)
💰Target 3: 59.61252849 (+5.93%)
🛡Stop-loss: 65.42320208 (-3.24%)
This makes the structure conditional.
⚠️ This is not financial advice. Trade at your own risk. DYOR.
#CRCL #RiskManagement
$CRCL SHORT
The signal is based only on zones.
The signal has no RSI, VOL, or OI.
🏁Entry: 63.37
💰Target 1: 62.51786528 (+1.34%)
💰Target 2: 61.35573057 (+3.18%)
💰Target 3: 59.61252849 (+5.93%)
🛡Stop-loss: 65.42320208 (-3.24%)
This makes the structure conditional.
⚠️ This is not financial advice. Trade at your own risk. DYOR.
#CRCL #RiskManagement
The signal is based only on zones.
The signal has no RSI, VOL, or OI.
🏁Entry: 63.37
💰Target 1: 62.51786528 (+1.34%)
💰Target 2: 61.35573057 (+3.18%)
💰Target 3: 59.61252849 (+5.93%)
🛡Stop-loss: 65.42320208 (-3.24%)
This makes the structure conditional.
⚠️ This is not financial advice. Trade at your own risk. DYOR.
#CRCL #RiskManagement
11
·
--
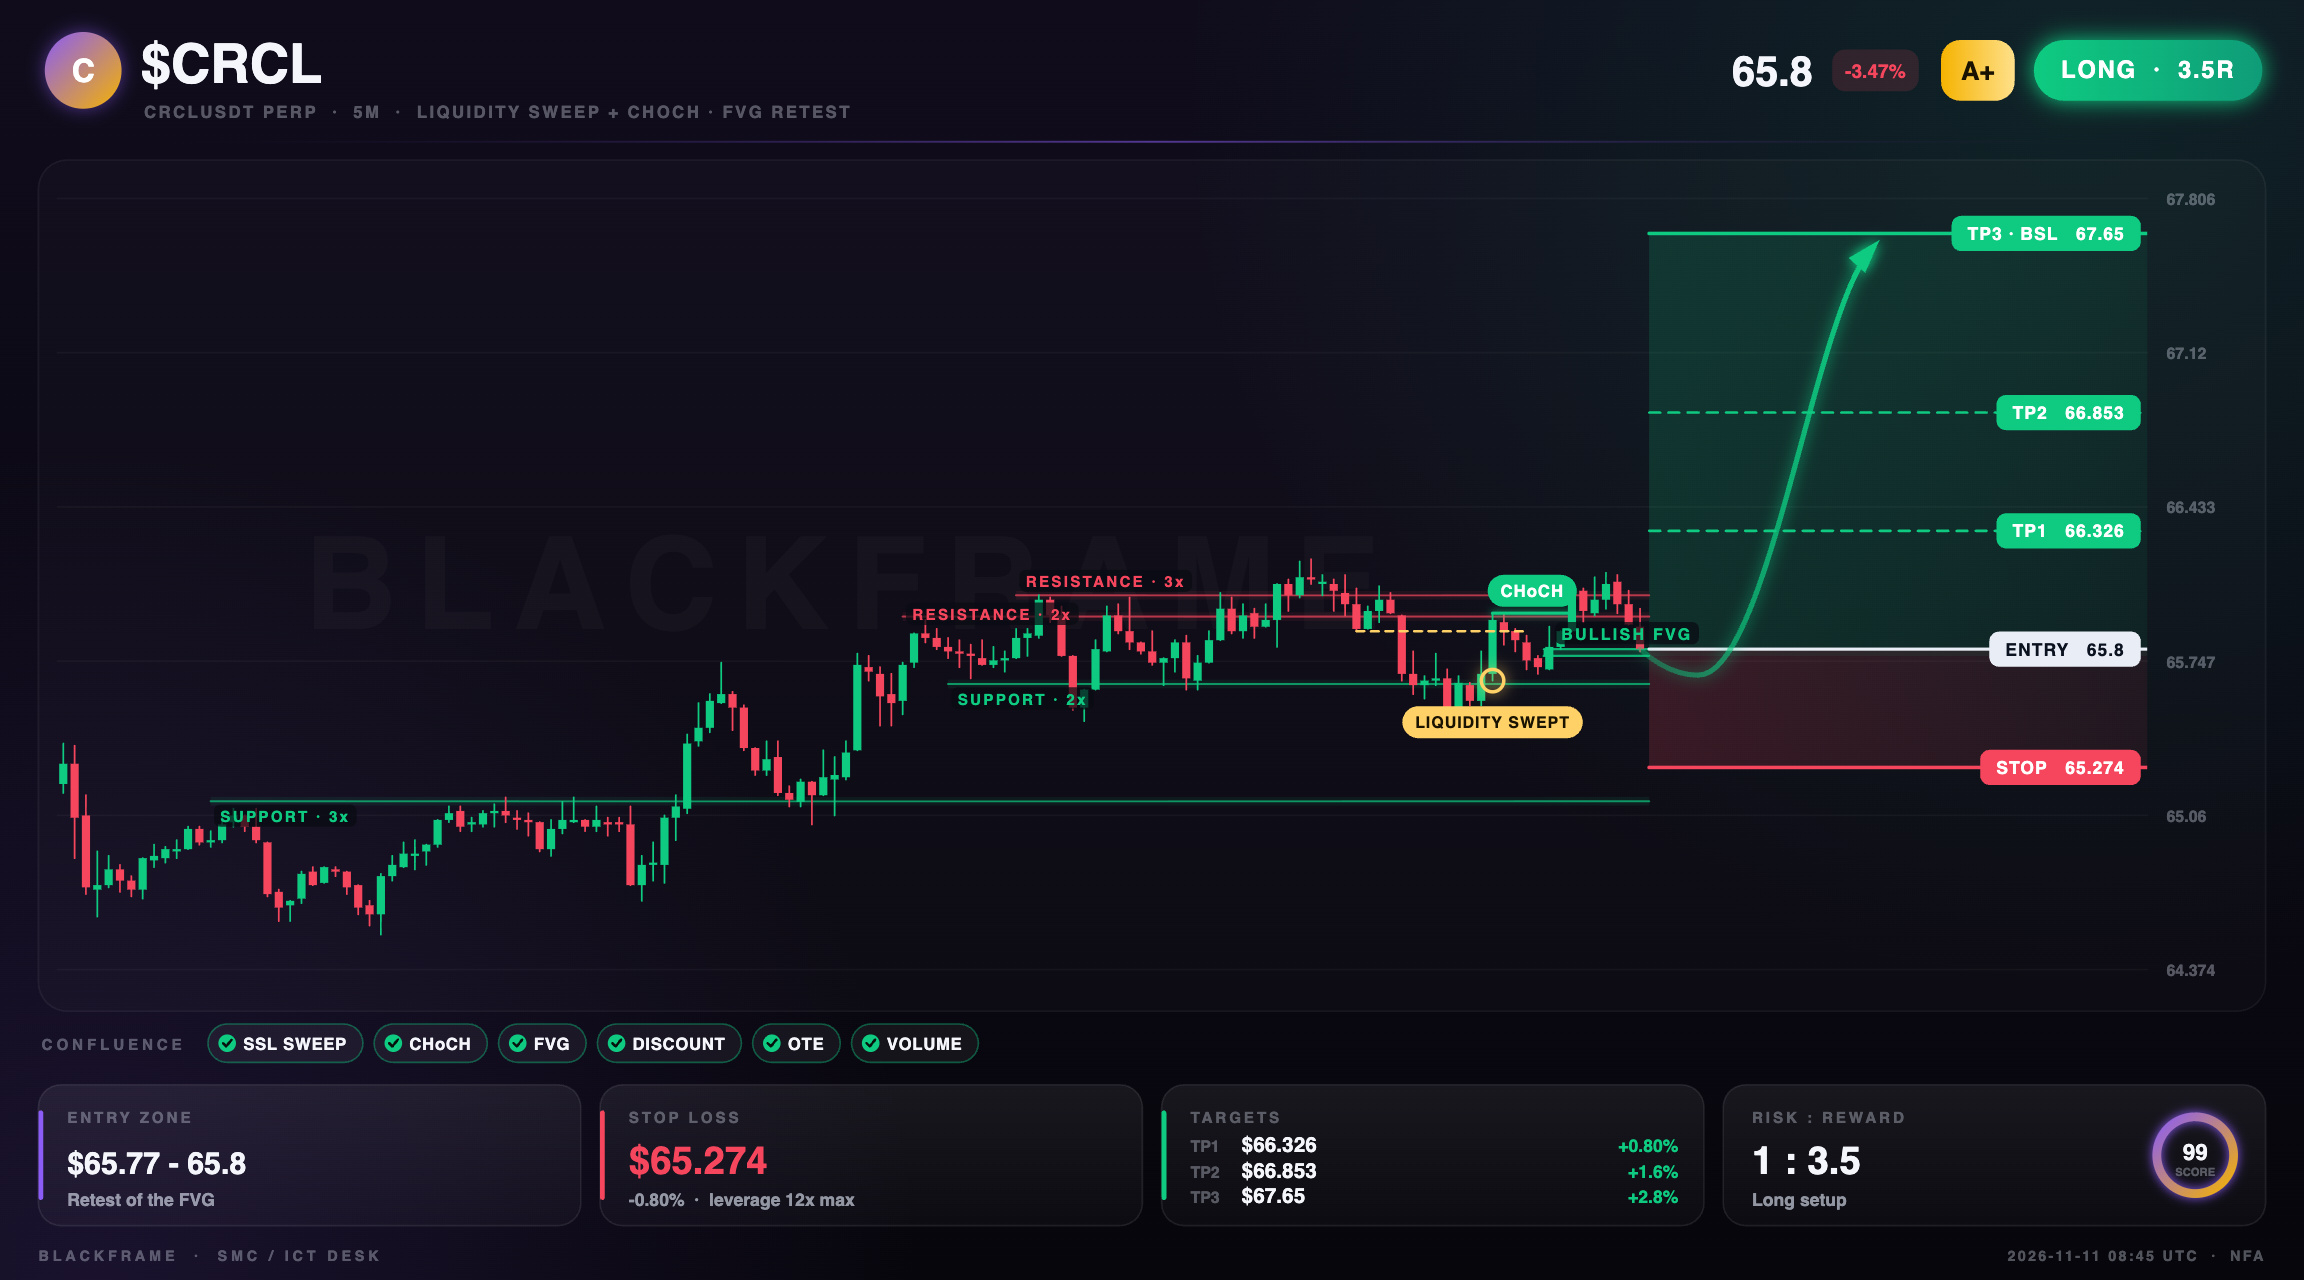
⚡ $CRCL: stop hunt below, CHoCH up
LONG · 5M
Entry: $65.8
TP1: $66.326
TP2: $66.853
TP3: $67.65
SL: $65.274
Sell-side liquidity below the last swing low was swept and price closed back inside. Structure then flipped bullish with a CHoCH on the 5M. Entry is the first retest of the fresh bullish fair value gap in discount, targeting buy-side liquidity above.
#CRCL #SMC · NFA
⚡ $CRCL : stop hunt below, CHoCH up
LONG · 5M
Entry: $65.8
TP1: $66.326
TP2: $66.853
TP3: $67.65
SL: $65.274
Sell-side liquidity below the last swing low was swept and price closed back inside. Structure then flipped bullish with a CHoCH on the 5M. Entry is the first retest of the fresh bullish fair value gap in discount, targeting buy-side liquidity above.
#CRCL #SMC · NFA
LONG · 5M
Entry: $65.8
TP1: $66.326
TP2: $66.853
TP3: $67.65
SL: $65.274
Sell-side liquidity below the last swing low was swept and price closed back inside. Structure then flipped bullish with a CHoCH on the 5M. Entry is the first retest of the fresh bullish fair value gap in discount, targeting buy-side liquidity above.
#CRCL #SMC · NFA
31

·
--
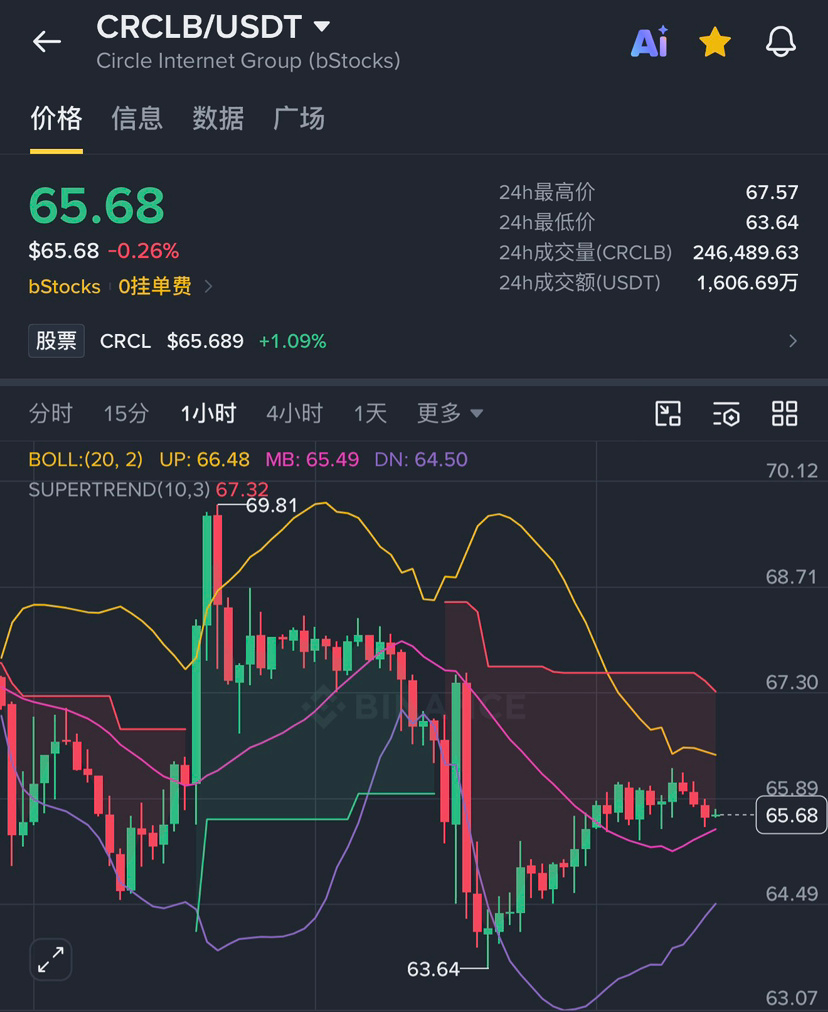
$CRCLB These past couple of days, what I said last time—that "every high is lower than the previous one"—has come true.
Yesterday in the early hours, I wrote that after bottoming out at 64.55, it climbed to 69.81, then got pushed back down to 68.15 by a bearish candle. I said that every time it rallied, the highs were getting lower.
Later, it spent most of the day grinding between 67 and 68. I thought to myself: it's consolidating; it should be heading up.
But then last night, one huge bearish candle smashed straight through 65, plunging all the way to 63.64 and even breaking below the previous low of 64.55.
Now it's nearly ten on Wednesday night. It's at 65.69, up just 3.2% from 63.64.
Since that spike to 78.00, it's already fallen 15.8%. The bottoms we thought we'd found last week—65.82 and 64.55—are now both behind us.
Every rebound has stalled at a lower point than the last: 78, 74.8, 69.81. Now it can't even hold above 67.
The most gut-wrenching part isn't the drop. It's that every time I say, "It's stable this time," it answers with a bearish candle telling me no.
Did you manage to buy in around 63.6, or are you like me, thinking every time that it's stable now?
#Circle #CRCL #CPI高于预期,美股与BTC再度承压 #新人宝典:从零了解TradFi
{spot}(CRCLBUSDT)
$CRCLB These past couple of days, what I said last time—that "every high is lower than the previous one"—has come true.
Yesterday in the early hours, I wrote that after bottoming out at 64.55, it climbed to 69.81, then got pushed back down to 68.15 by a bearish candle. I said that every time it rallied, the highs were getting lower.
Later, it spent most of the day grinding between 67 and 68. I thought to myself: it's consolidating; it should be heading up.
But then last night, one huge bearish candle smashed straight through 65, plunging all the way to 63.64 and even breaking below the previous low of 64.55.
Now it's nearly ten on Wednesday night. It's at 65.69, up just 3.2% from 63.64.
Since that spike to 78.00, it's already fallen 15.8%. The bottoms we thought we'd found last week—65.82 and 64.55—are now both behind us.
Every rebound has stalled at a lower point than the last: 78, 74.8, 69.81. Now it can't even hold above 67.
The most gut-wrenching part isn't the drop. It's that every time I say, "It's stable this time," it answers with a bearish candle telling me no.
Did you manage to buy in around 63.6, or are you like me, thinking every time that it's stable now?
#Circle #CRCL #CPI高于预期,美股与BTC再度承压 #新人宝典:从零了解TradFi
Yesterday in the early hours, I wrote that after bottoming out at 64.55, it climbed to 69.81, then got pushed back down to 68.15 by a bearish candle. I said that every time it rallied, the highs were getting lower.
Later, it spent most of the day grinding between 67 and 68. I thought to myself: it's consolidating; it should be heading up.
But then last night, one huge bearish candle smashed straight through 65, plunging all the way to 63.64 and even breaking below the previous low of 64.55.
Now it's nearly ten on Wednesday night. It's at 65.69, up just 3.2% from 63.64.
Since that spike to 78.00, it's already fallen 15.8%. The bottoms we thought we'd found last week—65.82 and 64.55—are now both behind us.
Every rebound has stalled at a lower point than the last: 78, 74.8, 69.81. Now it can't even hold above 67.
The most gut-wrenching part isn't the drop. It's that every time I say, "It's stable this time," it answers with a bearish candle telling me no.
Did you manage to buy in around 63.6, or are you like me, thinking every time that it's stable now?
#Circle #CRCL #CPI高于预期,美股与BTC再度承压 #新人宝典:从零了解TradFi
3
3.6k
Log in to explore more content
Join global crypto users on Binance Square
⚡️ Get latest and useful information about crypto.
💬 Trusted by the world’s largest crypto exchange.
👍 Discover real insights from verified creators.
Email / Phone number
Trending Topics
1
#CryptoSelloffTriggersMultipleWhaleLiquidations
157,142 views
1,671 Discussing
2
#USSpotXRPETFsSeeLargestWeeklyOutflowIn8Months
145,772 views
1,493 Discussing
3
#WillFOMCMinutesReinforceRateHikeExpectations?
41,066 views
689 Discussing
4
#BitcoinActiveSupplyInProfitDropsBelow45%
221,031 views
1,756 Discussing
5
#TONStrategyReports$23.97MQ3NetLoss
19,198 views
139 Discussing
6
#KavaSaysAbnormalActivityLimitedToKavaLend
146,169 views
991 Discussing
7
#WORPTLetsTouristsConvertCryptoToThaiBaht
50,313 views
396 Discussing
8
#WhoWillSucceedJensenHuangatNvidia?
341,972 views
2,144 Discussing
9
#WhatWillDriveCryptoandStocks’NextRebound?
864,636 views
3,957 Discussing
10
#TradFiForBeginners
841,971 views
4,962 Discussing