
#candlesticks
candlesticks
12,024 views
80 Discussing
Hot
Latest

·
--
📚 Crypto Education — Candlesticks
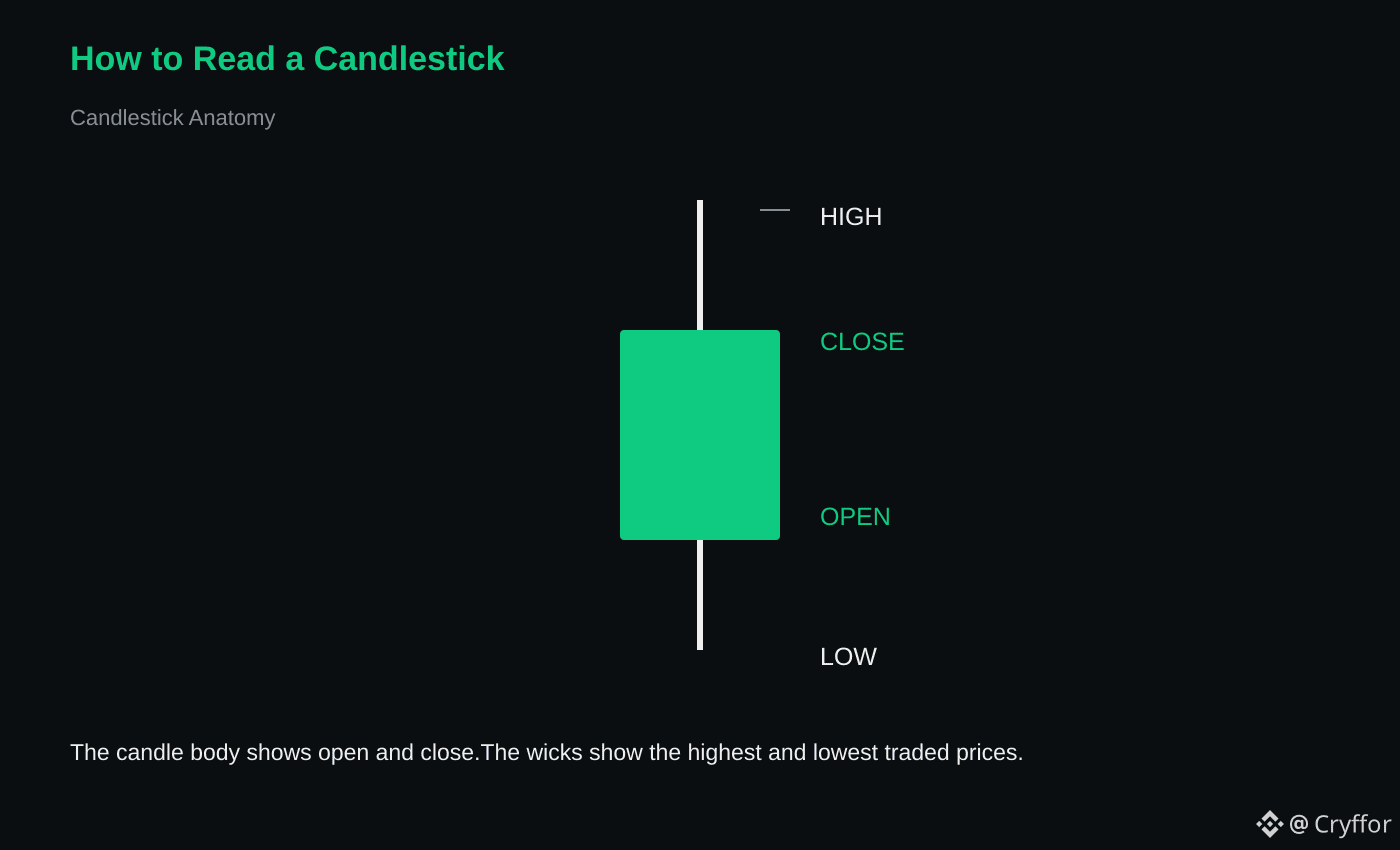
🟢 Bullish candle: buyers controlled the period.
🔴 Bearish candle: sellers controlled the period.
📍 The wick shows where price traded but failed to hold.
📊 Candles become more useful with:
🔎 Support/resistance
📈 Trend
⚡ Volume
👀 Higher-timeframe structure
🤔 Which candle pattern do you watch most?
#CryptoEducation #Binance #Candlesticks #Trading
📚 Crypto Education — Candlesticks
🟢 Bullish candle: buyers controlled the period.
🔴 Bearish candle: sellers controlled the period.
📍 The wick shows where price traded but failed to hold.
📊 Candles become more useful with:
🔎 Support/resistance
📈 Trend
⚡ Volume
👀 Higher-timeframe structure
🤔 Which candle pattern do you watch most?
#CryptoEducation #Binance #Candlesticks #Trading
🟢 Bullish candle: buyers controlled the period.
🔴 Bearish candle: sellers controlled the period.
📍 The wick shows where price traded but failed to hold.
📊 Candles become more useful with:
🔎 Support/resistance
📈 Trend
⚡ Volume
👀 Higher-timeframe structure
🤔 Which candle pattern do you watch most?
#CryptoEducation #Binance #Candlesticks #Trading
9


Article
📊 Japanese Candlesticks and Heikin Ashi: a complete breakdown for beginners and prosHello, traders! Let’s break down two key tools of technical analysis—classic Japanese candlesticks and their “smoothed” cousin, Heikin Ashi. Understanding the difference between them really improves the quality of your entries and exits.
$IOST $SOLV $UAI
1. Japanese candlesticks (classic) 🕯️
The foundation that shows the actual price for the selected period.
📊 Japanese Candlesticks and Heikin Ashi: a complete breakdown for beginners and pros
Hello, traders! Let’s break down two key tools of technical analysis—classic Japanese candlesticks and their “smoothed” cousin, Heikin Ashi. Understanding the difference between them really improves the quality of your entries and exits.
$IOST $SOLV $UAI
1. Japanese candlesticks (classic) 🕯️
The foundation that shows the actual price for the selected period.
$IOST $SOLV $UAI
1. Japanese candlesticks (classic) 🕯️
The foundation that shows the actual price for the selected period.
157
·
--
📚 Crypto Education — Candlesticks
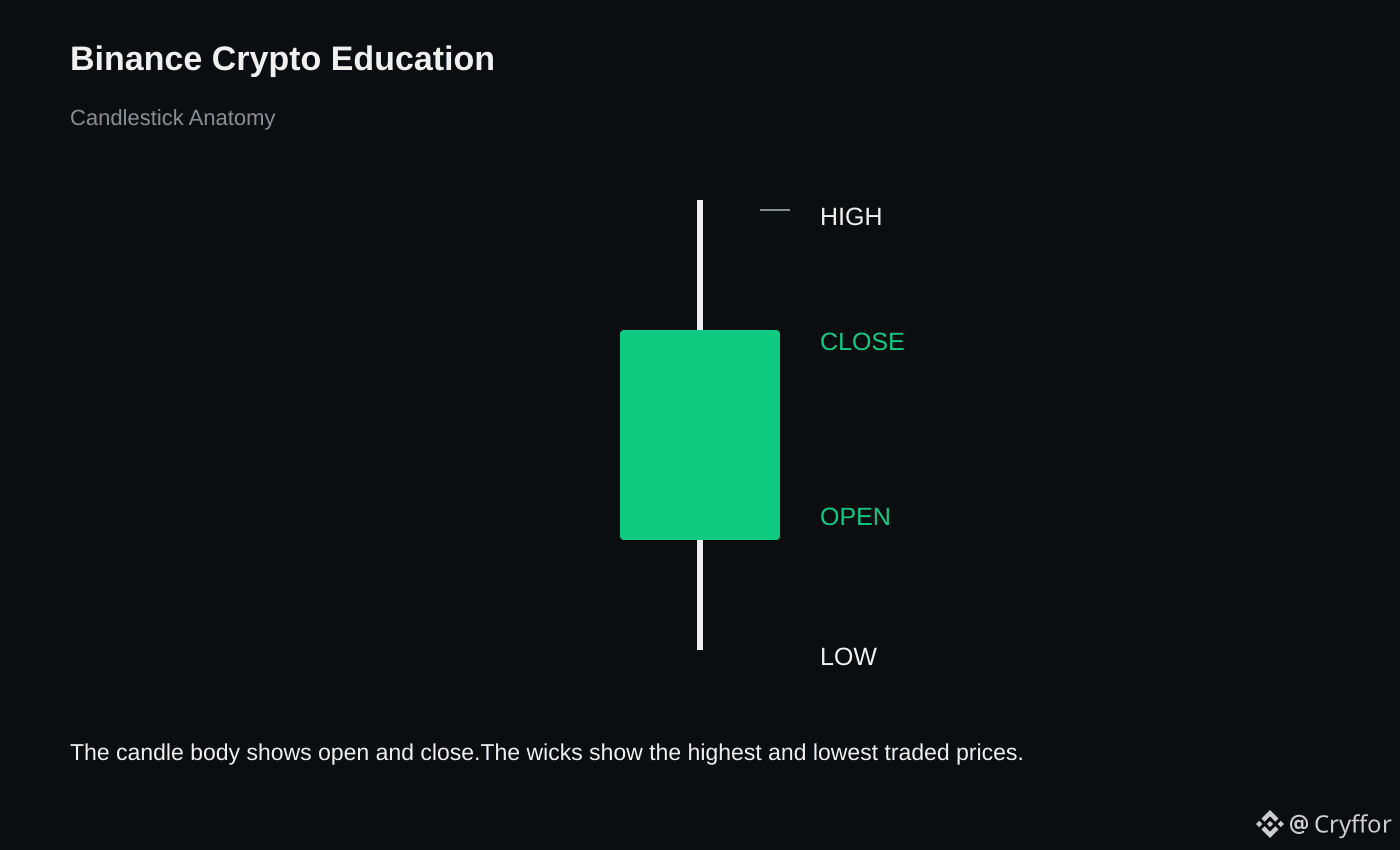
🟢 Bullish candle: buyers controlled the period.
🔴 Bearish candle: sellers controlled the period.
📍 The wick shows where price traded but failed to hold.
📊 Candles become more useful with:
🔎 Support/resistance
📈 Trend
⚡ Volume
👀 Higher-timeframe structure
🤔 Which candle pattern do you watch most?
#CryptoEducation #Binance #Candlesticks #Trading
📚 Crypto Education — Candlesticks
🟢 Bullish candle: buyers controlled the period.
🔴 Bearish candle: sellers controlled the period.
📍 The wick shows where price traded but failed to hold.
📊 Candles become more useful with:
🔎 Support/resistance
📈 Trend
⚡ Volume
👀 Higher-timeframe structure
🤔 Which candle pattern do you watch most?
#CryptoEducation #Binance #Candlesticks #Trading
🟢 Bullish candle: buyers controlled the period.
🔴 Bearish candle: sellers controlled the period.
📍 The wick shows where price traded but failed to hold.
📊 Candles become more useful with:
🔎 Support/resistance
📈 Trend
⚡ Volume
👀 Higher-timeframe structure
🤔 Which candle pattern do you watch most?
#CryptoEducation #Binance #Candlesticks #Trading
38

🚨 STOP LOSING FUTURES TRADES POINTLESSLY 🚨
Here’s a simple habit that can help you avoid rushing into trades:
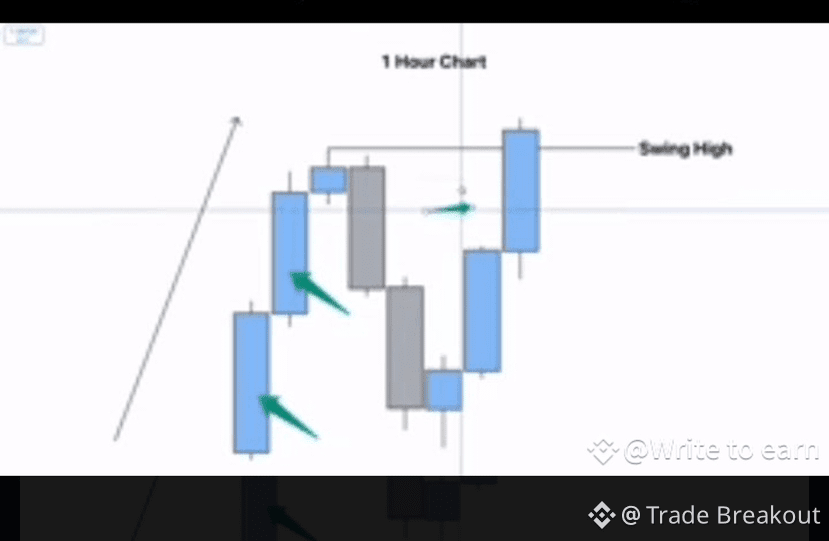
📌 Wait for the candlestick to close before entering.
A candle’s closing price gives you a clearer picture of where the market actually finished before the next candle begins.
Why wait? 👇
A candle can move strongly in one direction and then reverse before it closes. Waiting for confirmation can help you avoid reacting to temporary price moves.
Stay patient. Don’t chase every candle. Trade with a plan. 📊
#Trading #Candlesticks #Futures
🚨 STOP LOSING FUTURES TRADES POINTLESSLY 🚨
Here’s a simple habit that can help you avoid rushing into trades:
📌 Wait for the candlestick to close before entering.
A candle’s closing price gives you a clearer picture of where the market actually finished before the next candle begins.
Why wait? 👇
A candle can move strongly in one direction and then reverse before it closes. Waiting for confirmation can help you avoid reacting to temporary price moves.
Stay patient. Don’t chase every candle. Trade with a plan. 📊
#Trading #Candlesticks #Futures
Here’s a simple habit that can help you avoid rushing into trades:
📌 Wait for the candlestick to close before entering.
A candle’s closing price gives you a clearer picture of where the market actually finished before the next candle begins.
Why wait? 👇
A candle can move strongly in one direction and then reverse before it closes. Waiting for confirmation can help you avoid reacting to temporary price moves.
Stay patient. Don’t chase every candle. Trade with a plan. 📊
#Trading #Candlesticks #Futures
15

·
--
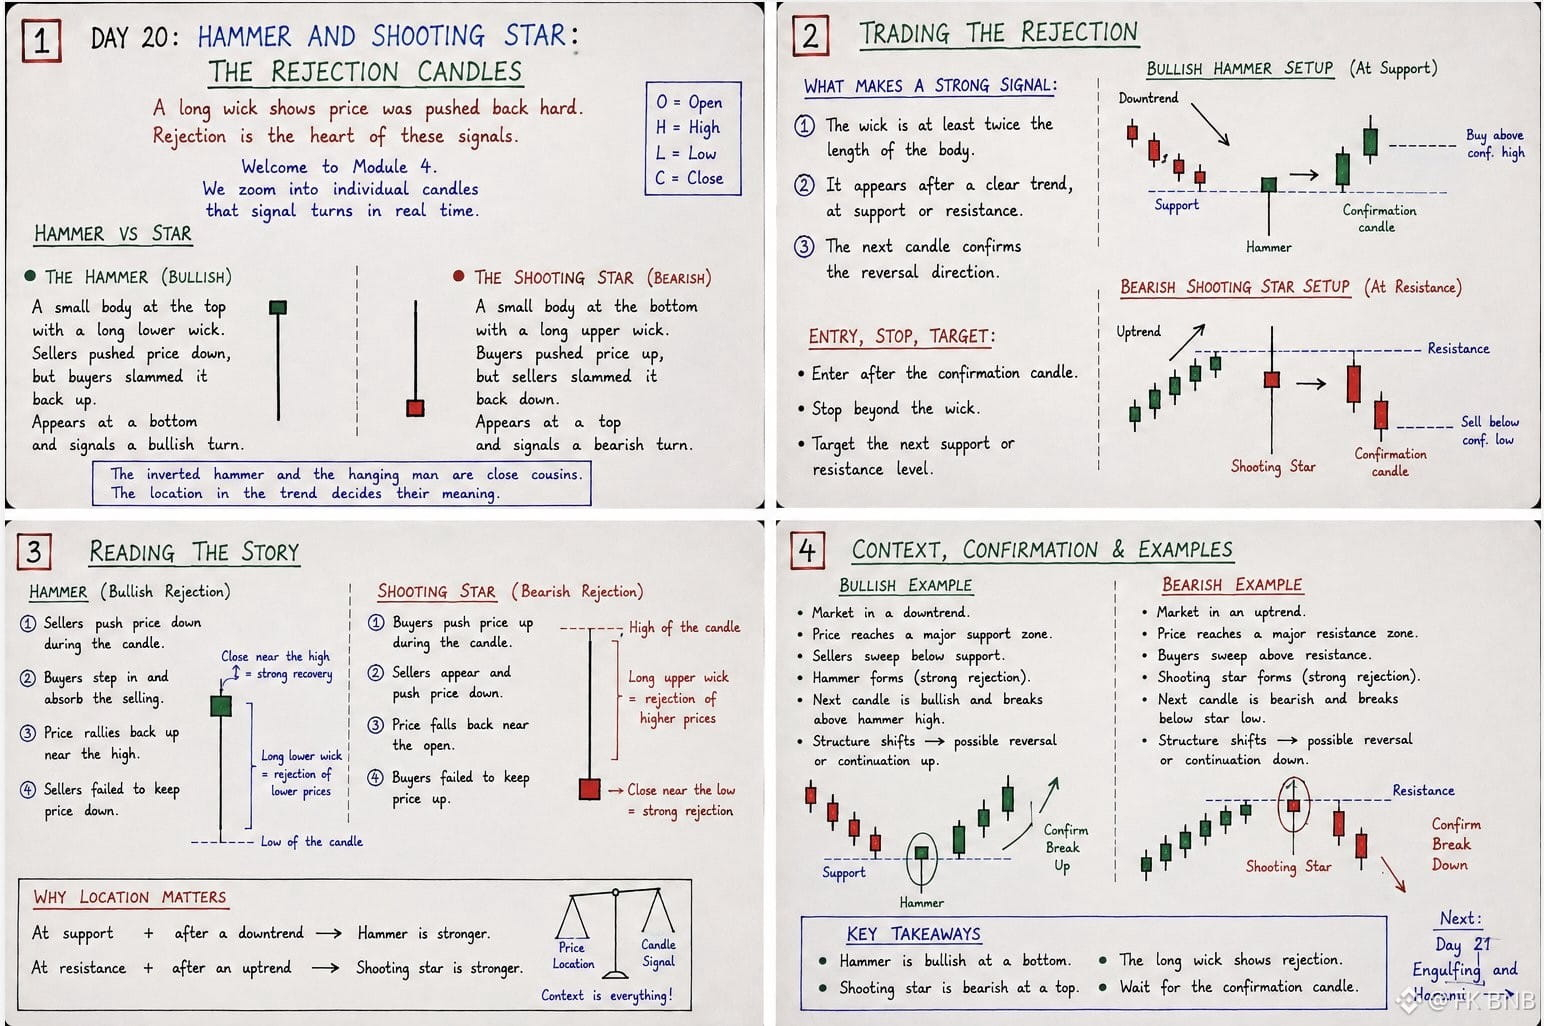
CHART PATTERNS MASTERY COURSE: MODULE 4: CANDLESTICK PATTERNS | DAY 20
HAMMER AND SHOOTING STAR: The Rejection Candles
A long wick shows price was pushed back hard. Rejection is the heart of these signals.
HAMMER VS STAR
🟢 THE HAMMER (bullish)
A small body at the top with a long lower wick. Sellers pushed price down, but buyers slammed it back up. Appears at a bottom and signals a bullish turn.
🔴 THE SHOOTING STAR (bearish)
A small body at the bottom with a long upper wick. Buyers pushed price up, but sellers slammed it back down. Appears at a top and signals a bearish turn.
The inverted hammer and the hanging man are close cousins. The location in the trend decides their meaning.
TRADING THE REJECTION
WHAT MAKES A STRONG SIGNAL:
1️⃣ The wick is at least twice the length of the body.
2️⃣ It appears after a clear trend, at support or resistance.
3️⃣ The next candle confirms the reversal direction.
ENTRY, STOP, TARGET: Enter after the confirmation candle. Stop beyond the wick. Target the next support or resistance level.
DAY 20 KEY TAKEAWAYS
🔹 Hammer is bullish at a bottom
🔹 Shooting star is bearish at a top
🔹 The long wick shows rejection
🔹 Wait for the confirmation candle
Next: Day 21 | Engulfing and Harami ➡️
#Hammer #Candlesticks #ChartPatterns
CHART PATTERNS MASTERY COURSE: MODULE 4: CANDLESTICK PATTERNS | DAY 20
HAMMER AND SHOOTING STAR: The Rejection Candles
A long wick shows price was pushed back hard. Rejection is the heart of these signals.
HAMMER VS STAR
🟢 THE HAMMER (bullish)
A small body at the top with a long lower wick. Sellers pushed price down, but buyers slammed it back up. Appears at a bottom and signals a bullish turn.
🔴 THE SHOOTING STAR (bearish)
A small body at the bottom with a long upper wick. Buyers pushed price up, but sellers slammed it back down. Appears at a top and signals a bearish turn.
The inverted hammer and the hanging man are close cousins. The location in the trend decides their meaning.
TRADING THE REJECTION
WHAT MAKES A STRONG SIGNAL:
1️⃣ The wick is at least twice the length of the body.
2️⃣ It appears after a clear trend, at support or resistance.
3️⃣ The next candle confirms the reversal direction.
ENTRY, STOP, TARGET: Enter after the confirmation candle. Stop beyond the wick. Target the next support or resistance level.
DAY 20 KEY TAKEAWAYS
🔹 Hammer is bullish at a bottom
🔹 Shooting star is bearish at a top
🔹 The long wick shows rejection
🔹 Wait for the confirmation candle
Next: Day 21 | Engulfing and Harami ➡️
#Hammer #Candlesticks #ChartPatterns
HAMMER AND SHOOTING STAR: The Rejection Candles
A long wick shows price was pushed back hard. Rejection is the heart of these signals.
HAMMER VS STAR
🟢 THE HAMMER (bullish)
A small body at the top with a long lower wick. Sellers pushed price down, but buyers slammed it back up. Appears at a bottom and signals a bullish turn.
🔴 THE SHOOTING STAR (bearish)
A small body at the bottom with a long upper wick. Buyers pushed price up, but sellers slammed it back down. Appears at a top and signals a bearish turn.
The inverted hammer and the hanging man are close cousins. The location in the trend decides their meaning.
TRADING THE REJECTION
WHAT MAKES A STRONG SIGNAL:
1️⃣ The wick is at least twice the length of the body.
2️⃣ It appears after a clear trend, at support or resistance.
3️⃣ The next candle confirms the reversal direction.
ENTRY, STOP, TARGET: Enter after the confirmation candle. Stop beyond the wick. Target the next support or resistance level.
DAY 20 KEY TAKEAWAYS
🔹 Hammer is bullish at a bottom
🔹 Shooting star is bearish at a top
🔹 The long wick shows rejection
🔹 Wait for the confirmation candle
Next: Day 21 | Engulfing and Harami ➡️
#Hammer #Candlesticks #ChartPatterns
2
20

·
--
Bullish
GM dear my #AlphaFamily today education for traders
📘 Candlestick Patterns Every Trader Should Know
Market’s decision on entry and exit is made using candlesticks. If you understand them, you get ahead of 50% of traders.
🔥 3 Important Candlestick Patterns:
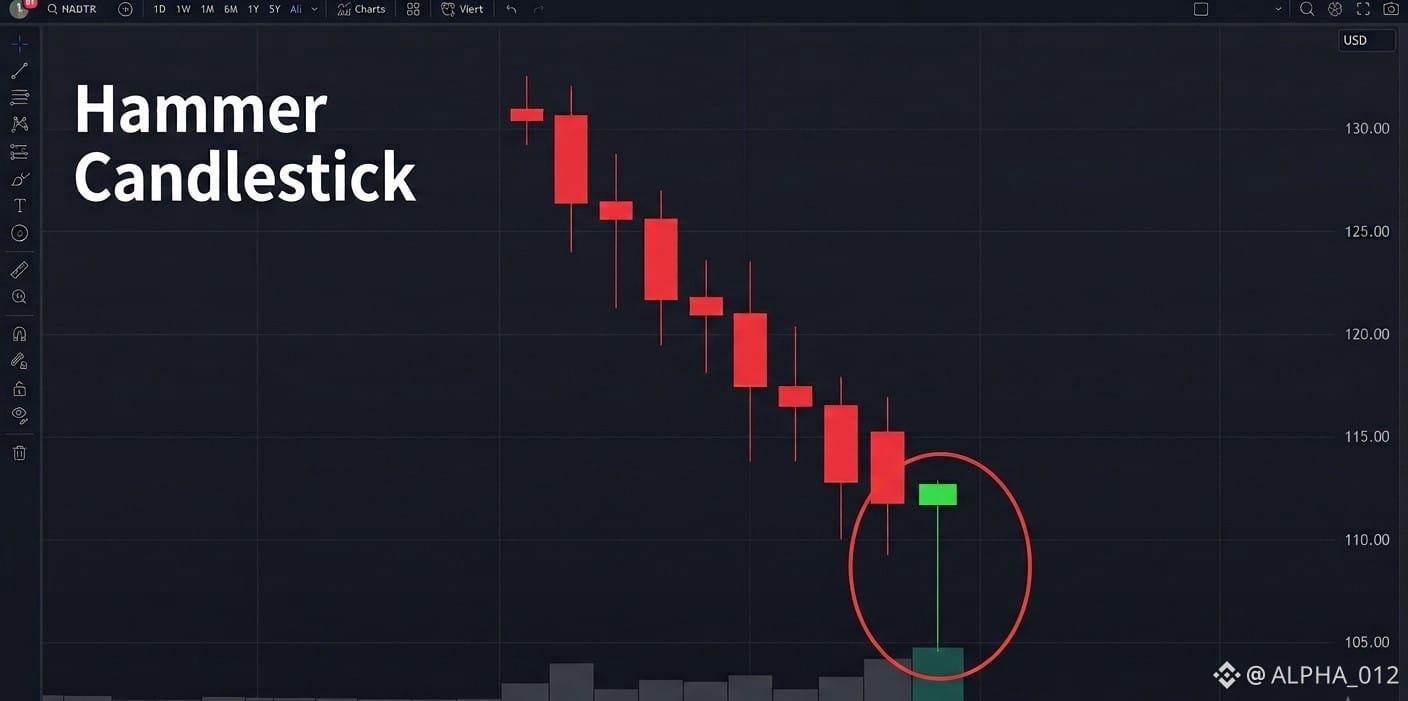
1. Hammer (Bullish Reversal)
· Long lower wick, small body.
· Appears after dips — a signal that the downtrend may be ending.
· Best Timeframe: 1H, 4H, Daily
· Where to use: Near the support zone
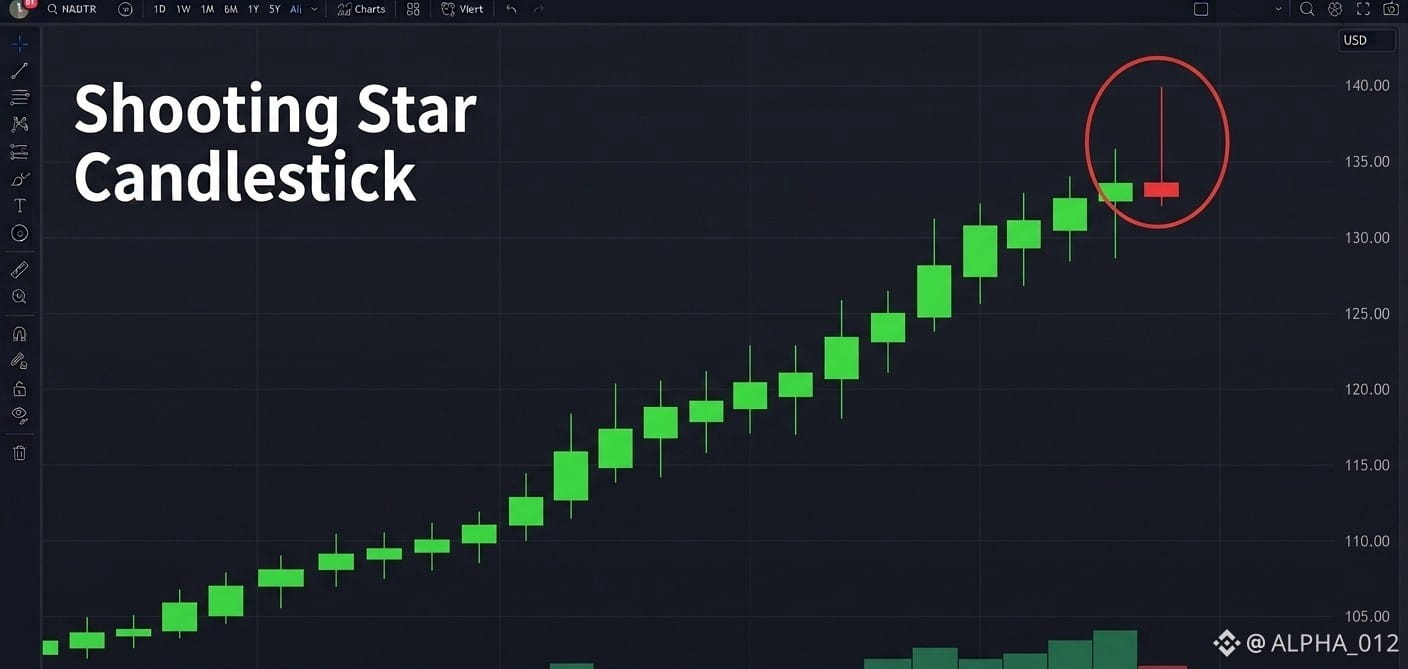
2. Shooting Star (Bearish Reversal)
· Long upper wick, small body.
· Appears at the end of an uptrend.
· Best Timeframe: 1H, 4H, Daily
· Where to use: Near the resistance zone
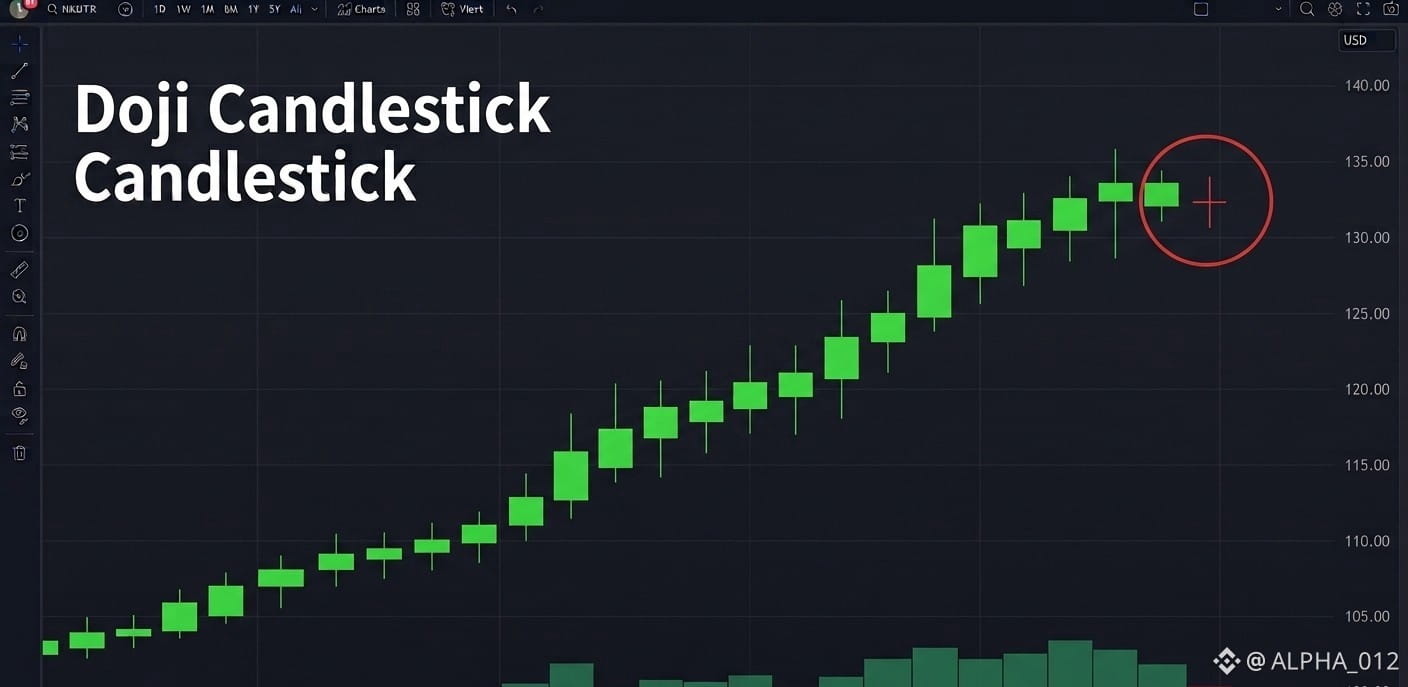
3. Doji (Indecision)
· Body is almost zero — open and close are at the same level.
· The market is confused — wait for the breakout.
· Best Timeframe: 15m, 1H (scalping), 4H (swing)
· Where to use: Before a breakout or breakdown
🧠 Pro Tip:
· Don’t trade with a single candle.
· Wait for the next candle for confirmation.
· Always watch the volume.
Do you use these patterns? Share your experience in the comments! 👇
DYOR. 🙏
#CryptoEducation #Candlesticks #TradingTips
$BLUAI
{future}(BLUAIUSDT)
$VELVET
{future}(VELVETUSDT)
$TUT
{future}(TUTUSDT)
GM dear my #AlphaFamily today education for traders
📘 Candlestick Patterns Every Trader Should Know
Market’s decision on entry and exit is made using candlesticks. If you understand them, you get ahead of 50% of traders.
🔥 3 Important Candlestick Patterns:
1. Hammer (Bullish Reversal)
· Long lower wick, small body.
· Appears after dips — a signal that the downtrend may be ending.
· Best Timeframe: 1H, 4H, Daily
· Where to use: Near the support zone
2. Shooting Star (Bearish Reversal)
· Long upper wick, small body.
· Appears at the end of an uptrend.
· Best Timeframe: 1H, 4H, Daily
· Where to use: Near the resistance zone
3. Doji (Indecision)
· Body is almost zero — open and close are at the same level.
· The market is confused — wait for the breakout.
· Best Timeframe: 15m, 1H (scalping), 4H (swing)
· Where to use: Before a breakout or breakdown
🧠 Pro Tip:
· Don’t trade with a single candle.
· Wait for the next candle for confirmation.
· Always watch the volume.
Do you use these patterns? Share your experience in the comments! 👇
DYOR. 🙏
#CryptoEducation #Candlesticks #TradingTips
$BLUAI
$VELVET
$TUT
📘 Candlestick Patterns Every Trader Should Know
Market’s decision on entry and exit is made using candlesticks. If you understand them, you get ahead of 50% of traders.
🔥 3 Important Candlestick Patterns:
1. Hammer (Bullish Reversal)
· Long lower wick, small body.
· Appears after dips — a signal that the downtrend may be ending.
· Best Timeframe: 1H, 4H, Daily
· Where to use: Near the support zone
2. Shooting Star (Bearish Reversal)
· Long upper wick, small body.
· Appears at the end of an uptrend.
· Best Timeframe: 1H, 4H, Daily
· Where to use: Near the resistance zone
3. Doji (Indecision)
· Body is almost zero — open and close are at the same level.
· The market is confused — wait for the breakout.
· Best Timeframe: 15m, 1H (scalping), 4H (swing)
· Where to use: Before a breakout or breakdown
🧠 Pro Tip:
· Don’t trade with a single candle.
· Wait for the next candle for confirmation.
· Always watch the volume.
Do you use these patterns? Share your experience in the comments! 👇
DYOR. 🙏
#CryptoEducation #Candlesticks #TradingTips
$BLUAI
$VELVET
$TUT
368

·
--
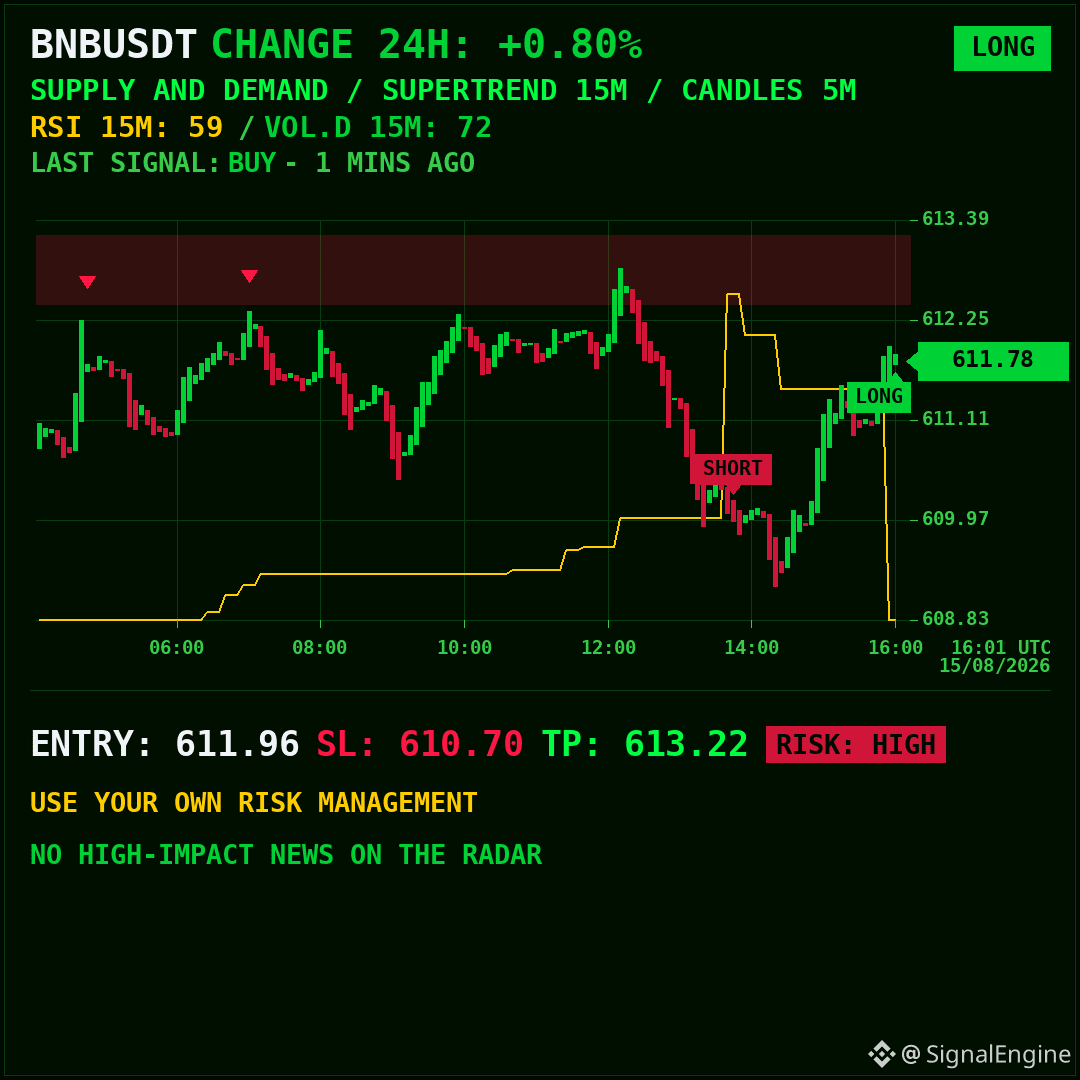
🟢 LONG SIGNAL · $BNB (BNBUSDT)
ENTRY: 611.96 · SL: 610.70 · TP: 613.22 · R/R: 1:1.0 · RISK: HIGH 🔴
15/08/2026 🗓️ 16:01 UTC 🌐
Fresh print, clean chart, let it cook.
#BNB #Candlesticks
🟢 LONG SIGNAL · $BNB (BNBUSDT)
ENTRY: 611.96 · SL: 610.70 · TP: 613.22 · R/R: 1:1.0 · RISK: HIGH 🔴
15/08/2026 🗓️ 16:01 UTC 🌐
Fresh print, clean chart, let it cook.
#BNB #Candlesticks
ENTRY: 611.96 · SL: 610.70 · TP: 613.22 · R/R: 1:1.0 · RISK: HIGH 🔴
15/08/2026 🗓️ 16:01 UTC 🌐
Fresh print, clean chart, let it cook.
#BNB #Candlesticks
16

·
--
Japanese Candlesticks 🕯️📊Japanese candlesticks (Candlesticks) are the primary language that any chart in financial markets speaks 🕯️📊
Understanding the anatomy of a price candlestick gives you an immediate snapshot of market movement and the struggle between buyers and sellers during a specific time period.
🔍 The 4 main parts of a Japanese candlestick:
1️⃣ The candlestick body (Real Body):
It represents the difference between the closing price and the opening price.
Japanese Candlesticks 🕯️📊
Japanese candlesticks (Candlesticks) are the primary language that any chart in financial markets speaks 🕯️📊
Understanding the anatomy of a price candlestick gives you an immediate snapshot of market movement and the struggle between buyers and sellers during a specific time period.
🔍 The 4 main parts of a Japanese candlestick:
1️⃣ The candlestick body (Real Body):
It represents the difference between the closing price and the opening price.
Understanding the anatomy of a price candlestick gives you an immediate snapshot of market movement and the struggle between buyers and sellers during a specific time period.
🔍 The 4 main parts of a Japanese candlestick:
1️⃣ The candlestick body (Real Body):
It represents the difference between the closing price and the opening price.
7
126

·
--
UNVEILING CANDLESTICK SIGNALS IN $BTC 📈
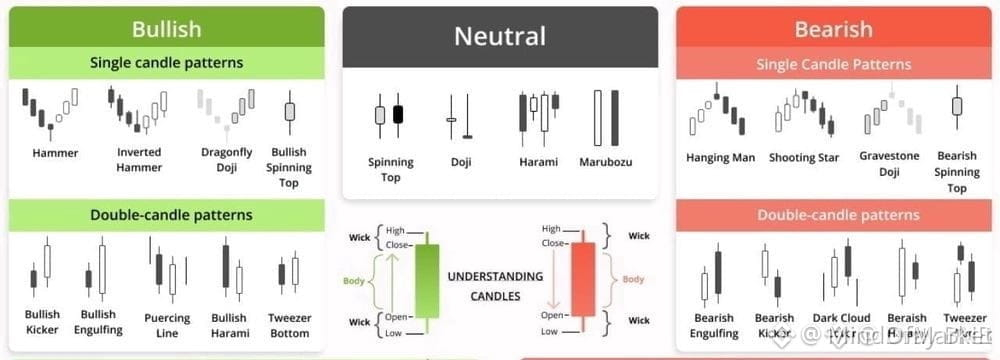
Candlestick formations remain a core analytical tool for institutional crypto desks, offering granular insight into market sentiment and potential reversals. Recent adoption of pattern‑based algorithms by hedge funds underscores the continued relevance of these signals across bullish and bearish cycles.
Seasoned traders leverage recurring candle structures—such as engulfing, hammer, and shooting star—to calibrate entry timing and position sizing. Integrating these patterns with volume and order‑flow data refines probability assessments, especially in volatile crypto markets. While patterns are not infallible, disciplined application can improve trade edge when paired with robust risk controls.
Not financial advice. Manage your risk.
#Crypto #Trading #TechnicalAnalysi #BTC走势分析 #Candlesticks
✅
{future}(BTCUSDT)
UNVEILING CANDLESTICK SIGNALS IN $BTC 📈
Candlestick formations remain a core analytical tool for institutional crypto desks, offering granular insight into market sentiment and potential reversals. Recent adoption of pattern‑based algorithms by hedge funds underscores the continued relevance of these signals across bullish and bearish cycles.
Seasoned traders leverage recurring candle structures—such as engulfing, hammer, and shooting star—to calibrate entry timing and position sizing. Integrating these patterns with volume and order‑flow data refines probability assessments, especially in volatile crypto markets. While patterns are not infallible, disciplined application can improve trade edge when paired with robust risk controls.
Not financial advice. Manage your risk.
#Crypto #Trading #TechnicalAnalysi #BTC走势分析 #Candlesticks
✅
Candlestick formations remain a core analytical tool for institutional crypto desks, offering granular insight into market sentiment and potential reversals. Recent adoption of pattern‑based algorithms by hedge funds underscores the continued relevance of these signals across bullish and bearish cycles.
Seasoned traders leverage recurring candle structures—such as engulfing, hammer, and shooting star—to calibrate entry timing and position sizing. Integrating these patterns with volume and order‑flow data refines probability assessments, especially in volatile crypto markets. While patterns are not infallible, disciplined application can improve trade edge when paired with robust risk controls.
Not financial advice. Manage your risk.
#Crypto #Trading #TechnicalAnalysi #BTC走势分析 #Candlesticks
✅
33

If you can't read candles you can't trade.
Full stop. Learn this first. 👇
📚 30-DAY TRADING GUIDE | Day 4 of 30
#CDCTradingGuide
━━━━━━━━━━━━━━━
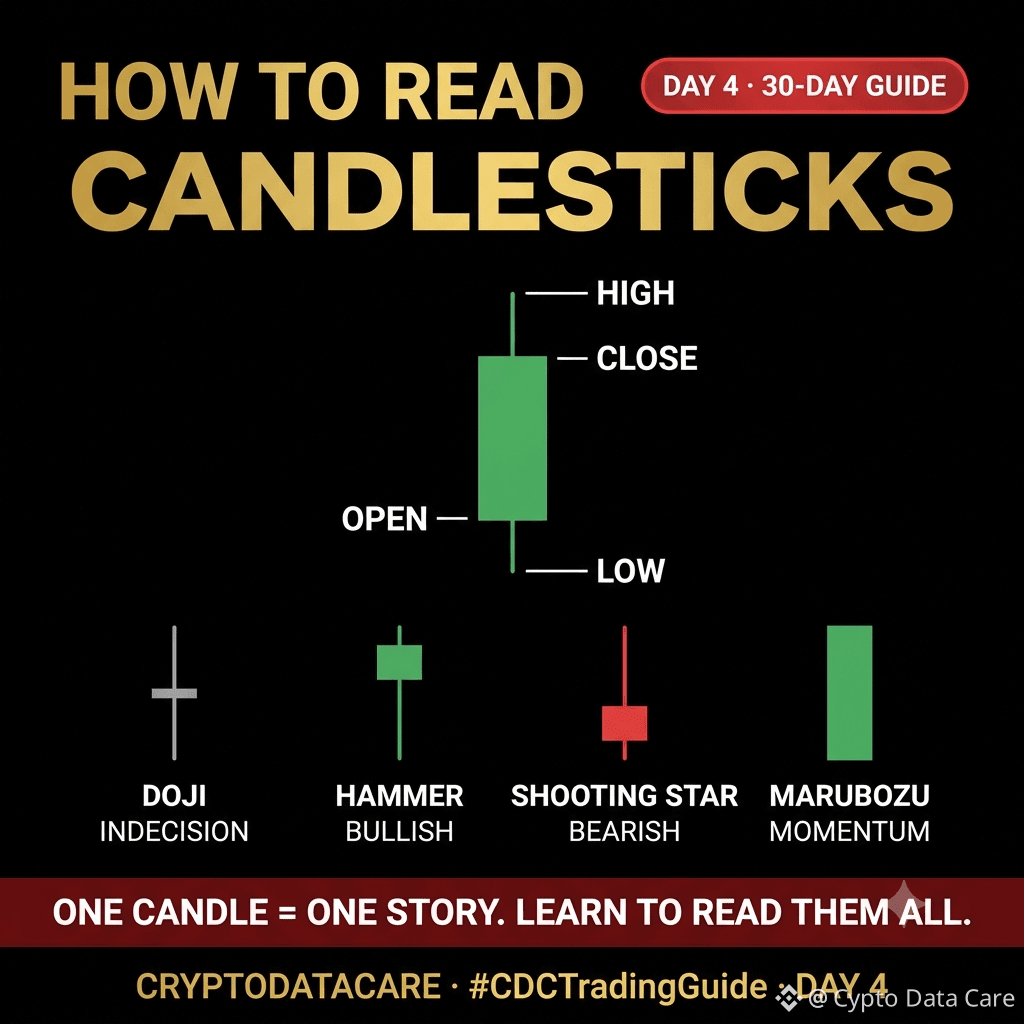
🕯️ HOW TO READ A CANDLESTICK CHART
Every candle tells a story.
Price opened. Moved. Closed. Here's how to read it 👇
anatomy of ONE candle:
┌──────┐ ← WICK (High point reached)
│ │
│ BODY │ ← Green = Closed HIGHER than open
│ │ Red = Closed LOWER than open
└──────┘ ← WICK (Low point reached)
━━━━━━━━━━━━━━━
🟢 GREEN CANDLE = Bulls won that period
Price opened low. Closed higher. Buyers in control.
🔴 RED CANDLE = Bears won that period
Price opened high. Closed lower. Sellers in control.
━━━━━━━━━━━━━━━
🧠 4 CANDLES EVERY TRADER MUST KNOW:
1️⃣ DOJI — Tiny body, long wicks both sides
→ Nobody won. Indecision. Big move coming soon.
2️⃣ HAMMER — Small body, long bottom wick
→ Sellers tried pushing down. Buyers rejected it.
→ Bullish reversal signal 🟢
3️⃣ SHOOTING STAR — Small body, long top wick
→ Buyers tried pushing up. Sellers rejected it.
→ Bearish reversal signal 🔴
4️⃣ MARUBOZU — Full body, no wicks at all
→ One side dominated completely.
→ Strong momentum — follow the direction.
━━━━━━━━━━━━━━━
💡 One candle won't tell you everything.
But 3 candles together tell you a story.
Always zoom out. Always read context.
Tomorrow — Day 5:
Support & Resistance Mastery 📍
🔔 Follow @CryptoDataCare — don't miss it!
💬 Did you know all 4 candle types already?
YES 💪 / NO — learned something new 📚
⚠️ Not financial advice. DYOR.
#CDCTradingGuidle #Day4 #Candlesticks
#TradingEducation #technical_analysis $BTC $XRP $BNB
If you can't read candles you can't trade.
Full stop. Learn this first. 👇
📚 30-DAY TRADING GUIDE | Day 4 of 30
#CDCTradingGuide
━━━━━━━━━━━━━━━
🕯️ HOW TO READ A CANDLESTICK CHART
Every candle tells a story.
Price opened. Moved. Closed. Here's how to read it 👇
anatomy of ONE candle:
┌──────┐ ← WICK (High point reached)
│ │
│ BODY │ ← Green = Closed HIGHER than open
│ │ Red = Closed LOWER than open
└──────┘ ← WICK (Low point reached)
━━━━━━━━━━━━━━━
🟢 GREEN CANDLE = Bulls won that period
Price opened low. Closed higher. Buyers in control.
🔴 RED CANDLE = Bears won that period
Price opened high. Closed lower. Sellers in control.
━━━━━━━━━━━━━━━
🧠 4 CANDLES EVERY TRADER MUST KNOW:
1️⃣ DOJI — Tiny body, long wicks both sides
→ Nobody won. Indecision. Big move coming soon.
2️⃣ HAMMER — Small body, long bottom wick
→ Sellers tried pushing down. Buyers rejected it.
→ Bullish reversal signal 🟢
3️⃣ SHOOTING STAR — Small body, long top wick
→ Buyers tried pushing up. Sellers rejected it.
→ Bearish reversal signal 🔴
4️⃣ MARUBOZU — Full body, no wicks at all
→ One side dominated completely.
→ Strong momentum — follow the direction.
━━━━━━━━━━━━━━━
💡 One candle won't tell you everything.
But 3 candles together tell you a story.
Always zoom out. Always read context.
Tomorrow — Day 5:
Support & Resistance Mastery 📍
🔔 Follow @CryptoDataCare — don't miss it!
💬 Did you know all 4 candle types already?
YES 💪 / NO — learned something new 📚
⚠️ Not financial advice. DYOR.
#CDCTradingGuidle #Day4 #Candlesticks
#TradingEducation #technical_analysis $BTC $XRP $BNB
Full stop. Learn this first. 👇
📚 30-DAY TRADING GUIDE | Day 4 of 30
#CDCTradingGuide
━━━━━━━━━━━━━━━
🕯️ HOW TO READ A CANDLESTICK CHART
Every candle tells a story.
Price opened. Moved. Closed. Here's how to read it 👇
anatomy of ONE candle:
┌──────┐ ← WICK (High point reached)
│ │
│ BODY │ ← Green = Closed HIGHER than open
│ │ Red = Closed LOWER than open
└──────┘ ← WICK (Low point reached)
━━━━━━━━━━━━━━━
🟢 GREEN CANDLE = Bulls won that period
Price opened low. Closed higher. Buyers in control.
🔴 RED CANDLE = Bears won that period
Price opened high. Closed lower. Sellers in control.
━━━━━━━━━━━━━━━
🧠 4 CANDLES EVERY TRADER MUST KNOW:
1️⃣ DOJI — Tiny body, long wicks both sides
→ Nobody won. Indecision. Big move coming soon.
2️⃣ HAMMER — Small body, long bottom wick
→ Sellers tried pushing down. Buyers rejected it.
→ Bullish reversal signal 🟢
3️⃣ SHOOTING STAR — Small body, long top wick
→ Buyers tried pushing up. Sellers rejected it.
→ Bearish reversal signal 🔴
4️⃣ MARUBOZU — Full body, no wicks at all
→ One side dominated completely.
→ Strong momentum — follow the direction.
━━━━━━━━━━━━━━━
💡 One candle won't tell you everything.
But 3 candles together tell you a story.
Always zoom out. Always read context.
Tomorrow — Day 5:
Support & Resistance Mastery 📍
🔔 Follow @CryptoDataCare — don't miss it!
💬 Did you know all 4 candle types already?
YES 💪 / NO — learned something new 📚
⚠️ Not financial advice. DYOR.
#CDCTradingGuidle #Day4 #Candlesticks
#TradingEducation #technical_analysis $BTC $XRP $BNB
1
84


·
--
Bullish
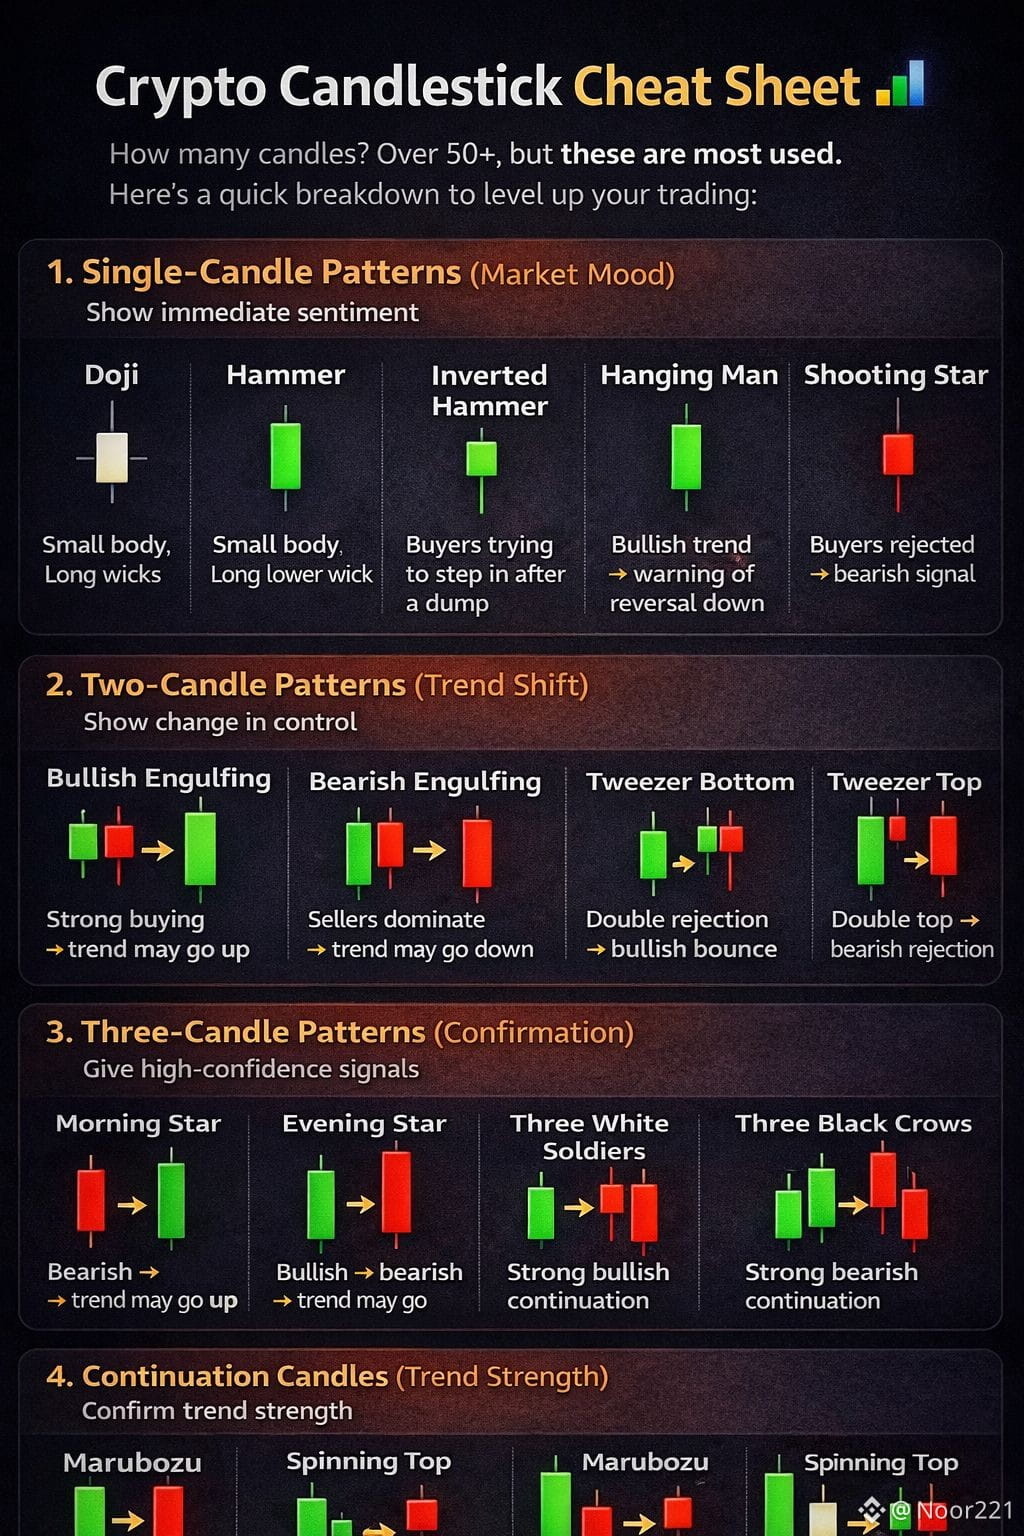
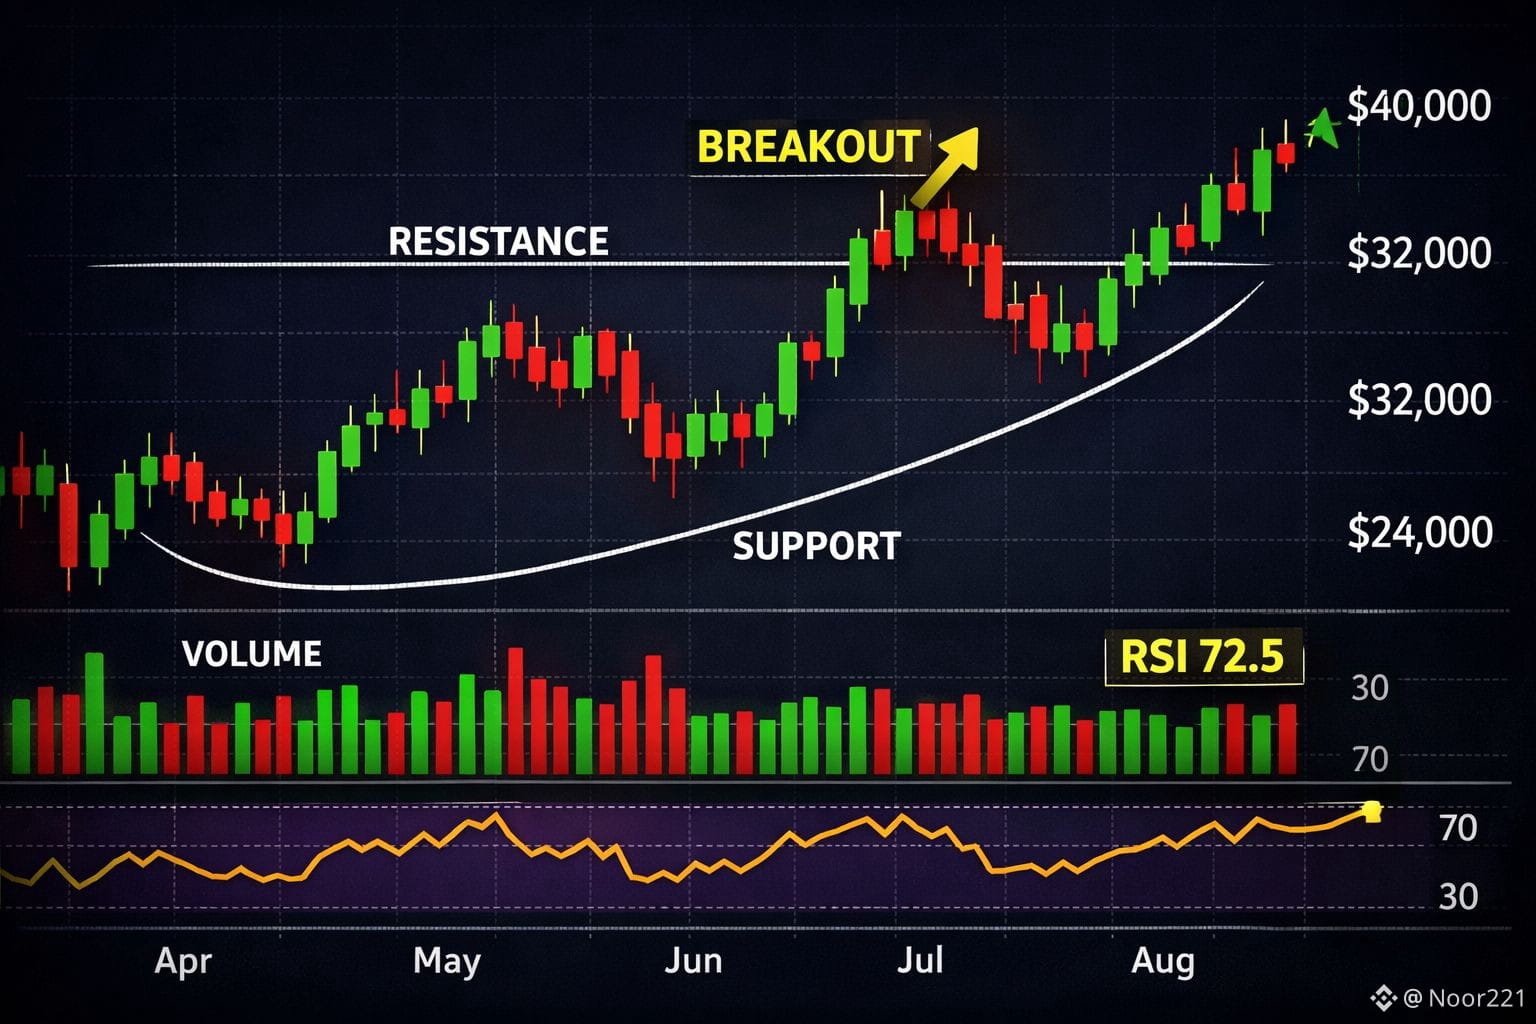
Crypto Candlestick Cheat Sheet 📊
Over 50+ candlestick patterns exist — but traders mainly use a few that actually move markets.
🔹 Single candles show market mood (Doji, Hammer, Shooting Star)
🔹 Two-candle patterns signal control shift (Engulfing, Tweezers)
🔹 Three-candle patterns give confirmation (Morning/Evening Star, 3 Soldiers)
🔹 Continuation candles confirm trend strength (Marubozu)
Candles don’t predict the future —
they reveal who’s in control: buyers or sellers.
Master price action + context = edge in crypto.
Save this. Study it. Trade smarter. 🚀#Candlesticks #PriceActionAlwaysWin #TradingEducation #Bitcoin #ALTCOİNS $BTC
{spot}(BTCUSDT)
$BNB
{spot}(BNBUSDT)
$XRP
{spot}(XRPUSDT)
Crypto Candlestick Cheat Sheet 📊
Over 50+ candlestick patterns exist — but traders mainly use a few that actually move markets.
🔹 Single candles show market mood (Doji, Hammer, Shooting Star)
🔹 Two-candle patterns signal control shift (Engulfing, Tweezers)
🔹 Three-candle patterns give confirmation (Morning/Evening Star, 3 Soldiers)
🔹 Continuation candles confirm trend strength (Marubozu)
Candles don’t predict the future —
they reveal who’s in control: buyers or sellers.
Master price action + context = edge in crypto.
Save this. Study it. Trade smarter. 🚀#Candlesticks #PriceActionAlwaysWin #TradingEducation #Bitcoin #ALTCOİNS $BTC
$BNB
$XRP
Over 50+ candlestick patterns exist — but traders mainly use a few that actually move markets.
🔹 Single candles show market mood (Doji, Hammer, Shooting Star)
🔹 Two-candle patterns signal control shift (Engulfing, Tweezers)
🔹 Three-candle patterns give confirmation (Morning/Evening Star, 3 Soldiers)
🔹 Continuation candles confirm trend strength (Marubozu)
Candles don’t predict the future —
they reveal who’s in control: buyers or sellers.
Master price action + context = edge in crypto.
Save this. Study it. Trade smarter. 🚀#Candlesticks #PriceActionAlwaysWin #TradingEducation #Bitcoin #ALTCOİNS $BTC
$BNB
$XRP
325
172
19
325
·
--
📢 WE ARE LIVE ON BINANCE SQUARE! 🔥
🎓 Today's TG Talks Topic:
📊 Charts & Candlesticks
🔸 Trading Gold & Silver (XAU & XAG)
🔸 24/7 Global Markets | ****Crypto ➜ TradFi Perpetuals
🔸 Chart Reading | ****Candlestick Patterns
🔸 Market Trends
🔸 Technical Analysis
🎙️ Join the LIVE discussion:
[https://www.binance.com/en/square/audio?id=43343758412521](https://www.binance.com/en/square/audio?id=43343758412521)
🚀 See you there!
#TGTalks #Candlesticks #TradFi #XAU #XAG
📢 WE ARE LIVE ON BINANCE SQUARE! 🔥
🎓 Today's TG Talks Topic:
📊 Charts & Candlesticks
🔸 Trading Gold & Silver (XAU & XAG)
🔸 24/7 Global Markets | ****Crypto ➜ TradFi Perpetuals
🔸 Chart Reading | ****Candlestick Patterns
🔸 Market Trends
🔸 Technical Analysis
🎙️ Join the LIVE discussion:
https://www.binance.com/en/square/audio?id=43343758412521
🚀 See you there!
#TGTalks #Candlesticks #TradFi #XAU #XAG
🎓 Today's TG Talks Topic:
📊 Charts & Candlesticks
🔸 Trading Gold & Silver (XAU & XAG)
🔸 24/7 Global Markets | ****Crypto ➜ TradFi Perpetuals
🔸 Chart Reading | ****Candlestick Patterns
🔸 Market Trends
🔸 Technical Analysis
🎙️ Join the LIVE discussion:
https://www.binance.com/en/square/audio?id=43343758412521
🚀 See you there!
#TGTalks #Candlesticks #TradFi #XAU #XAG
1
181


Article
Mastering Candlestick Patterns: A Must for Crypto and Forex TradersCandlestick patterns are a powerful tool for traders in both the crypto and forex markets. These patterns provide valuable insights into market sentiment and potential price movements, helping traders make informed decisions. Here’s a guide to some of the most essential candlestick patterns you should know.
What Are Candlestick Patterns?
Candlestick patterns are a type of chart used in technical analysis to display the price movements of an asset over a specific period. Each candlestick shows the opening, closing, high, and low prices for that period. The body of the candlestick represents the range between the opening and closing prices, while the wicks (or shadows) show the high and low prices.
Key Candlestick Patterns
Hammer and Hanging Man
Hammer: This pattern indicates a potential reversal from a downtrend to an uptrend. It has a small body with a long lower wick, suggesting that sellers pushed the price down but buyers managed to bring it back up.
Hanging Man: Similar in appearance to the hammer, but it appears at the top of an uptrend, indicating a potential reversal to a downtrend.
Bullish and Bearish Engulfing
Bullish Engulfing: This pattern consists of two candles. The first is a small bearish candle, followed by a larger bullish candle that completely engulfs the previous candle’s body. It signals a potential reversal to an uptrend.
Bearish Engulfing: The opposite of the bullish engulfing pattern, this consists of a small bullish candle followed by a larger bearish candle, indicating a potential reversal to a downtrend.
Doji
A doji forms when the opening and closing prices are virtually equal, creating a small or non-existent body. It indicates indecision in the market and can signal a potential reversal when found at the top or bottom of a trend.
Morning Star and Evening Star
Morning Star: This three-candle pattern indicates a potential reversal from a downtrend. It consists of a long bearish candle, followed by a small-bodied candle (which can be bullish or bearish), and then a long bullish candle.
Evening Star: The opposite of the morning star, this pattern indicates a potential reversal from an uptrend. It consists of a long bullish candle, followed by a small-bodied candle, and then a long bearish candle.
Why Candlestick Patterns Matter
Understanding and recognizing these patterns can significantly enhance your trading strategy. They provide visual cues about market sentiment and potential price movements, allowing you to anticipate changes and make more informed trading decisions.
Tips for Using Candlestick Patterns
Combine with Other Indicators: While candlestick patterns are powerful, they are even more effective when used in conjunction with other technical indicators like moving averages or RSI.
Practice Makes Perfect: Spend time studying and practicing these patterns on historical charts to get a feel for how they work in real market conditions.
Stay Updated: The crypto and forex markets are highly dynamic. Stay updated with the latest market news and trends to make the most of your candlestick analysis.
By mastering these candlestick patterns, you can gain a significant edge in your trading endeavors. Happy trading!
Feel free to ask if you need more details on any specific pattern or trading strategy!
#Candlestick #CandleStickPatterns #candlesticks #candles #CandlestickAnalysis
Mastering Candlestick Patterns: A Must for Crypto and Forex Traders
Candlestick patterns are a powerful tool for traders in both the crypto and forex markets. These patterns provide valuable insights into market sentiment and potential price movements, helping traders make informed decisions. Here’s a guide to some of the most essential candlestick patterns you should know.
What Are Candlestick Patterns?
Candlestick patterns are a type of chart used in technical analysis to display the price movements of an asset over a specific period. Each candlestick shows the opening, closing, high, and low prices for that period. The body of the candlestick represents the range between the opening and closing prices, while the wicks (or shadows) show the high and low prices.
Key Candlestick Patterns
Hammer and Hanging Man
Hammer: This pattern indicates a potential reversal from a downtrend to an uptrend. It has a small body with a long lower wick, suggesting that sellers pushed the price down but buyers managed to bring it back up.
Hanging Man: Similar in appearance to the hammer, but it appears at the top of an uptrend, indicating a potential reversal to a downtrend.
Bullish and Bearish Engulfing
Bullish Engulfing: This pattern consists of two candles. The first is a small bearish candle, followed by a larger bullish candle that completely engulfs the previous candle’s body. It signals a potential reversal to an uptrend.
Bearish Engulfing: The opposite of the bullish engulfing pattern, this consists of a small bullish candle followed by a larger bearish candle, indicating a potential reversal to a downtrend.
Doji
A doji forms when the opening and closing prices are virtually equal, creating a small or non-existent body. It indicates indecision in the market and can signal a potential reversal when found at the top or bottom of a trend.
Morning Star and Evening Star
Morning Star: This three-candle pattern indicates a potential reversal from a downtrend. It consists of a long bearish candle, followed by a small-bodied candle (which can be bullish or bearish), and then a long bullish candle.
Evening Star: The opposite of the morning star, this pattern indicates a potential reversal from an uptrend. It consists of a long bullish candle, followed by a small-bodied candle, and then a long bearish candle.
Why Candlestick Patterns Matter
Understanding and recognizing these patterns can significantly enhance your trading strategy. They provide visual cues about market sentiment and potential price movements, allowing you to anticipate changes and make more informed trading decisions.
Tips for Using Candlestick Patterns
Combine with Other Indicators: While candlestick patterns are powerful, they are even more effective when used in conjunction with other technical indicators like moving averages or RSI.
Practice Makes Perfect: Spend time studying and practicing these patterns on historical charts to get a feel for how they work in real market conditions.
Stay Updated: The crypto and forex markets are highly dynamic. Stay updated with the latest market news and trends to make the most of your candlestick analysis.
By mastering these candlestick patterns, you can gain a significant edge in your trading endeavors. Happy trading!
Feel free to ask if you need more details on any specific pattern or trading strategy!
#Candlestick #CandleStickPatterns #candlesticks #candles #CandlestickAnalysis
What Are Candlestick Patterns?
Candlestick patterns are a type of chart used in technical analysis to display the price movements of an asset over a specific period. Each candlestick shows the opening, closing, high, and low prices for that period. The body of the candlestick represents the range between the opening and closing prices, while the wicks (or shadows) show the high and low prices.
Key Candlestick Patterns
Hammer and Hanging Man
Hammer: This pattern indicates a potential reversal from a downtrend to an uptrend. It has a small body with a long lower wick, suggesting that sellers pushed the price down but buyers managed to bring it back up.
Hanging Man: Similar in appearance to the hammer, but it appears at the top of an uptrend, indicating a potential reversal to a downtrend.
Bullish and Bearish Engulfing
Bullish Engulfing: This pattern consists of two candles. The first is a small bearish candle, followed by a larger bullish candle that completely engulfs the previous candle’s body. It signals a potential reversal to an uptrend.
Bearish Engulfing: The opposite of the bullish engulfing pattern, this consists of a small bullish candle followed by a larger bearish candle, indicating a potential reversal to a downtrend.
Doji
A doji forms when the opening and closing prices are virtually equal, creating a small or non-existent body. It indicates indecision in the market and can signal a potential reversal when found at the top or bottom of a trend.
Morning Star and Evening Star
Morning Star: This three-candle pattern indicates a potential reversal from a downtrend. It consists of a long bearish candle, followed by a small-bodied candle (which can be bullish or bearish), and then a long bullish candle.
Evening Star: The opposite of the morning star, this pattern indicates a potential reversal from an uptrend. It consists of a long bullish candle, followed by a small-bodied candle, and then a long bearish candle.
Why Candlestick Patterns Matter
Understanding and recognizing these patterns can significantly enhance your trading strategy. They provide visual cues about market sentiment and potential price movements, allowing you to anticipate changes and make more informed trading decisions.
Tips for Using Candlestick Patterns
Combine with Other Indicators: While candlestick patterns are powerful, they are even more effective when used in conjunction with other technical indicators like moving averages or RSI.
Practice Makes Perfect: Spend time studying and practicing these patterns on historical charts to get a feel for how they work in real market conditions.
Stay Updated: The crypto and forex markets are highly dynamic. Stay updated with the latest market news and trends to make the most of your candlestick analysis.
By mastering these candlestick patterns, you can gain a significant edge in your trading endeavors. Happy trading!
Feel free to ask if you need more details on any specific pattern or trading strategy!
#Candlestick #CandleStickPatterns #candlesticks #candles #CandlestickAnalysis
5
40
41.2k
Log in to explore more content
Join global crypto users on Binance Square
⚡️ Get latest and useful information about crypto.
💬 Trusted by the world’s largest crypto exchange.
👍 Discover real insights from verified creators.
Email / Phone number
Trending Topics
1
#AIStocksWhatNext
518,585 views
3,855 Discussing
2
#BitcoinTops$87KAtEightMonthHigh
1,326 views
38 Discussing
3
#ZECBreaksAbove$1600AtRecordHigh
613 views
25 Discussing
4
#BitwiseNEARStakingETPAssetsTop$100M
13,658 views
59 Discussing
5
#BitcoinBreaksAboveMayHighNears$86K
24,174 views
240 Discussing
6
#DogecoinRises15%
80,733 views
1,397 Discussing
7
#$14BBitcoinOptionsExpireFriday
7,043 views
105 Discussing
8
#BNBMarketCapPassesBNYMellon
49,409 views
1,034 Discussing
9
#CryptoMarketCapReclaims$3Trillion
10,200 views
92 Discussing
10
#MuseOvertakesChatGPTAsTopFreeIOSApp
29,329 views
788 Discussing