
#binancesquare
binancesquare
194.7M views
969,625 Discussing
Hot
Latest

$NEAR
NEARUSDT: Is the Downtrend Losing Its Strength, or Is Another Drop Coming?
NEAR is trading around $3.605, down nearly 3% in the last 24 hours.
The 1-hour chart shows sellers still have control, with price trading below the MA(25) and MA(99).
Key levels to watch:
Support: $3.44
Resistance: $3.65
Stronger resistance: $3.74
Trading idea: A move above $3.65 could signal a possible recovery. But if NEAR loses support near $3.44, further downside may follow.
Don't rush into a trade. Watch volume and wait for confirmation.
What's your view? Is NEAR preparing for a bounce or another bearish move?
#NEAR #NEARUSDT #cryptotrading #BinanceSquare
$NEAR
NEARUSDT: Is the Downtrend Losing Its Strength, or Is Another Drop Coming?
NEAR is trading around $3.605, down nearly 3% in the last 24 hours.
The 1-hour chart shows sellers still have control, with price trading below the MA(25) and MA(99).
Key levels to watch:
Support: $3.44
Resistance: $3.65
Stronger resistance: $3.74
Trading idea: A move above $3.65 could signal a possible recovery. But if NEAR loses support near $3.44, further downside may follow.
Don't rush into a trade. Watch volume and wait for confirmation.
What's your view? Is NEAR preparing for a bounce or another bearish move?
#NEAR #NEARUSDT #cryptotrading #BinanceSquare
NEARUSDT: Is the Downtrend Losing Its Strength, or Is Another Drop Coming?
NEAR is trading around $3.605, down nearly 3% in the last 24 hours.
The 1-hour chart shows sellers still have control, with price trading below the MA(25) and MA(99).
Key levels to watch:
Support: $3.44
Resistance: $3.65
Stronger resistance: $3.74
Trading idea: A move above $3.65 could signal a possible recovery. But if NEAR loses support near $3.44, further downside may follow.
Don't rush into a trade. Watch volume and wait for confirmation.
What's your view? Is NEAR preparing for a bounce or another bearish move?
#NEAR #NEARUSDT #cryptotrading #BinanceSquare
1
453

·
--
#TradFiForBeginners
🚀 $BTTC: THE NEXT BIG CRYPTO SURPRISE?
Millions of tokens are being accumulated by ambitious holders who dream of a massive BTTC breakout! Imagine holding 2.8 million tokens and watching the price climb toward $1. The potential gains would be extraordinary! 🔥💰
📊 BTTC Market Update:
- Current Price: $0.0637
- 24H Change: 🟢 +2.77%
- Previous Price: Approximately $0.0620
- Price Increase: +$0.0017
📈 Bullish Scenario: If buying pressure continues, BTTC could attempt further upward movement.
📉 Bearish Scenario: Losing short-term momentum could trigger profit-taking and another pullback.
🔥 My Take: The community's enthusiasm is growing, but reaching $1 would require an extraordinary increase in market value. Keep an eye on trading volume, market demand, and ecosystem development rather than relying on hype alone.
💬 Are you holding BTTC for the long term, or taking profits during the next pump?
#BTTC USDT#BitTorrent #CryptoTrading #BinanceSquare
#TradFiForBeginners
🚀 $BTTC: THE NEXT BIG CRYPTO SURPRISE?
Millions of tokens are being accumulated by ambitious holders who dream of a massive BTTC breakout! Imagine holding 2.8 million tokens and watching the price climb toward $1. The potential gains would be extraordinary! 🔥💰
📊 BTTC Market Update:
- Current Price: $0.0637
- 24H Change: 🟢 +2.77%
- Previous Price: Approximately $0.0620
- Price Increase: +$0.0017
📈 Bullish Scenario: If buying pressure continues, BTTC could attempt further upward movement.
📉 Bearish Scenario: Losing short-term momentum could trigger profit-taking and another pullback.
🔥 My Take: The community's enthusiasm is growing, but reaching $1 would require an extraordinary increase in market value. Keep an eye on trading volume, market demand, and ecosystem development rather than relying on hype alone.
💬 Are you holding BTTC for the long term, or taking profits during the next pump?
#BTTC USDT#BitTorrent #CryptoTrading #BinanceSquare
🚀 $BTTC: THE NEXT BIG CRYPTO SURPRISE?
Millions of tokens are being accumulated by ambitious holders who dream of a massive BTTC breakout! Imagine holding 2.8 million tokens and watching the price climb toward $1. The potential gains would be extraordinary! 🔥💰
📊 BTTC Market Update:
- Current Price: $0.0637
- 24H Change: 🟢 +2.77%
- Previous Price: Approximately $0.0620
- Price Increase: +$0.0017
📈 Bullish Scenario: If buying pressure continues, BTTC could attempt further upward movement.
📉 Bearish Scenario: Losing short-term momentum could trigger profit-taking and another pullback.
🔥 My Take: The community's enthusiasm is growing, but reaching $1 would require an extraordinary increase in market value. Keep an eye on trading volume, market demand, and ecosystem development rather than relying on hype alone.
💬 Are you holding BTTC for the long term, or taking profits during the next pump?
#BTTC USDT#BitTorrent #CryptoTrading #BinanceSquare

3
371

$ZEC Alert! Is this distribution or just a shakeout before the next leg up? 🚨
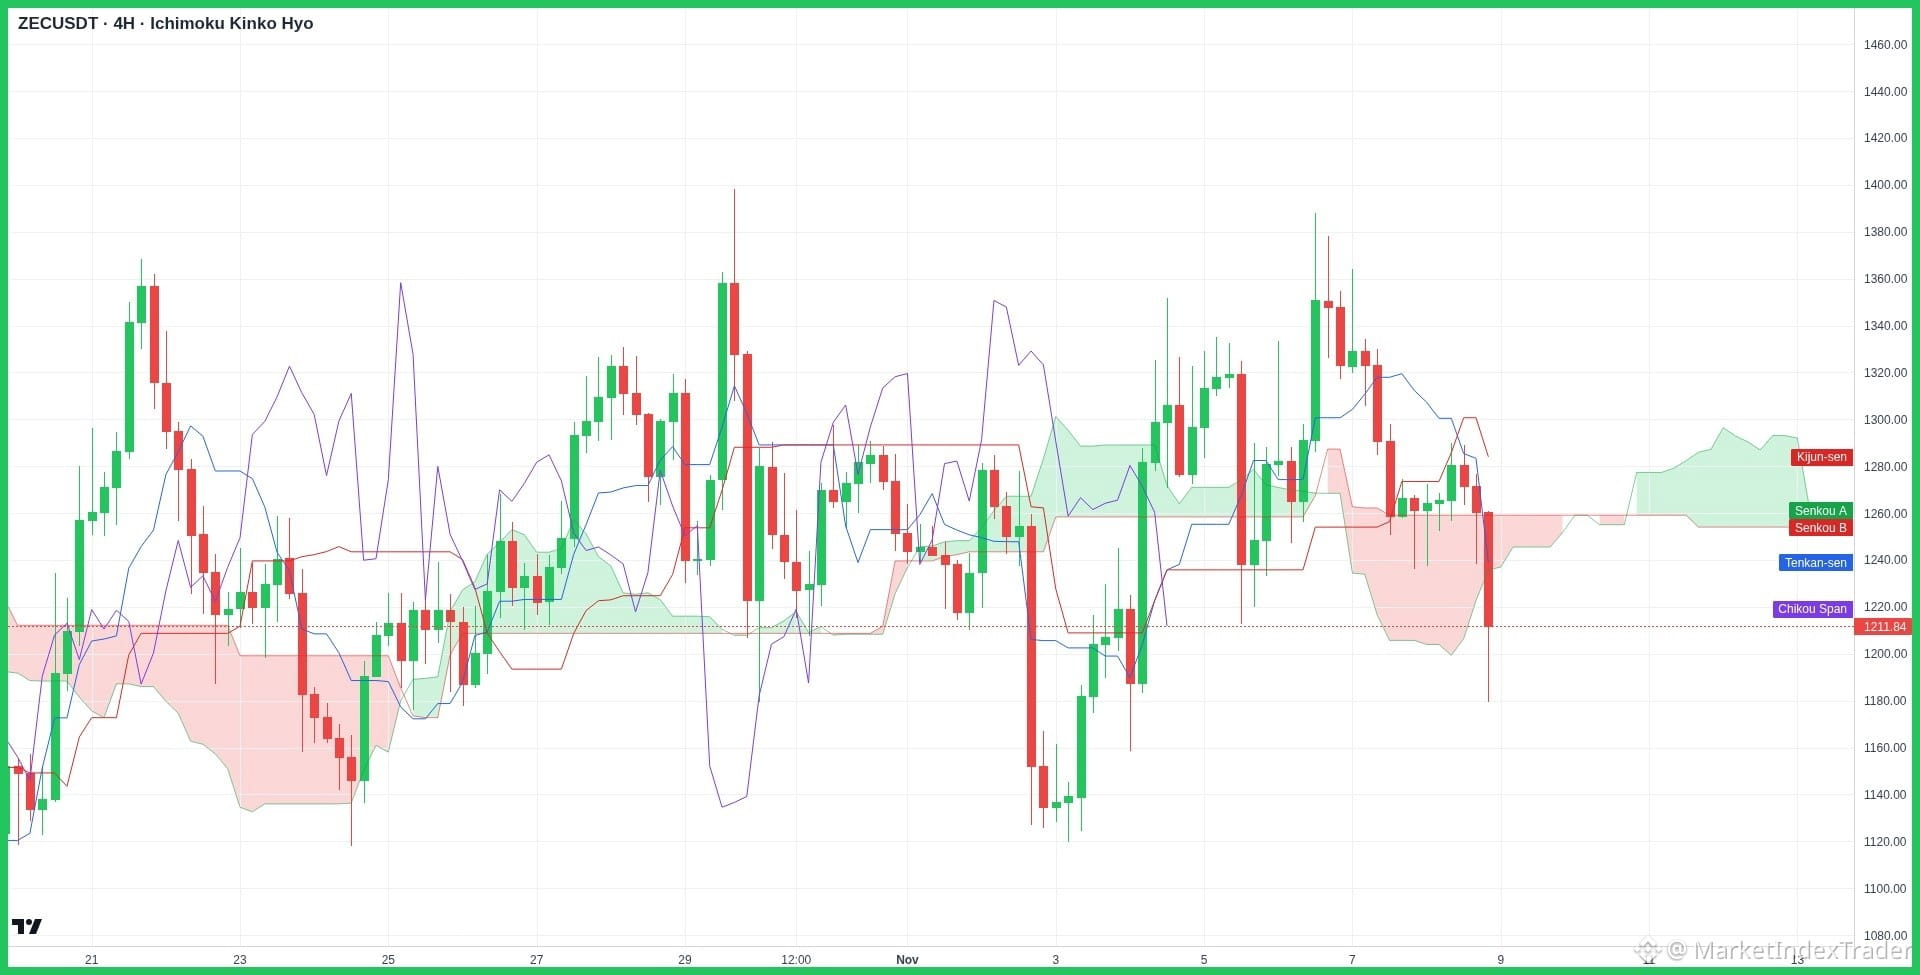
$ZEC's 4H chart has dropped below the Ichimoku Cloud, currently testing crucial support near the $1,140–$1,180 zone.
Alright team, let's break down this juicy $ZEC chart and see what's cooking after the recent volatility!
Looking at the 4-hour Ichimoku Kinko Hyo chart, $ZEC is currently hovering around $1,211. Price recently lost the Kumo cloud, creating short-term downside pressure. However, strong buying interest has repeatedly stepped in near the lower wick support zone of $1,130–$1,180. To regain full bullish momentum, $ZEC needs to reclaim the key resistance levels at $1,241 (Tenkan-sen) and $1,256–$1,284 (Kumo span). A successful breakout above $1,284 opens the path toward testing previous highs near $1,380.
On the fundamental side, the Zcash ecosystem continues to show strong underlying growth. Ongoing developments by the Electric Coin Company, including user-friendly Zashi wallet improvements and discussions around Proof-of-Stake transition features, bolster long-term investor confidence in $ZEC's privacy leadership.
My strategy: I'm watching the $1,140 support closely for a potential double-bottom bounce to target $1,280+.
Highly recommend HOLD and Stacking $ZEC at Binance
Feel free to comment the altcoin you are holding and we will check it for you!
ZEC #TechnicalAnalysis #Crypto #BinanceSquare #Bitcoin
$ZEC Alert! Is this distribution or just a shakeout before the next leg up? 🚨
$ZEC 's 4H chart has dropped below the Ichimoku Cloud, currently testing crucial support near the $1,140–$1,180 zone.
Alright team, let's break down this juicy $ZEC chart and see what's cooking after the recent volatility!
Looking at the 4-hour Ichimoku Kinko Hyo chart, $ZEC is currently hovering around $1,211. Price recently lost the Kumo cloud, creating short-term downside pressure. However, strong buying interest has repeatedly stepped in near the lower wick support zone of $1,130–$1,180. To regain full bullish momentum, $ZEC needs to reclaim the key resistance levels at $1,241 (Tenkan-sen) and $1,256–$1,284 (Kumo span). A successful breakout above $1,284 opens the path toward testing previous highs near $1,380.
On the fundamental side, the Zcash ecosystem continues to show strong underlying growth. Ongoing developments by the Electric Coin Company, including user-friendly Zashi wallet improvements and discussions around Proof-of-Stake transition features, bolster long-term investor confidence in $ZEC 's privacy leadership.
My strategy: I'm watching the $1,140 support closely for a potential double-bottom bounce to target $1,280+.
Highly recommend HOLD and Stacking $ZEC at Binance
Feel free to comment the altcoin you are holding and we will check it for you!
ZEC #TechnicalAnalysis #Crypto #BinanceSquare #Bitcoin
$ZEC 's 4H chart has dropped below the Ichimoku Cloud, currently testing crucial support near the $1,140–$1,180 zone.
Alright team, let's break down this juicy $ZEC chart and see what's cooking after the recent volatility!
Looking at the 4-hour Ichimoku Kinko Hyo chart, $ZEC is currently hovering around $1,211. Price recently lost the Kumo cloud, creating short-term downside pressure. However, strong buying interest has repeatedly stepped in near the lower wick support zone of $1,130–$1,180. To regain full bullish momentum, $ZEC needs to reclaim the key resistance levels at $1,241 (Tenkan-sen) and $1,256–$1,284 (Kumo span). A successful breakout above $1,284 opens the path toward testing previous highs near $1,380.
On the fundamental side, the Zcash ecosystem continues to show strong underlying growth. Ongoing developments by the Electric Coin Company, including user-friendly Zashi wallet improvements and discussions around Proof-of-Stake transition features, bolster long-term investor confidence in $ZEC 's privacy leadership.
My strategy: I'm watching the $1,140 support closely for a potential double-bottom bounce to target $1,280+.
Highly recommend HOLD and Stacking $ZEC at Binance
Feel free to comment the altcoin you are holding and we will check it for you!
ZEC #TechnicalAnalysis #Crypto #BinanceSquare #Bitcoin
272

·
--
📊 $AIN Market Update: Recovery or Dead Cat Bounce?
$AIN is trading at $0.1558, up 61% from its recent low of $0.0967, but still down 52.5% from its ATH of $0.3278.
🔍 Key Observations:
Volume and transaction activity are declining.
Open Interest stands at $22.5M, down 6.88% in 24h.
Funding is positive (+0.01705%), meaning longs are paying shorts.
Top traders remain long-biased, while overall accounts are neutral.
Low spot liquidity (~$923K) creates significant volatility risk.
📍 Key Levels:
Resistance: $0.1620
Recent low: $0.0967
My Take: The recovery is encouraging, but declining volume and weak participation make a confirmed trend reversal premature. Watch for a breakout with strong volume.
#AIN #CryptoAnalysis #BinanceSquare $
📊 $AIN Market Update: Recovery or Dead Cat Bounce?
$AIN is trading at $0.1558, up 61% from its recent low of $0.0967, but still down 52.5% from its ATH of $0.3278.
🔍 Key Observations:
Volume and transaction activity are declining.
Open Interest stands at $22.5M, down 6.88% in 24h.
Funding is positive (+0.01705%), meaning longs are paying shorts.
Top traders remain long-biased, while overall accounts are neutral.
Low spot liquidity (~$923K) creates significant volatility risk.
📍 Key Levels:
Resistance: $0.1620
Recent low: $0.0967
My Take: The recovery is encouraging, but declining volume and weak participation make a confirmed trend reversal premature. Watch for a breakout with strong volume.
#AIN #CryptoAnalysis #BinanceSquare $
$AIN is trading at $0.1558, up 61% from its recent low of $0.0967, but still down 52.5% from its ATH of $0.3278.
🔍 Key Observations:
Volume and transaction activity are declining.
Open Interest stands at $22.5M, down 6.88% in 24h.
Funding is positive (+0.01705%), meaning longs are paying shorts.
Top traders remain long-biased, while overall accounts are neutral.
Low spot liquidity (~$923K) creates significant volatility risk.
📍 Key Levels:
Resistance: $0.1620
Recent low: $0.0967
My Take: The recovery is encouraging, but declining volume and weak participation make a confirmed trend reversal premature. Watch for a breakout with strong volume.
#AIN #CryptoAnalysis #BinanceSquare $
1
292

·
--
Bullish
🚀 $AIOT – Are We Witnessing the Beginning of a New Bullish Move?
After the strong rise witnessed by AIOT, the price entered a correction phase, but it has started showing signs of recovery and stabilization. Technical indicators on the 15-minute timeframe show that the price is still trading above the main moving averages, which is initially a positive sign.
📈 Potential Trading Setup – LONG (Buy)
- 🟢 First Entry Zone: 0.1570$AIOT
- 🟢 Second Entry Zone: 0.1550
- 🔴 Stop Loss: 0.1490
🎯 Take-Profit Targets:
- Target 1: 0.1650
- Target 2: 0.1730
- Target 3: 0.1820 – 0.1860
What supports this trade?
Price stability above the moving averages, along with the possibility of a rebound from the entry zone, could give buyers an opportunity to regain momentum and test the next resistance levels.
⚠️ Entry Conditions: Don't rush into buying. Wait for the price to reach the entry zone and show a clear bullish reversal candle accompanied by improving trading volume. If the price fails to hold support, it is better to avoid the trade.
Profits can be taken gradually at each target, while managing risk carefully.
Can AIOT return to retest its previous high at 0.18627? 🚀
#AIOT #CryptoTrading #BinanceSquare
🚀 $AIOT – Are We Witnessing the Beginning of a New Bullish Move?
After the strong rise witnessed by AIOT, the price entered a correction phase, but it has started showing signs of recovery and stabilization. Technical indicators on the 15-minute timeframe show that the price is still trading above the main moving averages, which is initially a positive sign.
📈 Potential Trading Setup – LONG (Buy)
- 🟢 First Entry Zone: 0.1570$AIOT
- 🟢 Second Entry Zone: 0.1550
- 🔴 Stop Loss: 0.1490
🎯 Take-Profit Targets:
- Target 1: 0.1650
- Target 2: 0.1730
- Target 3: 0.1820 – 0.1860
What supports this trade?
Price stability above the moving averages, along with the possibility of a rebound from the entry zone, could give buyers an opportunity to regain momentum and test the next resistance levels.
⚠️ Entry Conditions: Don't rush into buying. Wait for the price to reach the entry zone and show a clear bullish reversal candle accompanied by improving trading volume. If the price fails to hold support, it is better to avoid the trade.
Profits can be taken gradually at each target, while managing risk carefully.
Can AIOT return to retest its previous high at 0.18627? 🚀
#AIOT #CryptoTrading #BinanceSquare
After the strong rise witnessed by AIOT, the price entered a correction phase, but it has started showing signs of recovery and stabilization. Technical indicators on the 15-minute timeframe show that the price is still trading above the main moving averages, which is initially a positive sign.
📈 Potential Trading Setup – LONG (Buy)
- 🟢 First Entry Zone: 0.1570$AIOT
- 🟢 Second Entry Zone: 0.1550
- 🔴 Stop Loss: 0.1490
🎯 Take-Profit Targets:
- Target 1: 0.1650
- Target 2: 0.1730
- Target 3: 0.1820 – 0.1860
What supports this trade?
Price stability above the moving averages, along with the possibility of a rebound from the entry zone, could give buyers an opportunity to regain momentum and test the next resistance levels.
⚠️ Entry Conditions: Don't rush into buying. Wait for the price to reach the entry zone and show a clear bullish reversal candle accompanied by improving trading volume. If the price fails to hold support, it is better to avoid the trade.
Profits can be taken gradually at each target, while managing risk carefully.
Can AIOT return to retest its previous high at 0.18627? 🚀
#AIOT #CryptoTrading #BinanceSquare
151
·
--
{spot}(BTCUSDT)
🚨 $BITCOIN LONGS UNDER PRESSURE — $181K WIPED OUT!
🔴 BTC Liquidated Long: $181K at $74,250
Bitcoin has delivered another painful blow to leveraged bulls! A $181K long liquidation at $74,250 highlights the growing pressure on buyers and signals that downside volatility remains a serious threat.
📉 What's Next for BTC?
The key battle is now around the $74,000 zone.
- Bearish Scenario: If BTC loses support around $74K, further downside toward $73,000–$72,000 could follow.
- Bullish Recovery: A strong reclaim above $75,000 could attract fresh buyers and trigger a relief bounce.
- Market Signal: Watch liquidation clusters and trading volume for confirmation before entering a position.
🎯 My Trading Outlook: Short-term momentum looks vulnerable. I would avoid aggressive long entries until Bitcoin establishes solid support and confirms a recovery.
⚠️ Trade with proper risk management. Liquidation data alone is not a guaranteed price-direction signal.
#Bitcoin
#BTCUSDT
#CryptoTrading
#LiquidationAlert
#BinanceSquare
🚨 $BITCOIN LONGS UNDER PRESSURE — $181K WIPED OUT!
🔴 BTC Liquidated Long: $181K at $74,250
Bitcoin has delivered another painful blow to leveraged bulls! A $181K long liquidation at $74,250 highlights the growing pressure on buyers and signals that downside volatility remains a serious threat.
📉 What's Next for BTC?
The key battle is now around the $74,000 zone.
- Bearish Scenario: If BTC loses support around $74K, further downside toward $73,000–$72,000 could follow.
- Bullish Recovery: A strong reclaim above $75,000 could attract fresh buyers and trigger a relief bounce.
- Market Signal: Watch liquidation clusters and trading volume for confirmation before entering a position.
🎯 My Trading Outlook: Short-term momentum looks vulnerable. I would avoid aggressive long entries until Bitcoin establishes solid support and confirms a recovery.
⚠️ Trade with proper risk management. Liquidation data alone is not a guaranteed price-direction signal.
#Bitcoin
#BTCUSDT
#CryptoTrading
#LiquidationAlert
#BinanceSquare
🔴 BTC Liquidated Long: $181K at $74,250
Bitcoin has delivered another painful blow to leveraged bulls! A $181K long liquidation at $74,250 highlights the growing pressure on buyers and signals that downside volatility remains a serious threat.
📉 What's Next for BTC?
The key battle is now around the $74,000 zone.
- Bearish Scenario: If BTC loses support around $74K, further downside toward $73,000–$72,000 could follow.
- Bullish Recovery: A strong reclaim above $75,000 could attract fresh buyers and trigger a relief bounce.
- Market Signal: Watch liquidation clusters and trading volume for confirmation before entering a position.
🎯 My Trading Outlook: Short-term momentum looks vulnerable. I would avoid aggressive long entries until Bitcoin establishes solid support and confirms a recovery.
⚠️ Trade with proper risk management. Liquidation data alone is not a guaranteed price-direction signal.
#Bitcoin
#BTCUSDT
#CryptoTrading
#LiquidationAlert
#BinanceSquare
11

🚨 CONTROVERSIAL QUESTION:
Are most altcoins actually solving problems, or are people simply buying narratives?
Some projects focus on real utility.
Some focus on hype.
Some are still trying to prove their value.
But investors often treat them all the same.
🔥 What's more important when evaluating an altcoin?
Technology
Community
Tokenomics
Real-world utility
Let's debate!
#Altcoins! #Web3 #cryptodebate #BinanceSquare
🚨 CONTROVERSIAL QUESTION:
Are most altcoins actually solving problems, or are people simply buying narratives?
Some projects focus on real utility.
Some focus on hype.
Some are still trying to prove their value.
But investors often treat them all the same.
🔥 What's more important when evaluating an altcoin?
Technology
Community
Tokenomics
Real-world utility
Let's debate!
#Altcoins! #Web3 #cryptodebate #BinanceSquare
Are most altcoins actually solving problems, or are people simply buying narratives?
Some projects focus on real utility.
Some focus on hype.
Some are still trying to prove their value.
But investors often treat them all the same.
🔥 What's more important when evaluating an altcoin?
Technology
Community
Tokenomics
Real-world utility
Let's debate!
#Altcoins! #Web3 #cryptodebate #BinanceSquare
192

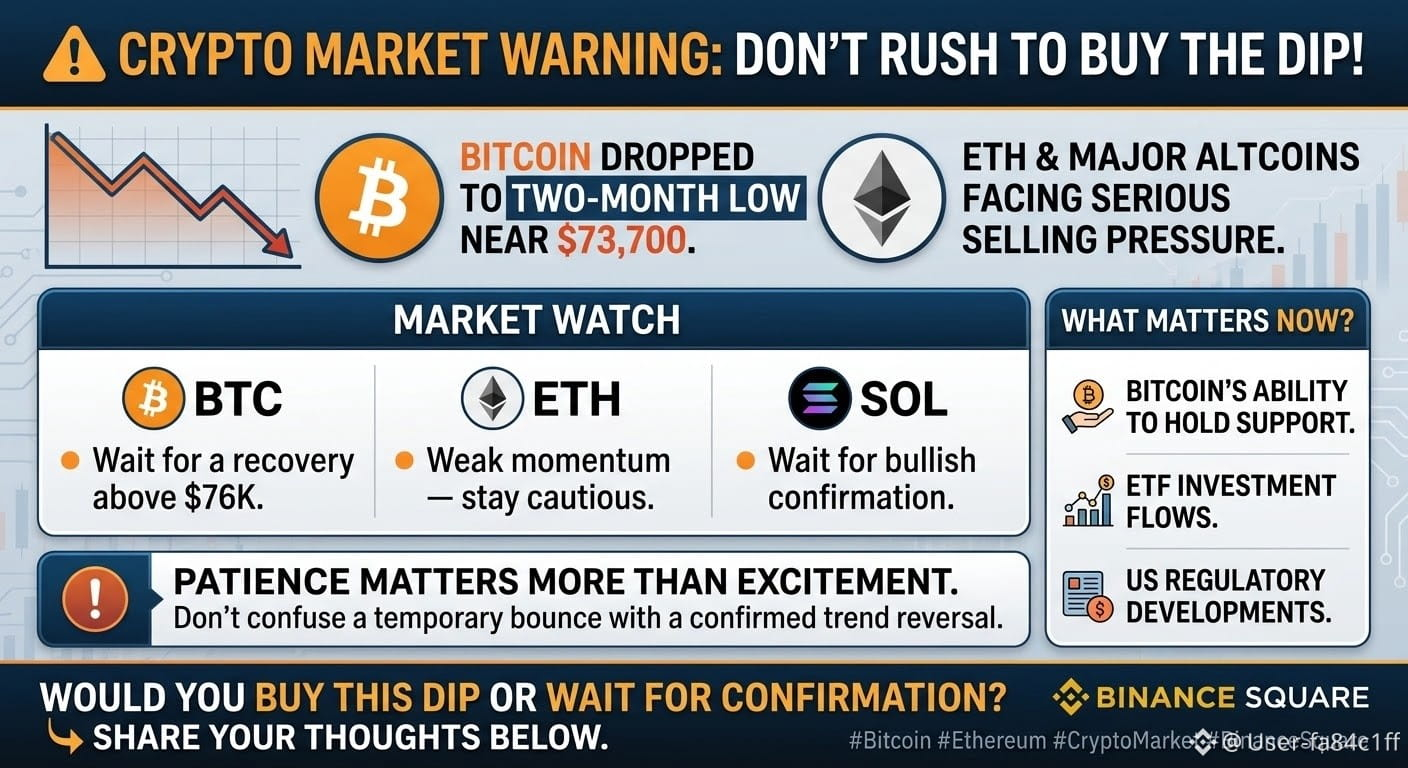
🚨 CRYPTO MARKET WARNING: DON'T RUSH TO BUY THE DIP!
Bitcoin has dropped to a two-month low near $73,700.
Ethereum and major altcoins are also facing serious selling pressure.
My Market Watch:
🔸 BTC: Wait for a recovery above $76K. 🔸 ETH: Weak momentum — stay cautious. 🔸 SOL: Wait for bullish confirmation.
What matters now?
Bitcoin's ability to hold support.
ETF investment flows.
US regulatory developments.
This is a market where patience matters more than excitement.
⚠️ Don't confuse a temporary bounce with a confirmed trend reversal.
Would you buy this dip or wait for confirmation?
Share your thoughts below. 👇
#Bitcoin #Ethereum #CryptoMarket #BinanceSquare
🚨 CRYPTO MARKET WARNING: DON'T RUSH TO BUY THE DIP!
Bitcoin has dropped to a two-month low near $73,700.
Ethereum and major altcoins are also facing serious selling pressure.
My Market Watch:
🔸 BTC: Wait for a recovery above $76K. 🔸 ETH: Weak momentum — stay cautious. 🔸 SOL: Wait for bullish confirmation.
What matters now?
Bitcoin's ability to hold support.
ETF investment flows.
US regulatory developments.
This is a market where patience matters more than excitement.
⚠️ Don't confuse a temporary bounce with a confirmed trend reversal.
Would you buy this dip or wait for confirmation?
Share your thoughts below. 👇
#Bitcoin #Ethereum #CryptoMarket #BinanceSquare
Bitcoin has dropped to a two-month low near $73,700.
Ethereum and major altcoins are also facing serious selling pressure.
My Market Watch:
🔸 BTC: Wait for a recovery above $76K. 🔸 ETH: Weak momentum — stay cautious. 🔸 SOL: Wait for bullish confirmation.
What matters now?
Bitcoin's ability to hold support.
ETF investment flows.
US regulatory developments.
This is a market where patience matters more than excitement.
⚠️ Don't confuse a temporary bounce with a confirmed trend reversal.
Would you buy this dip or wait for confirmation?
Share your thoughts below. 👇
#Bitcoin #Ethereum #CryptoMarket #BinanceSquare
145

FEAR AT 30: BITCOIN FIGHTS TO HOLD $75K AS FED RATE-HIKE FEARS, AI VOLATILITY AND GLOBAL MARKET🌍#PositiveMindsGlobalResults #BinanceSquare
| INVEST • LEARN • GROW • TOGETHER
Stay positive. Stay informed. Stay secure! 💛🌍
Global Market Outlook | Monday, November 9, 2026
The global financial markets are entering another critical week, with cryptocurrency investors showing caution, technology stocks struggling to recover from a major sell-off, and expectations of tighter US monetary policy putting additional pressure on risk-sensitive assets.
Bitcoin is trading around $75,000–$76,000, while Ethereum is facing renewed selling pressure and BNB is attempting to stabilize near $690–$700.
The Crypto Fear & Greed Index reading of approximately 30 (Fear) reflects fragile investor confidence. Following the recent market turbulence, investors are closely monitoring US inflation data, Federal Reserve signals, institutional investment flows and developments in major global economies.
But the bigger question is whether this is a temporary market correction or the beginning of a deeper period of financial uncertainty.
1. CRYPTO MARKET: FEAR REPLACES CONFIDENCE
The cryptocurrency market remains under pressure following several developments:
- The recent $6.3 billion Binance-related security incident and continuing concerns about exchange security.
- Uncertainty surrounding future US cryptocurrency regulation following the midterm elections.
- Significant outflows from US spot Bitcoin ETFs.
- Weakness in technology stocks and declining appetite for speculative investments.
- Expectations of potentially higher US interest rates.
Bitcoin and Ethereum recently touched their lowest levels in more than two months. These developments have increased caution among traders and institutional investors.
Fear & Greed Index: Around 30 — Fear
A reading near 30 indicates that investors are becoming defensive. However, fear alone does not guarantee that prices have reached their bottom.
Historically, extreme pessimism can create opportunities for long-term investors, but further declines remain possible when liquidity and market confidence are weak.
2. BITCOIN (BTC): CAN $75,000 HOLD?
Indicative market price: $75,500–$75,800
Bitcoin remains the most important indicator of overall cryptocurrency market direction.
After briefly recovering above $80,000 following the US midterm elections, BTC reversed sharply as technology shares declined and investors reassessed regulatory and monetary-policy risks.
Important technical levels
- Immediate support: $73,900
- Secondary support: $71,800
- Major downside support: $68,700
- Immediate resistance: $76,300
- Secondary resistance: $77,600
- Higher resistance: $81,100
Bullish scenario: If Bitcoin protects the $73,900 support region and establishes a daily close above $76,300–$77,600, a recovery towards $80,000–$81,100 becomes possible.
Bearish scenario: A decisive daily breakdown below $73,900 could expose $71,800, followed by the $68,700 region.
My outlook: BTC remains cautious in the short term. A sustainable recovery requires stronger spot demand, improving ETF flows and a convincing return of buying momentum.
3. ETHEREUM (ETH): SELLING PRESSURE REMAINS A CONCERN
Indicative market price: $2,150–$2,235
Ethereum is experiencing greater short-term weakness than Bitcoin.
Recent selling has pushed ETH towards important technical support zones, while broader market uncertainty continues to affect investor demand.
Important technical levels
- Immediate support: $2,103
- Secondary support: $2,042
- Major support: $1,982
- Immediate resistance: $2,160
- Secondary resistance: $2,210
- Higher resistance: $2,271
Bullish scenario: Holding above $2,103 and reclaiming $2,160–$2,210 could support a recovery towards $2,271.
Bearish scenario: A confirmed breakdown below $2,103 could increase selling pressure towards $2,042 and potentially $1,982.
My outlook: ETH needs stronger market participation and improving momentum before a sustained recovery can be established.
4. BNB: CAN BUYERS DEFEND THE $680–$690 REGION?
Indicative market price: $690–$696
BNB is attempting to stabilize despite the broader cryptocurrency downturn.
However, investors are also monitoring confidence in the Binance ecosystem following recent security-related developments.
Important technical levels
- Immediate support: $674
- Secondary support: $659
- Major support: $626
- Immediate resistance: $690–$701
- Higher resistance: $713
- Additional resistance: $723
Bullish scenario: A sustained recovery above $701 could open the way towards $713–$723.
Bearish scenario: Losing $674 could expose $659, with $626 becoming a deeper downside reference.
My outlook: BNB needs stronger buying volume and renewed market confidence to establish a more convincing recovery.
5. US STOCK MARKET: NASDAQ-100 LEADS FRIDAY'S RECOVERY
Wall Street finished Friday, November 6, with mixed results after a turbulent week dominated by technology-sector selling.
The Nasdaq-100 recovered 1.35%, outperforming the other major indices during Friday's session.
Friday's closing performance:
- Nasdaq-100: +1.35%
- Nasdaq Composite: +1.09%
- Russell 2000: +0.89%
- S&P 500: +0.31%
- Dow Jones: -0.46%
Despite Friday's recovery, the Nasdaq-100 remained down approximately 4.9% for the week.
The rebound was supported by renewed buying in semiconductor and technology shares, including Nvidia, AMD, Intel and Micron.
However, investors remain concerned about expensive AI infrastructure, massive data-centre spending and whether future earnings will justify current valuations.
The technology recovery is encouraging, but it does not yet establish that the wider market correction is over.
6. US INFLATION: OCTOBER CPI COULD CHANGE MARKET EXPECTATIONS
One of the most important events this week is the US Consumer Price Index (CPI), scheduled for Tuesday, November 10.
September's annual inflation rate stood at 3.7%, while economists surveyed by the Associated Press expect October inflation to increase to approximately 3.9%.
Investors will pay particular attention to:
- Headline CPI: Overall consumer price increases.
- Core CPI: Inflation excluding food and energy.
- Energy prices: The impact of geopolitical tensions and oil-market movements.
- Housing and services: Whether underlying inflation remains persistent.
A stronger-than-expected CPI reading could reinforce expectations of further monetary tightening.
A softer inflation report could provide some relief to equities and cryptocurrencies by reducing pressure on interest-rate expectations.
7. FEDERAL RESERVE: DECEMBER RATE-HIKE EXPECTATIONS GROW
The Federal Reserve remains a major influence on global financial markets.
Recent employment figures showed that the US economy added 165,000 jobs in October, significantly above economists' expectations of approximately 65,000.
This stronger employment performance has strengthened expectations that the Fed could increase interest rates again in December.
Market pricing has approached an 80% probability of a 25-basis-point increase, although this is not a confirmed policy decision.
Why this matters for crypto:
Higher interest rates can:
- Strengthen the US dollar.
- Increase borrowing costs.
- Reduce liquidity available for speculative investments.
- Put pressure on technology valuations.
- Weigh on Bitcoin, Ethereum and other digital assets.
The next Federal Reserve meeting is scheduled for December 8–9.
8. EUROPE: TECHNOLOGY WEAKNESS AND ECONOMIC UNCERTAINTY
European markets have also experienced pressure from the global technology sell-off.
During Friday's trading session, the STOXX Europe 600 declined approximately 1%, while technology and semiconductor shares faced significant losses.
ASML, Infineon and other chip-related companies were among the affected businesses.
Investors are monitoring several developments:
- European economic growth and employment figures.
- Energy costs and geopolitical uncertainty.
- European Central Bank policy expectations.
- Semiconductor demand and AI infrastructure investment.
- Developments surrounding the future leadership of the European Central Bank.
Europe's dependence on imported energy also makes oil prices an important economic factor.
9. ASIA: MARKETS ATTEMPT TO RECOVER AFTER A BRUTAL WEEK
Asian markets experienced substantial volatility following the technology sell-off.
Japan's Nikkei and South Korea's Kospi suffered particularly heavy losses last week, while Taiwan's semiconductor sector was affected by concerns about AI investment returns.
However, Monday's trading session brought some recovery.
- MSCI Asia-Pacific excluding Japan: +0.8%
- Japan's Nikkei: +2.5%
- Taiwan's benchmark: approximately +2.5%
Investors are now watching China's inflation and lending figures, semiconductor demand, regional trade developments and preparations for the ASEAN summit in Manila.
The key question for Asian markets is whether technology companies can maintain growth while global investors demand stronger evidence of profitability.
10. OIL, GOLD AND THE US DOLLAR: THREE IMPORTANT MARKET SIGNALS
Other financial indicators are also influencing investor sentiment.
Oil: Brent crude traded around $97–$98 per barrel amid geopolitical uncertainty and developments surrounding US-Iran negotiations.
Gold: Spot gold was around $4,066 per ounce at Friday's close, reflecting continuing interest in precious metals during uncertain market conditions.
US dollar: The dollar index strengthened towards 102.2 as stronger employment data increased expectations of tighter Federal Reserve policy.
These movements matter because energy prices, currency strength and bond yields can influence inflation, global liquidity and investment demand.
11. WHAT SHOULD INVESTORS WATCH THIS WEEK?
The coming days could be important for both traditional financial markets and cryptocurrencies.
Date| Important event
November 9| Global market reaction and economic developments
November 10| US October CPI inflation
November 11| China economic data and regional developments
November 12| US jobless claims and existing home sales
November 13| US October PPI inflation
Corporate earnings from AI infrastructure and semiconductor companies will also provide important clues about whether technology investment can generate sustainable returns.
12. FINAL MARKET OUTLOOK: RECOVERY OR ANOTHER DECLINE?
The current environment presents a complicated picture.
Cryptocurrency sentiment remains fearful, technology stocks are attempting to recover, and stronger US employment data has increased expectations of tighter monetary policy.
For Bitcoin, the $73,900–$77,600 region is particularly important.
For Ethereum, investors should watch $2,103 and $2,210.
For BNB, the $674–$701 region could help determine the next short-term direction.
My overall assessment:
- Short-term crypto outlook: Cautious to bearish.
- Bitcoin: Watching key support near $73,900.
- Ethereum: Weak momentum; support around $2,103.
- BNB: Consolidation with downside risk below $674.
- US equities: Selective recovery, but technology volatility remains elevated.
- Global economy: Inflation and interest-rate uncertainty remain major risks.
The next major market catalyst is likely to be the US inflation report and how it changes expectations for Federal Reserve policy.
One important lesson: Markets do not move on sentiment alone. Liquidity, earnings, economic data and investor confidence ultimately determine whether a recovery can last.
DISCLAIMER: This article is for educational and informational purposes only. Cryptocurrency and financial markets involve substantial risks. Technical levels and market scenarios are estimates, not guarantees or investment recommendations. Always conduct your own research (DYOR) and manage risk responsibly.
#Bitcoin #BTC #Ethereum #ETH #bnb #CryptoMarket #FearAndGreedIndex #CryptoFear #FederalReserve #USInflation #CPI #InterestRates #Nasdaq100 #WallStreet #GlobalMarkets #StockMarket #AIStocks #Nvidia #EuropeanMarkets #AsianMarkets #Gold #OilPrices #EconomicOutlook #MarketAnalysis #PositiveMindsGlobalResults
FEAR AT 30: BITCOIN FIGHTS TO HOLD $75K AS FED RATE-HIKE FEARS, AI VOLATILITY AND GLOBAL MARKET
🌍#PositiveMindsGlobalResults #BinanceSquare
| INVEST • LEARN • GROW • TOGETHER
Stay positive. Stay informed. Stay secure! 💛🌍
Global Market Outlook | Monday, November 9, 2026
The global financial markets are entering another critical week, with cryptocurrency investors showing caution, technology stocks struggling to recover from a major sell-off, and expectations of tighter US monetary policy putting additional pressure on risk-sensitive assets.
Bitcoin is trading around $75,000–$76,000, while Ethereum is facing renewed selling pressure and BNB is attempting to stabilize near $690–$700.
The Crypto Fear & Greed Index reading of approximately 30 (Fear) reflects fragile investor confidence. Following the recent market turbulence, investors are closely monitoring US inflation data, Federal Reserve signals, institutional investment flows and developments in major global economies.
But the bigger question is whether this is a temporary market correction or the beginning of a deeper period of financial uncertainty.
1. CRYPTO MARKET: FEAR REPLACES CONFIDENCE
The cryptocurrency market remains under pressure following several developments:
- The recent $6.3 billion Binance-related security incident and continuing concerns about exchange security.
- Uncertainty surrounding future US cryptocurrency regulation following the midterm elections.
- Significant outflows from US spot Bitcoin ETFs.
- Weakness in technology stocks and declining appetite for speculative investments.
- Expectations of potentially higher US interest rates.
Bitcoin and Ethereum recently touched their lowest levels in more than two months. These developments have increased caution among traders and institutional investors.
Fear & Greed Index: Around 30 — Fear
A reading near 30 indicates that investors are becoming defensive. However, fear alone does not guarantee that prices have reached their bottom.
Historically, extreme pessimism can create opportunities for long-term investors, but further declines remain possible when liquidity and market confidence are weak.
2. BITCOIN (BTC): CAN $75,000 HOLD?
Indicative market price: $75,500–$75,800
Bitcoin remains the most important indicator of overall cryptocurrency market direction.
After briefly recovering above $80,000 following the US midterm elections, BTC reversed sharply as technology shares declined and investors reassessed regulatory and monetary-policy risks.
Important technical levels
- Immediate support: $73,900
- Secondary support: $71,800
- Major downside support: $68,700
- Immediate resistance: $76,300
- Secondary resistance: $77,600
- Higher resistance: $81,100
Bullish scenario: If Bitcoin protects the $73,900 support region and establishes a daily close above $76,300–$77,600, a recovery towards $80,000–$81,100 becomes possible.
Bearish scenario: A decisive daily breakdown below $73,900 could expose $71,800, followed by the $68,700 region.
My outlook: BTC remains cautious in the short term. A sustainable recovery requires stronger spot demand, improving ETF flows and a convincing return of buying momentum.
3. ETHEREUM (ETH): SELLING PRESSURE REMAINS A CONCERN
Indicative market price: $2,150–$2,235
Ethereum is experiencing greater short-term weakness than Bitcoin.
Recent selling has pushed ETH towards important technical support zones, while broader market uncertainty continues to affect investor demand.
Important technical levels
- Immediate support: $2,103
- Secondary support: $2,042
- Major support: $1,982
- Immediate resistance: $2,160
- Secondary resistance: $2,210
- Higher resistance: $2,271
Bullish scenario: Holding above $2,103 and reclaiming $2,160–$2,210 could support a recovery towards $2,271.
Bearish scenario: A confirmed breakdown below $2,103 could increase selling pressure towards $2,042 and potentially $1,982.
My outlook: ETH needs stronger market participation and improving momentum before a sustained recovery can be established.
4. BNB: CAN BUYERS DEFEND THE $680–$690 REGION?
Indicative market price: $690–$696
BNB is attempting to stabilize despite the broader cryptocurrency downturn.
However, investors are also monitoring confidence in the Binance ecosystem following recent security-related developments.
Important technical levels
- Immediate support: $674
- Secondary support: $659
- Major support: $626
- Immediate resistance: $690–$701
- Higher resistance: $713
- Additional resistance: $723
Bullish scenario: A sustained recovery above $701 could open the way towards $713–$723.
Bearish scenario: Losing $674 could expose $659, with $626 becoming a deeper downside reference.
My outlook: BNB needs stronger buying volume and renewed market confidence to establish a more convincing recovery.
5. US STOCK MARKET: NASDAQ-100 LEADS FRIDAY'S RECOVERY
Wall Street finished Friday, November 6, with mixed results after a turbulent week dominated by technology-sector selling.
The Nasdaq-100 recovered 1.35%, outperforming the other major indices during Friday's session.
Friday's closing performance:
- Nasdaq-100: +1.35%
- Nasdaq Composite: +1.09%
- Russell 2000: +0.89%
- S&P 500: +0.31%
- Dow Jones: -0.46%
Despite Friday's recovery, the Nasdaq-100 remained down approximately 4.9% for the week.
The rebound was supported by renewed buying in semiconductor and technology shares, including Nvidia, AMD, Intel and Micron.
However, investors remain concerned about expensive AI infrastructure, massive data-centre spending and whether future earnings will justify current valuations.
The technology recovery is encouraging, but it does not yet establish that the wider market correction is over.
6. US INFLATION: OCTOBER CPI COULD CHANGE MARKET EXPECTATIONS
One of the most important events this week is the US Consumer Price Index (CPI), scheduled for Tuesday, November 10.
September's annual inflation rate stood at 3.7%, while economists surveyed by the Associated Press expect October inflation to increase to approximately 3.9%.
Investors will pay particular attention to:
- Headline CPI: Overall consumer price increases.
- Core CPI: Inflation excluding food and energy.
- Energy prices: The impact of geopolitical tensions and oil-market movements.
- Housing and services: Whether underlying inflation remains persistent.
A stronger-than-expected CPI reading could reinforce expectations of further monetary tightening.
A softer inflation report could provide some relief to equities and cryptocurrencies by reducing pressure on interest-rate expectations.
7. FEDERAL RESERVE: DECEMBER RATE-HIKE EXPECTATIONS GROW
The Federal Reserve remains a major influence on global financial markets.
Recent employment figures showed that the US economy added 165,000 jobs in October, significantly above economists' expectations of approximately 65,000.
This stronger employment performance has strengthened expectations that the Fed could increase interest rates again in December.
Market pricing has approached an 80% probability of a 25-basis-point increase, although this is not a confirmed policy decision.
Why this matters for crypto:
Higher interest rates can:
- Strengthen the US dollar.
- Increase borrowing costs.
- Reduce liquidity available for speculative investments.
- Put pressure on technology valuations.
- Weigh on Bitcoin, Ethereum and other digital assets.
The next Federal Reserve meeting is scheduled for December 8–9.
8. EUROPE: TECHNOLOGY WEAKNESS AND ECONOMIC UNCERTAINTY
European markets have also experienced pressure from the global technology sell-off.
During Friday's trading session, the STOXX Europe 600 declined approximately 1%, while technology and semiconductor shares faced significant losses.
ASML, Infineon and other chip-related companies were among the affected businesses.
Investors are monitoring several developments:
- European economic growth and employment figures.
- Energy costs and geopolitical uncertainty.
- European Central Bank policy expectations.
- Semiconductor demand and AI infrastructure investment.
- Developments surrounding the future leadership of the European Central Bank.
Europe's dependence on imported energy also makes oil prices an important economic factor.
9. ASIA: MARKETS ATTEMPT TO RECOVER AFTER A BRUTAL WEEK
Asian markets experienced substantial volatility following the technology sell-off.
Japan's Nikkei and South Korea's Kospi suffered particularly heavy losses last week, while Taiwan's semiconductor sector was affected by concerns about AI investment returns.
However, Monday's trading session brought some recovery.
- MSCI Asia-Pacific excluding Japan: +0.8%
- Japan's Nikkei: +2.5%
- Taiwan's benchmark: approximately +2.5%
Investors are now watching China's inflation and lending figures, semiconductor demand, regional trade developments and preparations for the ASEAN summit in Manila.
The key question for Asian markets is whether technology companies can maintain growth while global investors demand stronger evidence of profitability.
10. OIL, GOLD AND THE US DOLLAR: THREE IMPORTANT MARKET SIGNALS
Other financial indicators are also influencing investor sentiment.
Oil: Brent crude traded around $97–$98 per barrel amid geopolitical uncertainty and developments surrounding US-Iran negotiations.
Gold: Spot gold was around $4,066 per ounce at Friday's close, reflecting continuing interest in precious metals during uncertain market conditions.
US dollar: The dollar index strengthened towards 102.2 as stronger employment data increased expectations of tighter Federal Reserve policy.
These movements matter because energy prices, currency strength and bond yields can influence inflation, global liquidity and investment demand.
11. WHAT SHOULD INVESTORS WATCH THIS WEEK?
The coming days could be important for both traditional financial markets and cryptocurrencies.
Date| Important event
November 9| Global market reaction and economic developments
November 10| US October CPI inflation
November 11| China economic data and regional developments
November 12| US jobless claims and existing home sales
November 13| US October PPI inflation
Corporate earnings from AI infrastructure and semiconductor companies will also provide important clues about whether technology investment can generate sustainable returns.
12. FINAL MARKET OUTLOOK: RECOVERY OR ANOTHER DECLINE?
The current environment presents a complicated picture.
Cryptocurrency sentiment remains fearful, technology stocks are attempting to recover, and stronger US employment data has increased expectations of tighter monetary policy.
For Bitcoin, the $73,900–$77,600 region is particularly important.
For Ethereum, investors should watch $2,103 and $2,210.
For BNB, the $674–$701 region could help determine the next short-term direction.
My overall assessment:
- Short-term crypto outlook: Cautious to bearish.
- Bitcoin: Watching key support near $73,900.
- Ethereum: Weak momentum; support around $2,103.
- BNB: Consolidation with downside risk below $674.
- US equities: Selective recovery, but technology volatility remains elevated.
- Global economy: Inflation and interest-rate uncertainty remain major risks.
The next major market catalyst is likely to be the US inflation report and how it changes expectations for Federal Reserve policy.
One important lesson: Markets do not move on sentiment alone. Liquidity, earnings, economic data and investor confidence ultimately determine whether a recovery can last.
DISCLAIMER: This article is for educational and informational purposes only. Cryptocurrency and financial markets involve substantial risks. Technical levels and market scenarios are estimates, not guarantees or investment recommendations. Always conduct your own research (DYOR) and manage risk responsibly.
#Bitcoin #BTC #Ethereum #ETH #bnb #CryptoMarket #FearAndGreedIndex #CryptoFear #FederalReserve #USInflation #CPI #InterestRates #Nasdaq100 #WallStreet #GlobalMarkets #StockMarket #AIStocks #Nvidia #EuropeanMarkets #AsianMarkets #Gold #OilPrices #EconomicOutlook #MarketAnalysis #PositiveMindsGlobalResults
| INVEST • LEARN • GROW • TOGETHER
Stay positive. Stay informed. Stay secure! 💛🌍
Global Market Outlook | Monday, November 9, 2026
The global financial markets are entering another critical week, with cryptocurrency investors showing caution, technology stocks struggling to recover from a major sell-off, and expectations of tighter US monetary policy putting additional pressure on risk-sensitive assets.
Bitcoin is trading around $75,000–$76,000, while Ethereum is facing renewed selling pressure and BNB is attempting to stabilize near $690–$700.
The Crypto Fear & Greed Index reading of approximately 30 (Fear) reflects fragile investor confidence. Following the recent market turbulence, investors are closely monitoring US inflation data, Federal Reserve signals, institutional investment flows and developments in major global economies.
But the bigger question is whether this is a temporary market correction or the beginning of a deeper period of financial uncertainty.
1. CRYPTO MARKET: FEAR REPLACES CONFIDENCE
The cryptocurrency market remains under pressure following several developments:
- The recent $6.3 billion Binance-related security incident and continuing concerns about exchange security.
- Uncertainty surrounding future US cryptocurrency regulation following the midterm elections.
- Significant outflows from US spot Bitcoin ETFs.
- Weakness in technology stocks and declining appetite for speculative investments.
- Expectations of potentially higher US interest rates.
Bitcoin and Ethereum recently touched their lowest levels in more than two months. These developments have increased caution among traders and institutional investors.
Fear & Greed Index: Around 30 — Fear
A reading near 30 indicates that investors are becoming defensive. However, fear alone does not guarantee that prices have reached their bottom.
Historically, extreme pessimism can create opportunities for long-term investors, but further declines remain possible when liquidity and market confidence are weak.
2. BITCOIN (BTC): CAN $75,000 HOLD?
Indicative market price: $75,500–$75,800
Bitcoin remains the most important indicator of overall cryptocurrency market direction.
After briefly recovering above $80,000 following the US midterm elections, BTC reversed sharply as technology shares declined and investors reassessed regulatory and monetary-policy risks.
Important technical levels
- Immediate support: $73,900
- Secondary support: $71,800
- Major downside support: $68,700
- Immediate resistance: $76,300
- Secondary resistance: $77,600
- Higher resistance: $81,100
Bullish scenario: If Bitcoin protects the $73,900 support region and establishes a daily close above $76,300–$77,600, a recovery towards $80,000–$81,100 becomes possible.
Bearish scenario: A decisive daily breakdown below $73,900 could expose $71,800, followed by the $68,700 region.
My outlook: BTC remains cautious in the short term. A sustainable recovery requires stronger spot demand, improving ETF flows and a convincing return of buying momentum.
3. ETHEREUM (ETH): SELLING PRESSURE REMAINS A CONCERN
Indicative market price: $2,150–$2,235
Ethereum is experiencing greater short-term weakness than Bitcoin.
Recent selling has pushed ETH towards important technical support zones, while broader market uncertainty continues to affect investor demand.
Important technical levels
- Immediate support: $2,103
- Secondary support: $2,042
- Major support: $1,982
- Immediate resistance: $2,160
- Secondary resistance: $2,210
- Higher resistance: $2,271
Bullish scenario: Holding above $2,103 and reclaiming $2,160–$2,210 could support a recovery towards $2,271.
Bearish scenario: A confirmed breakdown below $2,103 could increase selling pressure towards $2,042 and potentially $1,982.
My outlook: ETH needs stronger market participation and improving momentum before a sustained recovery can be established.
4. BNB: CAN BUYERS DEFEND THE $680–$690 REGION?
Indicative market price: $690–$696
BNB is attempting to stabilize despite the broader cryptocurrency downturn.
However, investors are also monitoring confidence in the Binance ecosystem following recent security-related developments.
Important technical levels
- Immediate support: $674
- Secondary support: $659
- Major support: $626
- Immediate resistance: $690–$701
- Higher resistance: $713
- Additional resistance: $723
Bullish scenario: A sustained recovery above $701 could open the way towards $713–$723.
Bearish scenario: Losing $674 could expose $659, with $626 becoming a deeper downside reference.
My outlook: BNB needs stronger buying volume and renewed market confidence to establish a more convincing recovery.
5. US STOCK MARKET: NASDAQ-100 LEADS FRIDAY'S RECOVERY
Wall Street finished Friday, November 6, with mixed results after a turbulent week dominated by technology-sector selling.
The Nasdaq-100 recovered 1.35%, outperforming the other major indices during Friday's session.
Friday's closing performance:
- Nasdaq-100: +1.35%
- Nasdaq Composite: +1.09%
- Russell 2000: +0.89%
- S&P 500: +0.31%
- Dow Jones: -0.46%
Despite Friday's recovery, the Nasdaq-100 remained down approximately 4.9% for the week.
The rebound was supported by renewed buying in semiconductor and technology shares, including Nvidia, AMD, Intel and Micron.
However, investors remain concerned about expensive AI infrastructure, massive data-centre spending and whether future earnings will justify current valuations.
The technology recovery is encouraging, but it does not yet establish that the wider market correction is over.
6. US INFLATION: OCTOBER CPI COULD CHANGE MARKET EXPECTATIONS
One of the most important events this week is the US Consumer Price Index (CPI), scheduled for Tuesday, November 10.
September's annual inflation rate stood at 3.7%, while economists surveyed by the Associated Press expect October inflation to increase to approximately 3.9%.
Investors will pay particular attention to:
- Headline CPI: Overall consumer price increases.
- Core CPI: Inflation excluding food and energy.
- Energy prices: The impact of geopolitical tensions and oil-market movements.
- Housing and services: Whether underlying inflation remains persistent.
A stronger-than-expected CPI reading could reinforce expectations of further monetary tightening.
A softer inflation report could provide some relief to equities and cryptocurrencies by reducing pressure on interest-rate expectations.
7. FEDERAL RESERVE: DECEMBER RATE-HIKE EXPECTATIONS GROW
The Federal Reserve remains a major influence on global financial markets.
Recent employment figures showed that the US economy added 165,000 jobs in October, significantly above economists' expectations of approximately 65,000.
This stronger employment performance has strengthened expectations that the Fed could increase interest rates again in December.
Market pricing has approached an 80% probability of a 25-basis-point increase, although this is not a confirmed policy decision.
Why this matters for crypto:
Higher interest rates can:
- Strengthen the US dollar.
- Increase borrowing costs.
- Reduce liquidity available for speculative investments.
- Put pressure on technology valuations.
- Weigh on Bitcoin, Ethereum and other digital assets.
The next Federal Reserve meeting is scheduled for December 8–9.
8. EUROPE: TECHNOLOGY WEAKNESS AND ECONOMIC UNCERTAINTY
European markets have also experienced pressure from the global technology sell-off.
During Friday's trading session, the STOXX Europe 600 declined approximately 1%, while technology and semiconductor shares faced significant losses.
ASML, Infineon and other chip-related companies were among the affected businesses.
Investors are monitoring several developments:
- European economic growth and employment figures.
- Energy costs and geopolitical uncertainty.
- European Central Bank policy expectations.
- Semiconductor demand and AI infrastructure investment.
- Developments surrounding the future leadership of the European Central Bank.
Europe's dependence on imported energy also makes oil prices an important economic factor.
9. ASIA: MARKETS ATTEMPT TO RECOVER AFTER A BRUTAL WEEK
Asian markets experienced substantial volatility following the technology sell-off.
Japan's Nikkei and South Korea's Kospi suffered particularly heavy losses last week, while Taiwan's semiconductor sector was affected by concerns about AI investment returns.
However, Monday's trading session brought some recovery.
- MSCI Asia-Pacific excluding Japan: +0.8%
- Japan's Nikkei: +2.5%
- Taiwan's benchmark: approximately +2.5%
Investors are now watching China's inflation and lending figures, semiconductor demand, regional trade developments and preparations for the ASEAN summit in Manila.
The key question for Asian markets is whether technology companies can maintain growth while global investors demand stronger evidence of profitability.
10. OIL, GOLD AND THE US DOLLAR: THREE IMPORTANT MARKET SIGNALS
Other financial indicators are also influencing investor sentiment.
Oil: Brent crude traded around $97–$98 per barrel amid geopolitical uncertainty and developments surrounding US-Iran negotiations.
Gold: Spot gold was around $4,066 per ounce at Friday's close, reflecting continuing interest in precious metals during uncertain market conditions.
US dollar: The dollar index strengthened towards 102.2 as stronger employment data increased expectations of tighter Federal Reserve policy.
These movements matter because energy prices, currency strength and bond yields can influence inflation, global liquidity and investment demand.
11. WHAT SHOULD INVESTORS WATCH THIS WEEK?
The coming days could be important for both traditional financial markets and cryptocurrencies.
Date| Important event
November 9| Global market reaction and economic developments
November 10| US October CPI inflation
November 11| China economic data and regional developments
November 12| US jobless claims and existing home sales
November 13| US October PPI inflation
Corporate earnings from AI infrastructure and semiconductor companies will also provide important clues about whether technology investment can generate sustainable returns.
12. FINAL MARKET OUTLOOK: RECOVERY OR ANOTHER DECLINE?
The current environment presents a complicated picture.
Cryptocurrency sentiment remains fearful, technology stocks are attempting to recover, and stronger US employment data has increased expectations of tighter monetary policy.
For Bitcoin, the $73,900–$77,600 region is particularly important.
For Ethereum, investors should watch $2,103 and $2,210.
For BNB, the $674–$701 region could help determine the next short-term direction.
My overall assessment:
- Short-term crypto outlook: Cautious to bearish.
- Bitcoin: Watching key support near $73,900.
- Ethereum: Weak momentum; support around $2,103.
- BNB: Consolidation with downside risk below $674.
- US equities: Selective recovery, but technology volatility remains elevated.
- Global economy: Inflation and interest-rate uncertainty remain major risks.
The next major market catalyst is likely to be the US inflation report and how it changes expectations for Federal Reserve policy.
One important lesson: Markets do not move on sentiment alone. Liquidity, earnings, economic data and investor confidence ultimately determine whether a recovery can last.
DISCLAIMER: This article is for educational and informational purposes only. Cryptocurrency and financial markets involve substantial risks. Technical levels and market scenarios are estimates, not guarantees or investment recommendations. Always conduct your own research (DYOR) and manage risk responsibly.
#Bitcoin #BTC #Ethereum #ETH #bnb #CryptoMarket #FearAndGreedIndex #CryptoFear #FederalReserve #USInflation #CPI #InterestRates #Nasdaq100 #WallStreet #GlobalMarkets #StockMarket #AIStocks #Nvidia #EuropeanMarkets #AsianMarkets #Gold #OilPrices #EconomicOutlook #MarketAnalysis #PositiveMindsGlobalResults
115

$XRP is showing clean bounce signals after that flush. Sellers are drying up at these lower levels.
Around $122.1M USDT in volume is stepping in to absorb the selling.
Live Setup ($XRP):
• Entry Zone: $1.106 (-4.71%)
• Direction: Demand Reversal (Long)
• Target 1: $1.125 (Quick Scalp)
• Target 2: $1.144 (Mid Pivot)
• Target 3: $1.167 (Full Recovery)
• Stop Loss: $1.083 (Strict)
Execution Rule: Secure partials at Target 1 and trail your stop to breakeven. Keep your risk strictly calculated.
Are you buying this dip or waiting for lower levels? Let me know below 👇
#XRP #BinanceSquare #CryptoTrading #Signals
$XRP is showing clean bounce signals after that flush. Sellers are drying up at these lower levels.
Around $122.1M USDT in volume is stepping in to absorb the selling.
Live Setup ($XRP ):
• Entry Zone: $1.106 (-4.71%)
• Direction: Demand Reversal (Long)
• Target 1: $1.125 (Quick Scalp)
• Target 2: $1.144 (Mid Pivot)
• Target 3: $1.167 (Full Recovery)
• Stop Loss: $1.083 (Strict)
Execution Rule: Secure partials at Target 1 and trail your stop to breakeven. Keep your risk strictly calculated.
Are you buying this dip or waiting for lower levels? Let me know below 👇
#XRP #BinanceSquare #CryptoTrading #Signals
Around $122.1M USDT in volume is stepping in to absorb the selling.
Live Setup ($XRP ):
• Entry Zone: $1.106 (-4.71%)
• Direction: Demand Reversal (Long)
• Target 1: $1.125 (Quick Scalp)
• Target 2: $1.144 (Mid Pivot)
• Target 3: $1.167 (Full Recovery)
• Stop Loss: $1.083 (Strict)
Execution Rule: Secure partials at Target 1 and trail your stop to breakeven. Keep your risk strictly calculated.
Are you buying this dip or waiting for lower levels? Let me know below 👇
#XRP #BinanceSquare #CryptoTrading #Signals
55

·
--
🚨 SOLANA IS AT A CRITICAL DECISION ZONE!
$SOL is trading around $87–$88, and the chart is showing strong bearish pressure.
📉 24H change: Around -2% to -3%
📉 7D change: Around -7%
📊 Daily RSI: Near 30 (oversold territory)
🎯 Key levels to watch:
- Support: $84.40
- Lower support: $81.60
- Resistance: $89.20
- Next resistance: $91.50
Trading scenarios:
🟢 A confirmed breakout above $89.20 could open a recovery toward $91.50–$94.
🔴 A breakdown below $84.40 could expose $81.60 next.
My view: SOL is showing oversold conditions, but that doesn't confirm a reversal. Watch volume and candle closes before taking a position.
Are bulls preparing a comeback, or will sellers push SOL lower?
#SOL #SolanaUSTD #Binancesquare
{future}(SOLUSDT)
🚨 SOLANA IS AT A CRITICAL DECISION ZONE!
$SOL is trading around $87–$88, and the chart is showing strong bearish pressure.
📉 24H change: Around -2% to -3%
📉 7D change: Around -7%
📊 Daily RSI: Near 30 (oversold territory)
🎯 Key levels to watch:
- Support: $84.40
- Lower support: $81.60
- Resistance: $89.20
- Next resistance: $91.50
Trading scenarios:
🟢 A confirmed breakout above $89.20 could open a recovery toward $91.50–$94.
🔴 A breakdown below $84.40 could expose $81.60 next.
My view: SOL is showing oversold conditions, but that doesn't confirm a reversal. Watch volume and candle closes before taking a position.
Are bulls preparing a comeback, or will sellers push SOL lower?
#SOL #SolanaUSTD #Binancesquare
$SOL is trading around $87–$88, and the chart is showing strong bearish pressure.
📉 24H change: Around -2% to -3%
📉 7D change: Around -7%
📊 Daily RSI: Near 30 (oversold territory)
🎯 Key levels to watch:
- Support: $84.40
- Lower support: $81.60
- Resistance: $89.20
- Next resistance: $91.50
Trading scenarios:
🟢 A confirmed breakout above $89.20 could open a recovery toward $91.50–$94.
🔴 A breakdown below $84.40 could expose $81.60 next.
My view: SOL is showing oversold conditions, but that doesn't confirm a reversal. Watch volume and candle closes before taking a position.
Are bulls preparing a comeback, or will sellers push SOL lower?
#SOL #SolanaUSTD #Binancesquare
207

·
--
🔥 $XRP Technical Update: Key Levels & Momentum Breakdown
📊 1. Market Snapshot
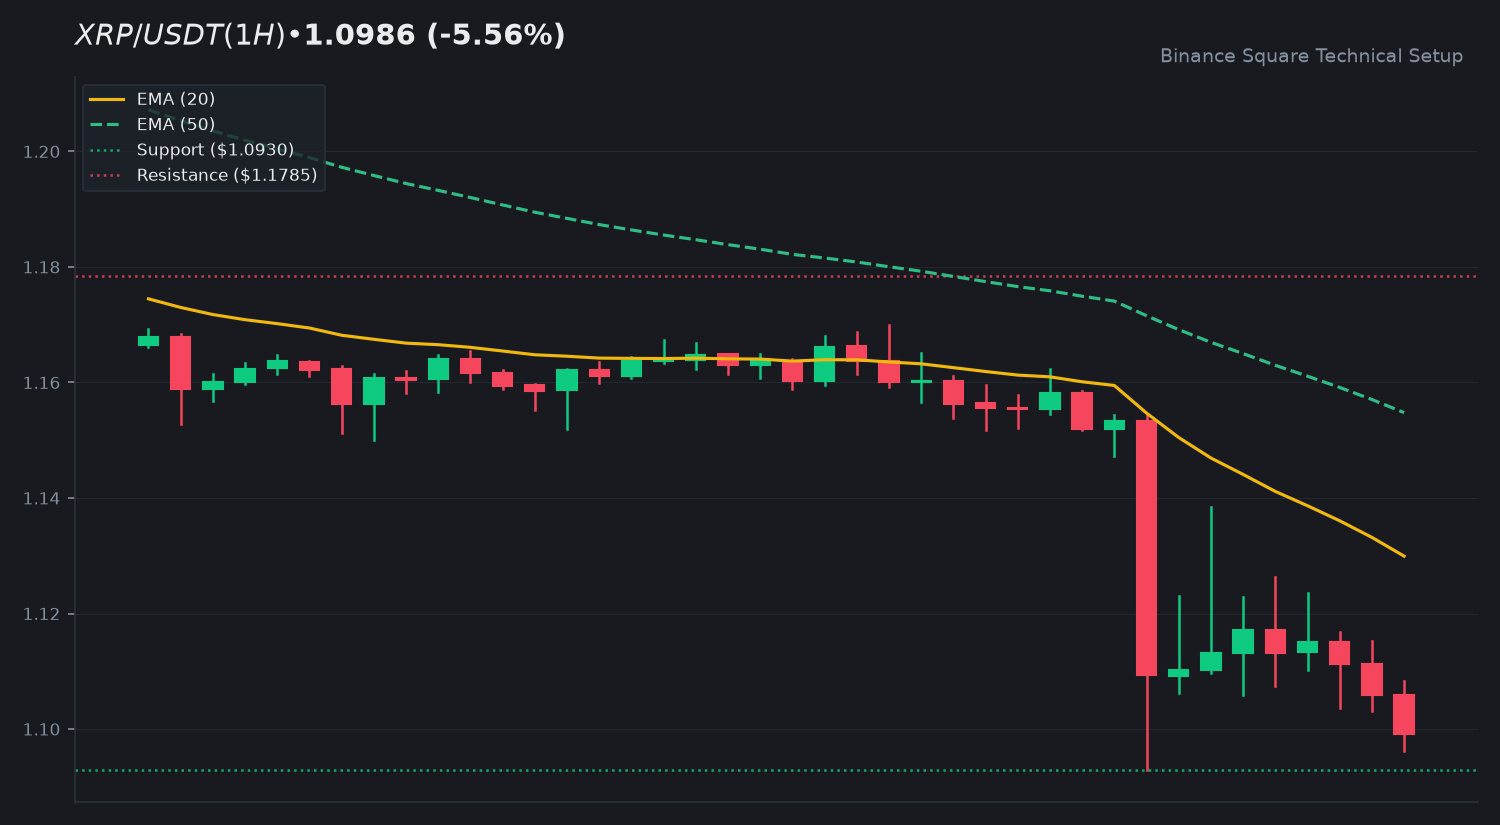
The current price of $XRP is 1.0986 USDT, reflecting a 24h change of -5.56%. Market activity is elevated, with 24h quote volume reaching 128,661,549 USDT. Trading volume currently stands at 1.51x the 20-day SMA, indicating significant market participation during this downward movement.
📈 2. Technical Momentum & Indicator Bias
The price is trading below both the EMA 20 at 1.1299 and the EMA 50 at 1.1548, signaling a dominant bearish posture in the short to medium term. The RSI is currently at 20.71, placing the asset in oversold territory, which often invites technical scrutiny regarding potential mean reversion. The MACD histogram is at -0.0033 with the MACD line below the signal line, confirming a lack of immediate bullish momentum.
🎯 3. Key Technical Levels to Watch
• 🟢 Resistance Zone: 1.1785 is the immediate hurdle, with a secondary extension level at 1.3271.
• 🔴 Support Zone: 1.0930 serves as the current floor. A breach here would require monitoring for further liquidity shifts.
• 🛡️ Pivot Confluence: The 1.1299 EMA 20 level acts as a critical pivot for any potential retracement.
💡 4. Technical Takeaway & Risk Management
Current price action remains under pressure from the moving averages. Traders are observing whether the RSI oversold condition leads to consolidation or if the volume-backed downtrend continues to test lower support floors. Monitoring the interaction between price and the EMA 20 will be vital for identifying potential shifts in trend momentum.
💬 5. Community Discussion
What is your technical outlook for $XRP this week? Are you accumulating or waiting for confirmation? Drop your thoughts below! 👇
⚠️ 6. Disclaimer
Educational technical analysis only. Not financial advice (NFA). Crypto markets involve risk. Always DYOR.
$XRP #XRP #BinanceSquare
🔥 $XRP Technical Update: Key Levels & Momentum Breakdown
📊 1. Market Snapshot
The current price of $XRP is 1.0986 USDT, reflecting a 24h change of -5.56%. Market activity is elevated, with 24h quote volume reaching 128,661,549 USDT. Trading volume currently stands at 1.51x the 20-day SMA, indicating significant market participation during this downward movement.
📈 2. Technical Momentum & Indicator Bias
The price is trading below both the EMA 20 at 1.1299 and the EMA 50 at 1.1548, signaling a dominant bearish posture in the short to medium term. The RSI is currently at 20.71, placing the asset in oversold territory, which often invites technical scrutiny regarding potential mean reversion. The MACD histogram is at -0.0033 with the MACD line below the signal line, confirming a lack of immediate bullish momentum.
🎯 3. Key Technical Levels to Watch
• 🟢 Resistance Zone: 1.1785 is the immediate hurdle, with a secondary extension level at 1.3271.
• 🔴 Support Zone: 1.0930 serves as the current floor. A breach here would require monitoring for further liquidity shifts.
• 🛡️ Pivot Confluence: The 1.1299 EMA 20 level acts as a critical pivot for any potential retracement.
💡 4. Technical Takeaway & Risk Management
Current price action remains under pressure from the moving averages. Traders are observing whether the RSI oversold condition leads to consolidation or if the volume-backed downtrend continues to test lower support floors. Monitoring the interaction between price and the EMA 20 will be vital for identifying potential shifts in trend momentum.
💬 5. Community Discussion
What is your technical outlook for $XRP this week? Are you accumulating or waiting for confirmation? Drop your thoughts below! 👇
⚠️ 6. Disclaimer
Educational technical analysis only. Not financial advice (NFA). Crypto markets involve risk. Always DYOR.
$XRP #XRP #BinanceSquare
📊 1. Market Snapshot
The current price of $XRP is 1.0986 USDT, reflecting a 24h change of -5.56%. Market activity is elevated, with 24h quote volume reaching 128,661,549 USDT. Trading volume currently stands at 1.51x the 20-day SMA, indicating significant market participation during this downward movement.
📈 2. Technical Momentum & Indicator Bias
The price is trading below both the EMA 20 at 1.1299 and the EMA 50 at 1.1548, signaling a dominant bearish posture in the short to medium term. The RSI is currently at 20.71, placing the asset in oversold territory, which often invites technical scrutiny regarding potential mean reversion. The MACD histogram is at -0.0033 with the MACD line below the signal line, confirming a lack of immediate bullish momentum.
🎯 3. Key Technical Levels to Watch
• 🟢 Resistance Zone: 1.1785 is the immediate hurdle, with a secondary extension level at 1.3271.
• 🔴 Support Zone: 1.0930 serves as the current floor. A breach here would require monitoring for further liquidity shifts.
• 🛡️ Pivot Confluence: The 1.1299 EMA 20 level acts as a critical pivot for any potential retracement.
💡 4. Technical Takeaway & Risk Management
Current price action remains under pressure from the moving averages. Traders are observing whether the RSI oversold condition leads to consolidation or if the volume-backed downtrend continues to test lower support floors. Monitoring the interaction between price and the EMA 20 will be vital for identifying potential shifts in trend momentum.
💬 5. Community Discussion
What is your technical outlook for $XRP this week? Are you accumulating or waiting for confirmation? Drop your thoughts below! 👇
⚠️ 6. Disclaimer
Educational technical analysis only. Not financial advice (NFA). Crypto markets involve risk. Always DYOR.
$XRP #XRP #BinanceSquare
145

·
--
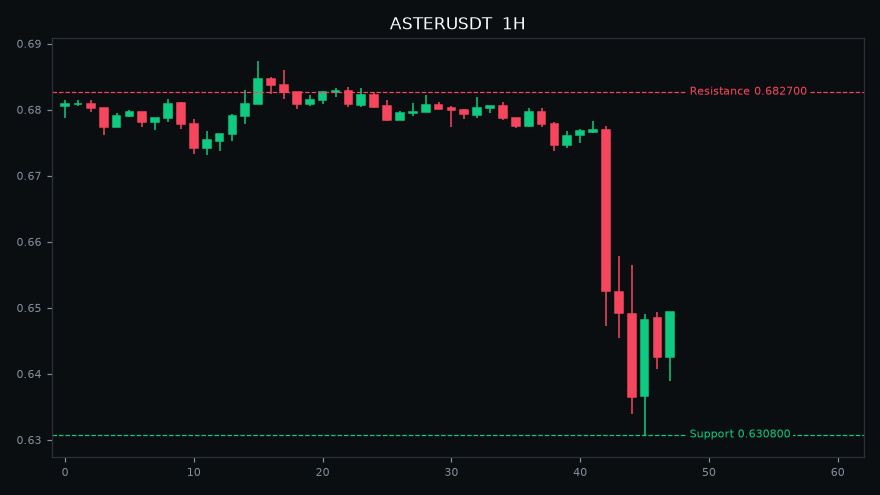
📉 $ASTER dumping: -4.9% today
Price: 0.649300
24h High: 0.683300 | 24h Low: 0.630800
24h Volume: $7.0M
Support: 0.630800 | Resistance: 0.682700
RSI 30: oversold zone.
Sellers are in control for now.
#ASTER #Binance #CryptoTrading #BinanceSquare
⚠️ Educational only, not financial advice. DYOR.
📉 $ASTER dumping: -4.9% today
Price: 0.649300
24h High: 0.683300 | 24h Low: 0.630800
24h Volume: $7.0M
Support: 0.630800 | Resistance: 0.682700
RSI 30: oversold zone.
Sellers are in control for now.
#ASTER #Binance #CryptoTrading #BinanceSquare
⚠️ Educational only, not financial advice. DYOR.
Price: 0.649300
24h High: 0.683300 | 24h Low: 0.630800
24h Volume: $7.0M
Support: 0.630800 | Resistance: 0.682700
RSI 30: oversold zone.
Sellers are in control for now.
#ASTER #Binance #CryptoTrading #BinanceSquare
⚠️ Educational only, not financial advice. DYOR.
371

·
--
Hourly volume on $ARB just spiked to 1.85 times the daily average.
The token trades at $0.1695, up 0.77% over 24 hours. Momentum buyers are testing the upper boundary of the recent $0.1598 to $0.1713 range.
A bullish continuation scenario requires sustained acceptance above the $0.1713 high on expanding volume. Conversely, fading volume near current levels risks a rotation back toward the $0.1598 range low.
Will you wait for a confirmed hourly close above $0.1713, or does a drop toward $0.1598 invalidate your entry plan?
Tap $ARB for the live chart. #ARB #BinanceSquare
Hourly volume on $ARB just spiked to 1.85 times the daily average.
The token trades at $0.1695, up 0.77% over 24 hours. Momentum buyers are testing the upper boundary of the recent $0.1598 to $0.1713 range.
A bullish continuation scenario requires sustained acceptance above the $0.1713 high on expanding volume. Conversely, fading volume near current levels risks a rotation back toward the $0.1598 range low.
Will you wait for a confirmed hourly close above $0.1713, or does a drop toward $0.1598 invalidate your entry plan?
Tap $ARB for the live chart. #ARB #BinanceSquare
The token trades at $0.1695, up 0.77% over 24 hours. Momentum buyers are testing the upper boundary of the recent $0.1598 to $0.1713 range.
A bullish continuation scenario requires sustained acceptance above the $0.1713 high on expanding volume. Conversely, fading volume near current levels risks a rotation back toward the $0.1598 range low.
Will you wait for a confirmed hourly close above $0.1713, or does a drop toward $0.1598 invalidate your entry plan?
Tap $ARB for the live chart. #ARB #BinanceSquare
64

$HOT SURGES +16%! OVER 8.7M VOL LAYER 1 / LAYER 2 GAINER WITH FRESH TRAILING SAR SUPPORT AT $0.000394 — RSI AT 75.03 TARGETING A BREAKOUT PAST $0.000423 FOR $0.000526 RETEST?
Binance Layer 1 / Layer 2 top gainers are kicking off the week with intense buying volume! HOT (Holo) has logged a powerful +16.90% daily surge, backed by an impressive 8.71M USDT (19.58B $HOT) in 24-hour trading volume!
After bottoming at 0.000347 and holding dynamic higher-low support at 0.000390, price action launched an aggressive V-shape green bounce. $HOT is currently expanding strong momentum near 0.000415.
Master Scalp Setup & Strategic Levels:
Trade Bias: Strong Bullish Rebound / Scalp Long
Accumulation Entry Zone: 0.000394 – 0.000415 (Trailing SAR dynamic support range)
Key Targets: 0.000423 ➡️ 0.000443 ➡️ 0.000526 (24h Peak Retest)
Stop Loss: Below 0.000385
Why This Setup is Primed for Expansion:
Dynamic Parabolic SAR Trailing Support Flip: Parabolic SAR dots on the 15m chart have cleanly flipped directly beneath price candles at 0.000394, locking firm dynamic support for the ongoing rally.
Strong RSI Momentum Expansion: The 15m RSI (6) sits at a super strong 75.03 in high-momentum territory, supported by steady green volume candles. A decisive 15m push past 0.000423 clears the pathway for a fast move toward 0.000443 and the 0.000526 peak high.
Are you taking a long entry on HOT at this $0.000394 SAR support floor, or waiting for a breakout close above $0.000423? Share your strategy in the comments below!
Trade Now $HOT
{spot}(HOTUSDT)
#HotTrends #HOT #Holo
#BinanceSquare
$HOT SURGES +16%! OVER 8.7M VOL LAYER 1 / LAYER 2 GAINER WITH FRESH TRAILING SAR SUPPORT AT $0.000394 — RSI AT 75.03 TARGETING A BREAKOUT PAST $0.000423 FOR $0.000526 RETEST?
Binance Layer 1 / Layer 2 top gainers are kicking off the week with intense buying volume! HOT (Holo) has logged a powerful +16.90% daily surge, backed by an impressive 8.71M USDT (19.58B $HOT ) in 24-hour trading volume!
After bottoming at 0.000347 and holding dynamic higher-low support at 0.000390, price action launched an aggressive V-shape green bounce. $HOT is currently expanding strong momentum near 0.000415.
Master Scalp Setup & Strategic Levels:
Trade Bias: Strong Bullish Rebound / Scalp Long
Accumulation Entry Zone: 0.000394 – 0.000415 (Trailing SAR dynamic support range)
Key Targets: 0.000423 ➡️ 0.000443 ➡️ 0.000526 (24h Peak Retest)
Stop Loss: Below 0.000385
Why This Setup is Primed for Expansion:
Dynamic Parabolic SAR Trailing Support Flip: Parabolic SAR dots on the 15m chart have cleanly flipped directly beneath price candles at 0.000394, locking firm dynamic support for the ongoing rally.
Strong RSI Momentum Expansion: The 15m RSI (6) sits at a super strong 75.03 in high-momentum territory, supported by steady green volume candles. A decisive 15m push past 0.000423 clears the pathway for a fast move toward 0.000443 and the 0.000526 peak high.
Are you taking a long entry on HOT at this $0.000394 SAR support floor, or waiting for a breakout close above $0.000423? Share your strategy in the comments below!
Trade Now $HOT
#HotTrends #HOT #Holo
#BinanceSquare
Binance Layer 1 / Layer 2 top gainers are kicking off the week with intense buying volume! HOT (Holo) has logged a powerful +16.90% daily surge, backed by an impressive 8.71M USDT (19.58B $HOT ) in 24-hour trading volume!
After bottoming at 0.000347 and holding dynamic higher-low support at 0.000390, price action launched an aggressive V-shape green bounce. $HOT is currently expanding strong momentum near 0.000415.
Master Scalp Setup & Strategic Levels:
Trade Bias: Strong Bullish Rebound / Scalp Long
Accumulation Entry Zone: 0.000394 – 0.000415 (Trailing SAR dynamic support range)
Key Targets: 0.000423 ➡️ 0.000443 ➡️ 0.000526 (24h Peak Retest)
Stop Loss: Below 0.000385
Why This Setup is Primed for Expansion:
Dynamic Parabolic SAR Trailing Support Flip: Parabolic SAR dots on the 15m chart have cleanly flipped directly beneath price candles at 0.000394, locking firm dynamic support for the ongoing rally.
Strong RSI Momentum Expansion: The 15m RSI (6) sits at a super strong 75.03 in high-momentum territory, supported by steady green volume candles. A decisive 15m push past 0.000423 clears the pathway for a fast move toward 0.000443 and the 0.000526 peak high.
Are you taking a long entry on HOT at this $0.000394 SAR support floor, or waiting for a breakout close above $0.000423? Share your strategy in the comments below!
Trade Now $HOT
#HotTrends #HOT #Holo
#BinanceSquare
1
250

·
--
The feed can't agree on $TRUMP
{spot}(TRUMPUSDT)
. Some say the bounce is coming. Others say it's going to zero, or getting delisted. The price is holding $1.19, right on the line from the crash. Tuesday brings the CPI print — the next catalyst. Bounce, or breakdown — and does CPI decide it?
$TRUMP #TRUMP #trumpcoin #BinanceSquare #crypto
The feed can't agree on $TRUMP
. Some say the bounce is coming. Others say it's going to zero, or getting delisted. The price is holding $1.19, right on the line from the crash. Tuesday brings the CPI print — the next catalyst. Bounce, or breakdown — and does CPI decide it?
$TRUMP #TRUMP #trumpcoin #BinanceSquare #crypto
. Some say the bounce is coming. Others say it's going to zero, or getting delisted. The price is holding $1.19, right on the line from the crash. Tuesday brings the CPI print — the next catalyst. Bounce, or breakdown — and does CPI decide it?
$TRUMP #TRUMP #trumpcoin #BinanceSquare #crypto
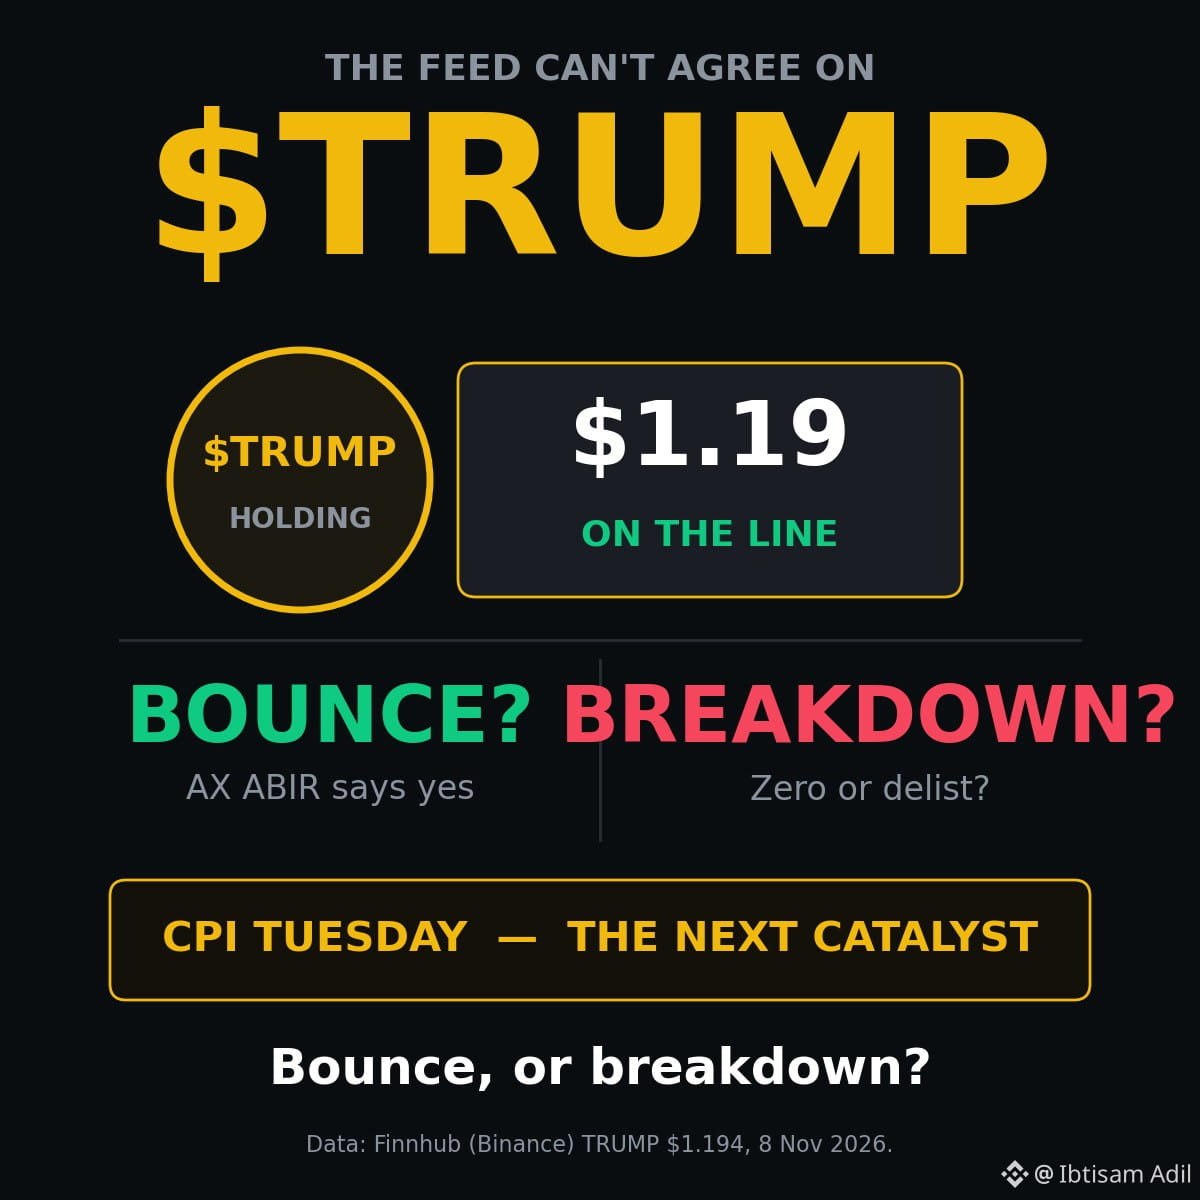
170
·
--
Today the market is bleeding — BTC $74,693, ETH −5.2%, $TRUMP broke the $1.19 line and sits at $1.13. But tomorrow decides everything. CPI lands Tuesday at 8:30 AM ET. If it comes in hot, the bleeding continues. If it comes in cool, the bounce starts. What's your call — bounce, or more downside?
$BTC $ETH #cpi #BinanceSquare #crypto
Today the market is bleeding — BTC $74,693, ETH −5.2%, $TRUMP broke the $1.19 line and sits at $1.13. But tomorrow decides everything. CPI lands Tuesday at 8:30 AM ET. If it comes in hot, the bleeding continues. If it comes in cool, the bounce starts. What's your call — bounce, or more downside?
$BTC $ETH #cpi #BinanceSquare #crypto
$BTC $ETH #cpi #BinanceSquare #crypto
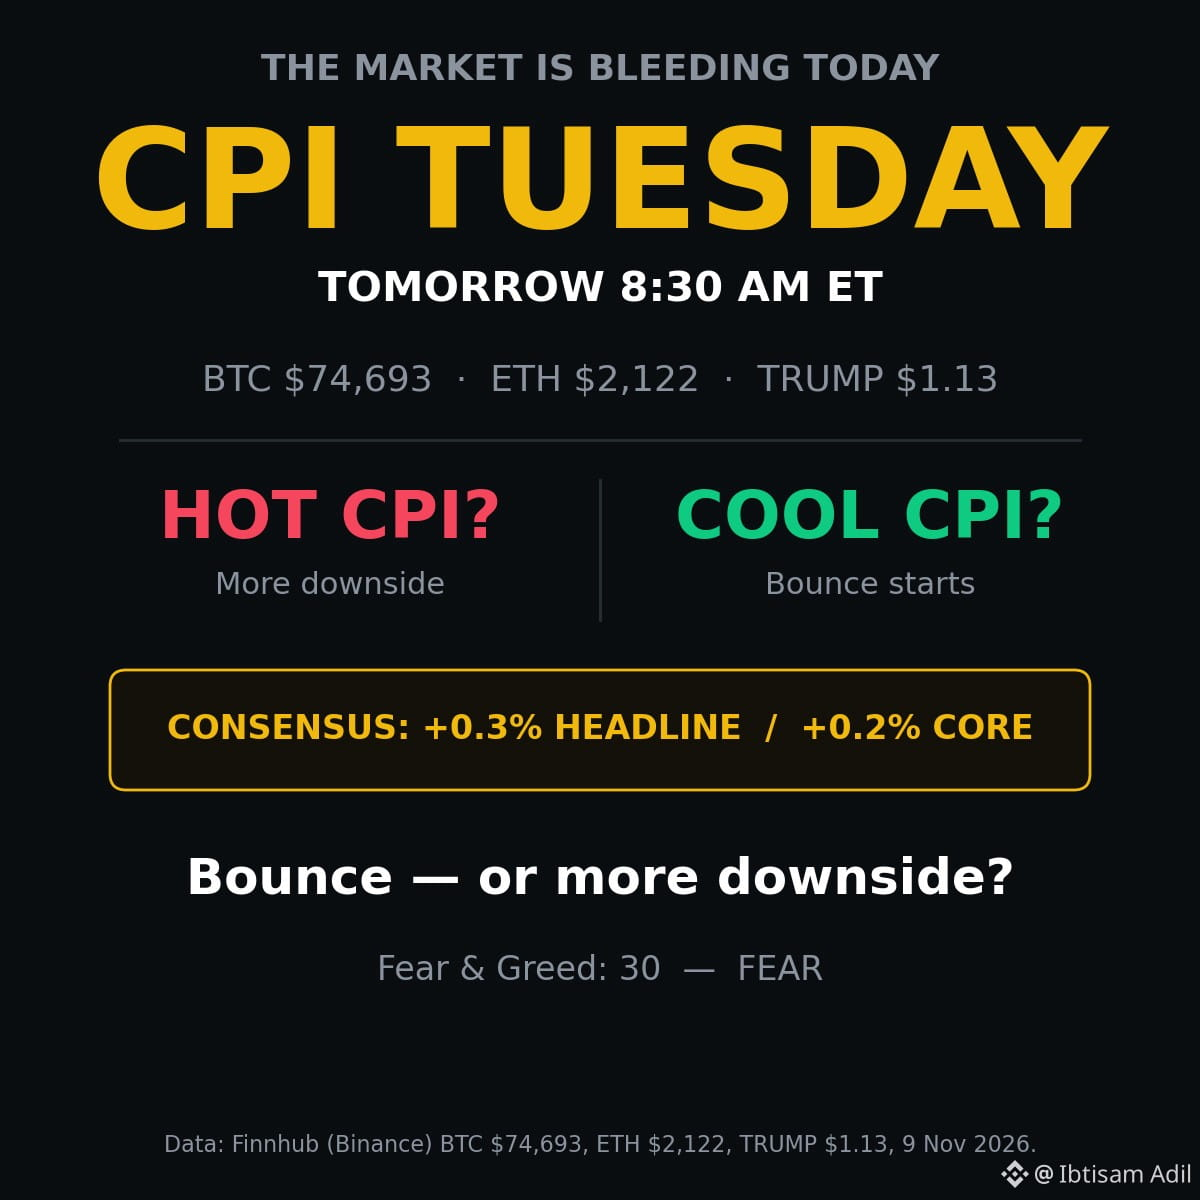
133

·
--
🚨 $ONE : Is the Pump Losing Momentum? ☠️📉 Buyers are watching closely, but resistance pressure could trigger a sharp pullback — is it time for sellers to take control? 🔥💰
#one #Crypto #BinanceSquare
{future}(ONEUSDT)
🚨 $ONE : Is the Pump Losing Momentum? ☠️📉 Buyers are watching closely, but resistance pressure could trigger a sharp pullback — is it time for sellers to take control? 🔥💰
#one #Crypto #BinanceSquare
#one #Crypto #BinanceSquare
304


·
--
Bullish
🐸 $PEPE /Usdt
The Market Is Crashing, But Is PEPE Showing Relative Strength?
📊 Current Price: $0.00000506
While the broader crypto market is facing heavy selling pressure, $PEPE is maintaining its current price area. That's something I'm watching closely.
As a trader, I've researched PEPE in depth, studied its official website and available project documentation, and analyzed its price action across multiple timeframes.
🔥 My Bullish Perspective
What interests me is its strong community recognition and potential to attract renewed buying interest when market sentiment improves.
I believe PEPEcould deliver an impressive comeback in a future bullish cycle. I'm keeping it on my watchlist and looking for suitable trading opportunities rather than blindly chasing the price.
🐸 My question to the community:
Could $PEPE surprise everyone with a major comeback? Are you considering it for your long-term portfolio?
Let's discuss!
DYOR | NFA
#PEPE #memecoins #BinanceSquare
@Pepe
🐸 $PEPE /Usdt
The Market Is Crashing, But Is PEPE Showing Relative Strength?
📊 Current Price: $0.00000506
While the broader crypto market is facing heavy selling pressure, $PEPE is maintaining its current price area. That's something I'm watching closely.
As a trader, I've researched PEPE in depth, studied its official website and available project documentation, and analyzed its price action across multiple timeframes.
🔥 My Bullish Perspective
What interests me is its strong community recognition and potential to attract renewed buying interest when market sentiment improves.
I believe PEPEcould deliver an impressive comeback in a future bullish cycle. I'm keeping it on my watchlist and looking for suitable trading opportunities rather than blindly chasing the price.
🐸 My question to the community:
Could $PEPE surprise everyone with a major comeback? Are you considering it for your long-term portfolio?
Let's discuss!
DYOR | NFA
#PEPE #memecoins #BinanceSquare
@Pepe
The Market Is Crashing, But Is PEPE Showing Relative Strength?
📊 Current Price: $0.00000506
While the broader crypto market is facing heavy selling pressure, $PEPE is maintaining its current price area. That's something I'm watching closely.
As a trader, I've researched PEPE in depth, studied its official website and available project documentation, and analyzed its price action across multiple timeframes.
🔥 My Bullish Perspective
What interests me is its strong community recognition and potential to attract renewed buying interest when market sentiment improves.
I believe PEPEcould deliver an impressive comeback in a future bullish cycle. I'm keeping it on my watchlist and looking for suitable trading opportunities rather than blindly chasing the price.
🐸 My question to the community:
Could $PEPE surprise everyone with a major comeback? Are you considering it for your long-term portfolio?
Let's discuss!
DYOR | NFA
#PEPE #memecoins #BinanceSquare
@Pepe

Queen_DoLL:
I agree! Relative strength during a market downturn is worth watching. $PEPE has the community power, but sustained buying volume will be key to confirming a real comeback. 🐸🔥
1
1
4
229

·
--
Bearish
Monday’s crypto market check: Bitcoin is around $75,285, down about 0.7% over 24 hours, while Ethereum is near $2,148, down about 3.9%. Major coins are mixed, with ETH weaker than BTC in this snapshot. Crypto prices move quickly, so this is a snapshot, not a forecast.
What are you watching today: BTC, ETH, or something else? Share your view and the data behind it.
#Bitcoin #BTC #Ethereum #BinanceSquare $BTC $ETH
Monday’s crypto market check: Bitcoin is around $75,285, down about 0.7% over 24 hours, while Ethereum is near $2,148, down about 3.9%. Major coins are mixed, with ETH weaker than BTC in this snapshot. Crypto prices move quickly, so this is a snapshot, not a forecast.
What are you watching today: BTC, ETH, or something else? Share your view and the data behind it.
#Bitcoin #BTC #Ethereum #BinanceSquare $BTC $ETH
What are you watching today: BTC, ETH, or something else? Share your view and the data behind it.
#Bitcoin #BTC #Ethereum #BinanceSquare $BTC $ETH
1
247
Log in to explore more content
Join global crypto users on Binance Square
⚡️ Get latest and useful information about crypto.
💬 Trusted by the world’s largest crypto exchange.
👍 Discover real insights from verified creators.
Email / Phone number
Trending Topics
1
#BitcoinFiveWeeklyLosses
28,248 views
629 Discussing
2
#AIChipSlumpNasdaq
15,526 views
359 Discussing
3
#NvidiaInvestigatesAfterHuang’sAffairApology
14,329 views
197 Discussing
4
#EthereumSpotETFsPost$365MWeeklyOutflow
332 views
19 Discussing
5
#TradFiForBeginners
252,727 views
2,248 Discussing
6
#SouthKoreaDraftLawTargets15To20%ShareholderCap
180,247 views
935 Discussing
7
#KeplrAdvisesSocialLoginUsersToTransferAssets
84,786 views
641 Discussing
8
#TetherPlans€28.8MForJuventusCapitalIncrease
59,256 views
472 Discussing
9
#JobsReportRaisesHikeOdds
1M views
4,657 Discussing
10
#CPITestsDecemberRateOutlook
472,944 views
2,040 Discussing