
#xusd
xusd
248,082 views
661 Discussing
Hot
Latest

·
--
$XUSD +0.00% | $WLFI +0.00% | $RLUSD +0.00%
#XUSD holds steady at $1.00 with flat price action and $4.0 M volume. Its contract, launched by StraitsX on Ethereum in February 2024, remains a quiet anchor in the stablecoin space.
#WLFI trades at $0.0474, also unchanged, on $4.5 M volume. The token’s low‑key movement suggests liquidity is holding, though any shift could be subtle.
#RLUSD stays at $1.00, unchanged, backed by $60.8 M volume. The high turnover hints at ongoing interest despite the static price.
👀 Watch the volume patterns; a sudden rise could precede price movement for these flat‑lined assets.
#Write2Earn #Binance
$XUSD +0.00% | $WLFI +0.00% | $RLUSD +0.00%
#XUSD holds steady at $1.00 with flat price action and $4.0 M volume. Its contract, launched by StraitsX on Ethereum in February 2024, remains a quiet anchor in the stablecoin space.
#WLFI trades at $0.0474, also unchanged, on $4.5 M volume. The token’s low‑key movement suggests liquidity is holding, though any shift could be subtle.
#RLUSD stays at $1.00, unchanged, backed by $60.8 M volume. The high turnover hints at ongoing interest despite the static price.
👀 Watch the volume patterns; a sudden rise could precede price movement for these flat‑lined assets.
#Write2Earn #Binance
#XUSD holds steady at $1.00 with flat price action and $4.0 M volume. Its contract, launched by StraitsX on Ethereum in February 2024, remains a quiet anchor in the stablecoin space.
#WLFI trades at $0.0474, also unchanged, on $4.5 M volume. The token’s low‑key movement suggests liquidity is holding, though any shift could be subtle.
#RLUSD stays at $1.00, unchanged, backed by $60.8 M volume. The high turnover hints at ongoing interest despite the static price.
👀 Watch the volume patterns; a sudden rise could precede price movement for these flat‑lined assets.
#Write2Earn #Binance
7


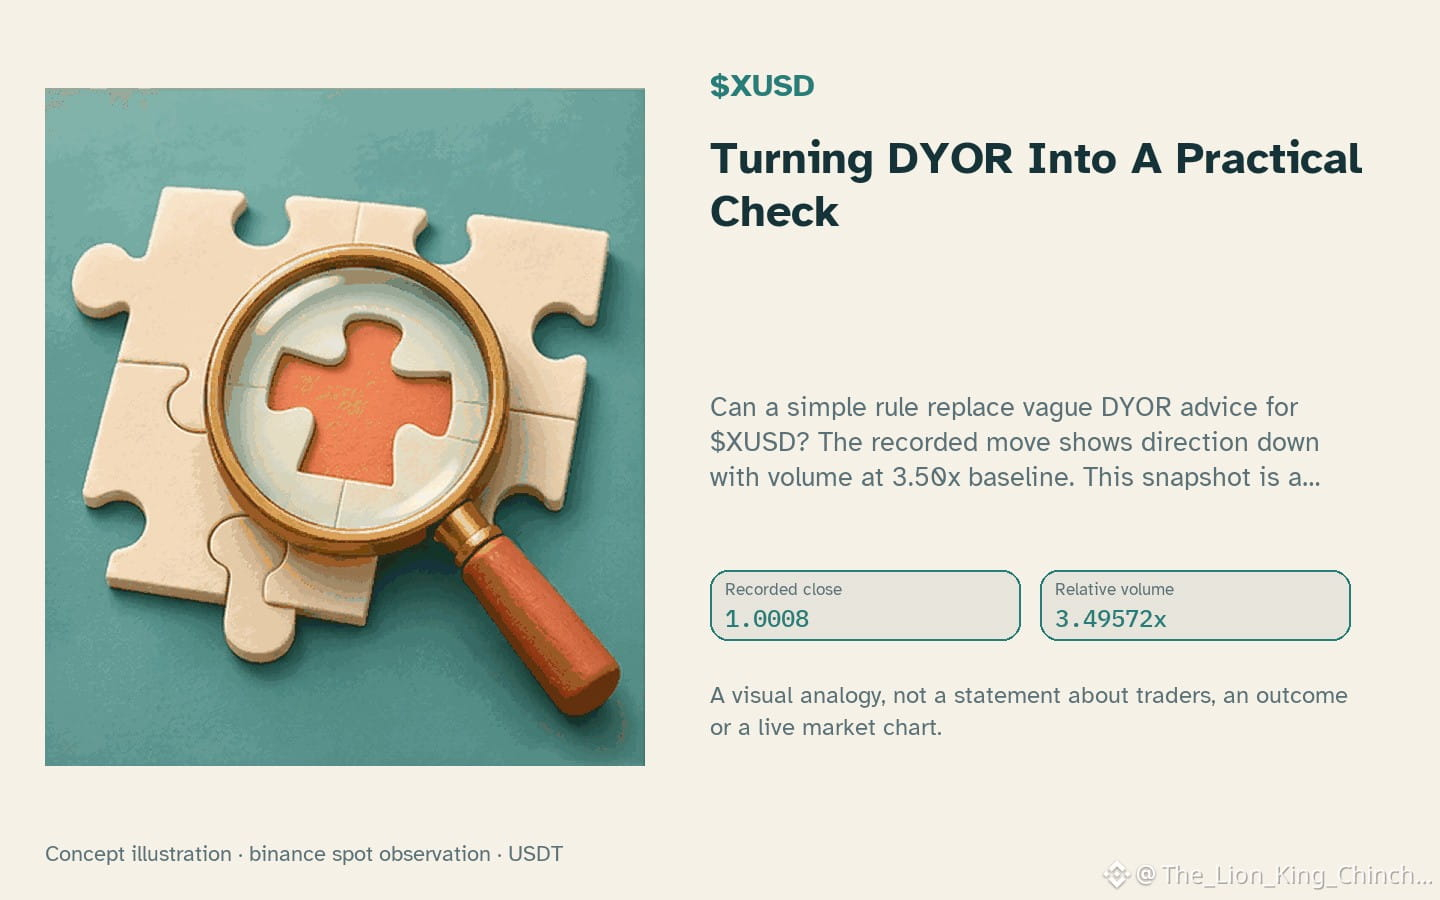
$XUSD: Turning DYOR Into A Practical Check
Can a simple rule replace vague DYOR advice for $XUSD? The recorded move shows direction down with volume at 3.50x baseline. This snapshot is a hypothetical decision point, not a forecast.
A useful mechanism asks if the price action matches your written expectation. If you expected weakness given the daily change -0.01998%, this observation supports that view. However, RSI reads 44.394, which stays within the typical neutral band. It is not an extreme that guarantees reversal. The dilemma is clear: volume confirms interest, but it does not prove motive.
Consider a counterexample. If the next hourly change reverses while volume drops, your initial interpretation weakens. Self-checking means asking if your thesis relied on social proof or just recorded data. Public analysis often blends evidence with persuasion, especially where incentives like Write to Earn reward content creation. This creates a tension: writers may frame uncertainty as opportunity. Using RSI 44.394 helps, but only if you define your exit conditions beforehand. A concrete reassessment condition is whether price respects the local support level 1.0008. If it breaks, the downside thesis strengthens. If it holds, wait for further evidence.
This approach separates observation from narrative. It treats data as a boundary, not a command. Readers gain a repeatable method to test their own logic without needing secret signals or crowd validation. The goal is clarity, not certainty.
Probabilistic market research, not a recommendation or guaranteed return.
#XUSD #CryptoCommunity #CryptoLearning
$XUSD : Turning DYOR Into A Practical Check
Can a simple rule replace vague DYOR advice for $XUSD ? The recorded move shows direction down with volume at 3.50x baseline. This snapshot is a hypothetical decision point, not a forecast.
A useful mechanism asks if the price action matches your written expectation. If you expected weakness given the daily change -0.01998%, this observation supports that view. However, RSI reads 44.394, which stays within the typical neutral band. It is not an extreme that guarantees reversal. The dilemma is clear: volume confirms interest, but it does not prove motive.
Consider a counterexample. If the next hourly change reverses while volume drops, your initial interpretation weakens. Self-checking means asking if your thesis relied on social proof or just recorded data. Public analysis often blends evidence with persuasion, especially where incentives like Write to Earn reward content creation. This creates a tension: writers may frame uncertainty as opportunity. Using RSI 44.394 helps, but only if you define your exit conditions beforehand. A concrete reassessment condition is whether price respects the local support level 1.0008. If it breaks, the downside thesis strengthens. If it holds, wait for further evidence.
This approach separates observation from narrative. It treats data as a boundary, not a command. Readers gain a repeatable method to test their own logic without needing secret signals or crowd validation. The goal is clarity, not certainty.
Probabilistic market research, not a recommendation or guaranteed return.
#XUSD #CryptoCommunity #CryptoLearning
Can a simple rule replace vague DYOR advice for $XUSD ? The recorded move shows direction down with volume at 3.50x baseline. This snapshot is a hypothetical decision point, not a forecast.
A useful mechanism asks if the price action matches your written expectation. If you expected weakness given the daily change -0.01998%, this observation supports that view. However, RSI reads 44.394, which stays within the typical neutral band. It is not an extreme that guarantees reversal. The dilemma is clear: volume confirms interest, but it does not prove motive.
Consider a counterexample. If the next hourly change reverses while volume drops, your initial interpretation weakens. Self-checking means asking if your thesis relied on social proof or just recorded data. Public analysis often blends evidence with persuasion, especially where incentives like Write to Earn reward content creation. This creates a tension: writers may frame uncertainty as opportunity. Using RSI 44.394 helps, but only if you define your exit conditions beforehand. A concrete reassessment condition is whether price respects the local support level 1.0008. If it breaks, the downside thesis strengthens. If it holds, wait for further evidence.
This approach separates observation from narrative. It treats data as a boundary, not a command. Readers gain a repeatable method to test their own logic without needing secret signals or crowd validation. The goal is clarity, not certainty.
Probabilistic market research, not a recommendation or guaranteed return.
#XUSD #CryptoCommunity #CryptoLearning
53
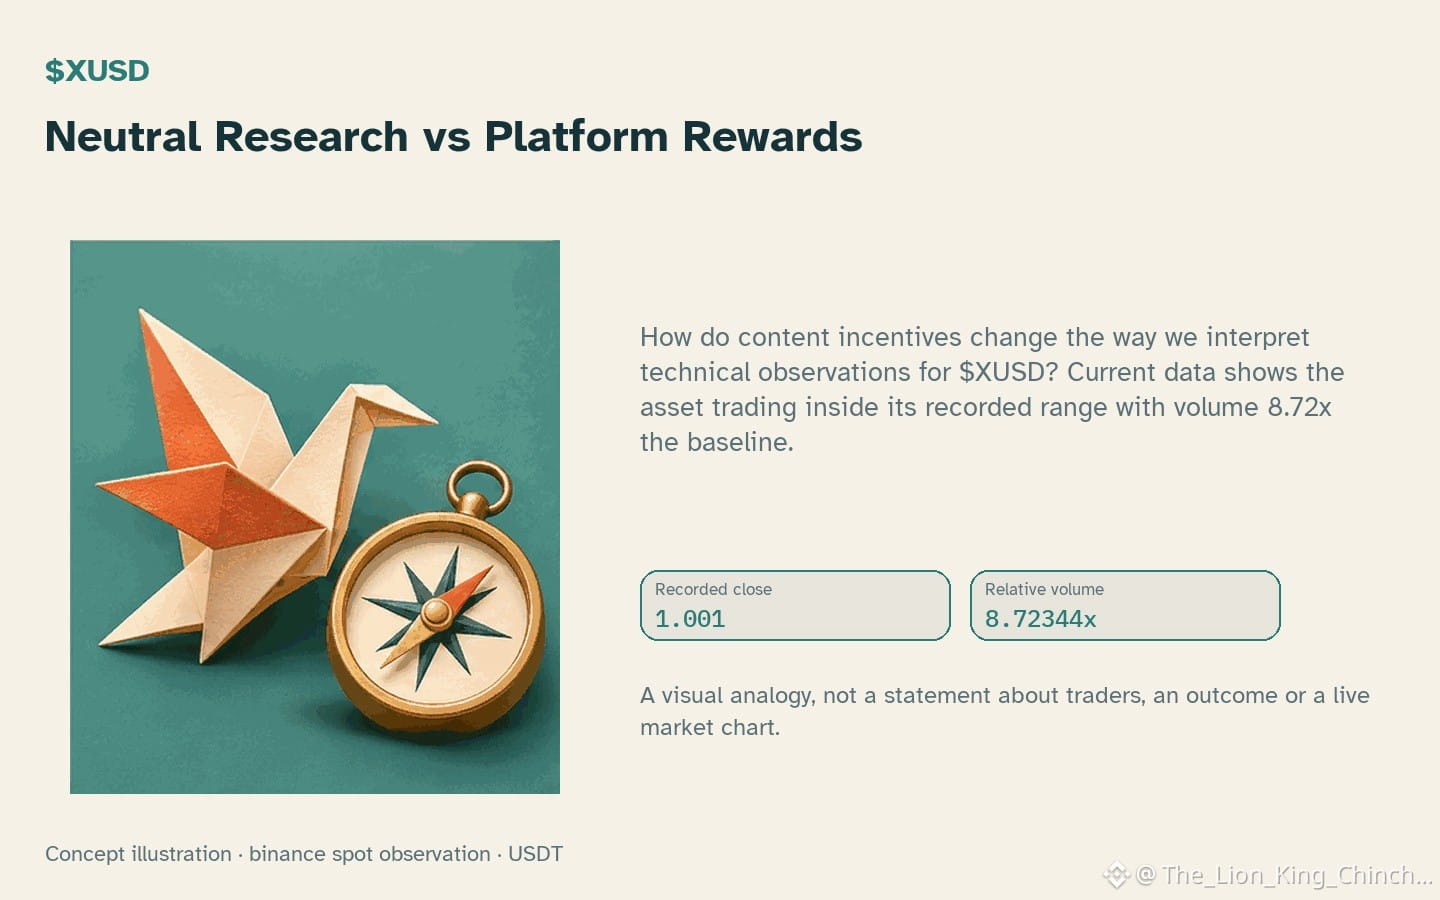
$XUSD: Neutral Research vs Platform Rewards
How do content incentives change the way we interpret technical observations for $XUSD? Current data shows the asset trading inside its recorded range with volume 8.72x the baseline.
Public crypto analysis often faces a dilemma between educational accuracy and the desire for social engagement. When platforms offer rewards for publishing, writers might feel pressured to favor bold predictions over nuanced uncertainty. For instance, a reader might see a daily change of -0.00998901% and find interpretations that ignore the RSI 49.6. If an author focuses only on the most dramatic metric to gain attention, the broader context of the price being at 1.001 is lost. Ethical analysis requires separating this persuasion from the raw evidence provided by the candles.
A useful way to test an interpretation is to check if it considers opposing scenarios. If a report suggests that volume indicates a specific move, ask if the same volume could also signal a local pause or a lack of conviction from participants. For example, staying within a local range between support 1.001 and resistance 1.0011 suggests a different level of risk than a trending move. To reassess this interpretation, look for a future closed candle that breaks outside these recorded boundaries. If the price remains static while the MACD signal 1.74646e-05 shifts, the initial thesis of a high-volatility event might be weakened ⚖️.
Probabilistic market research, not a recommendation or guaranteed return.
#XUSD #CryptoCommunity #CryptoLearning
$XUSD : Neutral Research vs Platform Rewards
How do content incentives change the way we interpret technical observations for $XUSD ? Current data shows the asset trading inside its recorded range with volume 8.72x the baseline.
Public crypto analysis often faces a dilemma between educational accuracy and the desire for social engagement. When platforms offer rewards for publishing, writers might feel pressured to favor bold predictions over nuanced uncertainty. For instance, a reader might see a daily change of -0.00998901% and find interpretations that ignore the RSI 49.6. If an author focuses only on the most dramatic metric to gain attention, the broader context of the price being at 1.001 is lost. Ethical analysis requires separating this persuasion from the raw evidence provided by the candles.
A useful way to test an interpretation is to check if it considers opposing scenarios. If a report suggests that volume indicates a specific move, ask if the same volume could also signal a local pause or a lack of conviction from participants. For example, staying within a local range between support 1.001 and resistance 1.0011 suggests a different level of risk than a trending move. To reassess this interpretation, look for a future closed candle that breaks outside these recorded boundaries. If the price remains static while the MACD signal 1.74646e-05 shifts, the initial thesis of a high-volatility event might be weakened ⚖️.
Probabilistic market research, not a recommendation or guaranteed return.
#XUSD #CryptoCommunity #CryptoLearning
How do content incentives change the way we interpret technical observations for $XUSD ? Current data shows the asset trading inside its recorded range with volume 8.72x the baseline.
Public crypto analysis often faces a dilemma between educational accuracy and the desire for social engagement. When platforms offer rewards for publishing, writers might feel pressured to favor bold predictions over nuanced uncertainty. For instance, a reader might see a daily change of -0.00998901% and find interpretations that ignore the RSI 49.6. If an author focuses only on the most dramatic metric to gain attention, the broader context of the price being at 1.001 is lost. Ethical analysis requires separating this persuasion from the raw evidence provided by the candles.
A useful way to test an interpretation is to check if it considers opposing scenarios. If a report suggests that volume indicates a specific move, ask if the same volume could also signal a local pause or a lack of conviction from participants. For example, staying within a local range between support 1.001 and resistance 1.0011 suggests a different level of risk than a trending move. To reassess this interpretation, look for a future closed candle that breaks outside these recorded boundaries. If the price remains static while the MACD signal 1.74646e-05 shifts, the initial thesis of a high-volatility event might be weakened ⚖️.
Probabilistic market research, not a recommendation or guaranteed return.
#XUSD #CryptoCommunity #CryptoLearning
47

·
--
📊 XUSD, KITE & JST – Today's Crypto Analysis
💵 $XUSD : Stablecoin utility remains important as demand for reliable digital-dollar payments grows. Watch liquidity and reserve transparency.
🚀 $KITE : Showing promising potential through AI-agent payments and mainnet adoption. Real network usage and token demand will be key growth drivers.
🔥 $JST : Trading around $0.1442, with a modest 24-hour gain. TRON ecosystem activity and buyback developments could support future interest.
My Outlook: XUSD focuses on stability, KITE on AI-powered payments, and JST on the TRON DeFi ecosystem. Watch market volume and manage risk!
#XUSD #KITE #JST #CryptoAnalysis #DeFi #Stablecoins #CryptoMarket
{spot}(XUSDUSDT)
{future}(KITEUSDT)
{future}(JSTUSDT)
📊 XUSD, KITE & JST – Today's Crypto Analysis
💵 $XUSD : Stablecoin utility remains important as demand for reliable digital-dollar payments grows. Watch liquidity and reserve transparency.
🚀 $KITE : Showing promising potential through AI-agent payments and mainnet adoption. Real network usage and token demand will be key growth drivers.
🔥 $JST : Trading around $0.1442, with a modest 24-hour gain. TRON ecosystem activity and buyback developments could support future interest.
My Outlook: XUSD focuses on stability, KITE on AI-powered payments, and JST on the TRON DeFi ecosystem. Watch market volume and manage risk!
#XUSD #KITE #JST #CryptoAnalysis #DeFi #Stablecoins #CryptoMarket
💵 $XUSD : Stablecoin utility remains important as demand for reliable digital-dollar payments grows. Watch liquidity and reserve transparency.
🚀 $KITE : Showing promising potential through AI-agent payments and mainnet adoption. Real network usage and token demand will be key growth drivers.
🔥 $JST : Trading around $0.1442, with a modest 24-hour gain. TRON ecosystem activity and buyback developments could support future interest.
My Outlook: XUSD focuses on stability, KITE on AI-powered payments, and JST on the TRON DeFi ecosystem. Watch market volume and manage risk!
#XUSD #KITE #JST #CryptoAnalysis #DeFi #Stablecoins #CryptoMarket

3
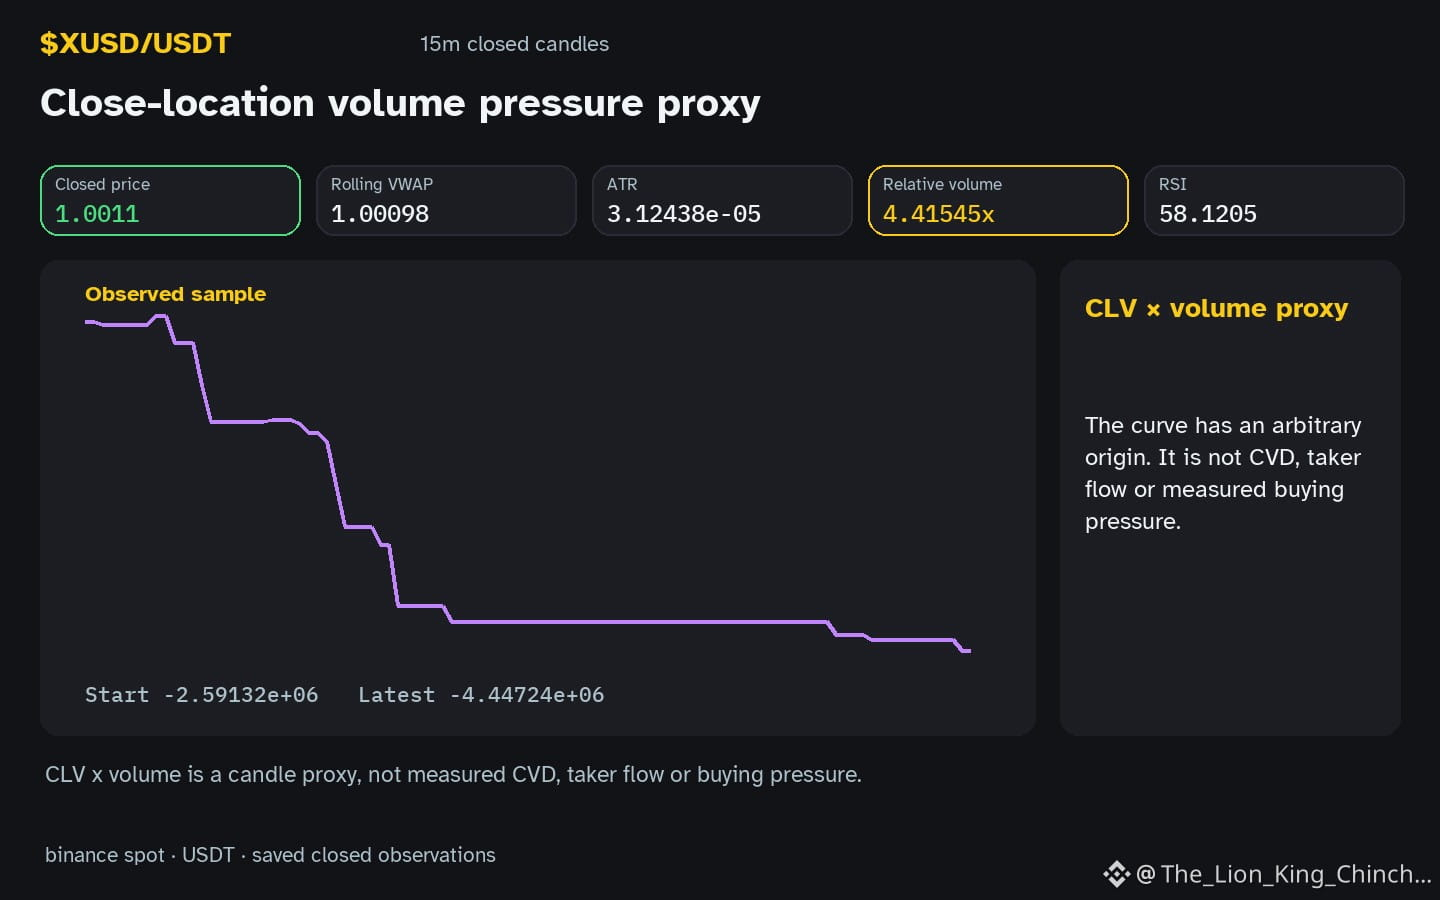
$XUSD: Volume Timing: Initiating Burst or Ending Surge?
What does the recent rise in 4.42x baseline volume tell us about the shape of the current move for $XUSD? The observation notes a flat hourly direction while volume sits above baseline, prompting a question of whether this is an initiating pulse or a climax that could precede a clean close.
One possible clue is that high baseline‑adjusted volume early in a price swing often signals fresh participation and can precede a continuation. In that scenario the flat direction may simply reflect a short pause before the next leg, and a subsequent candle that closes cleanly would reinforce the initiating‑volume hypothesis.
An alternative reading treats the same volume as a climax. When volume spikes near the end of a range, it may represent the last round of buying or selling before participants step back. Here a retest of the local support or resistance would be the confirming signal, and a clean close could instead indicate that the climax hypothesis was wrong.
Each interpretation has a weakening condition. For the initiating view, a future candle that closes with a narrow range and low volume would suggest the earlier spike was not a true start. For the climax view, a candle that closes strongly in the direction of the prior move with continued elevated volume would diminish the retest argument.
A concrete next step is to watch the next closed hourly candle. If it shows a modest price shift and volume returns to baseline, the initiating‑volume reading loses weight. Conversely, if the candle extends the move and volume stays high, the climax hypothesis becomes less plausible. This simple reassessment keeps the analysis grounded in the current observation while leaving room for future evidence to shift the perspective.
Probabilistic market research, not a recommendation or guaranteed return.
#XUSD #MarketAnalysis #CryptoLearning
$XUSD : Volume Timing: Initiating Burst or Ending Surge?
What does the recent rise in 4.42x baseline volume tell us about the shape of the current move for $XUSD ? The observation notes a flat hourly direction while volume sits above baseline, prompting a question of whether this is an initiating pulse or a climax that could precede a clean close.
One possible clue is that high baseline‑adjusted volume early in a price swing often signals fresh participation and can precede a continuation. In that scenario the flat direction may simply reflect a short pause before the next leg, and a subsequent candle that closes cleanly would reinforce the initiating‑volume hypothesis.
An alternative reading treats the same volume as a climax. When volume spikes near the end of a range, it may represent the last round of buying or selling before participants step back. Here a retest of the local support or resistance would be the confirming signal, and a clean close could instead indicate that the climax hypothesis was wrong.
Each interpretation has a weakening condition. For the initiating view, a future candle that closes with a narrow range and low volume would suggest the earlier spike was not a true start. For the climax view, a candle that closes strongly in the direction of the prior move with continued elevated volume would diminish the retest argument.
A concrete next step is to watch the next closed hourly candle. If it shows a modest price shift and volume returns to baseline, the initiating‑volume reading loses weight. Conversely, if the candle extends the move and volume stays high, the climax hypothesis becomes less plausible. This simple reassessment keeps the analysis grounded in the current observation while leaving room for future evidence to shift the perspective.
Probabilistic market research, not a recommendation or guaranteed return.
#XUSD #MarketAnalysis #CryptoLearning
What does the recent rise in 4.42x baseline volume tell us about the shape of the current move for $XUSD ? The observation notes a flat hourly direction while volume sits above baseline, prompting a question of whether this is an initiating pulse or a climax that could precede a clean close.
One possible clue is that high baseline‑adjusted volume early in a price swing often signals fresh participation and can precede a continuation. In that scenario the flat direction may simply reflect a short pause before the next leg, and a subsequent candle that closes cleanly would reinforce the initiating‑volume hypothesis.
An alternative reading treats the same volume as a climax. When volume spikes near the end of a range, it may represent the last round of buying or selling before participants step back. Here a retest of the local support or resistance would be the confirming signal, and a clean close could instead indicate that the climax hypothesis was wrong.
Each interpretation has a weakening condition. For the initiating view, a future candle that closes with a narrow range and low volume would suggest the earlier spike was not a true start. For the climax view, a candle that closes strongly in the direction of the prior move with continued elevated volume would diminish the retest argument.
A concrete next step is to watch the next closed hourly candle. If it shows a modest price shift and volume returns to baseline, the initiating‑volume reading loses weight. Conversely, if the candle extends the move and volume stays high, the climax hypothesis becomes less plausible. This simple reassessment keeps the analysis grounded in the current observation while leaving room for future evidence to shift the perspective.
Probabilistic market research, not a recommendation or guaranteed return.
#XUSD #MarketAnalysis #CryptoLearning
19
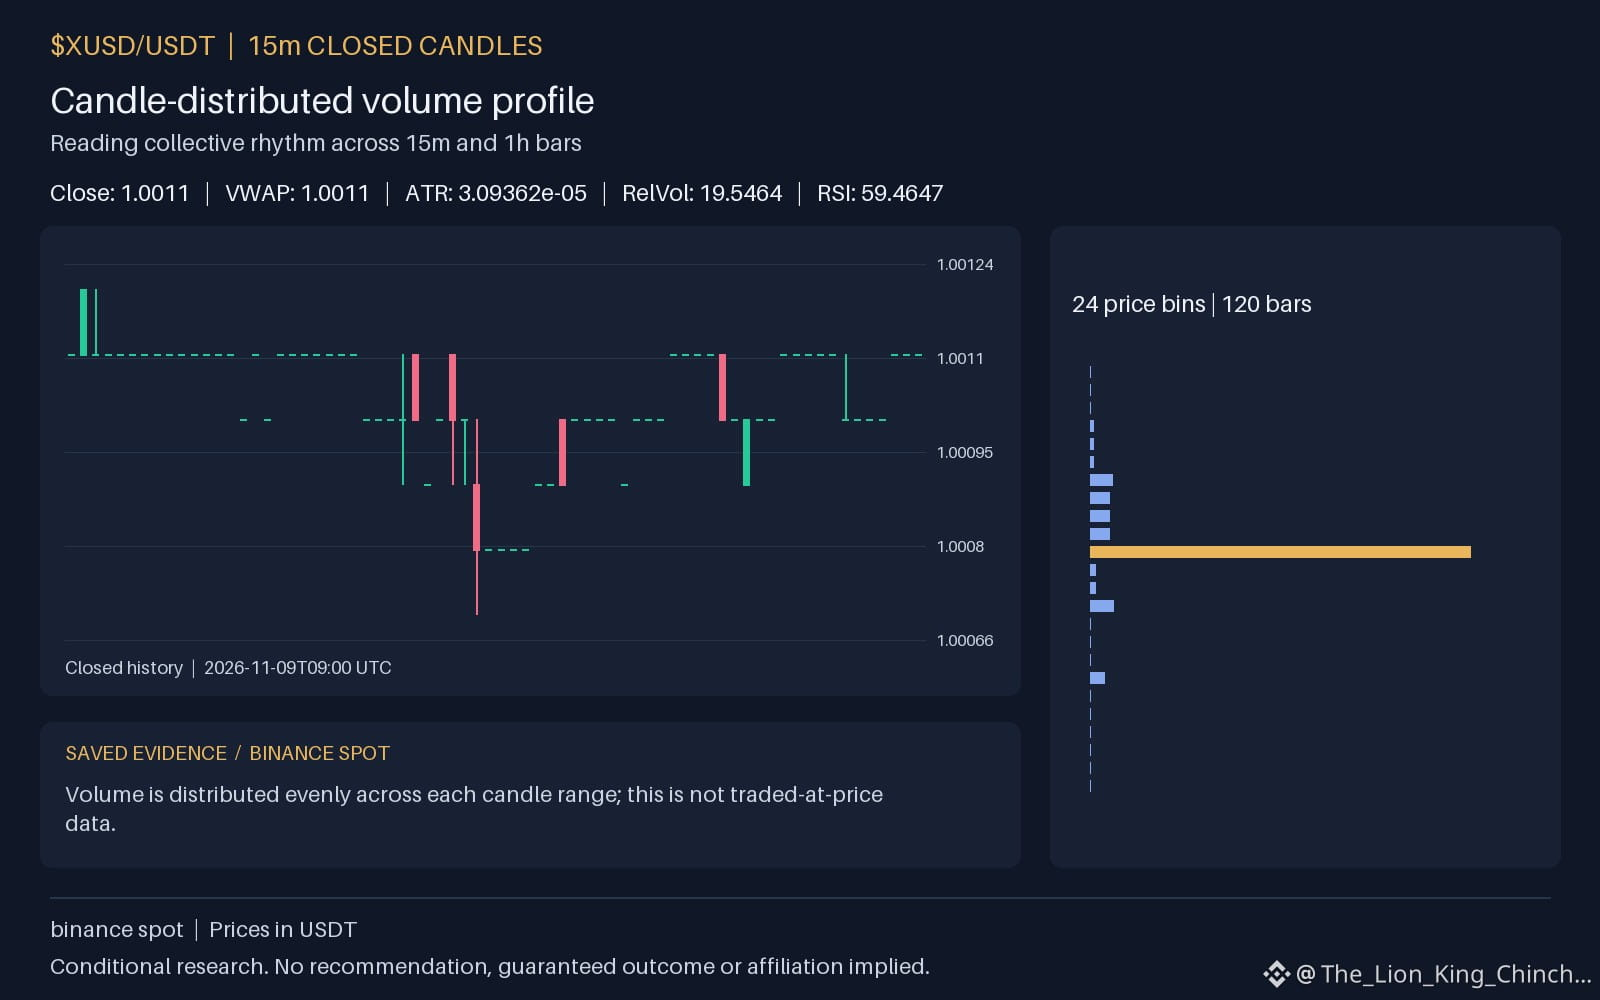
$XUSD Rhythm Check
A hypothetical decision
Imagine watching $XUSD move up on the hour. Volume is above baseline. A trader might ask if other assets are stirring too. This is a thought experiment, not a signal to buy or sell. The goal is to understand how different time frames interact.
Where the analogy helps
The fifteen-minute bar acts like a fast pulse. It shows immediate shifts. The hourly bar resembles a slower heartbeat. It smooths out quick bursts. By looking at both, one can see if a move has staying power or is just a flash. For $XUSD, the directional change is 0 on the short term and 0.00999001 on the longer one. This contrast helps frame the current move. The price sits at 1.0011 with resistance at 1.0011. Support is at 1.0009. These levels anchor the hypothetical view.
Where the analogy fails
Just because $XUSD moves up does not mean the whole market is waking up. Peer observations show $ETH moving down with volume not above its baseline. Meanwhile, $INIT is also down but with volume above its baseline. These are different patterns. They do not prove a shared cause. They are separate data points. A self-check is to ask if the volume in $XUSD is truly unusual relative to its own past. The relative volume is 19.5464. If the peers are mixed, the idea of a collective rhythm is weak. Do not assume capital is rotating. That is a conclusion, not an observation. Keep the analysis simple. Use only the provided facts. If the hourly bars show conflicting directions across the watchlist, the collective rhythm theory fails for this moment. Focus on the individual asset's behavior first.
Probabilistic market research, not a recommendation or guaranteed return.
A useful cross-check: $ETH has hourly direction down and volume not above its baseline; $INIT has hourly direction down and volume above its baseline. This alone does not establish correlation.
What clues across your watchlist tell you that overall market participation is waking up after a quiet session?
#XUSD #ETH #INIT #CryptoWatchlist
$XUSD Rhythm Check
A hypothetical decision
Imagine watching $XUSD move up on the hour. Volume is above baseline. A trader might ask if other assets are stirring too. This is a thought experiment, not a signal to buy or sell. The goal is to understand how different time frames interact.
Where the analogy helps
The fifteen-minute bar acts like a fast pulse. It shows immediate shifts. The hourly bar resembles a slower heartbeat. It smooths out quick bursts. By looking at both, one can see if a move has staying power or is just a flash. For $XUSD , the directional change is 0 on the short term and 0.00999001 on the longer one. This contrast helps frame the current move. The price sits at 1.0011 with resistance at 1.0011. Support is at 1.0009. These levels anchor the hypothetical view.
Where the analogy fails
Just because $XUSD moves up does not mean the whole market is waking up. Peer observations show $ETH moving down with volume not above its baseline. Meanwhile, $INIT is also down but with volume above its baseline. These are different patterns. They do not prove a shared cause. They are separate data points. A self-check is to ask if the volume in $XUSD is truly unusual relative to its own past. The relative volume is 19.5464. If the peers are mixed, the idea of a collective rhythm is weak. Do not assume capital is rotating. That is a conclusion, not an observation. Keep the analysis simple. Use only the provided facts. If the hourly bars show conflicting directions across the watchlist, the collective rhythm theory fails for this moment. Focus on the individual asset's behavior first.
Probabilistic market research, not a recommendation or guaranteed return.
A useful cross-check: $ETH has hourly direction down and volume not above its baseline; $INIT has hourly direction down and volume above its baseline. This alone does not establish correlation.
What clues across your watchlist tell you that overall market participation is waking up after a quiet session?
#XUSD #ETH #INIT #CryptoWatchlist
A hypothetical decision
Imagine watching $XUSD move up on the hour. Volume is above baseline. A trader might ask if other assets are stirring too. This is a thought experiment, not a signal to buy or sell. The goal is to understand how different time frames interact.
Where the analogy helps
The fifteen-minute bar acts like a fast pulse. It shows immediate shifts. The hourly bar resembles a slower heartbeat. It smooths out quick bursts. By looking at both, one can see if a move has staying power or is just a flash. For $XUSD , the directional change is 0 on the short term and 0.00999001 on the longer one. This contrast helps frame the current move. The price sits at 1.0011 with resistance at 1.0011. Support is at 1.0009. These levels anchor the hypothetical view.
Where the analogy fails
Just because $XUSD moves up does not mean the whole market is waking up. Peer observations show $ETH moving down with volume not above its baseline. Meanwhile, $INIT is also down but with volume above its baseline. These are different patterns. They do not prove a shared cause. They are separate data points. A self-check is to ask if the volume in $XUSD is truly unusual relative to its own past. The relative volume is 19.5464. If the peers are mixed, the idea of a collective rhythm is weak. Do not assume capital is rotating. That is a conclusion, not an observation. Keep the analysis simple. Use only the provided facts. If the hourly bars show conflicting directions across the watchlist, the collective rhythm theory fails for this moment. Focus on the individual asset's behavior first.
Probabilistic market research, not a recommendation or guaranteed return.
A useful cross-check: $ETH has hourly direction down and volume not above its baseline; $INIT has hourly direction down and volume above its baseline. This alone does not establish correlation.
What clues across your watchlist tell you that overall market participation is waking up after a quiet session?
#XUSD #ETH #INIT #CryptoWatchlist
53
$XUSD: Anchoring Risks When Price Moves Against Volume
The current hourly direction for $XUSD is down while trading volume remains above the baseline. This divergence creates a scenario where the price drops despite high activity. This specific market setup serves as a useful example of anchoring. This bias occurs when a person relies too heavily on the first piece of information they see, such as a previous price peak or an earlier support level.
Anchoring can change how a researcher interprets the current data. If an observer is anchored to a higher valuation, they might interpret the high volume during a price drop as a temporary shakeout rather than a sign of selling pressure. This mental shortcut can lead to ignoring the fact that the price is now below the 1.0012 or the 1.00119. Instead of adjusting to the current downward momentum, the mind keeps looking back at where the price used to be.
A possible reaction to this bias is holding a position too long because the current price seems like a bargain compared to the anchor point. To reassess the situation, use a practical self-check: if you had no position and just saw the current 38.509 and -6.97166e-06 for the first time today, would you still favor the same direction? This thought experiment helps separate past expectations from the current 1.0011 and 1.0014 levels.
Probabilistic market research, not a recommendation or guaranteed return.
Would you keep the same rule after missing a move?
#XUSD #TradingPsychology #CryptoLearning
$XUSD : Anchoring Risks When Price Moves Against Volume
The current hourly direction for $XUSD is down while trading volume remains above the baseline. This divergence creates a scenario where the price drops despite high activity. This specific market setup serves as a useful example of anchoring. This bias occurs when a person relies too heavily on the first piece of information they see, such as a previous price peak or an earlier support level.
Anchoring can change how a researcher interprets the current data. If an observer is anchored to a higher valuation, they might interpret the high volume during a price drop as a temporary shakeout rather than a sign of selling pressure. This mental shortcut can lead to ignoring the fact that the price is now below the 1.0012 or the 1.00119. Instead of adjusting to the current downward momentum, the mind keeps looking back at where the price used to be.
A possible reaction to this bias is holding a position too long because the current price seems like a bargain compared to the anchor point. To reassess the situation, use a practical self-check: if you had no position and just saw the current 38.509 and -6.97166e-06 for the first time today, would you still favor the same direction? This thought experiment helps separate past expectations from the current 1.0011 and 1.0014 levels.
Probabilistic market research, not a recommendation or guaranteed return.
Would you keep the same rule after missing a move?
#XUSD #TradingPsychology #CryptoLearning
The current hourly direction for $XUSD is down while trading volume remains above the baseline. This divergence creates a scenario where the price drops despite high activity. This specific market setup serves as a useful example of anchoring. This bias occurs when a person relies too heavily on the first piece of information they see, such as a previous price peak or an earlier support level.
Anchoring can change how a researcher interprets the current data. If an observer is anchored to a higher valuation, they might interpret the high volume during a price drop as a temporary shakeout rather than a sign of selling pressure. This mental shortcut can lead to ignoring the fact that the price is now below the 1.0012 or the 1.00119. Instead of adjusting to the current downward momentum, the mind keeps looking back at where the price used to be.
A possible reaction to this bias is holding a position too long because the current price seems like a bargain compared to the anchor point. To reassess the situation, use a practical self-check: if you had no position and just saw the current 38.509 and -6.97166e-06 for the first time today, would you still favor the same direction? This thought experiment helps separate past expectations from the current 1.0011 and 1.0014 levels.
Probabilistic market research, not a recommendation or guaranteed return.
Would you keep the same rule after missing a move?
#XUSD #TradingPsychology #CryptoLearning
19


·
--
Quiet markets often mask the tightest ranges.
$XUSD is holding near $1.0011 with a minimal 24h change of -0.02% on $12.03M volume. Hourly closes show complete stagnation at 0.00% change, while volume dropped to 0.02x of the 23-hour average. The recent range sits between 1.0011 and 1.0017.
If price reclaims the upper boundary near 1.0017 on rising volume, it signals renewed participation. Conversely, a sustained break below 1.0011 invalidates this tight consolidation zone.
Are you watching for a breakout above 1.0017 or preparing for a deeper sweep below 1.0011?
Tap $XUSD for the live chart. #XUSD #BinanceSquare
Quiet markets often mask the tightest ranges.
$XUSD is holding near $1.0011 with a minimal 24h change of -0.02% on $12.03M volume. Hourly closes show complete stagnation at 0.00% change, while volume dropped to 0.02x of the 23-hour average. The recent range sits between 1.0011 and 1.0017.
If price reclaims the upper boundary near 1.0017 on rising volume, it signals renewed participation. Conversely, a sustained break below 1.0011 invalidates this tight consolidation zone.
Are you watching for a breakout above 1.0017 or preparing for a deeper sweep below 1.0011?
Tap $XUSD for the live chart. #XUSD #BinanceSquare
$XUSD is holding near $1.0011 with a minimal 24h change of -0.02% on $12.03M volume. Hourly closes show complete stagnation at 0.00% change, while volume dropped to 0.02x of the 23-hour average. The recent range sits between 1.0011 and 1.0017.
If price reclaims the upper boundary near 1.0017 on rising volume, it signals renewed participation. Conversely, a sustained break below 1.0011 invalidates this tight consolidation zone.
Are you watching for a breakout above 1.0017 or preparing for a deeper sweep below 1.0011?
Tap $XUSD for the live chart. #XUSD #BinanceSquare

·
--
$XUSD +0.05% | $USDC +0.05% | $TVK +0.04%
#XUSD is steady at $1.00, nudging up +0.05% with $12.7 M of volume. Its Ethereum contract, launched by StraitsX in February 2024, remains the core of its modest activity.
#USDC also sits at $1.00, gaining +0.05% on a hefty $1.69 B of volume, underscoring its continued dominance in the stablecoin arena.
#TVK trades at $0.0541, inching up +0.04% with $1.0 M of volume, a quiet move that may reflect limited market attention today.
The parallel upticks across these three suggest a subtle, broad‑based buying pressure that could precede a larger rally.
#Write2Earn #Binance
$XUSD +0.05% | $USDC +0.05% | $TVK +0.04%
#XUSD is steady at $1.00, nudging up +0.05% with $12.7 M of volume. Its Ethereum contract, launched by StraitsX in February 2024, remains the core of its modest activity.
#USDC also sits at $1.00, gaining +0.05% on a hefty $1.69 B of volume, underscoring its continued dominance in the stablecoin arena.
#TVK trades at $0.0541, inching up +0.04% with $1.0 M of volume, a quiet move that may reflect limited market attention today.
The parallel upticks across these three suggest a subtle, broad‑based buying pressure that could precede a larger rally.
#Write2Earn #Binance
#XUSD is steady at $1.00, nudging up +0.05% with $12.7 M of volume. Its Ethereum contract, launched by StraitsX in February 2024, remains the core of its modest activity.
#USDC also sits at $1.00, gaining +0.05% on a hefty $1.69 B of volume, underscoring its continued dominance in the stablecoin arena.
#TVK trades at $0.0541, inching up +0.04% with $1.0 M of volume, a quiet move that may reflect limited market attention today.
The parallel upticks across these three suggest a subtle, broad‑based buying pressure that could precede a larger rally.
#Write2Earn #Binance
·
--
$XUSD holds a tight range on $12.71M volume.
The current price sits at $1.0013 with a modest 24-hour change of +0.05%. Recent hourly candles show flat momentum and average volume matching prior hours, keeping the asset pinned between a 23-hour low of $1.0007 and a high of $1.002.
As a conditional watch scenario, a sustained push past the 1.002 high could invite continuation, whereas slipping back toward the 1.0007 low signals fading strength.
Will a confirmed hourly close above 1.002 trigger further upside, or does a drop below 1.0007 invalidate the breakout setup?
Tap $XUSD for the live chart. #XUSD #BinanceSquare
$XUSD holds a tight range on $12.71M volume.
The current price sits at $1.0013 with a modest 24-hour change of +0.05%. Recent hourly candles show flat momentum and average volume matching prior hours, keeping the asset pinned between a 23-hour low of $1.0007 and a high of $1.002.
As a conditional watch scenario, a sustained push past the 1.002 high could invite continuation, whereas slipping back toward the 1.0007 low signals fading strength.
Will a confirmed hourly close above 1.002 trigger further upside, or does a drop below 1.0007 invalidate the breakout setup?
Tap $XUSD for the live chart. #XUSD #BinanceSquare
The current price sits at $1.0013 with a modest 24-hour change of +0.05%. Recent hourly candles show flat momentum and average volume matching prior hours, keeping the asset pinned between a 23-hour low of $1.0007 and a high of $1.002.
As a conditional watch scenario, a sustained push past the 1.002 high could invite continuation, whereas slipping back toward the 1.0007 low signals fading strength.
Will a confirmed hourly close above 1.002 trigger further upside, or does a drop below 1.0007 invalidate the breakout setup?
Tap $XUSD for the live chart. #XUSD #BinanceSquare
26

·
--
Tight ranges often precede the sharpest volatility spikes for $XUSD.
With the current price at $1.0012, market activity remains extremely compressed. Volume has been stagnant, with the hourly output effectively matching the 23-hour average. The asset is currently hugging the middle of its $1.0007 to $1.0020 range.
A clean breakout above 1.0020 could signal fresh momentum, while a sustained drop below 1.0007 suggests a return to consolidation. Would you wait for a decisive move past these range boundaries, or does the current stability suggest a trap is forming?
Tap $XUSD for the live chart. #XUSD #BinanceSquare
Tight ranges often precede the sharpest volatility spikes for $XUSD .
With the current price at $1.0012, market activity remains extremely compressed. Volume has been stagnant, with the hourly output effectively matching the 23-hour average. The asset is currently hugging the middle of its $1.0007 to $1.0020 range.
A clean breakout above 1.0020 could signal fresh momentum, while a sustained drop below 1.0007 suggests a return to consolidation. Would you wait for a decisive move past these range boundaries, or does the current stability suggest a trap is forming?
Tap $XUSD for the live chart. #XUSD #BinanceSquare
With the current price at $1.0012, market activity remains extremely compressed. Volume has been stagnant, with the hourly output effectively matching the 23-hour average. The asset is currently hugging the middle of its $1.0007 to $1.0020 range.
A clean breakout above 1.0020 could signal fresh momentum, while a sustained drop below 1.0007 suggests a return to consolidation. Would you wait for a decisive move past these range boundaries, or does the current stability suggest a trap is forming?
Tap $XUSD for the live chart. #XUSD #BinanceSquare
2
·
--
$XUSD +0.01% | $BFUSD +0.00% | $RWUSD -0.01%
#XUSD steadied at $1.00, nudging up +0.01% with $17.4 M of volume. The token’s smart contract on Ethereum was first deployed in February 2024 by StraitsX, which may help anchor confidence despite the modest move.
#BFUSD hovered at $0.9996, essentially flat at +0.00% and saw $7.3 M traded. The lack of price shift suggests liquidity is holding, though the volume is relatively low.
#RWUSD slipped to $0.9992, down -0.01% on a solid $22.7 M volume. The higher turnover could indicate traders testing the peg, but the dip might be temporary.
📊 Watch how the contrasting volumes—especially RWUSD’s heft versus BFUSD’s modest flow—could presage divergent stability dynamics among these stablecoins.
#Write2Earn #Binance
$XUSD +0.01% | $BFUSD +0.00% | $RWUSD -0.01%
#XUSD steadied at $1.00, nudging up +0.01% with $17.4 M of volume. The token’s smart contract on Ethereum was first deployed in February 2024 by StraitsX, which may help anchor confidence despite the modest move.
#BFUSD hovered at $0.9996, essentially flat at +0.00% and saw $7.3 M traded. The lack of price shift suggests liquidity is holding, though the volume is relatively low.
#RWUSD slipped to $0.9992, down -0.01% on a solid $22.7 M volume. The higher turnover could indicate traders testing the peg, but the dip might be temporary.
📊 Watch how the contrasting volumes—especially RWUSD’s heft versus BFUSD’s modest flow—could presage divergent stability dynamics among these stablecoins.
#Write2Earn #Binance
#XUSD steadied at $1.00, nudging up +0.01% with $17.4 M of volume. The token’s smart contract on Ethereum was first deployed in February 2024 by StraitsX, which may help anchor confidence despite the modest move.
#BFUSD hovered at $0.9996, essentially flat at +0.00% and saw $7.3 M traded. The lack of price shift suggests liquidity is holding, though the volume is relatively low.
#RWUSD slipped to $0.9992, down -0.01% on a solid $22.7 M volume. The higher turnover could indicate traders testing the peg, but the dip might be temporary.
📊 Watch how the contrasting volumes—especially RWUSD’s heft versus BFUSD’s modest flow—could presage divergent stability dynamics among these stablecoins.
#Write2Earn #Binance
6

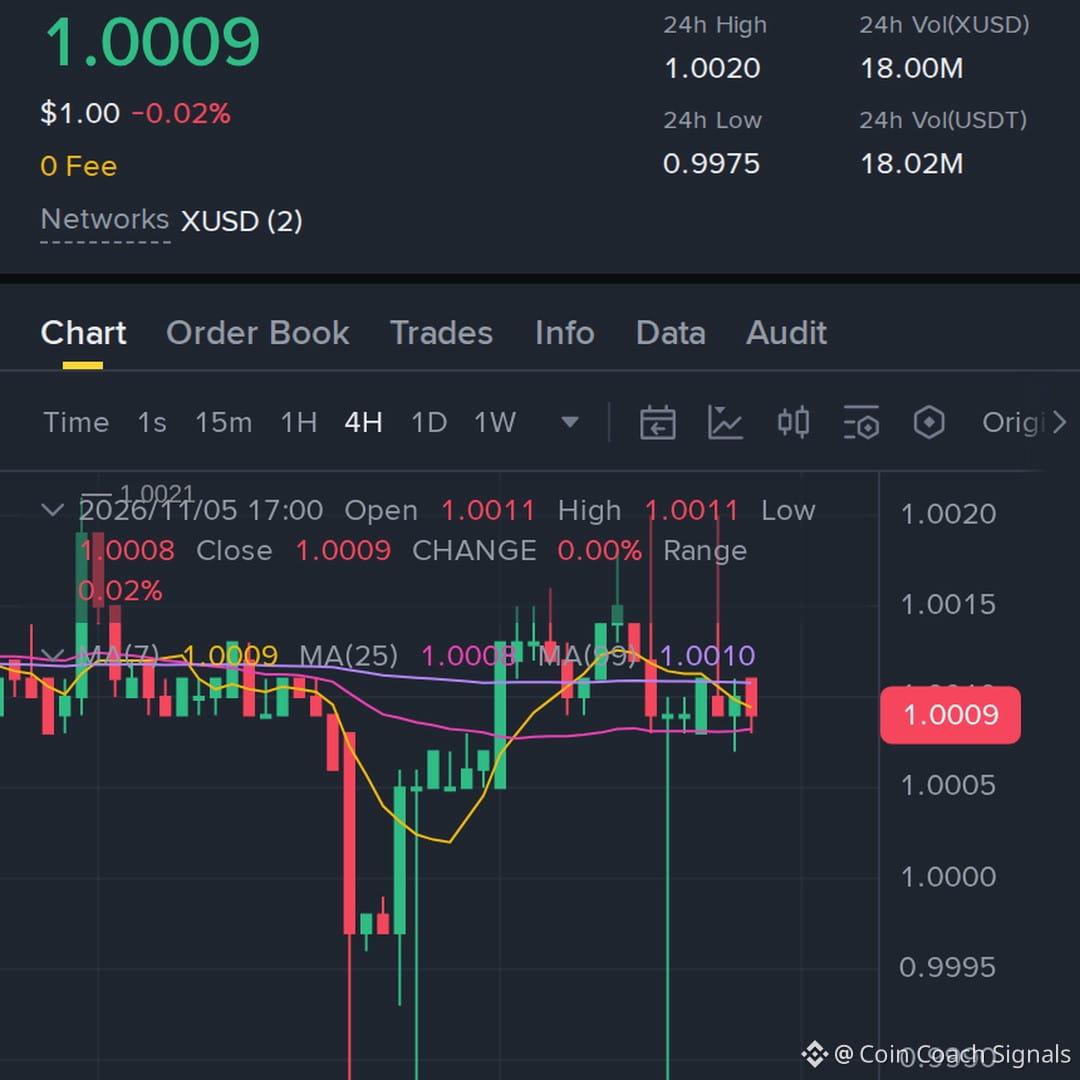
not gonna lie, $XUSD bounced into resistance and sellers showed up again, so I’m working with about 37x
Entry: 1.0009–1.0011 | Stop Loss: 1.017
TP1: 0.9794 / TP2: 0.9569 / TP3: 0.9303
#XUSD #Write2Earn #crypto #binance
not gonna lie, $XUSD bounced into resistance and sellers showed up again, so I’m working with about 37x
Entry: 1.0009–1.0011 | Stop Loss: 1.017
TP1: 0.9794 / TP2: 0.9569 / TP3: 0.9303
#XUSD #Write2Earn #crypto #binance
Entry: 1.0009–1.0011 | Stop Loss: 1.017
TP1: 0.9794 / TP2: 0.9569 / TP3: 0.9303
#XUSD #Write2Earn #crypto #binance
1
47


·
--
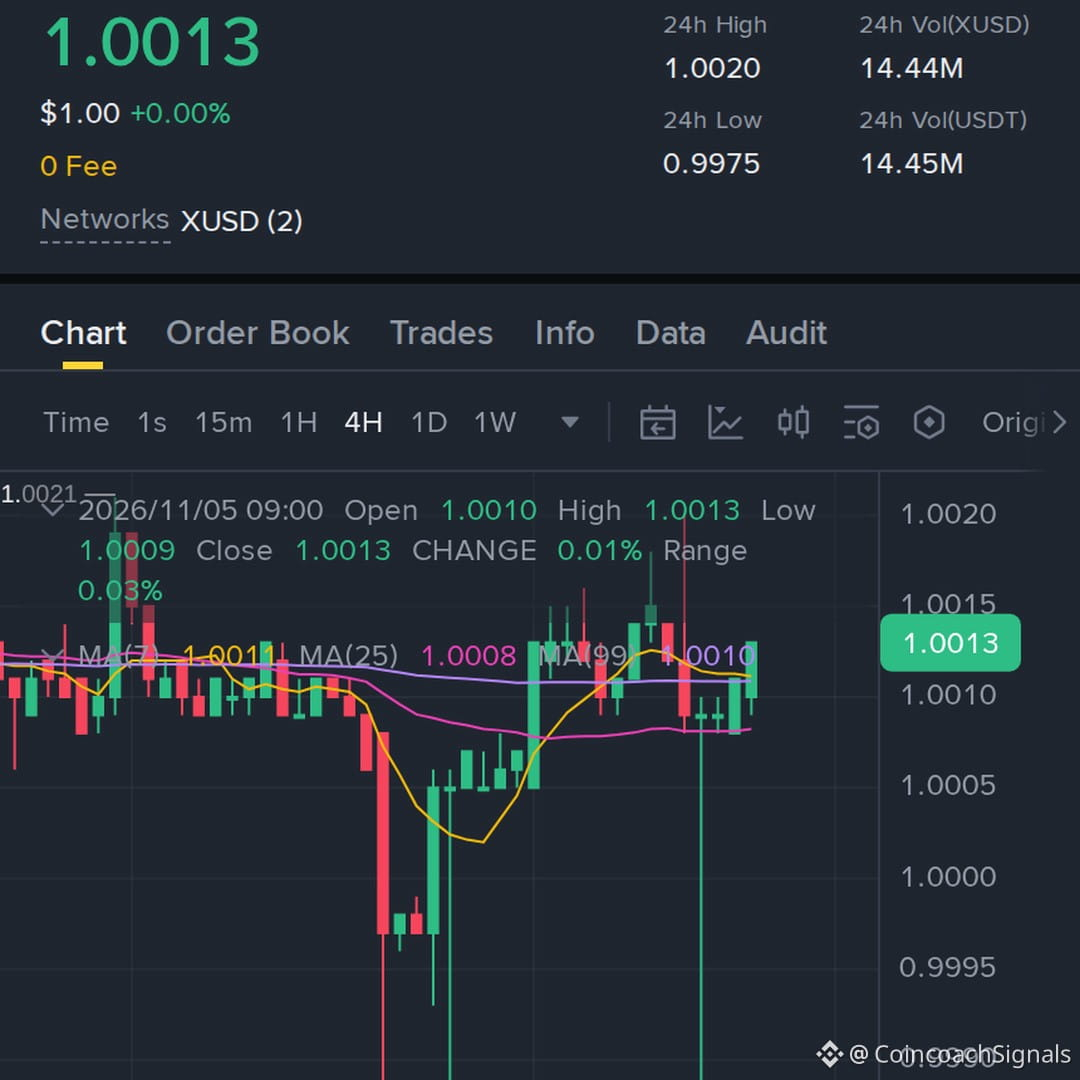
this level on $XUSD, is holding the dip better than expected
Entry: 1.0009–1.0011 • Stop Loss: 0.985
TP1: 1.0242 | TP2: 1.0434 | TP3: 1.0701
#XUSD #Write2Earn #Crypto #Binance
this level on $XUSD , is holding the dip better than expected
Entry: 1.0009–1.0011 • Stop Loss: 0.985
TP1: 1.0242 | TP2: 1.0434 | TP3: 1.0701
#XUSD #Write2Earn #Crypto #Binance
Entry: 1.0009–1.0011 • Stop Loss: 0.985
TP1: 1.0242 | TP2: 1.0434 | TP3: 1.0701
#XUSD #Write2Earn #Crypto #Binance
7
·
--
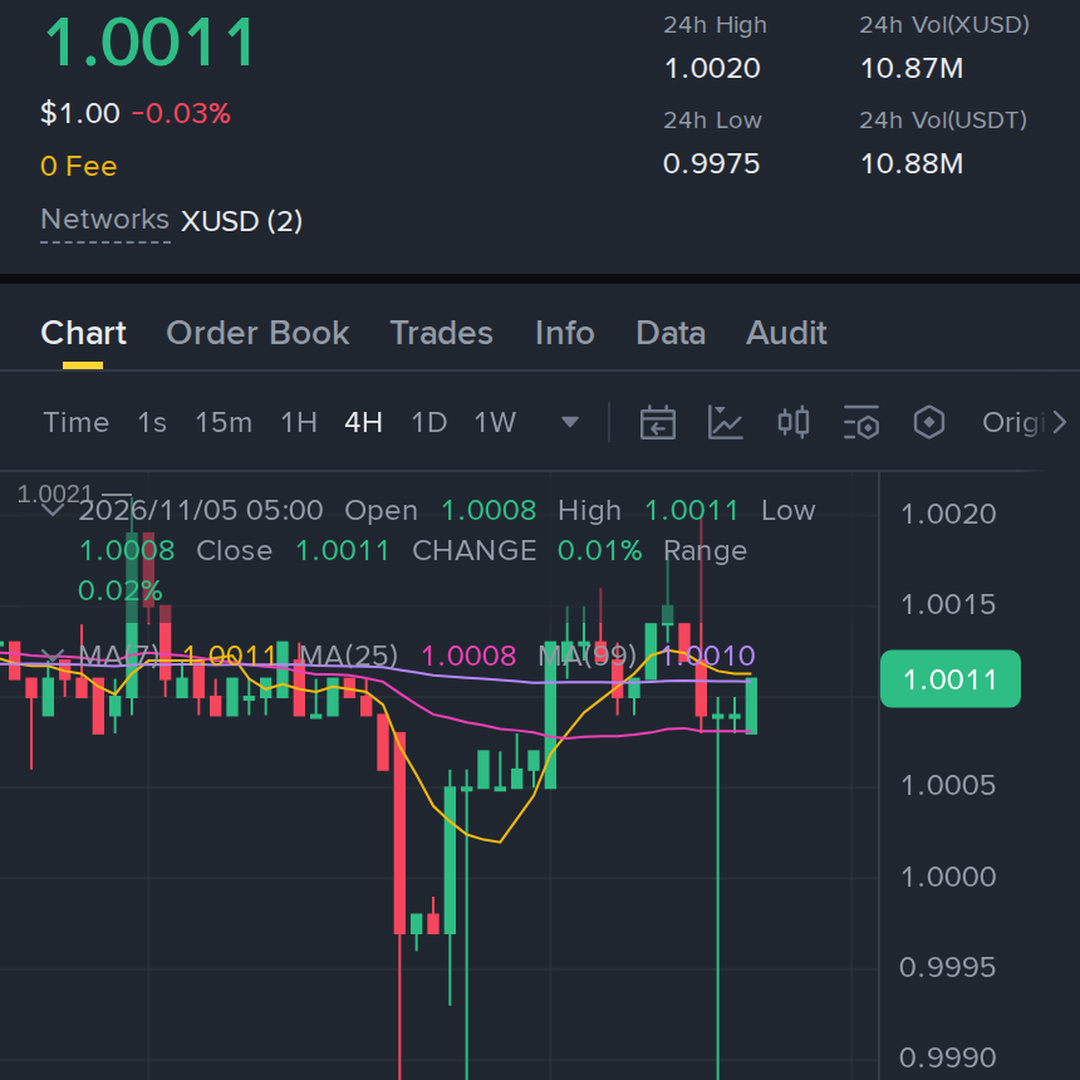
the current range on $XUSD, with leverage sitting around 28x, is struggling to hold the recovery
Entry: 1.0008–1.0009 | Stop Loss: 1.0168
TP1: 0.9778 / TP2: 0.9593 / TP3: 0.9289
#XUSD #Write2Earn #Crypto #Binance
the current range on $XUSD , with leverage sitting around 28x, is struggling to hold the recovery
Entry: 1.0008–1.0009 | Stop Loss: 1.0168
TP1: 0.9778 / TP2: 0.9593 / TP3: 0.9289
#XUSD #Write2Earn #Crypto #Binance
Entry: 1.0008–1.0009 | Stop Loss: 1.0168
TP1: 0.9778 / TP2: 0.9593 / TP3: 0.9289
#XUSD #Write2Earn #Crypto #Binance
12
·
--
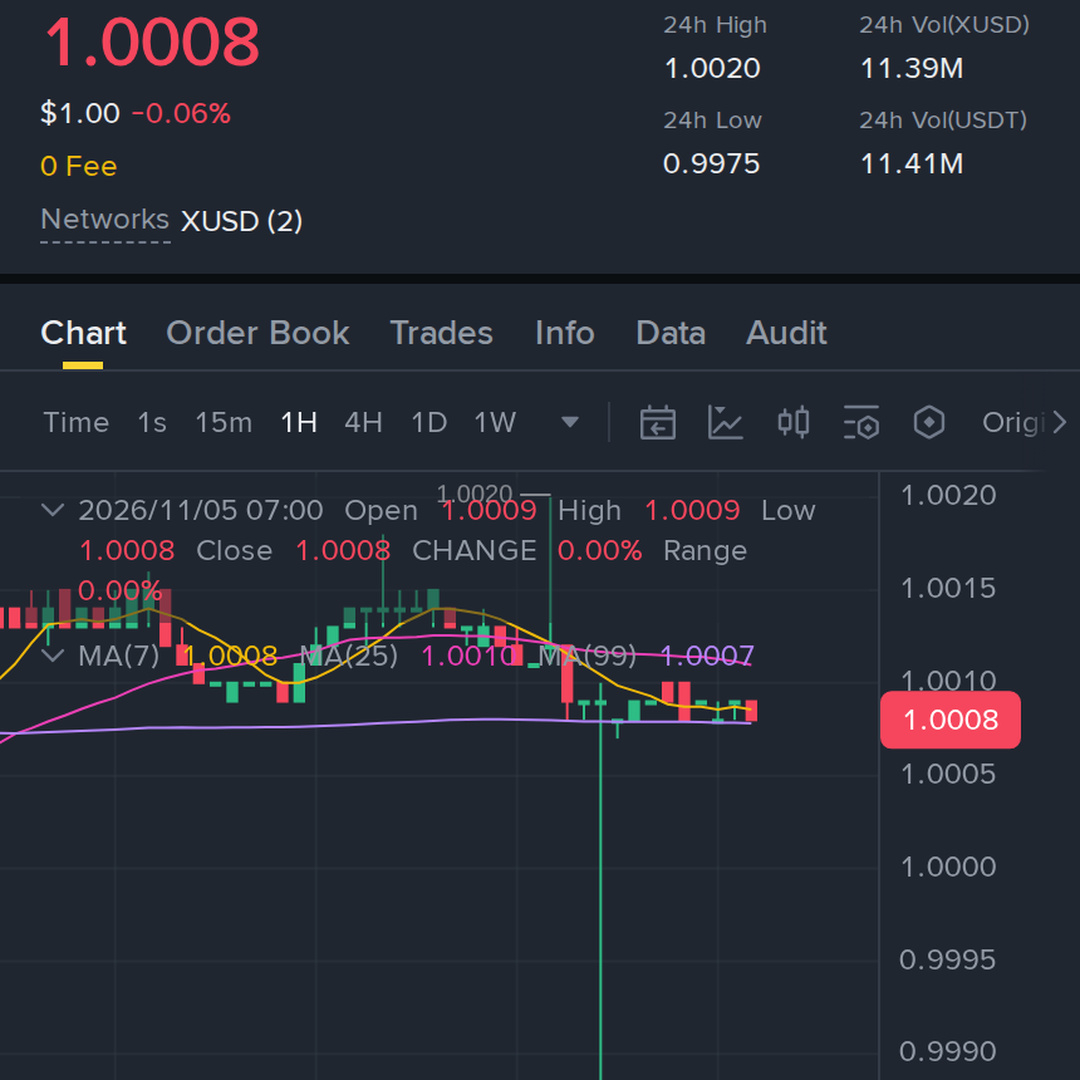
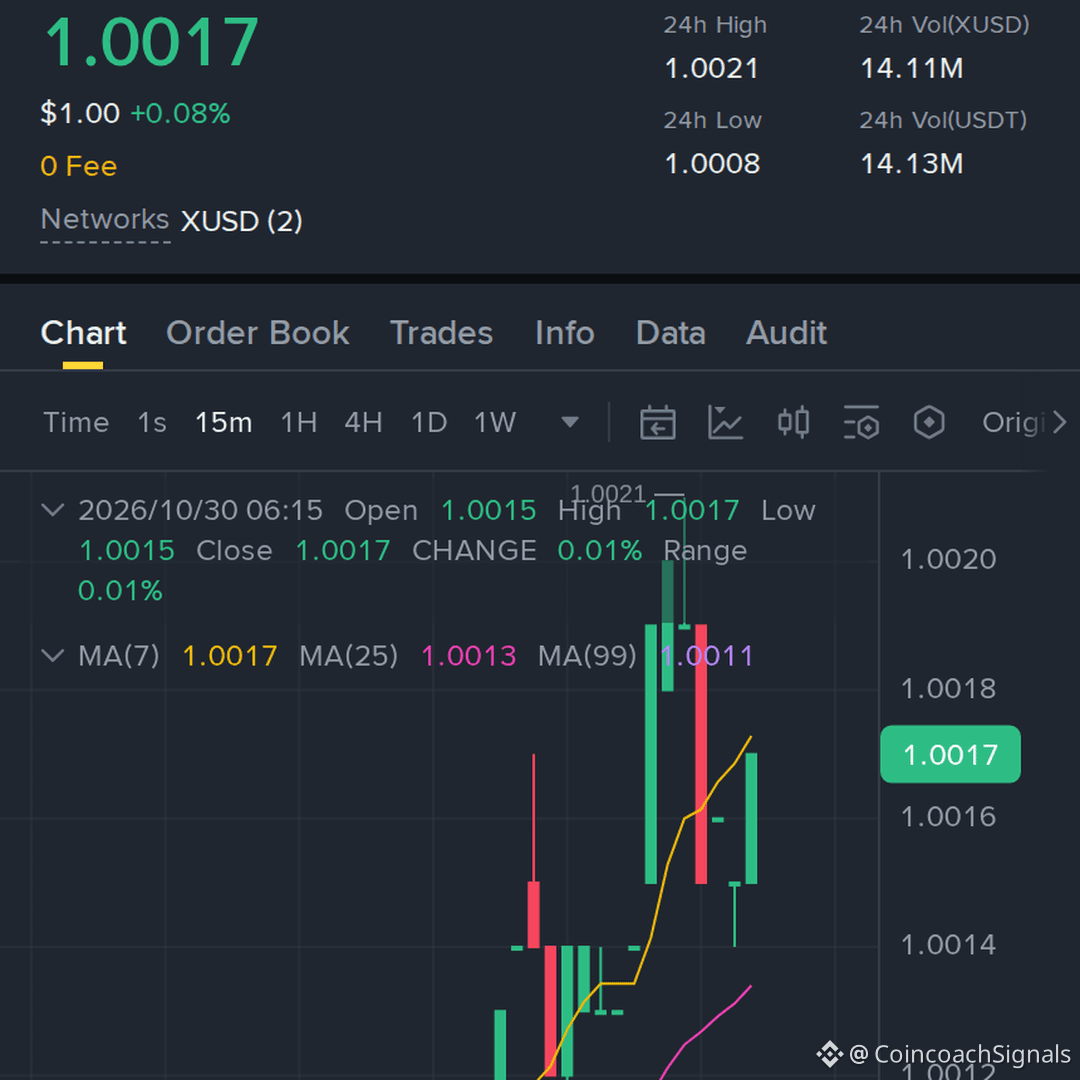
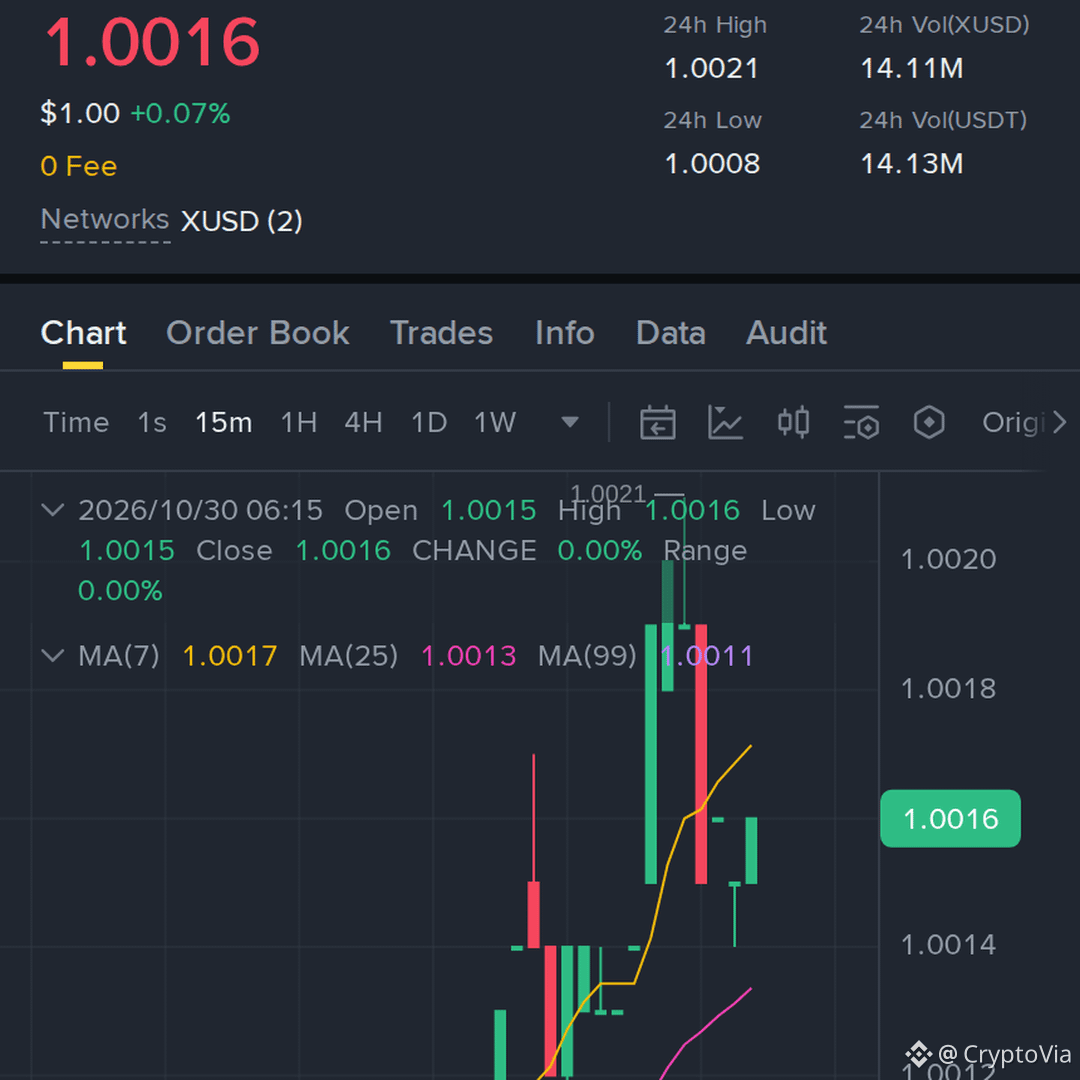
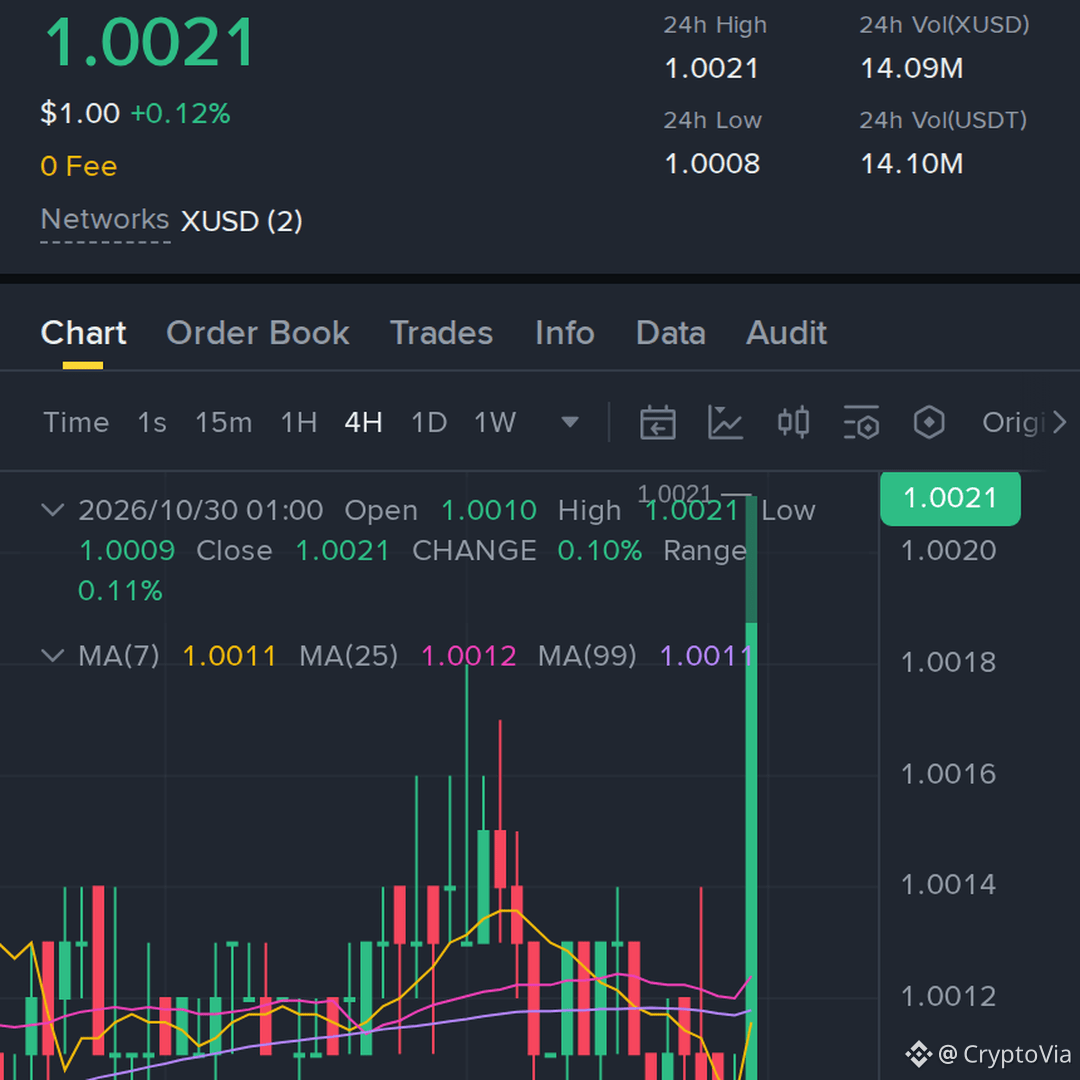
the structure on $XUSD, with 25x as the working leverage, is holding above the breakout and momentum is staying firm
Entry: 1.002–1.0021 | TP1: 1.0247 / TP2: 1.0433 / TP3: 1.0702 | Stop Loss: 0.986
#XUSD #Write2Earn #Crypto #Binance
the structure on $XUSD , with 25x as the working leverage, is holding above the breakout and momentum is staying firm
Entry: 1.002–1.0021 | TP1: 1.0247 / TP2: 1.0433 / TP3: 1.0702 | Stop Loss: 0.986
#XUSD #Write2Earn #Crypto #Binance
Entry: 1.002–1.0021 | TP1: 1.0247 / TP2: 1.0433 / TP3: 1.0702 | Stop Loss: 0.986
#XUSD #Write2Earn #Crypto #Binance
27
Log in to explore more content
Join global crypto users on Binance Square
⚡️ Get latest and useful information about crypto.
💬 Trusted by the world’s largest crypto exchange.
👍 Discover real insights from verified creators.
Email / Phone number
Trending Topics
1
#WhoWillSucceedJensenHuangatNvidia?
83,519 views
1,126 Discussing
2
#WhatWillDriveCryptoandStocks’NextRebound?
431,655 views
3,022 Discussing
3
#BitcoinActiveSupplyInProfitDropsBelow45%
23,113 views
341 Discussing
4
#KavaSaysAbnormalActivityLimitedToKavaLend
8,507 views
172 Discussing
5
#USSpotXRPETFsSeeLargestWeeklyOutflowIn8Months
8,394 views
164 Discussing
6
#USPPIMissMayEaseBTCPressure
208,961 views
2,050 Discussing
7
#WORPTLetsTouristsConvertCryptoToThaiBaht
2,645 views
50 Discussing
8
#TONStrategyReports$23.97MQ3NetLoss
3,345 views
41 Discussing
9
#PolkadotCommunityApprovesNewStrategyWith97%Vote
18,626 views
247 Discussing
10
#dYdXPlansV9.9UpgradeToShiftUSDCToInjective
11,684 views
199 Discussing