
#visaplansstablecoinprefundingforapaccrossborderpayments
visaplansstablecoinprefundingforapaccrossborderpayments
Hot
Latest

·
--

Article
VISA BRINGS STABLECOIN PAYMENTS TO ASIA-PACIFIC!#VisaPlansStablecoinPrefundingForAPACCrossBorderPayments
Visa is expanding its stablecoin-powered payment system across Asia-Pacific!
On November 18, 2026, Visa announced plans to let eligible businesses use stablecoins to fund international payouts through its Visa Direct platform.
Key Highlights
New partnership: Singapore-based dtcpay is the pilot partner.Stablecoin funding: Businesses can prefund cross-border payments using supported stablecoins.Local currency payouts: Recipients still receive traditional local currency.Triple-A integration: Handles stablecoin conversion, compliance screening and settlement.Main benefit: More flexible liquidity management and funding outside traditional banking hours.
This is a significant step toward connecting blockchain technology with traditional global payment networks.
My Take
Stablecoins are moving beyond crypto trading and becoming part of real-world financial infrastructure. Visa's expansion could accelerate institutional adoption and transform how international payments are funded.
Could stablecoins eventually replace traditional banking systems for cross-border payments?
#Visa #Stablecoins #CryptoNews #USDC
VISA BRINGS STABLECOIN PAYMENTS TO ASIA-PACIFIC!
#VisaPlansStablecoinPrefundingForAPACCrossBorderPayments
Visa is expanding its stablecoin-powered payment system across Asia-Pacific!
On November 18, 2026, Visa announced plans to let eligible businesses use stablecoins to fund international payouts through its Visa Direct platform.
Key Highlights
New partnership: Singapore-based dtcpay is the pilot partner.Stablecoin funding: Businesses can prefund cross-border payments using supported stablecoins.Local currency payouts: Recipients still receive traditional local currency.Triple-A integration: Handles stablecoin conversion, compliance screening and settlement.Main benefit: More flexible liquidity management and funding outside traditional banking hours.
This is a significant step toward connecting blockchain technology with traditional global payment networks.
My Take
Stablecoins are moving beyond crypto trading and becoming part of real-world financial infrastructure. Visa's expansion could accelerate institutional adoption and transform how international payments are funded.
Could stablecoins eventually replace traditional banking systems for cross-border payments?
#Visa #Stablecoins #CryptoNews #USDC
Visa is expanding its stablecoin-powered payment system across Asia-Pacific!
On November 18, 2026, Visa announced plans to let eligible businesses use stablecoins to fund international payouts through its Visa Direct platform.
Key Highlights
New partnership: Singapore-based dtcpay is the pilot partner.Stablecoin funding: Businesses can prefund cross-border payments using supported stablecoins.Local currency payouts: Recipients still receive traditional local currency.Triple-A integration: Handles stablecoin conversion, compliance screening and settlement.Main benefit: More flexible liquidity management and funding outside traditional banking hours.
This is a significant step toward connecting blockchain technology with traditional global payment networks.
My Take
Stablecoins are moving beyond crypto trading and becoming part of real-world financial infrastructure. Visa's expansion could accelerate institutional adoption and transform how international payments are funded.
Could stablecoins eventually replace traditional banking systems for cross-border payments?
#Visa #Stablecoins #CryptoNews #USDC
95

·
--
#VisaPlansStablecoinPrefundingForAPACCrossBorderPayments
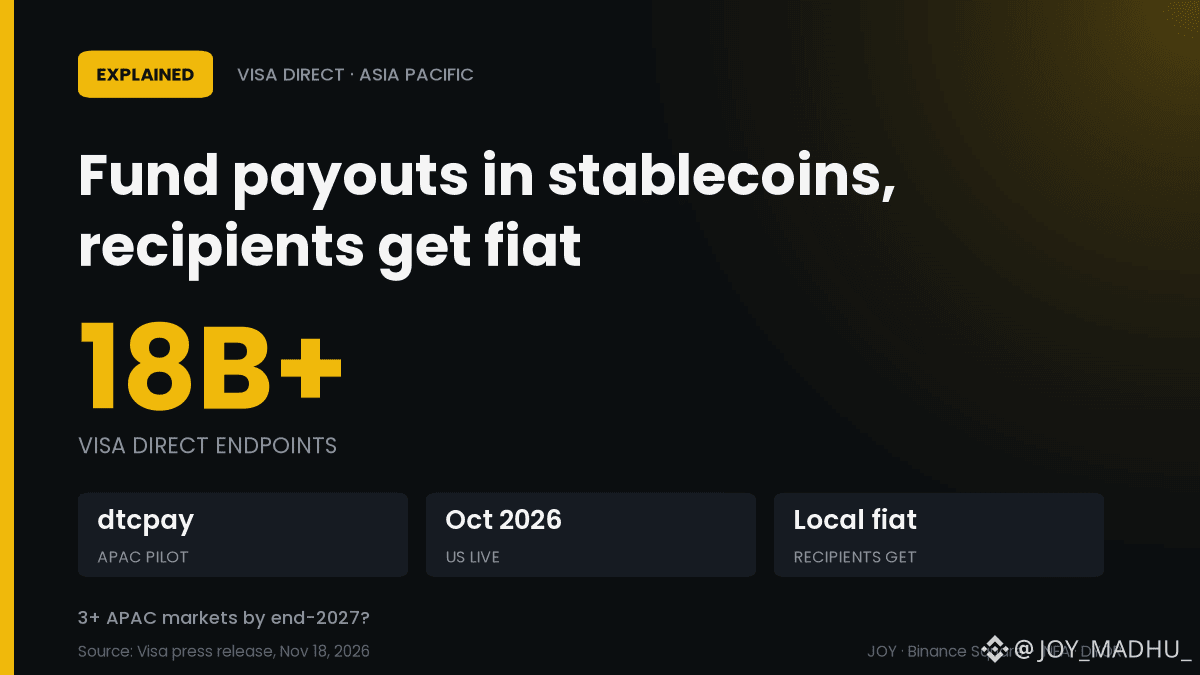
💸 Pay In Stablecoins, Land In Fiat: Visa Direct Hits APAC
Visa will let eligible Asia-Pacific clients prefund cross-border payouts with stablecoins, while recipients still get local fiat.
📊 Visa Direct reaches 18B+ endpoints worldwide
📅 US version went live in Oct with Inyo Global, using USDC
🏦 Singapore's dtcpay runs the APAC pilot
⚠️ Visa itself offers no digital asset services
My read: plumbing like this is how stablecoins scale quietly.
Live in 3+ APAC markets by end-2027, yes or no? 👇
$USDC
#VisaPlansStablecoinPrefundingForAPACCrossBorderPayments #Stablecoins #Visa
#VisaPlansStablecoinPrefundingForAPACCrossBorderPayments
💸 Pay In Stablecoins, Land In Fiat: Visa Direct Hits APAC
Visa will let eligible Asia-Pacific clients prefund cross-border payouts with stablecoins, while recipients still get local fiat.
📊 Visa Direct reaches 18B+ endpoints worldwide
📅 US version went live in Oct with Inyo Global, using USDC
🏦 Singapore's dtcpay runs the APAC pilot
⚠️ Visa itself offers no digital asset services
My read: plumbing like this is how stablecoins scale quietly.
Live in 3+ APAC markets by end-2027, yes or no? 👇
$USDC
#VisaPlansStablecoinPrefundingForAPACCrossBorderPayments #Stablecoins #Visa
💸 Pay In Stablecoins, Land In Fiat: Visa Direct Hits APAC
Visa will let eligible Asia-Pacific clients prefund cross-border payouts with stablecoins, while recipients still get local fiat.
📊 Visa Direct reaches 18B+ endpoints worldwide
📅 US version went live in Oct with Inyo Global, using USDC
🏦 Singapore's dtcpay runs the APAC pilot
⚠️ Visa itself offers no digital asset services
My read: plumbing like this is how stablecoins scale quietly.
Live in 3+ APAC markets by end-2027, yes or no? 👇
$USDC
#VisaPlansStablecoinPrefundingForAPACCrossBorderPayments #Stablecoins #Visa
44

·
--
Verified
🚨 VISA BRINGS STABLECOIN POWER TO ASIA-PACIFIC CROSS-BORDER PAYMENTS!
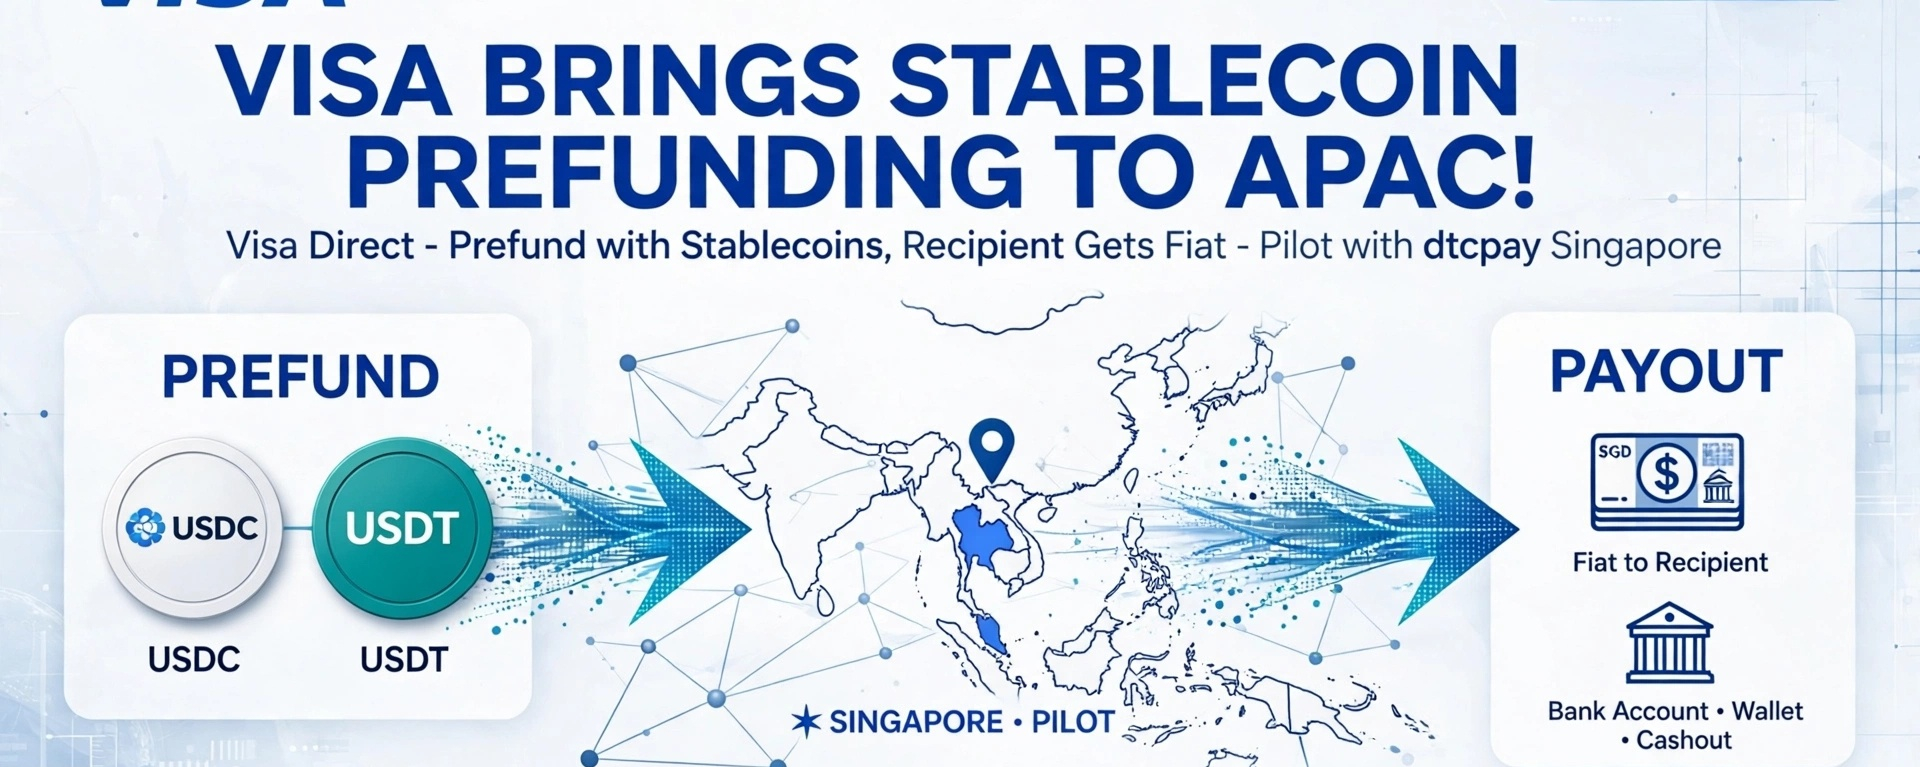
A major shift is underway in global payments as Visa announces plans to let eligible Asia-Pacific clients prefund international payouts using stablecoins through its Visa Direct network.
The initiative is being piloted with Singapore-based digital payments company dtcpay. Businesses can use supported stablecoins to fund cross-border transfers, while recipients continue receiving traditional fiat currency.
Why is this important?
🔥 More flexible liquidity management
🌍 Cross-border funding beyond traditional banking hours
⚡ Potentially faster payout funding
🏦 Stronger integration between blockchain infrastructure and traditional finance
Visa Direct connects to more than 18 billion endpoints worldwide, giving this development significant institutional payment potential.
The bigger picture is clear: stablecoins are moving beyond crypto trading and becoming part of real-world financial infrastructure.
Is Visa helping stablecoins become the future backbone of global payments?
#VisaPlansStablecoinPrefundingForAPACCrossBorderPayments $USDC
{spot}(USDCUSDT)
🚨 VISA BRINGS STABLECOIN POWER TO ASIA-PACIFIC CROSS-BORDER PAYMENTS!
A major shift is underway in global payments as Visa announces plans to let eligible Asia-Pacific clients prefund international payouts using stablecoins through its Visa Direct network.
The initiative is being piloted with Singapore-based digital payments company dtcpay. Businesses can use supported stablecoins to fund cross-border transfers, while recipients continue receiving traditional fiat currency.
Why is this important?
🔥 More flexible liquidity management
🌍 Cross-border funding beyond traditional banking hours
⚡ Potentially faster payout funding
🏦 Stronger integration between blockchain infrastructure and traditional finance
Visa Direct connects to more than 18 billion endpoints worldwide, giving this development significant institutional payment potential.
The bigger picture is clear: stablecoins are moving beyond crypto trading and becoming part of real-world financial infrastructure.
Is Visa helping stablecoins become the future backbone of global payments?
#VisaPlansStablecoinPrefundingForAPACCrossBorderPayments $USDC
A major shift is underway in global payments as Visa announces plans to let eligible Asia-Pacific clients prefund international payouts using stablecoins through its Visa Direct network.
The initiative is being piloted with Singapore-based digital payments company dtcpay. Businesses can use supported stablecoins to fund cross-border transfers, while recipients continue receiving traditional fiat currency.
Why is this important?
🔥 More flexible liquidity management
🌍 Cross-border funding beyond traditional banking hours
⚡ Potentially faster payout funding
🏦 Stronger integration between blockchain infrastructure and traditional finance
Visa Direct connects to more than 18 billion endpoints worldwide, giving this development significant institutional payment potential.
The bigger picture is clear: stablecoins are moving beyond crypto trading and becoming part of real-world financial infrastructure.
Is Visa helping stablecoins become the future backbone of global payments?
#VisaPlansStablecoinPrefundingForAPACCrossBorderPayments $USDC

60
Article
VISA JUST WENT ALL-IN ON STABLECOINS IN ASIA!🚨 VISA JUST WENT ALL-IN ON STABLECOINS IN ASIA!
Stablecoin Prefunding for APAC Cross-Border Payments!
Announced at Singapore FinTech Festival 2026 — Nov 18!
VISA DIRECT = Real-time money movement platform!
🌐 18 BILLION+ endpoints worldwide!
💳 Now connects Stablecoins → Fiat Payouts!
HOW IT WORKS — SUPER SIMPLE:
1. Business prefunds with STABLECOINS (e.g. $USDC / $USDT)
2. Visa Direct moves it across borders in MINUTES
3. Recipient receives FIAT currency — Local currency!
No crypto wallet needed for receiver!
THE PROBLEM IT SOLVES:
Old system: Payout firms park HUGE fiat balances in advance in every country!
Slow, expensive, locked capital for DAYS!
New system: Prefund with stablecoins — Move in minutes, free up liquidity!
THE PILOT PARTNER:
🤝 dtcpay — Singapore-based digital payments company!
🏦 Holds Major Payment Institution license from MAS — Digital Payment Token services!
📍 Pilot: dtcpay uses supported stablecoins to prefund cross-border fiat payouts via Visa Direct!
⚠️ Visa does NOT provide regulated crypto services — Licensed partner does it!
TIMELINE — VISA'S STABLECOIN JOURNEY:
📅 2025: Visa launches stablecoin prefunding + payout pilots via Visa Direct!
📅 Aug 2026: zerohash adds stablecoin prefunding + payouts!
📅 Sep 2026: MVB joins stablecoin settlement pilot via Velocity!
📅 Oct 2026: Commercial production in US with Inyo Global!
📅 Nov 18, 2026: EXTENDED TO APAC with dtcpay!
VISA'S STABLECOIN NUMBERS — HUGE!
💳 225 stablecoin-linked card programs worldwide!
💰 $25 BILLION annualized settlement volumes in stablecoins on Visa network!
ALSO ANNOUNCED AT SFF 2026:
🤖 Agentic Ready Program EXPANDED in APAC!
50+ acquirers, PSPs, gateways + merchants preparing for AI-agent-initiated Visa transactions!
AI will buy & pay for you!
📱 Scan to Pay with Ant International's Alipay+!
Pay at millions of merchants in China, Japan, Korea via QR!
🇰🇷 South Korea: Visa waiting for stablecoin regulations to finalize — Eyes entry!
WHY THIS IS MASSIVE FOR APAC?
APAC = Biggest remittance + cross-border trade region!
Freelancers, exporters, businesses get faster payouts!
Less trapped capital, more liquidity!
Stablecoins become REAL infrastructure — Not just trading!
THE BIG QUESTION:
Will stablecoins replace SWIFT for cross-border payouts?
Your call? 👇
YES — Visa just made it real 🟢
NO — Banks / SWIFT still dominate 🔴
WAIT — Need to see APAC adoption first 🟡
#VisaPlansStablecoinPrefundingForAPACCrossBorderPayments
#VisaDirect #Stablecoin #USDC #USDT
VISA JUST WENT ALL-IN ON STABLECOINS IN ASIA!
🚨 VISA JUST WENT ALL-IN ON STABLECOINS IN ASIA!
Stablecoin Prefunding for APAC Cross-Border Payments!
Announced at Singapore FinTech Festival 2026 — Nov 18!
VISA DIRECT = Real-time money movement platform!
🌐 18 BILLION+ endpoints worldwide!
💳 Now connects Stablecoins → Fiat Payouts!
HOW IT WORKS — SUPER SIMPLE:
1. Business prefunds with STABLECOINS (e.g. $USDC / $USDT)
2. Visa Direct moves it across borders in MINUTES
3. Recipient receives FIAT currency — Local currency!
No crypto wallet needed for receiver!
THE PROBLEM IT SOLVES:
Old system: Payout firms park HUGE fiat balances in advance in every country!
Slow, expensive, locked capital for DAYS!
New system: Prefund with stablecoins — Move in minutes, free up liquidity!
THE PILOT PARTNER:
🤝 dtcpay — Singapore-based digital payments company!
🏦 Holds Major Payment Institution license from MAS — Digital Payment Token services!
📍 Pilot: dtcpay uses supported stablecoins to prefund cross-border fiat payouts via Visa Direct!
⚠️ Visa does NOT provide regulated crypto services — Licensed partner does it!
TIMELINE — VISA'S STABLECOIN JOURNEY:
📅 2025: Visa launches stablecoin prefunding + payout pilots via Visa Direct!
📅 Aug 2026: zerohash adds stablecoin prefunding + payouts!
📅 Sep 2026: MVB joins stablecoin settlement pilot via Velocity!
📅 Oct 2026: Commercial production in US with Inyo Global!
📅 Nov 18, 2026: EXTENDED TO APAC with dtcpay!
VISA'S STABLECOIN NUMBERS — HUGE!
💳 225 stablecoin-linked card programs worldwide!
💰 $25 BILLION annualized settlement volumes in stablecoins on Visa network!
ALSO ANNOUNCED AT SFF 2026:
🤖 Agentic Ready Program EXPANDED in APAC!
50+ acquirers, PSPs, gateways + merchants preparing for AI-agent-initiated Visa transactions!
AI will buy & pay for you!
📱 Scan to Pay with Ant International's Alipay+!
Pay at millions of merchants in China, Japan, Korea via QR!
🇰🇷 South Korea: Visa waiting for stablecoin regulations to finalize — Eyes entry!
WHY THIS IS MASSIVE FOR APAC?
APAC = Biggest remittance + cross-border trade region!
Freelancers, exporters, businesses get faster payouts!
Less trapped capital, more liquidity!
Stablecoins become REAL infrastructure — Not just trading!
THE BIG QUESTION:
Will stablecoins replace SWIFT for cross-border payouts?
Your call? 👇
YES — Visa just made it real 🟢
NO — Banks / SWIFT still dominate 🔴
WAIT — Need to see APAC adoption first 🟡
#VisaPlansStablecoinPrefundingForAPACCrossBorderPayments
#VisaDirect #Stablecoin #USDC #USDT
Stablecoin Prefunding for APAC Cross-Border Payments!
Announced at Singapore FinTech Festival 2026 — Nov 18!
VISA DIRECT = Real-time money movement platform!
🌐 18 BILLION+ endpoints worldwide!
💳 Now connects Stablecoins → Fiat Payouts!
HOW IT WORKS — SUPER SIMPLE:
1. Business prefunds with STABLECOINS (e.g. $USDC / $USDT)
2. Visa Direct moves it across borders in MINUTES
3. Recipient receives FIAT currency — Local currency!
No crypto wallet needed for receiver!
THE PROBLEM IT SOLVES:
Old system: Payout firms park HUGE fiat balances in advance in every country!
Slow, expensive, locked capital for DAYS!
New system: Prefund with stablecoins — Move in minutes, free up liquidity!
THE PILOT PARTNER:
🤝 dtcpay — Singapore-based digital payments company!
🏦 Holds Major Payment Institution license from MAS — Digital Payment Token services!
📍 Pilot: dtcpay uses supported stablecoins to prefund cross-border fiat payouts via Visa Direct!
⚠️ Visa does NOT provide regulated crypto services — Licensed partner does it!
TIMELINE — VISA'S STABLECOIN JOURNEY:
📅 2025: Visa launches stablecoin prefunding + payout pilots via Visa Direct!
📅 Aug 2026: zerohash adds stablecoin prefunding + payouts!
📅 Sep 2026: MVB joins stablecoin settlement pilot via Velocity!
📅 Oct 2026: Commercial production in US with Inyo Global!
📅 Nov 18, 2026: EXTENDED TO APAC with dtcpay!
VISA'S STABLECOIN NUMBERS — HUGE!
💳 225 stablecoin-linked card programs worldwide!
💰 $25 BILLION annualized settlement volumes in stablecoins on Visa network!
ALSO ANNOUNCED AT SFF 2026:
🤖 Agentic Ready Program EXPANDED in APAC!
50+ acquirers, PSPs, gateways + merchants preparing for AI-agent-initiated Visa transactions!
AI will buy & pay for you!
📱 Scan to Pay with Ant International's Alipay+!
Pay at millions of merchants in China, Japan, Korea via QR!
🇰🇷 South Korea: Visa waiting for stablecoin regulations to finalize — Eyes entry!
WHY THIS IS MASSIVE FOR APAC?
APAC = Biggest remittance + cross-border trade region!
Freelancers, exporters, businesses get faster payouts!
Less trapped capital, more liquidity!
Stablecoins become REAL infrastructure — Not just trading!
THE BIG QUESTION:
Will stablecoins replace SWIFT for cross-border payouts?
Your call? 👇
YES — Visa just made it real 🟢
NO — Banks / SWIFT still dominate 🔴
WAIT — Need to see APAC adoption first 🟡
#VisaPlansStablecoinPrefundingForAPACCrossBorderPayments
#VisaDirect #Stablecoin #USDC #USDT
28

·
--
Bullish
Verified
#VisaPlansStablecoinPrefundingForAPACCrossBorderPayments
Visa Expands Stablecoin Prefunding to Asia-Pacific 🌏
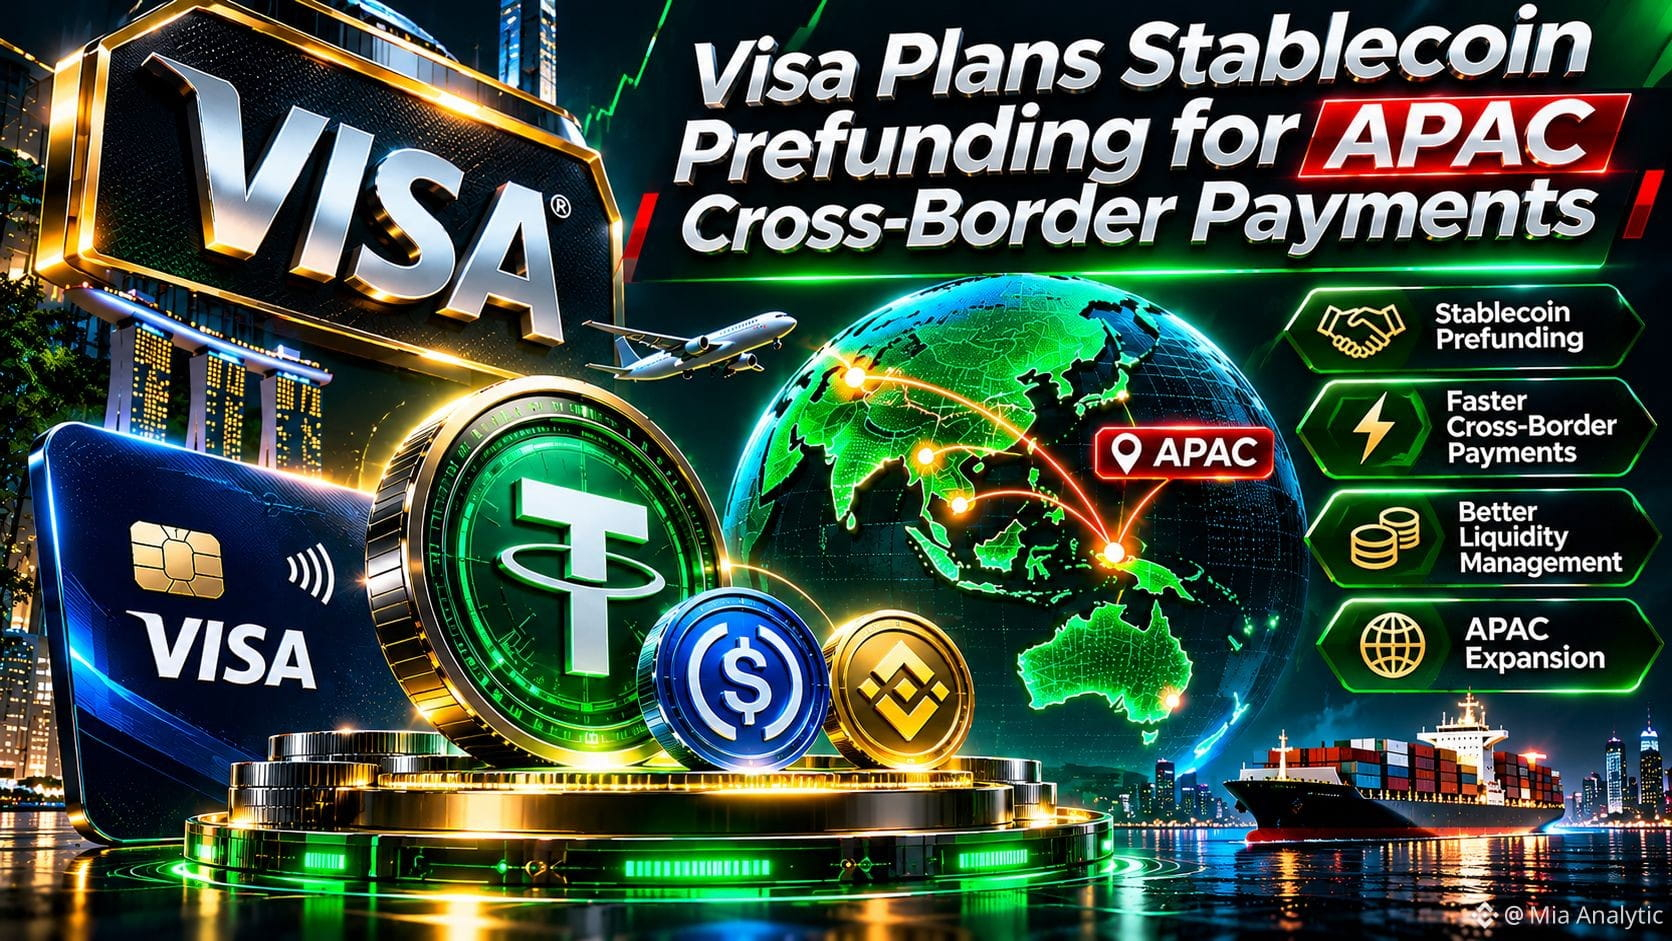
Visa is taking another step toward integrating stablecoins into mainstream cross-border payments. The company plans to let eligible Visa Direct clients in Asia-Pacific use stablecoins to prefund cross-border payouts, while recipients can still receive funds in local fiat currency. The pilot is being launched with Singapore-based dtcpay.
Why it matters: stablecoins can give payment providers more flexible liquidity management, including funding outside traditional banking hours. For businesses moving money across multiple currencies and time zones, that could reduce reliance on conventional prefunding processes. Visa Direct connects to more than 18 billion endpoints globally.
From a trader’s perspective, this is less about an immediate token-price catalyst and more about real-world stablecoin adoption. Visa already moved stablecoin prefunding into commercial production in the U.S. in October, so the APAC expansion suggests the model is moving from experimentation toward broader payment infrastructure.
Bottom line: Visa is increasingly treating stablecoins as payment infrastructure rather than simply crypto assets. If adoption continues across major payment corridors, the long-term significance for the stablecoin sector could be substantial.
#Stablecoins #Visa #crypto #Payments
$ZIL $SOPH $SOON
{future}(SOONUSDT)
{future}(SOPHUSDT)
{future}(ZILUSDT)
#VisaPlansStablecoinPrefundingForAPACCrossBorderPayments
Visa Expands Stablecoin Prefunding to Asia-Pacific 🌏
Visa is taking another step toward integrating stablecoins into mainstream cross-border payments. The company plans to let eligible Visa Direct clients in Asia-Pacific use stablecoins to prefund cross-border payouts, while recipients can still receive funds in local fiat currency. The pilot is being launched with Singapore-based dtcpay.
Why it matters: stablecoins can give payment providers more flexible liquidity management, including funding outside traditional banking hours. For businesses moving money across multiple currencies and time zones, that could reduce reliance on conventional prefunding processes. Visa Direct connects to more than 18 billion endpoints globally.
From a trader’s perspective, this is less about an immediate token-price catalyst and more about real-world stablecoin adoption. Visa already moved stablecoin prefunding into commercial production in the U.S. in October, so the APAC expansion suggests the model is moving from experimentation toward broader payment infrastructure.
Bottom line: Visa is increasingly treating stablecoins as payment infrastructure rather than simply crypto assets. If adoption continues across major payment corridors, the long-term significance for the stablecoin sector could be substantial.
#Stablecoins #Visa #crypto #Payments
$ZIL $SOPH $SOON
Visa Expands Stablecoin Prefunding to Asia-Pacific 🌏
Visa is taking another step toward integrating stablecoins into mainstream cross-border payments. The company plans to let eligible Visa Direct clients in Asia-Pacific use stablecoins to prefund cross-border payouts, while recipients can still receive funds in local fiat currency. The pilot is being launched with Singapore-based dtcpay.
Why it matters: stablecoins can give payment providers more flexible liquidity management, including funding outside traditional banking hours. For businesses moving money across multiple currencies and time zones, that could reduce reliance on conventional prefunding processes. Visa Direct connects to more than 18 billion endpoints globally.
From a trader’s perspective, this is less about an immediate token-price catalyst and more about real-world stablecoin adoption. Visa already moved stablecoin prefunding into commercial production in the U.S. in October, so the APAC expansion suggests the model is moving from experimentation toward broader payment infrastructure.
Bottom line: Visa is increasingly treating stablecoins as payment infrastructure rather than simply crypto assets. If adoption continues across major payment corridors, the long-term significance for the stablecoin sector could be substantial.
#Stablecoins #Visa #crypto #Payments
$ZIL $SOPH $SOON
380

·
--
Bearish
Verified
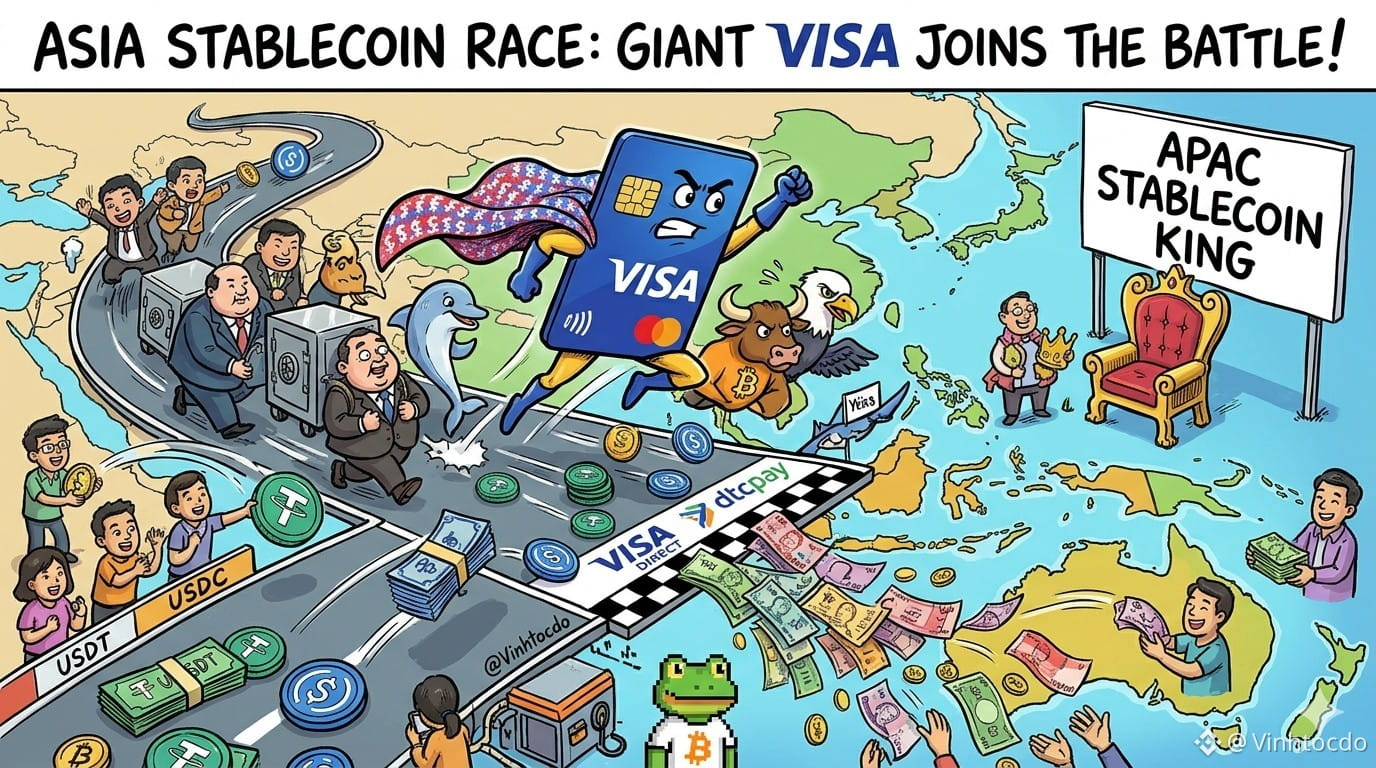
#VisaPlansStablecoinPrefundingForAPACCrossBorderPayments 💳 ASIA'S STABLECOIN SHOWDOWN: IT'S VISA'S TURN TO JOIN THE FRAY! 🌏
The stablecoin race is heating up in Asia-Pacific once again, folks! After a string of major banks started gearing up to enter the game, Visa has now officially joined the race for the crown. Through Visa Direct (being tested with dtcpay in Singapore), customers can preload stablecoins to make cross-border payments, while recipients can conveniently use the funds in fiat currency!
💡 What should traders do?
Integrating stablecoins into major payment networks helps crypto funds flow more smoothly. Keep an eye on payment infrastructure coins and DeFi projects that could benefit from cross-border liquidity, but remember to manage your capital carefully and don't FOMO into the news!
⚠️ This is not financial advice.
👇 Click the trade buttons below to support me:
$SOL
{spot}(SOLUSDT)
$BNB
{spot}(BNBUSDT)
$BREV
{future}(BREVUSDT)
#Visa #Stablecoins #asiamarket #CrossBorderPayments #CryptoAdoption #DeFi #Web3 #Fintech #VINHTOCDO
#VisaPlansStablecoinPrefundingForAPACCrossBorderPayments 💳 ASIA'S STABLECOIN SHOWDOWN: IT'S VISA'S TURN TO JOIN THE FRAY! 🌏
The stablecoin race is heating up in Asia-Pacific once again, folks! After a string of major banks started gearing up to enter the game, Visa has now officially joined the race for the crown. Through Visa Direct (being tested with dtcpay in Singapore), customers can preload stablecoins to make cross-border payments, while recipients can conveniently use the funds in fiat currency!
💡 What should traders do?
Integrating stablecoins into major payment networks helps crypto funds flow more smoothly. Keep an eye on payment infrastructure coins and DeFi projects that could benefit from cross-border liquidity, but remember to manage your capital carefully and don't FOMO into the news!
⚠️ This is not financial advice.
👇 Click the trade buttons below to support me:
$SOL
$BNB
$BREV
#Visa #Stablecoins #asiamarket #CrossBorderPayments #CryptoAdoption #DeFi #Web3 #Fintech #VINHTOCDO
The stablecoin race is heating up in Asia-Pacific once again, folks! After a string of major banks started gearing up to enter the game, Visa has now officially joined the race for the crown. Through Visa Direct (being tested with dtcpay in Singapore), customers can preload stablecoins to make cross-border payments, while recipients can conveniently use the funds in fiat currency!
💡 What should traders do?
Integrating stablecoins into major payment networks helps crypto funds flow more smoothly. Keep an eye on payment infrastructure coins and DeFi projects that could benefit from cross-border liquidity, but remember to manage your capital carefully and don't FOMO into the news!
⚠️ This is not financial advice.
👇 Click the trade buttons below to support me:
$SOL
$BNB
$BREV
#Visa #Stablecoins #asiamarket #CrossBorderPayments #CryptoAdoption #DeFi #Web3 #Fintech #VINHTOCDO
5
389

·
--
Verified
Article
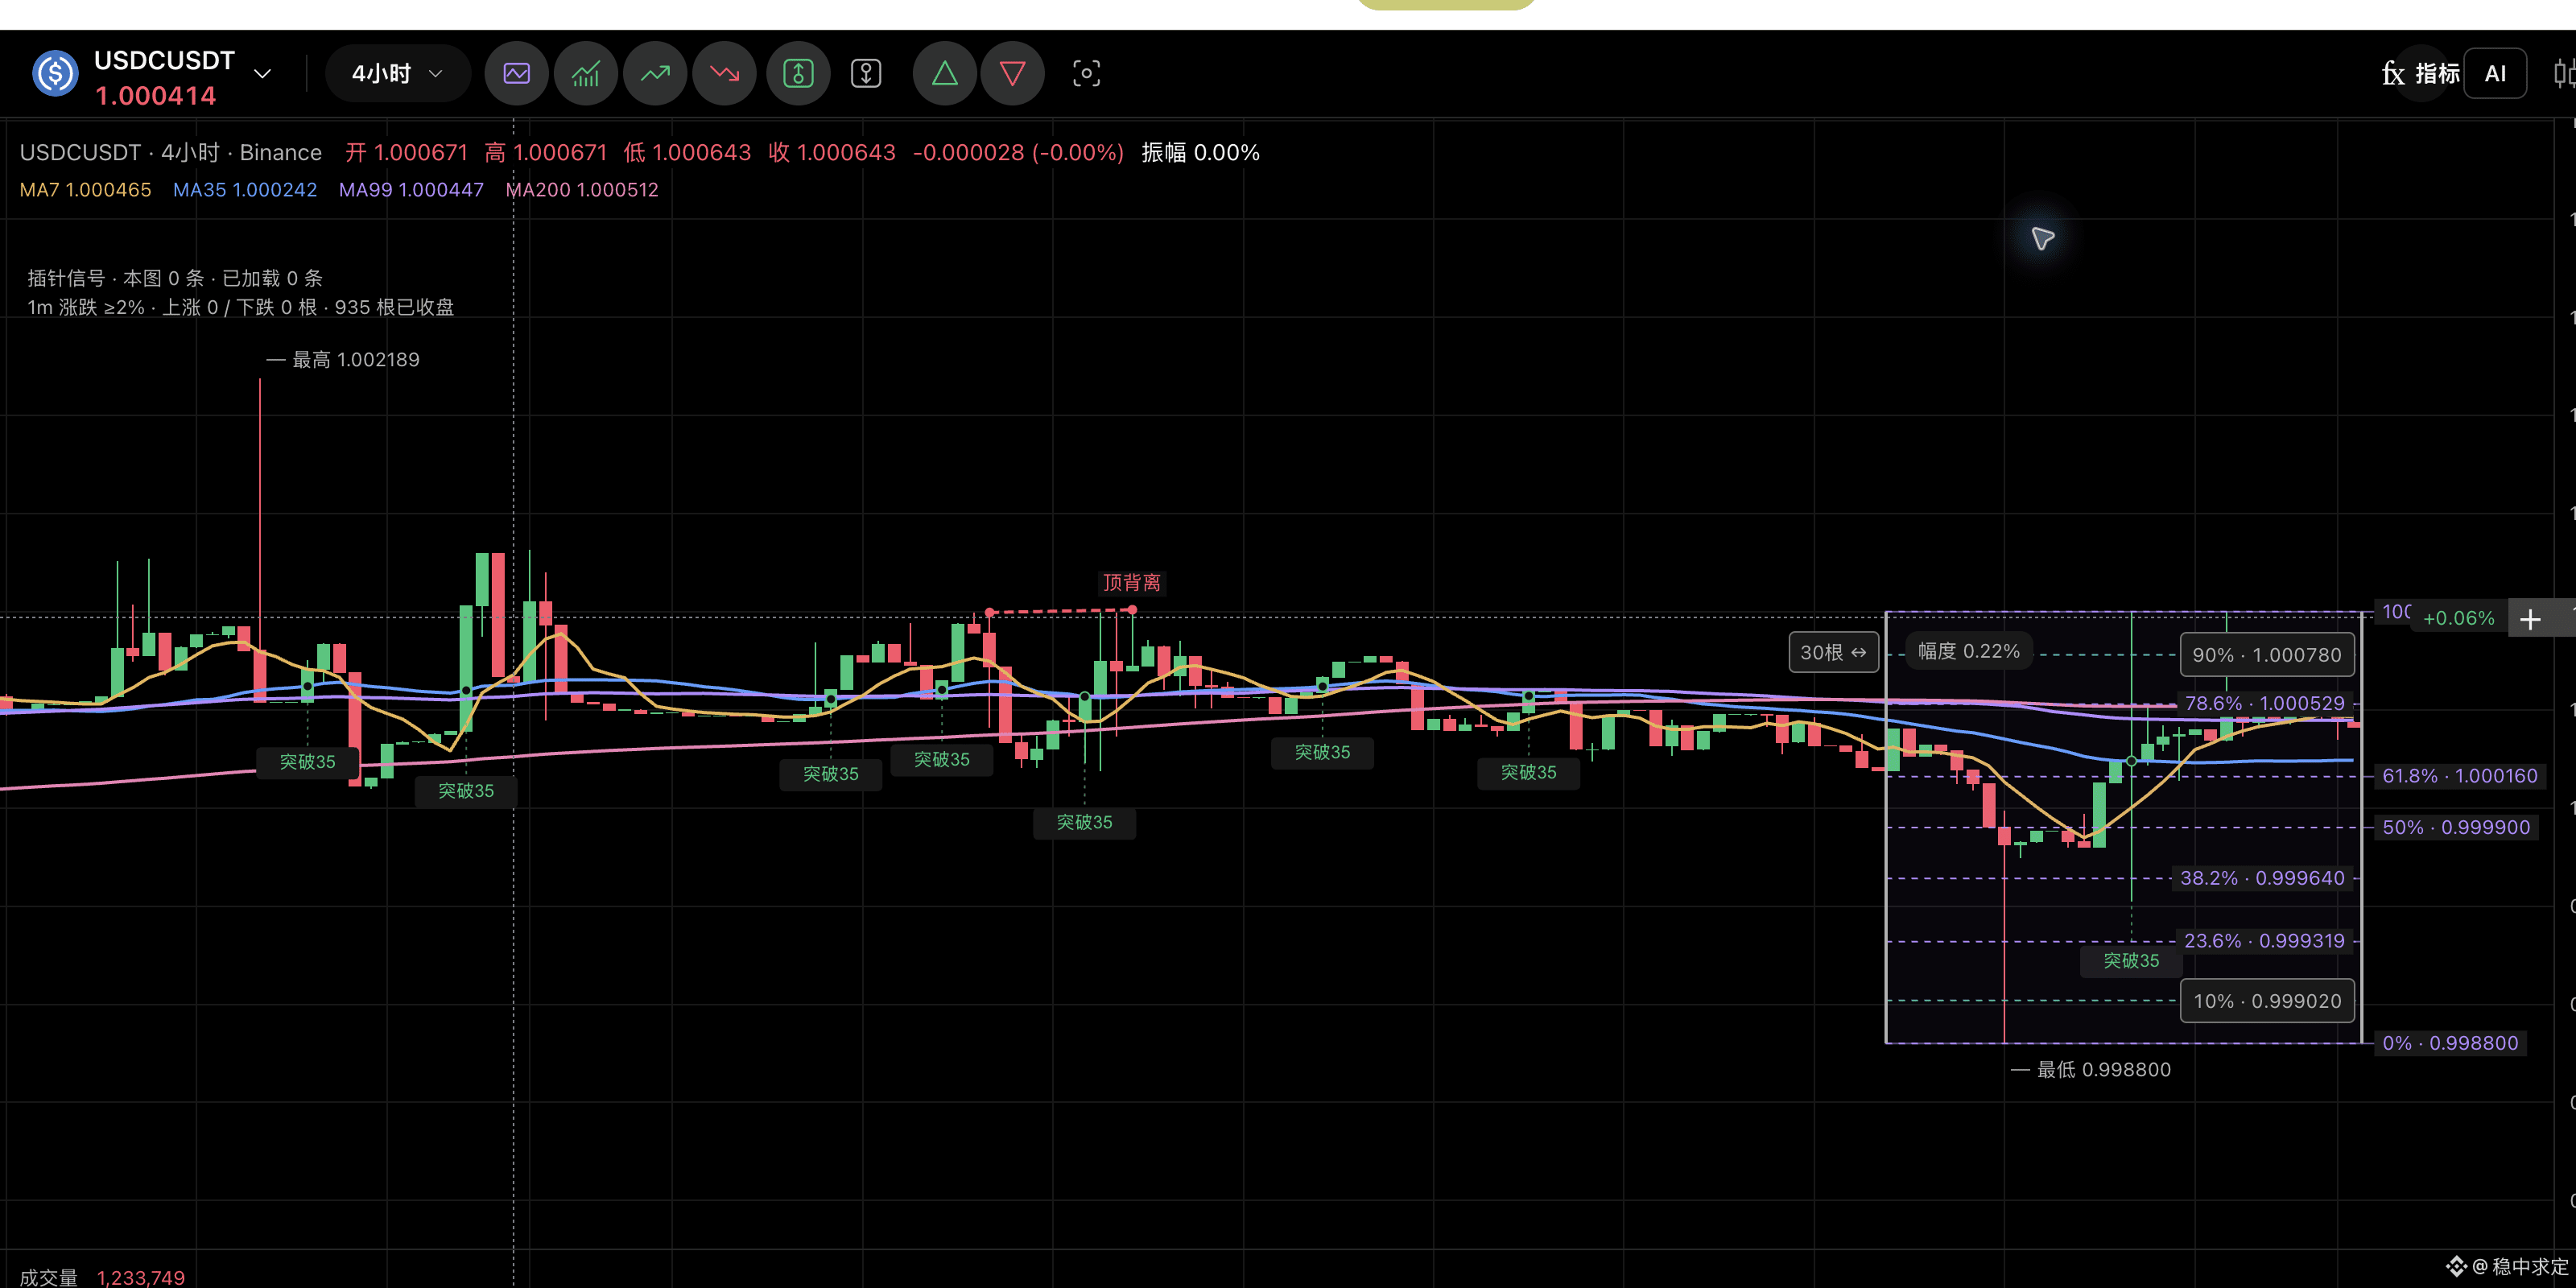
Visa brings stablecoin prefunding to Asia-Pacific: USDC gets an entry point, but this isn’t new buying demandVisa brings stablecoin prefunding to Asia-Pacific: USDC gets an entry point, but this isn’t new buying demand
The bottom line: The `#VisaPlansStablecoinPrefundingForAPACCrossBorderPayments` currently visible on Binance Square’s trending page corresponds to a new Asia-Pacific pilot announced by Visa on November 18. The real change is not that “Visa is starting to buy USDC for businesses,” but that eligible Visa Direct clients can use supported stablecoins to prefund cross-border fiat payouts, with recipients still receiving fiat currency.
1. What happened?
Official Visa announcement: https://www.visa.com.sg/about-visa/newsroom/press-releases/visa-direct-advances-stablecoin-powered-money-movement-in-asia-pacific.html. The announcement says that Singapore digital payments company dtcpay is participating in the pilot, with stablecoin funds entering Visa Direct’s prefunding process, while the final payout still reaches the recipient in fiat currency. Visa describes this as connecting on-chain funds with its existing cross-border payments network, and says its network covers more than 18 billion endpoints.
Visa brings stablecoin prefunding to Asia-Pacific: USDC gets an entry point, but this isn’t new buying demand
Visa brings stablecoin prefunding to Asia-Pacific: USDC gets an entry point, but this isn’t new buying demand
The bottom line: The `#VisaPlansStablecoinPrefundingForAPACCrossBorderPayments` currently visible on Binance Square’s trending page corresponds to a new Asia-Pacific pilot announced by Visa on November 18. The real change is not that “Visa is starting to buy USDC for businesses,” but that eligible Visa Direct clients can use supported stablecoins to prefund cross-border fiat payouts, with recipients still receiving fiat currency.
1. What happened?
Official Visa announcement: https://www.visa.com.sg/about-visa/newsroom/press-releases/visa-direct-advances-stablecoin-powered-money-movement-in-asia-pacific.html. The announcement says that Singapore digital payments company dtcpay is participating in the pilot, with stablecoin funds entering Visa Direct’s prefunding process, while the final payout still reaches the recipient in fiat currency. Visa describes this as connecting on-chain funds with its existing cross-border payments network, and says its network covers more than 18 billion endpoints.
The bottom line: The `#VisaPlansStablecoinPrefundingForAPACCrossBorderPayments` currently visible on Binance Square’s trending page corresponds to a new Asia-Pacific pilot announced by Visa on November 18. The real change is not that “Visa is starting to buy USDC for businesses,” but that eligible Visa Direct clients can use supported stablecoins to prefund cross-border fiat payouts, with recipients still receiving fiat currency.
1. What happened?
Official Visa announcement: https://www.visa.com.sg/about-visa/newsroom/press-releases/visa-direct-advances-stablecoin-powered-money-movement-in-asia-pacific.html. The announcement says that Singapore digital payments company dtcpay is participating in the pilot, with stablecoin funds entering Visa Direct’s prefunding process, while the final payout still reaches the recipient in fiat currency. Visa describes this as connecting on-chain funds with its existing cross-border payments network, and says its network covers more than 18 billion endpoints.
524

·
--
Verified
#VisaPlansStablecoinPrefundingForAPACCrossBorderPayments
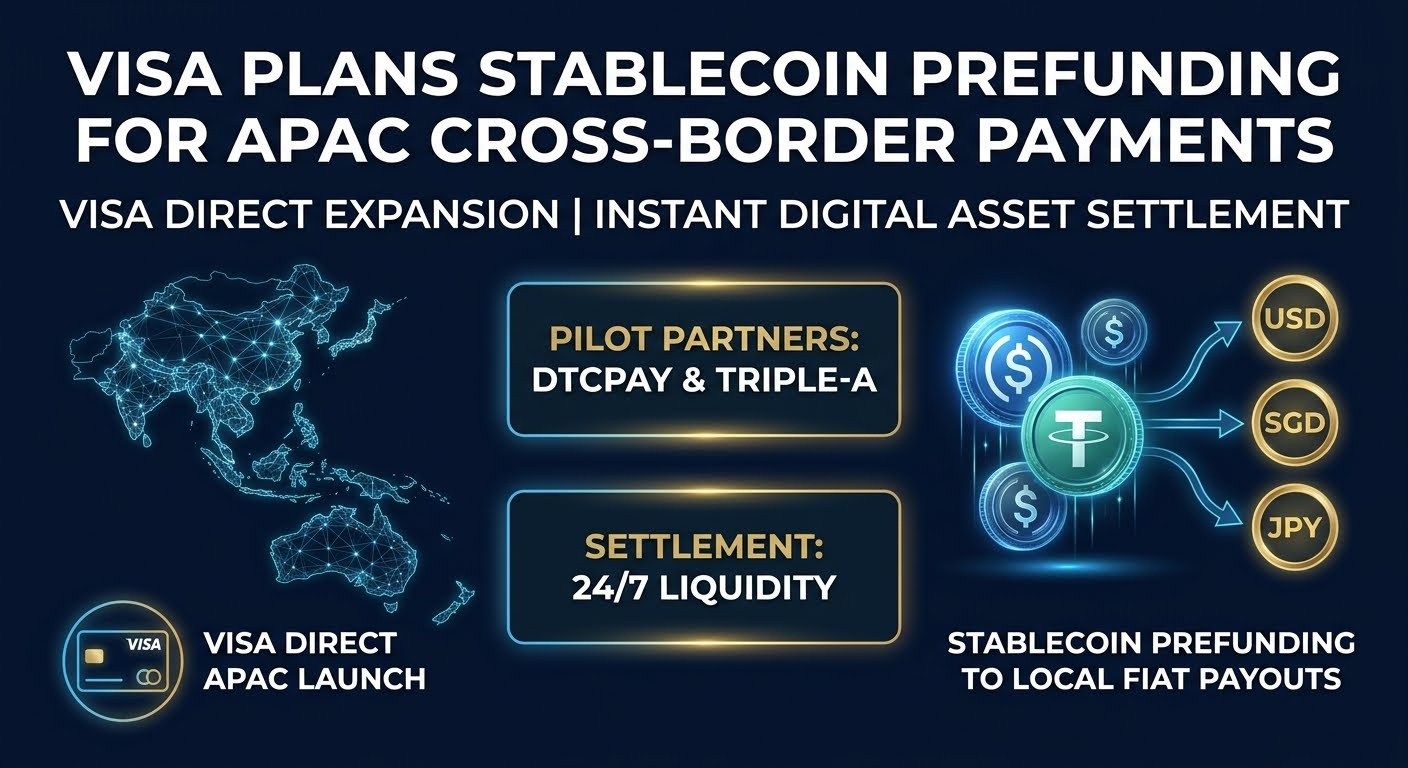
Visa announced a new feature that will enable its enterprise clients in the Asia-Pacific (APAC) region to make cross-border payouts using stablecoin prefunding. 💳🌏
Announced by Visa on November 18, 2026, this initiative connects digital assets with traditional financial infrastructure through Visa Direct, the company’s real-time money transfer network. 🚀🔗
Visa is launching this first pilot in the Asia-Pacific region in partnership with Singapore-based digital payments company dtcpay, and is working with licensed partners such as Triple-A on regional infrastructure integration. 🤝🇸🇬Although businesses use stablecoins to prefund their payment pools, recipients on the other end continue to receive payments in their familiar local fiat currencies. 💵🔄Cross-border transfers that can take days and require large cash balances to be held in advance under traditional banking systems can be completed in minutes with stablecoin infrastructure, enabling flexible liquidity management 24/7. ⚡⏱️This technology, which entered commercial use in the US in October 2026 in collaboration with Inyo Global, is now also strengthening the Visa Direct network in the Asia-Pacific market, reaching more than 18 billion endpoints worldwide. 🌍📈
$PHAROS $BULLA $IRYS
{future}(IRYSUSDT)
{future}(BULLAUSDT)
{future}(PHAROSUSDT)
#VisaPlansStablecoinPrefundingForAPACCrossBorderPayments
Visa announced a new feature that will enable its enterprise clients in the Asia-Pacific (APAC) region to make cross-border payouts using stablecoin prefunding. 💳🌏
Announced by Visa on November 18, 2026, this initiative connects digital assets with traditional financial infrastructure through Visa Direct, the company’s real-time money transfer network. 🚀🔗
Visa is launching this first pilot in the Asia-Pacific region in partnership with Singapore-based digital payments company dtcpay, and is working with licensed partners such as Triple-A on regional infrastructure integration. 🤝🇸🇬Although businesses use stablecoins to prefund their payment pools, recipients on the other end continue to receive payments in their familiar local fiat currencies. 💵🔄Cross-border transfers that can take days and require large cash balances to be held in advance under traditional banking systems can be completed in minutes with stablecoin infrastructure, enabling flexible liquidity management 24/7. ⚡⏱️This technology, which entered commercial use in the US in October 2026 in collaboration with Inyo Global, is now also strengthening the Visa Direct network in the Asia-Pacific market, reaching more than 18 billion endpoints worldwide. 🌍📈
$PHAROS $BULLA $IRYS
Visa announced a new feature that will enable its enterprise clients in the Asia-Pacific (APAC) region to make cross-border payouts using stablecoin prefunding. 💳🌏
Announced by Visa on November 18, 2026, this initiative connects digital assets with traditional financial infrastructure through Visa Direct, the company’s real-time money transfer network. 🚀🔗
Visa is launching this first pilot in the Asia-Pacific region in partnership with Singapore-based digital payments company dtcpay, and is working with licensed partners such as Triple-A on regional infrastructure integration. 🤝🇸🇬Although businesses use stablecoins to prefund their payment pools, recipients on the other end continue to receive payments in their familiar local fiat currencies. 💵🔄Cross-border transfers that can take days and require large cash balances to be held in advance under traditional banking systems can be completed in minutes with stablecoin infrastructure, enabling flexible liquidity management 24/7. ⚡⏱️This technology, which entered commercial use in the US in October 2026 in collaboration with Inyo Global, is now also strengthening the Visa Direct network in the Asia-Pacific market, reaching more than 18 billion endpoints worldwide. 🌍📈
$PHAROS $BULLA $IRYS
557

·
--
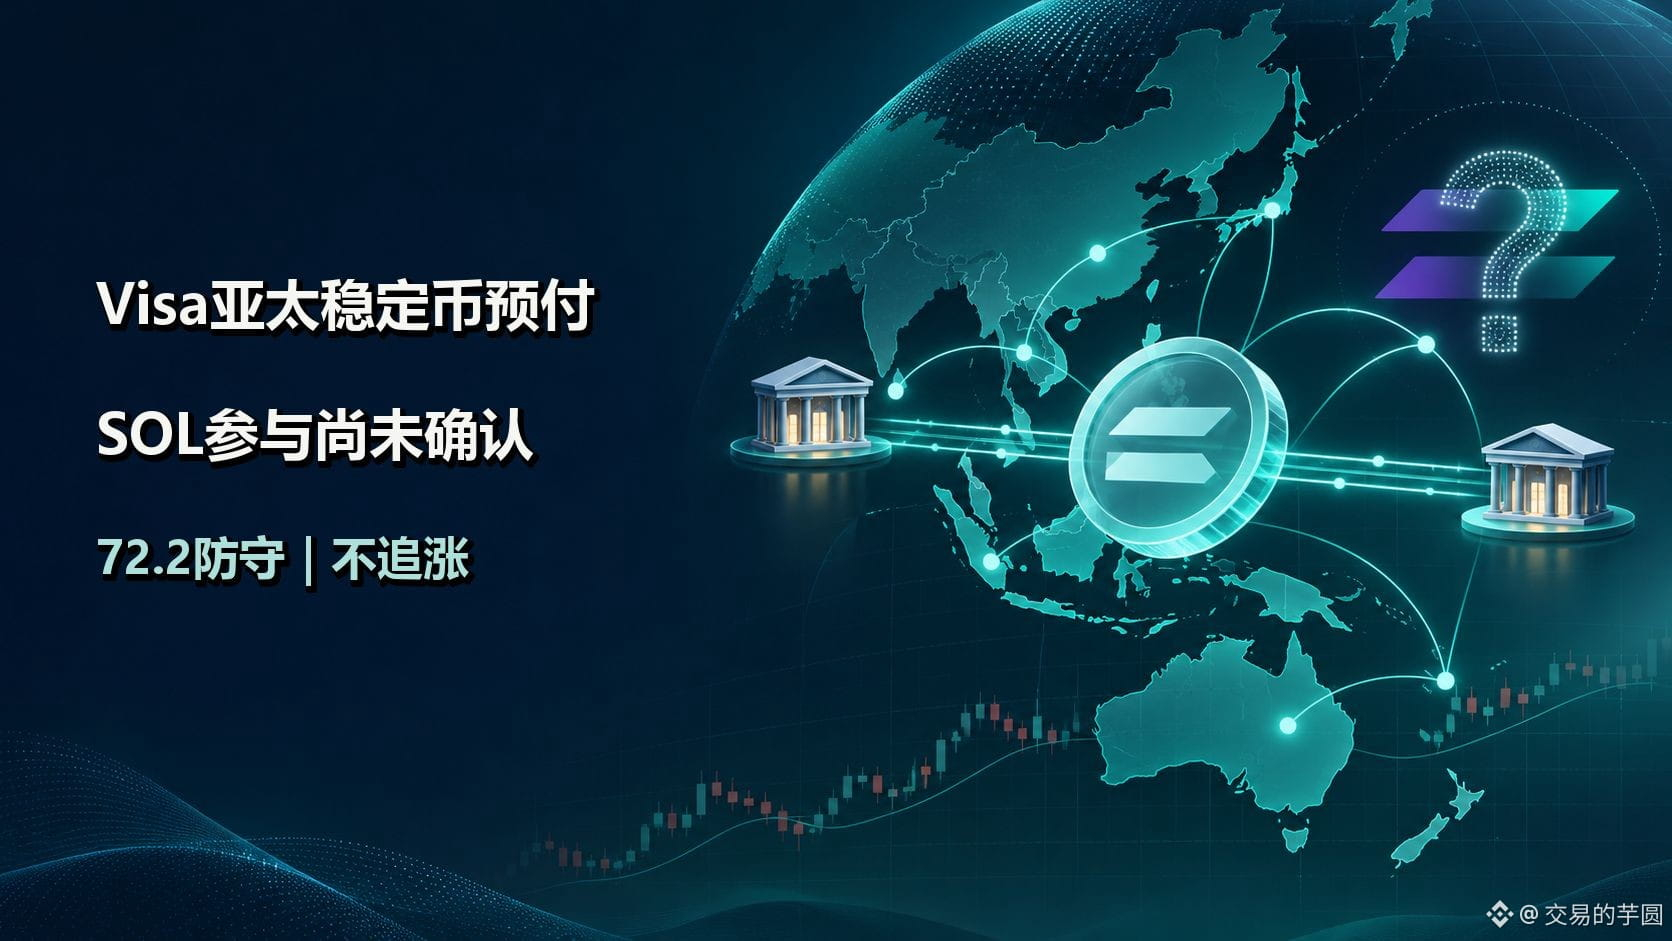
Visa’s Asia-Pacific stablecoin pre-funding pilot | SOL not confirmed as part of this round | Still needs confirmation above $73
I welcome progress in payment use cases, but I won’t chase the “SOL connection” speculation. A trending topic on Binance Square is Visa’s plan to expand stablecoin pre-funding for cross-border payments into Asia-Pacific. Visa’s official announcement on November 18 said eligible clients can use supported stablecoins to pre-fund cross-border payments via Visa Direct, while recipients continue to receive fiat currency; Singapore-based dtcpay is the local pilot partner. Payment infrastructure provider Triple-A also confirmed in its announcement that it will provide stablecoin processing, conversion, and compliance screening. The two first-party announcements corroborate the direction of the pilot, but neither specifies Solana’s use in this Asia-Pacific announcement, nor discloses any SOL purchases or on-chain transaction volume. This is a payment business pilot, not “Visa has announced that this new order will run on Solana.”
Why keep it on my SOL watchlist, then? Visa officially described a USDC settlement pilot using the Solana and Ethereum networks as early as 2023, showing that Solana has historically been among its payment technology options. But the participants and settlement paths for that earlier project differ from those of this Asia-Pacific pre-funding business, so they cannot be directly linked as one and the same order. What could genuinely improve SOL’s fundamentals would be follow-up documentation specifying the chain, stablecoin, and settlement frequency, along with evidence of sustained use in on-chain data or partner reports. Even if Solana is used, network fees must still be distinguished from new buying demand for SOL on the secondary market. If all we see is a news headline without evidence of the transaction path, the market may trade the narrative first and then pull back.
I checked Binance SOL/USDT at around $73.27, up about 1.08% over 24 hours, with a range of $72.22 to $75.78; BTC was around $62,794.61 over the same period, down about 1.44% in 24 hours. SOL outperforming BTC is a fact based on current prices, but that does not mean the Visa pilot caused it, especially as the Fed minutes have just been released and risk assets overall are still digesting discussion of rate hikes. First, watch whether $74 holds above; next, watch $75.8. On the downside, $72.2 is the range low. If SOL continues to find volume support while BTC weakens, independent demand would be more worth investigating; if the rise is driven only by thin trading, the breakout is less reliable.
If I were trading this myself, I would stay out for now; I would only consider an unleveraged spot long, with a planned position no larger than 1% of total capital. My entry trigger would be an hourly SOL close above $74, followed by a successful retest, while BTC stops making new intraday lows. I would take half off at the first target of $75.8, reduce further near the second target of $78, and close the remaining position if an hourly close falls back below $74. The initial stop would be below $72.8; if price breaks below $72.2, I would close the entire position and cancel the long setup. If Visa or its partners later confirm that the pilot uses another chain, or if SOL fails to hold above $74, I would discard the assumption that “the payment narrative supports SOL’s short-term relative strength.” I’ll act only on verified transaction paths and price action.
#VisaPlansStablecoinPrefundingForAPACCrossBorderPayments #SOL #BTC
The above is solely my personal market observation and does not constitute investment advice.
Visa’s Asia-Pacific stablecoin pre-funding pilot | SOL not confirmed as part of this round | Still needs confirmation above $73
I welcome progress in payment use cases, but I won’t chase the “SOL connection” speculation. A trending topic on Binance Square is Visa’s plan to expand stablecoin pre-funding for cross-border payments into Asia-Pacific. Visa’s official announcement on November 18 said eligible clients can use supported stablecoins to pre-fund cross-border payments via Visa Direct, while recipients continue to receive fiat currency; Singapore-based dtcpay is the local pilot partner. Payment infrastructure provider Triple-A also confirmed in its announcement that it will provide stablecoin processing, conversion, and compliance screening. The two first-party announcements corroborate the direction of the pilot, but neither specifies Solana’s use in this Asia-Pacific announcement, nor discloses any SOL purchases or on-chain transaction volume. This is a payment business pilot, not “Visa has announced that this new order will run on Solana.”
Why keep it on my SOL watchlist, then? Visa officially described a USDC settlement pilot using the Solana and Ethereum networks as early as 2023, showing that Solana has historically been among its payment technology options. But the participants and settlement paths for that earlier project differ from those of this Asia-Pacific pre-funding business, so they cannot be directly linked as one and the same order. What could genuinely improve SOL’s fundamentals would be follow-up documentation specifying the chain, stablecoin, and settlement frequency, along with evidence of sustained use in on-chain data or partner reports. Even if Solana is used, network fees must still be distinguished from new buying demand for SOL on the secondary market. If all we see is a news headline without evidence of the transaction path, the market may trade the narrative first and then pull back.
I checked Binance SOL/USDT at around $73.27, up about 1.08% over 24 hours, with a range of $72.22 to $75.78; BTC was around $62,794.61 over the same period, down about 1.44% in 24 hours. SOL outperforming BTC is a fact based on current prices, but that does not mean the Visa pilot caused it, especially as the Fed minutes have just been released and risk assets overall are still digesting discussion of rate hikes. First, watch whether $74 holds above; next, watch $75.8. On the downside, $72.2 is the range low. If SOL continues to find volume support while BTC weakens, independent demand would be more worth investigating; if the rise is driven only by thin trading, the breakout is less reliable.
If I were trading this myself, I would stay out for now; I would only consider an unleveraged spot long, with a planned position no larger than 1% of total capital. My entry trigger would be an hourly SOL close above $74, followed by a successful retest, while BTC stops making new intraday lows. I would take half off at the first target of $75.8, reduce further near the second target of $78, and close the remaining position if an hourly close falls back below $74. The initial stop would be below $72.8; if price breaks below $72.2, I would close the entire position and cancel the long setup. If Visa or its partners later confirm that the pilot uses another chain, or if SOL fails to hold above $74, I would discard the assumption that “the payment narrative supports SOL’s short-term relative strength.” I’ll act only on verified transaction paths and price action.
#VisaPlansStablecoinPrefundingForAPACCrossBorderPayments #SOL #BTC
The above is solely my personal market observation and does not constitute investment advice.
I welcome progress in payment use cases, but I won’t chase the “SOL connection” speculation. A trending topic on Binance Square is Visa’s plan to expand stablecoin pre-funding for cross-border payments into Asia-Pacific. Visa’s official announcement on November 18 said eligible clients can use supported stablecoins to pre-fund cross-border payments via Visa Direct, while recipients continue to receive fiat currency; Singapore-based dtcpay is the local pilot partner. Payment infrastructure provider Triple-A also confirmed in its announcement that it will provide stablecoin processing, conversion, and compliance screening. The two first-party announcements corroborate the direction of the pilot, but neither specifies Solana’s use in this Asia-Pacific announcement, nor discloses any SOL purchases or on-chain transaction volume. This is a payment business pilot, not “Visa has announced that this new order will run on Solana.”
Why keep it on my SOL watchlist, then? Visa officially described a USDC settlement pilot using the Solana and Ethereum networks as early as 2023, showing that Solana has historically been among its payment technology options. But the participants and settlement paths for that earlier project differ from those of this Asia-Pacific pre-funding business, so they cannot be directly linked as one and the same order. What could genuinely improve SOL’s fundamentals would be follow-up documentation specifying the chain, stablecoin, and settlement frequency, along with evidence of sustained use in on-chain data or partner reports. Even if Solana is used, network fees must still be distinguished from new buying demand for SOL on the secondary market. If all we see is a news headline without evidence of the transaction path, the market may trade the narrative first and then pull back.
I checked Binance SOL/USDT at around $73.27, up about 1.08% over 24 hours, with a range of $72.22 to $75.78; BTC was around $62,794.61 over the same period, down about 1.44% in 24 hours. SOL outperforming BTC is a fact based on current prices, but that does not mean the Visa pilot caused it, especially as the Fed minutes have just been released and risk assets overall are still digesting discussion of rate hikes. First, watch whether $74 holds above; next, watch $75.8. On the downside, $72.2 is the range low. If SOL continues to find volume support while BTC weakens, independent demand would be more worth investigating; if the rise is driven only by thin trading, the breakout is less reliable.
If I were trading this myself, I would stay out for now; I would only consider an unleveraged spot long, with a planned position no larger than 1% of total capital. My entry trigger would be an hourly SOL close above $74, followed by a successful retest, while BTC stops making new intraday lows. I would take half off at the first target of $75.8, reduce further near the second target of $78, and close the remaining position if an hourly close falls back below $74. The initial stop would be below $72.8; if price breaks below $72.2, I would close the entire position and cancel the long setup. If Visa or its partners later confirm that the pilot uses another chain, or if SOL fails to hold above $74, I would discard the assumption that “the payment narrative supports SOL’s short-term relative strength.” I’ll act only on verified transaction paths and price action.
#VisaPlansStablecoinPrefundingForAPACCrossBorderPayments #SOL #BTC
The above is solely my personal market observation and does not constitute investment advice.
1
·
--
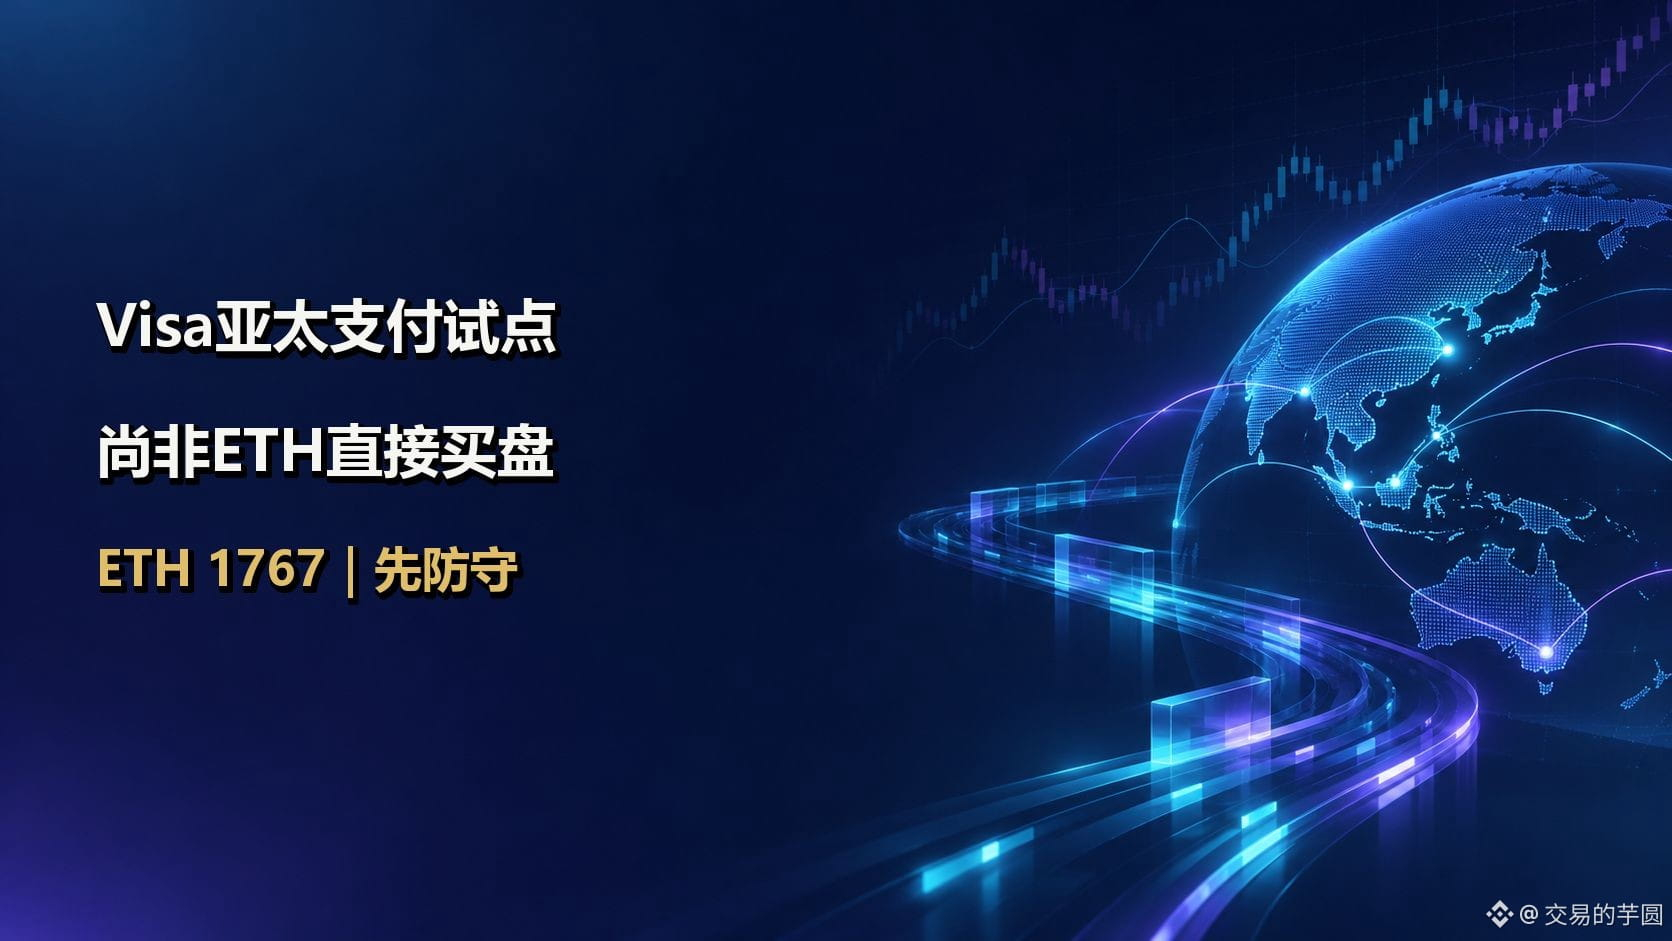
Visa expands stablecoin prefunding in APAC|Pilot is not ETH buying pressure|Ethereum first finds support near $1,767
My view is that the long-term direction of payment infrastructure is worth watching, but I would not chase ETH higher just because of the Visa news. The topic #VisaPlansStablecoinPrefundingForAPACCrossBorderPayments appeared on Binance Square. Visa’s official announcement on November 18 said it plans to let eligible Visa Direct customers in APAC prefund cross-border payments using supported stablecoins, while recipients will still receive fiat currency. The APAC initiative is being piloted with Singaporean payments company dtcpay. Triple-A, which provides infrastructure services for the project, also confirmed on its website the same day that it offers stablecoin processing, currency conversion, and compliance screening. The announcements from both parties corroborate the direction of the partnership, but Visa explicitly describes the APAC arrangement as a pilot. It should not be presented as a full commercial launch across the region, and the network’s more than 18 billion endpoints globally should not be mistaken for stablecoin transactions that have already taken place.
The mechanism by which this development could affect crypto markets is that businesses can manage short-term cross-border liquidity outside traditional banking hours, then use the Visa Direct network to deliver local currency to end recipients. Stablecoins and on-chain payment infrastructure may gain more real-world use cases. But the connection to ETH’s value requires another step: Visa’s announcement does not specify which blockchain or stablecoin the APAC pilot will use, nor does it disclose on-chain settlement volume. A more direct link to ETH can only be discussed if verifiable Ethereum mainnet transactions, sustained fee activity, and settlement demand emerge later. Visa began testing last year, and its U.S. program entered commercial production in October; today’s APAC announcement expands the region and partnership model—it does not create entirely new demand for an asset out of nowhere.
When I checked the 24-hour ETHUSDT spot market on Binance, ETH was around $1,767.16, down about 1.35% over 24 hours, with a low of $1,756 and a high of $1,836. The price is near the bottom of the range, indicating that the market has not mounted a strong one-way rally in response to this payment pilot. The $1,750–$1,756 area is short-term support, $1,800 is the psychological level that needs to be reclaimed first, and around $1,836 is the top of the current range. These levels reflect current market conditions and are not guaranteed to hold. If ETH breaks below $1,750 and fails to recover it, I would abandon my short-term stabilization view. A brief move back above $1,800 followed by a retreat would also not be enough to signal a trend recovery.
If I were trading this myself, I would not try to buy the dip right now. The only direction I would consider is a small spot long, using no more than 2% of my total capital. My entry trigger would be ETH reclaiming and holding $1,800, then pulling back to $1,790 without breaking below it, alongside an improvement in trading volume. If that does not happen, I would remain in cash. If triggered, my first target would be $1,835 and my second $1,870; I would sell half at $1,835. I would set the initial stop-loss below $1,765 and close the remaining position if ETH falls back below $1,790. If it first loses $1,750, I would cancel my long plan and wait for a new setup. I would never use pilot news as a reason to add leverage.
Sources: Visa and Triple-A announcements dated November 18; Binance ETHUSDT spot 24-hour market data. #VisaPlansStablecoinPrefundingForAPACCrossBorderPayments #ETH
The above is only my personal market commentary and does not constitute investment advice.
Visa expands stablecoin prefunding in APAC|Pilot is not ETH buying pressure|Ethereum first finds support near $1,767
My view is that the long-term direction of payment infrastructure is worth watching, but I would not chase ETH higher just because of the Visa news. The topic #VisaPlansStablecoinPrefundingForAPACCrossBorderPayments appeared on Binance Square. Visa’s official announcement on November 18 said it plans to let eligible Visa Direct customers in APAC prefund cross-border payments using supported stablecoins, while recipients will still receive fiat currency. The APAC initiative is being piloted with Singaporean payments company dtcpay. Triple-A, which provides infrastructure services for the project, also confirmed on its website the same day that it offers stablecoin processing, currency conversion, and compliance screening. The announcements from both parties corroborate the direction of the partnership, but Visa explicitly describes the APAC arrangement as a pilot. It should not be presented as a full commercial launch across the region, and the network’s more than 18 billion endpoints globally should not be mistaken for stablecoin transactions that have already taken place.
The mechanism by which this development could affect crypto markets is that businesses can manage short-term cross-border liquidity outside traditional banking hours, then use the Visa Direct network to deliver local currency to end recipients. Stablecoins and on-chain payment infrastructure may gain more real-world use cases. But the connection to ETH’s value requires another step: Visa’s announcement does not specify which blockchain or stablecoin the APAC pilot will use, nor does it disclose on-chain settlement volume. A more direct link to ETH can only be discussed if verifiable Ethereum mainnet transactions, sustained fee activity, and settlement demand emerge later. Visa began testing last year, and its U.S. program entered commercial production in October; today’s APAC announcement expands the region and partnership model—it does not create entirely new demand for an asset out of nowhere.
When I checked the 24-hour ETHUSDT spot market on Binance, ETH was around $1,767.16, down about 1.35% over 24 hours, with a low of $1,756 and a high of $1,836. The price is near the bottom of the range, indicating that the market has not mounted a strong one-way rally in response to this payment pilot. The $1,750–$1,756 area is short-term support, $1,800 is the psychological level that needs to be reclaimed first, and around $1,836 is the top of the current range. These levels reflect current market conditions and are not guaranteed to hold. If ETH breaks below $1,750 and fails to recover it, I would abandon my short-term stabilization view. A brief move back above $1,800 followed by a retreat would also not be enough to signal a trend recovery.
If I were trading this myself, I would not try to buy the dip right now. The only direction I would consider is a small spot long, using no more than 2% of my total capital. My entry trigger would be ETH reclaiming and holding $1,800, then pulling back to $1,790 without breaking below it, alongside an improvement in trading volume. If that does not happen, I would remain in cash. If triggered, my first target would be $1,835 and my second $1,870; I would sell half at $1,835. I would set the initial stop-loss below $1,765 and close the remaining position if ETH falls back below $1,790. If it first loses $1,750, I would cancel my long plan and wait for a new setup. I would never use pilot news as a reason to add leverage.
Sources: Visa and Triple-A announcements dated November 18; Binance ETHUSDT spot 24-hour market data. #VisaPlansStablecoinPrefundingForAPACCrossBorderPayments #ETH
The above is only my personal market commentary and does not constitute investment advice.
My view is that the long-term direction of payment infrastructure is worth watching, but I would not chase ETH higher just because of the Visa news. The topic #VisaPlansStablecoinPrefundingForAPACCrossBorderPayments appeared on Binance Square. Visa’s official announcement on November 18 said it plans to let eligible Visa Direct customers in APAC prefund cross-border payments using supported stablecoins, while recipients will still receive fiat currency. The APAC initiative is being piloted with Singaporean payments company dtcpay. Triple-A, which provides infrastructure services for the project, also confirmed on its website the same day that it offers stablecoin processing, currency conversion, and compliance screening. The announcements from both parties corroborate the direction of the partnership, but Visa explicitly describes the APAC arrangement as a pilot. It should not be presented as a full commercial launch across the region, and the network’s more than 18 billion endpoints globally should not be mistaken for stablecoin transactions that have already taken place.
The mechanism by which this development could affect crypto markets is that businesses can manage short-term cross-border liquidity outside traditional banking hours, then use the Visa Direct network to deliver local currency to end recipients. Stablecoins and on-chain payment infrastructure may gain more real-world use cases. But the connection to ETH’s value requires another step: Visa’s announcement does not specify which blockchain or stablecoin the APAC pilot will use, nor does it disclose on-chain settlement volume. A more direct link to ETH can only be discussed if verifiable Ethereum mainnet transactions, sustained fee activity, and settlement demand emerge later. Visa began testing last year, and its U.S. program entered commercial production in October; today’s APAC announcement expands the region and partnership model—it does not create entirely new demand for an asset out of nowhere.
When I checked the 24-hour ETHUSDT spot market on Binance, ETH was around $1,767.16, down about 1.35% over 24 hours, with a low of $1,756 and a high of $1,836. The price is near the bottom of the range, indicating that the market has not mounted a strong one-way rally in response to this payment pilot. The $1,750–$1,756 area is short-term support, $1,800 is the psychological level that needs to be reclaimed first, and around $1,836 is the top of the current range. These levels reflect current market conditions and are not guaranteed to hold. If ETH breaks below $1,750 and fails to recover it, I would abandon my short-term stabilization view. A brief move back above $1,800 followed by a retreat would also not be enough to signal a trend recovery.
If I were trading this myself, I would not try to buy the dip right now. The only direction I would consider is a small spot long, using no more than 2% of my total capital. My entry trigger would be ETH reclaiming and holding $1,800, then pulling back to $1,790 without breaking below it, alongside an improvement in trading volume. If that does not happen, I would remain in cash. If triggered, my first target would be $1,835 and my second $1,870; I would sell half at $1,835. I would set the initial stop-loss below $1,765 and close the remaining position if ETH falls back below $1,790. If it first loses $1,750, I would cancel my long plan and wait for a new setup. I would never use pilot news as a reason to add leverage.
Sources: Visa and Triple-A announcements dated November 18; Binance ETHUSDT spot 24-hour market data. #VisaPlansStablecoinPrefundingForAPACCrossBorderPayments #ETH
The above is only my personal market commentary and does not constitute investment advice.
ETH-1.97%
VUS-0.15%
27


Article
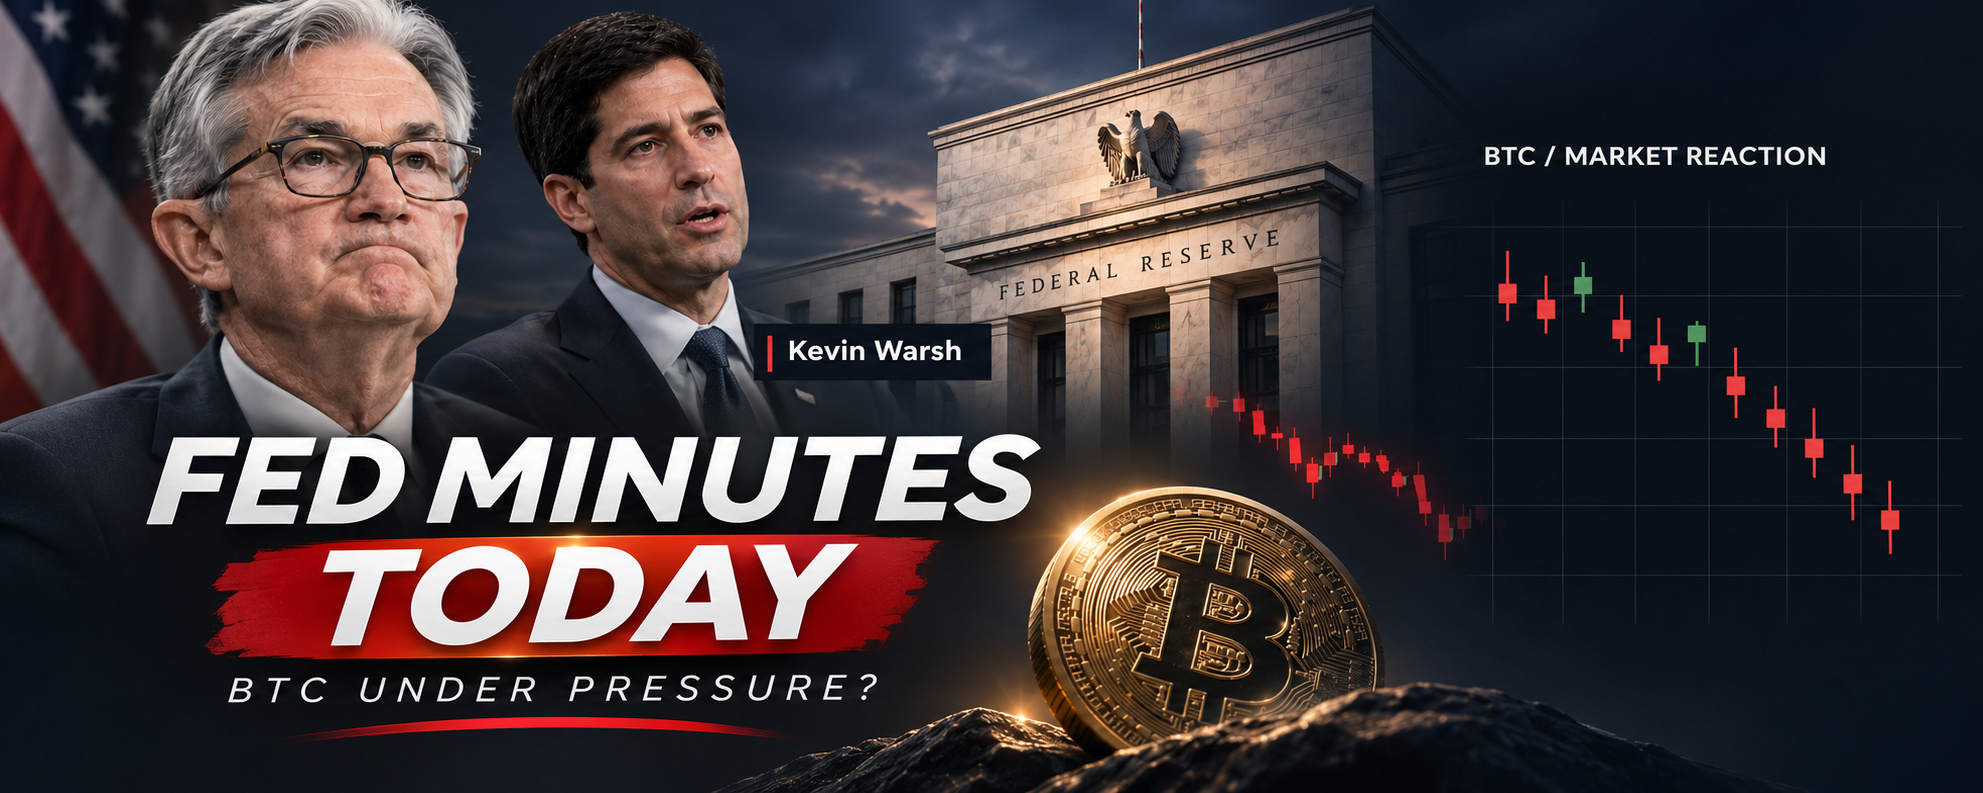
🚨BITCOIN ON HIGH ALERT: THE FED COULD SHAKE THE ENTIRE CRYPTO MARKET TONIGHT!🚨Something interesting is happening in the US economy, and I think every Bitcoin investor needs to understand it before tonight's FOMC minutes.
Inflation is still causing trouble. The job market is holding up. And now, traders are preparing for another interest-rate hike.
But here's the real question.
Has Bitcoin already priced in the bad news, or is another surprise coming?
Let me explain everything in simple words.
1. CPI: Inflation Is Still a Problem
On November 10, the US released its October inflation report.
Here are the numbers:
- Headline CPI: +0.4% monthly
- Core CPI: +0.3% monthly
- Food prices: +0.5%
- Energy prices: +0.7%
Core inflation has now increased by 0.3% for three consecutive months.
That's important because the Federal Reserve wants inflation to return to its 2% target.
And when prices keep rising, cutting interest rates becomes much harder.
2. PPI: Another Warning Sign
On November 13, we received the Producer Price Index report.
- Monthly PPI: +0.3%
- Annual PPI: +6.5%
- Core PPI excluding food, energy and trade: +0.5% monthly
That 6.5% annual increase is particularly concerning.
It's the largest yearly PPI increase since November 2022.
Think about it this way.
When businesses face higher production costs, some of those costs can eventually reach consumers.
That's why the Fed cannot simply ignore these numbers.
3. NFP: The Job Market Refuses to Break
Now comes another interesting development.
The November 6 employment report showed:
- Nonfarm Payrolls: +165,000 jobs
- Unemployment Rate: 4.1%
- Average Hourly Earnings: +0.4% monthly
The US economy is still creating jobs.
Normally, that's good news.
But here's the problem for financial markets.
When employment remains resilient while inflation stays elevated, the Fed may feel it has more room to keep interest rates high or raise them further.
Good economic news can sometimes become bad news for risky assets!
4. Tonight's FOMC Minutes: What Are Officials Thinking?
The Federal Reserve will release its October meeting minutes today, November 18.
Release time:
🇺🇸 2:00 PM New York (EST)
🌍 7:00 PM UTC
🇵🇰 12:00 AM Pakistan (November 19)
At the October meeting, the Fed kept interest rates unchanged at 3.75%–4.00%.
But something important happened.
The decision passed 10–2.
Two policymakers, Lisa Cook and Beth Hammack, wanted an immediate 0.25% rate hike.
And since that meeting, fresh inflation and employment reports have strengthened concerns about inflation.
Remember, tonight's minutes describe the earlier October discussion, not a new rate decision.
5. How Likely Is Another Rate Hike?
Here's where things become really interesting.
According to CME FedWatch probabilities reported on November 18, traders were pricing approximately:
- 95% probability of a 0.25% hike in December
- 5% probability of a 0.50% hike
These are market expectations, not confirmed decisions.
The next actual Fed rate decision is scheduled for December 9.
And Fed Governor Christopher Waller has even raised the possibility of a larger half-point increase.
The big question isn't just whether rates rise.
It's whether the Fed becomes even more aggressive than markets already expect.
6. What Happens to Bitcoin Now?
I see three possible reactions.
🔴 Bearish scenario:
If the minutes reveal stronger support for aggressive hikes, the dollar and Treasury yields could rise.
That could pressure Bitcoin and trigger another round of liquidations.
🟢 Bullish scenario:
If the discussion sounds less aggressive than expected, traders may reduce their bets on future hikes.
Bitcoin could experience a relief rally.
🟡 Volatility trap:
My biggest concern is the first reaction.
Bitcoin could initially pump, sweep liquidity, and then reverse sharply. The opposite could also happen.
That's why I would avoid chasing the first candle after the release.
🐼 My Final Thoughts
The market already expects a December rate hike.
So simply confirming what's expected may not be enough to cause a major Bitcoin crash.
What matters is whether tonight's details change expectations for December and beyond.
Watch the dollar, Treasury yields, Bitcoin volume and how price reacts after the initial volatility.
Now I want to hear from you.
Do you think Bitcoin will DUMP after the FOMC minutes, or will we see a surprise relief rally?
Tell me your prediction before the release. 👇
$BTC $XAU #Bitcoin
#AnthropicIPOPriceCouldExceed$80 #NvidiaBeatsEstimatesWith$130BQ4Outlook #VisaPlansStablecoinPrefundingForAPACCrossBorderPayments
🚨BITCOIN ON HIGH ALERT: THE FED COULD SHAKE THE ENTIRE CRYPTO MARKET TONIGHT!🚨
Something interesting is happening in the US economy, and I think every Bitcoin investor needs to understand it before tonight's FOMC minutes.
Inflation is still causing trouble. The job market is holding up. And now, traders are preparing for another interest-rate hike.
But here's the real question.
Has Bitcoin already priced in the bad news, or is another surprise coming?
Let me explain everything in simple words.
1. CPI: Inflation Is Still a Problem
On November 10, the US released its October inflation report.
Here are the numbers:
- Headline CPI: +0.4% monthly
- Core CPI: +0.3% monthly
- Food prices: +0.5%
- Energy prices: +0.7%
Core inflation has now increased by 0.3% for three consecutive months.
That's important because the Federal Reserve wants inflation to return to its 2% target.
And when prices keep rising, cutting interest rates becomes much harder.
2. PPI: Another Warning Sign
On November 13, we received the Producer Price Index report.
- Monthly PPI: +0.3%
- Annual PPI: +6.5%
- Core PPI excluding food, energy and trade: +0.5% monthly
That 6.5% annual increase is particularly concerning.
It's the largest yearly PPI increase since November 2022.
Think about it this way.
When businesses face higher production costs, some of those costs can eventually reach consumers.
That's why the Fed cannot simply ignore these numbers.
3. NFP: The Job Market Refuses to Break
Now comes another interesting development.
The November 6 employment report showed:
- Nonfarm Payrolls: +165,000 jobs
- Unemployment Rate: 4.1%
- Average Hourly Earnings: +0.4% monthly
The US economy is still creating jobs.
Normally, that's good news.
But here's the problem for financial markets.
When employment remains resilient while inflation stays elevated, the Fed may feel it has more room to keep interest rates high or raise them further.
Good economic news can sometimes become bad news for risky assets!
4. Tonight's FOMC Minutes: What Are Officials Thinking?
The Federal Reserve will release its October meeting minutes today, November 18.
Release time:
🇺🇸 2:00 PM New York (EST)
🌍 7:00 PM UTC
🇵🇰 12:00 AM Pakistan (November 19)
At the October meeting, the Fed kept interest rates unchanged at 3.75%–4.00%.
But something important happened.
The decision passed 10–2.
Two policymakers, Lisa Cook and Beth Hammack, wanted an immediate 0.25% rate hike.
And since that meeting, fresh inflation and employment reports have strengthened concerns about inflation.
Remember, tonight's minutes describe the earlier October discussion, not a new rate decision.
5. How Likely Is Another Rate Hike?
Here's where things become really interesting.
According to CME FedWatch probabilities reported on November 18, traders were pricing approximately:
- 95% probability of a 0.25% hike in December
- 5% probability of a 0.50% hike
These are market expectations, not confirmed decisions.
The next actual Fed rate decision is scheduled for December 9.
And Fed Governor Christopher Waller has even raised the possibility of a larger half-point increase.
The big question isn't just whether rates rise.
It's whether the Fed becomes even more aggressive than markets already expect.
6. What Happens to Bitcoin Now?
I see three possible reactions.
🔴 Bearish scenario:
If the minutes reveal stronger support for aggressive hikes, the dollar and Treasury yields could rise.
That could pressure Bitcoin and trigger another round of liquidations.
🟢 Bullish scenario:
If the discussion sounds less aggressive than expected, traders may reduce their bets on future hikes.
Bitcoin could experience a relief rally.
🟡 Volatility trap:
My biggest concern is the first reaction.
Bitcoin could initially pump, sweep liquidity, and then reverse sharply. The opposite could also happen.
That's why I would avoid chasing the first candle after the release.
🐼 My Final Thoughts
The market already expects a December rate hike.
So simply confirming what's expected may not be enough to cause a major Bitcoin crash.
What matters is whether tonight's details change expectations for December and beyond.
Watch the dollar, Treasury yields, Bitcoin volume and how price reacts after the initial volatility.
Now I want to hear from you.
Do you think Bitcoin will DUMP after the FOMC minutes, or will we see a surprise relief rally?
Tell me your prediction before the release. 👇
$BTC $XAU #Bitcoin
#AnthropicIPOPriceCouldExceed$80 #NvidiaBeatsEstimatesWith$130BQ4Outlook #VisaPlansStablecoinPrefundingForAPACCrossBorderPayments
Inflation is still causing trouble. The job market is holding up. And now, traders are preparing for another interest-rate hike.
But here's the real question.
Has Bitcoin already priced in the bad news, or is another surprise coming?
Let me explain everything in simple words.
1. CPI: Inflation Is Still a Problem
On November 10, the US released its October inflation report.
Here are the numbers:
- Headline CPI: +0.4% monthly
- Core CPI: +0.3% monthly
- Food prices: +0.5%
- Energy prices: +0.7%
Core inflation has now increased by 0.3% for three consecutive months.
That's important because the Federal Reserve wants inflation to return to its 2% target.
And when prices keep rising, cutting interest rates becomes much harder.
2. PPI: Another Warning Sign
On November 13, we received the Producer Price Index report.
- Monthly PPI: +0.3%
- Annual PPI: +6.5%
- Core PPI excluding food, energy and trade: +0.5% monthly
That 6.5% annual increase is particularly concerning.
It's the largest yearly PPI increase since November 2022.
Think about it this way.
When businesses face higher production costs, some of those costs can eventually reach consumers.
That's why the Fed cannot simply ignore these numbers.
3. NFP: The Job Market Refuses to Break
Now comes another interesting development.
The November 6 employment report showed:
- Nonfarm Payrolls: +165,000 jobs
- Unemployment Rate: 4.1%
- Average Hourly Earnings: +0.4% monthly
The US economy is still creating jobs.
Normally, that's good news.
But here's the problem for financial markets.
When employment remains resilient while inflation stays elevated, the Fed may feel it has more room to keep interest rates high or raise them further.
Good economic news can sometimes become bad news for risky assets!
4. Tonight's FOMC Minutes: What Are Officials Thinking?
The Federal Reserve will release its October meeting minutes today, November 18.
Release time:
🇺🇸 2:00 PM New York (EST)
🌍 7:00 PM UTC
🇵🇰 12:00 AM Pakistan (November 19)
At the October meeting, the Fed kept interest rates unchanged at 3.75%–4.00%.
But something important happened.
The decision passed 10–2.
Two policymakers, Lisa Cook and Beth Hammack, wanted an immediate 0.25% rate hike.
And since that meeting, fresh inflation and employment reports have strengthened concerns about inflation.
Remember, tonight's minutes describe the earlier October discussion, not a new rate decision.
5. How Likely Is Another Rate Hike?
Here's where things become really interesting.
According to CME FedWatch probabilities reported on November 18, traders were pricing approximately:
- 95% probability of a 0.25% hike in December
- 5% probability of a 0.50% hike
These are market expectations, not confirmed decisions.
The next actual Fed rate decision is scheduled for December 9.
And Fed Governor Christopher Waller has even raised the possibility of a larger half-point increase.
The big question isn't just whether rates rise.
It's whether the Fed becomes even more aggressive than markets already expect.
6. What Happens to Bitcoin Now?
I see three possible reactions.
🔴 Bearish scenario:
If the minutes reveal stronger support for aggressive hikes, the dollar and Treasury yields could rise.
That could pressure Bitcoin and trigger another round of liquidations.
🟢 Bullish scenario:
If the discussion sounds less aggressive than expected, traders may reduce their bets on future hikes.
Bitcoin could experience a relief rally.
🟡 Volatility trap:
My biggest concern is the first reaction.
Bitcoin could initially pump, sweep liquidity, and then reverse sharply. The opposite could also happen.
That's why I would avoid chasing the first candle after the release.
🐼 My Final Thoughts
The market already expects a December rate hike.
So simply confirming what's expected may not be enough to cause a major Bitcoin crash.
What matters is whether tonight's details change expectations for December and beyond.
Watch the dollar, Treasury yields, Bitcoin volume and how price reacts after the initial volatility.
Now I want to hear from you.
Do you think Bitcoin will DUMP after the FOMC minutes, or will we see a surprise relief rally?
Tell me your prediction before the release. 👇
$BTC $XAU #Bitcoin
#AnthropicIPOPriceCouldExceed$80 #NvidiaBeatsEstimatesWith$130BQ4Outlook #VisaPlansStablecoinPrefundingForAPACCrossBorderPayments
Feed-Creator-08e4ff9a5:
Want to join your group but don't know the charges/fees. Can you kindly tell.
2
1
6
4.2k

Partly True
Article
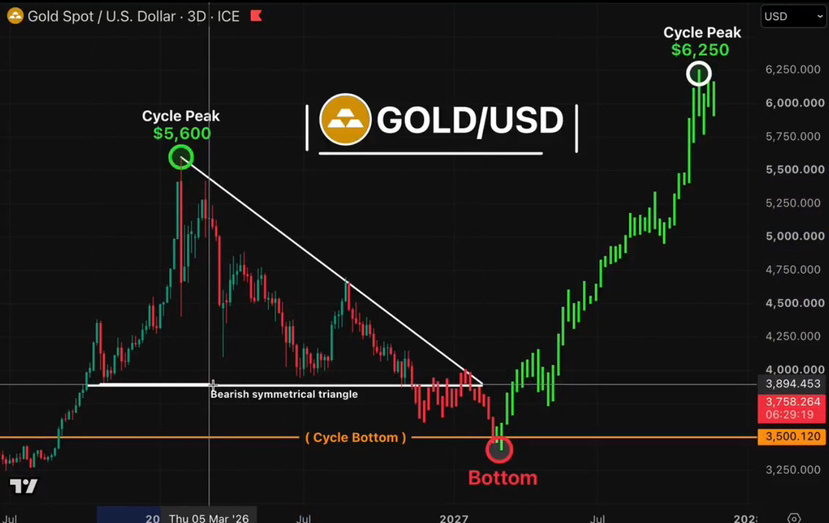
Gold Final Flush.🚨 WARNING: GOLD'S FINAL FLUSH IS LOADING
$5,600 → $3,759
A drop of roughly a third from the peak
And the last 7% is still ahead
Here's what the chart shows
Months inside a bearish symmetrical triangle. Lower highs. Dead bounces
Then the ~$3,900 floor cracked
Next stop: $3,500
That's my cycle bottom
Translation: the last dip-buyers get shaken out right before the real move starts
The bottom doesn't form on a price. It forms on a feeling
It's the day the loudest gold bulls go quiet
After that?
$3,500 → $6,250
A 79% run to the next cycle peak
Most people watch the price
I watch the fear
#NvidiaBeatsEstimatesWith$130BQ4Outlook #AnthropicIPOPriceCouldExceed$80 #RussianCentralBankPlansToAllowFundsToHoldCryptoIn2027 #VisaPlansStablecoinPrefundingForAPACCrossBorderPayments #CanadaAndUSLaunchOperationNiagaraAgainstApprovalPhishing
Gold Final Flush.
🚨 WARNING: GOLD'S FINAL FLUSH IS LOADING
$5,600 → $3,759
A drop of roughly a third from the peak
And the last 7% is still ahead
Here's what the chart shows
Months inside a bearish symmetrical triangle. Lower highs. Dead bounces
Then the ~$3,900 floor cracked
Next stop: $3,500
That's my cycle bottom
Translation: the last dip-buyers get shaken out right before the real move starts
The bottom doesn't form on a price. It forms on a feeling
It's the day the loudest gold bulls go quiet
After that?
$3,500 → $6,250
A 79% run to the next cycle peak
Most people watch the price
I watch the fear
#NvidiaBeatsEstimatesWith$130BQ4Outlook #AnthropicIPOPriceCouldExceed$80 #RussianCentralBankPlansToAllowFundsToHoldCryptoIn2027 #VisaPlansStablecoinPrefundingForAPACCrossBorderPayments #CanadaAndUSLaunchOperationNiagaraAgainstApprovalPhishing
$5,600 → $3,759
A drop of roughly a third from the peak
And the last 7% is still ahead
Here's what the chart shows
Months inside a bearish symmetrical triangle. Lower highs. Dead bounces
Then the ~$3,900 floor cracked
Next stop: $3,500
That's my cycle bottom
Translation: the last dip-buyers get shaken out right before the real move starts
The bottom doesn't form on a price. It forms on a feeling
It's the day the loudest gold bulls go quiet
After that?
$3,500 → $6,250
A 79% run to the next cycle peak
Most people watch the price
I watch the fear
#NvidiaBeatsEstimatesWith$130BQ4Outlook #AnthropicIPOPriceCouldExceed$80 #RussianCentralBankPlansToAllowFundsToHoldCryptoIn2027 #VisaPlansStablecoinPrefundingForAPACCrossBorderPayments #CanadaAndUSLaunchOperationNiagaraAgainstApprovalPhishing
623
Article
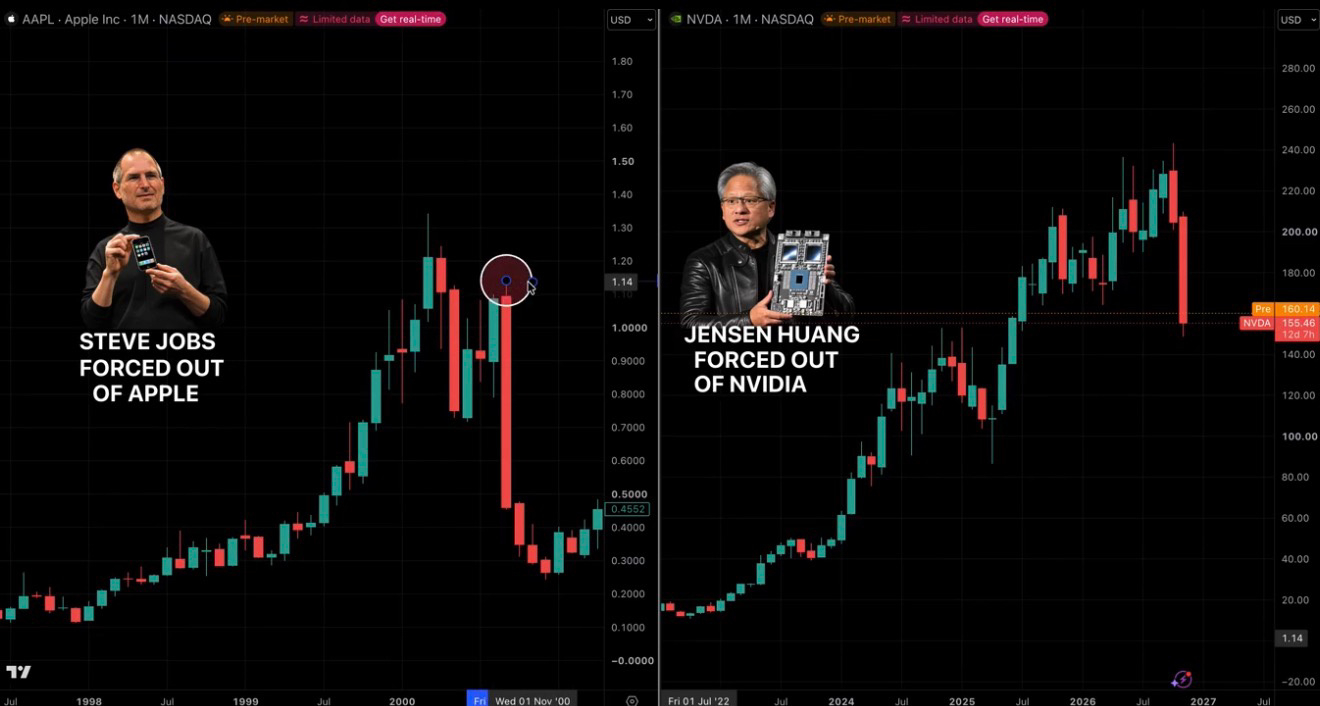
History Repeats But… THIS IS NOT NORMAL. HISTORY IS REPEATING.
NVIDIA’s board confirmed that Jensen Huang will NOT be reinstated as CEO.
And what happened to Apple 40 years ago suddenly looks VERY relevant.
The parallel is hard to ignore:
→ 1985: Steve Jobs was FORCED OUT of Apple.
→ Apple crashed 79%.
Now look at NVIDIA:
→ 2026: Jensen Huang LEAVES after 33 years.
→ NVIDIA has ALREADY crashed 35% from its highs.
But the CEO comparison isn’t even the most important part.
In 2000, investors were told the internet would change EVERYTHING.
They were right.
The internet changed the world.
And tech stocks still collapsed.
The technology was real.
THE VALUATIONS WERE THE BUBBLE.
Now AI is entering the same psychological phase.
Capital floods in.
Valuations detach.
Hype becomes endless.
And investors convince themselves the old rules no longer apply.
Then the man who BUILT NVIDIA leaves at the exact moment the market starts cracking.
I'm not saying another 75% collapse is guaranteed.
But the AI revolution being REAL does not mean AI stocks can’t CRASH.
The internet was real too.
That didn’t save investors in 2000.
Different revolution.
Same market psychology.
Save this tweet. Six months from now, this comparison may look a lot less crazy.
#NvidiaBeatsEstimatesWith$130BQ4Outlook #AnthropicIPOPriceCouldExceed$80 #RussiaCentralBankAddsAlfaBankToCryptoExchangeRegister #VisaPlansStablecoinPrefundingForAPACCrossBorderPayments #BankOfEnglandUnveilsClearingHousePathwayCoveringDLTFirms
History Repeats But…
THIS IS NOT NORMAL. HISTORY IS REPEATING.
NVIDIA’s board confirmed that Jensen Huang will NOT be reinstated as CEO.
And what happened to Apple 40 years ago suddenly looks VERY relevant.
The parallel is hard to ignore:
→ 1985: Steve Jobs was FORCED OUT of Apple.
→ Apple crashed 79%.
Now look at NVIDIA:
→ 2026: Jensen Huang LEAVES after 33 years.
→ NVIDIA has ALREADY crashed 35% from its highs.
But the CEO comparison isn’t even the most important part.
In 2000, investors were told the internet would change EVERYTHING.
They were right.
The internet changed the world.
And tech stocks still collapsed.
The technology was real.
THE VALUATIONS WERE THE BUBBLE.
Now AI is entering the same psychological phase.
Capital floods in.
Valuations detach.
Hype becomes endless.
And investors convince themselves the old rules no longer apply.
Then the man who BUILT NVIDIA leaves at the exact moment the market starts cracking.
I'm not saying another 75% collapse is guaranteed.
But the AI revolution being REAL does not mean AI stocks can’t CRASH.
The internet was real too.
That didn’t save investors in 2000.
Different revolution.
Same market psychology.
Save this tweet. Six months from now, this comparison may look a lot less crazy.
#NvidiaBeatsEstimatesWith$130BQ4Outlook #AnthropicIPOPriceCouldExceed$80 #RussiaCentralBankAddsAlfaBankToCryptoExchangeRegister #VisaPlansStablecoinPrefundingForAPACCrossBorderPayments #BankOfEnglandUnveilsClearingHousePathwayCoveringDLTFirms
NVIDIA’s board confirmed that Jensen Huang will NOT be reinstated as CEO.
And what happened to Apple 40 years ago suddenly looks VERY relevant.
The parallel is hard to ignore:
→ 1985: Steve Jobs was FORCED OUT of Apple.
→ Apple crashed 79%.
Now look at NVIDIA:
→ 2026: Jensen Huang LEAVES after 33 years.
→ NVIDIA has ALREADY crashed 35% from its highs.
But the CEO comparison isn’t even the most important part.
In 2000, investors were told the internet would change EVERYTHING.
They were right.
The internet changed the world.
And tech stocks still collapsed.
The technology was real.
THE VALUATIONS WERE THE BUBBLE.
Now AI is entering the same psychological phase.
Capital floods in.
Valuations detach.
Hype becomes endless.
And investors convince themselves the old rules no longer apply.
Then the man who BUILT NVIDIA leaves at the exact moment the market starts cracking.
I'm not saying another 75% collapse is guaranteed.
But the AI revolution being REAL does not mean AI stocks can’t CRASH.
The internet was real too.
That didn’t save investors in 2000.
Different revolution.
Same market psychology.
Save this tweet. Six months from now, this comparison may look a lot less crazy.
#NvidiaBeatsEstimatesWith$130BQ4Outlook #AnthropicIPOPriceCouldExceed$80 #RussiaCentralBankAddsAlfaBankToCryptoExchangeRegister #VisaPlansStablecoinPrefundingForAPACCrossBorderPayments #BankOfEnglandUnveilsClearingHousePathwayCoveringDLTFirms
419

·
--
Article
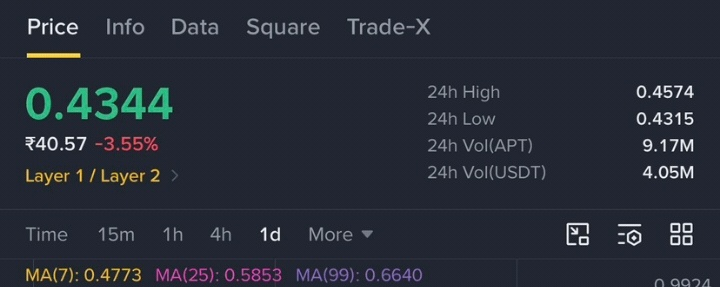
$APT$APT /USDT
1. $APT /USDT - Current Situation
Price in your screenshot: $0.4344
Live Price now: $0.4287 - down *-2.72%* in 24h
24h High: $0.4574
24h Low: $0.4220
24h Volume: 9.17M APT / $4.05M USDT on Binance - volume is low, which means buyers are not interested right now.
Market Cap: $396 Million
Rank: #86 - #94
Circulating Supply: 889M APT
Total Supply: 1.21B APT
Max Supply: 2.10B APT
That means only 42% supply is in market. 58% supply is still locked. This is a big risk for long term.
Performance:
5 Days: -18.77%
1 Month: -48.37%
6 Months: -53.19%
Year to Date: -76.65%
1 Year: -84.92%
From ATH $20.40 (Jan 2023): -97.6% down.
So APT is in one of its worst crashes ever. It has made a new All-Time Low on 14 Nov 2026.
2. Chart Analysis - Your Screenshot (1D Timeframe)
Your chart is 1D, and it is telling a very clear story.
A. The Top:
Price went up and made a top at $0.9655 around early October 2026.
After that, buyers failed, and sellers took full control.
B. The Downtrend:
From $0.9655 to $0.4283, price has fallen -55% in just 1.5 months without any big bounce.
In your screenshot, you can see a big red channel - price is falling inside that channel, making lower highs and lower lows. This is classic bearish downtrend.
Every time price tried to go up, it was rejected from MA.
C. Moving Averages - All Bearish:
MA(7): 0.4773
MA(25): 0.5853
MA(99): 0.6640
Price $0.43 is below all 3 MAs. And MA7 is below MA25, MA25 is below MA99. This is called Death Cross alignment. It means sellers are strong in short, mid and long term.
Price needs to close above MA7 ($0.4773) first to show any strength.
*D. RSI / Momentum:
RSI is around 25-28 on 1D. This is oversold zone.
Oversold does NOT mean buy immediately. It means price has fallen too fast, so a small bounce can come, but trend can stay oversold for many days.
E. Volume:
When price was falling from $0.96, volume was high. Now when price is near $0.43, volume is decreasing. This means sellers are tired, but buyers are also not coming. Market is in fear
3. Key Support and Resistance Levels
This is the most important part.
Support Levels (Neeche):
Support Price Importance
S1 - Immediate Support $0.4347 Price is sitting on this right now. If it breaks, next fall starts
S2 - Strong Support $0.4228 This is the All-Time Low area. Last defence
**S3 - Breakdown Target $0.350 - $0.340** If $0.4228 breaks with daily close, price can go here
S4 - Worst Case $0.3088 Year-end bearish prediction
*Resistance Levels (Upar):
Resistance Price Importance
R1 - First Resistance $0.465 1D pivot, small bounce target
R2 - MA7 Resistance $0.4773 Need to break this to stop downtrend
R3 - Strong Resistance $0.5196 Old support, now resistance
R4 - Major Resistance $0.6120 If price closes above this, then trend changes
R5 - Range Top $0.9655 - $1.00 Full recovery only above $1.00
Simple Rule:
Above $0.4650 = short bounce to $0.48 - $0.52
-Below $0.4228 = big fall to $0.35 - $0.30
Above $0.6120= trend reversal start
Above $1.00= real bull run
4. Fundamental Analysis - Why is APT Falling?
1. Token Unlocks:
Aptos has monthly unlocks. Even though on 11 Oct 2026, annual unlocks decreased by 60%, still new tokens are coming into market every month, creating selling pressure.
2. Whole Market Down:
BTC and whole altcoin market is down. When BTC falls, Layer-1 coins like APT fall 2x more.
3. No New Hype:
Aptos is a Layer-1 blockchain using Move language. It is fast and secure, but it has not got new big hype like Solana or Sui. Users are not growing fast.
4. Investors Selling:
Early investors who bought at $1 - $5 are now selling at loss to cut loss. That is why price keeps falling.
Positive Point:Aptos team is still working. They did a big protocol upgrade in Q4 2026 to improve tokenomics. If market recovers, APT can bounce fast because it is oversold.
5. 3 Possible Scenarios for Next Days
Scenario 1 - Bounce (40% Chance)
Price holds $0.4228, RSI oversold bounce comes.
Price goes to $0.4650 -> $0.4868.
This will be a selling opportunity, not a trend change.
Scenario 2 - Sideways (35% Chance)
Price moves between $0.4228 - $0.4650 for few days, makes base.
Then it will decide next direction.
Scenario 3 - Breakdown (25% Chance)
Price closes daily below $0.4228.
Then next target $0.35, then $0.3088.
This will be very bearish.
6. What Should You Do? - Strategy
If You Are Holding APT in Loss:
1. Do NOT panic sell at bottom. Price is near ATL, panic selling is worst.
2. Do NOT buy more in full amount at once. Use DCA - buy small-small.
3. Example DCA: Buy 25% at $0.43, 25% at $0.38, 25% at $0.34, 25% at $0.30.
4. Keep stop-loss: If you are a trader, stop-loss below $0.42 daily close.
5. If you are long-term holder, hold only that amount which you can afford to lose.
If You Want to Buy Fresh:
1. Wait for daily close above $0.4650 for safe entry. Target $0.51, Stop-loss $0.42.
2. Risky entry: Buy now at $0.43, but keep stop-loss at $0.4150. Target $0.48.
3. Do NOT use leverage in this market. Leverage will liquidate you in this volatility.
If You Want to Short:
Do NOT short at bottom. Price is already oversold. Short only if price goes to $0.48 - $0.51 and rejects from there.
7. Long Term Prediction (Not Guarantee)
According to different models:
End 2026: $0.3088 - $0.5604
End 2027: $0.2694 - $0.8562
End 2030: $0.2024 - $1.93
If APT recovers above $1.00 with volume, next target is $2.05.
Final Summary in 1 Line:
> APT is in strong downtrend, sitting on its last support $0.4228. Hold with patience, don't panic, and don't buy with leverage. Wait for $0.4650 breakout for confirmation
Tell me:
1. Aap ne APT kis price pe buy kiya hai
#VisaPlansStablecoinPrefundingForAPACCrossBorderPayments
2. Kitna amount lagaya hai.
3. Hold karna hai ya trade karna hai.
#NvidiaBeatsEstimatesWith$130BQ4Outlook #RussianCentralBankPlansToAllowFundsToHoldCryptoIn2027
$APT
$APT /USDT
1. $APT /USDT - Current Situation
Price in your screenshot: $0.4344
Live Price now: $0.4287 - down *-2.72%* in 24h
24h High: $0.4574
24h Low: $0.4220
24h Volume: 9.17M APT / $4.05M USDT on Binance - volume is low, which means buyers are not interested right now.
Market Cap: $396 Million
Rank: #86 - #94
Circulating Supply: 889M APT
Total Supply: 1.21B APT
Max Supply: 2.10B APT
That means only 42% supply is in market. 58% supply is still locked. This is a big risk for long term.
Performance:
5 Days: -18.77%
1 Month: -48.37%
6 Months: -53.19%
Year to Date: -76.65%
1 Year: -84.92%
From ATH $20.40 (Jan 2023): -97.6% down.
So APT is in one of its worst crashes ever. It has made a new All-Time Low on 14 Nov 2026.
2. Chart Analysis - Your Screenshot (1D Timeframe)
Your chart is 1D, and it is telling a very clear story.
A. The Top:
Price went up and made a top at $0.9655 around early October 2026.
After that, buyers failed, and sellers took full control.
B. The Downtrend:
From $0.9655 to $0.4283, price has fallen -55% in just 1.5 months without any big bounce.
In your screenshot, you can see a big red channel - price is falling inside that channel, making lower highs and lower lows. This is classic bearish downtrend.
Every time price tried to go up, it was rejected from MA.
C. Moving Averages - All Bearish:
MA(7): 0.4773
MA(25): 0.5853
MA(99): 0.6640
Price $0.43 is below all 3 MAs. And MA7 is below MA25, MA25 is below MA99. This is called Death Cross alignment. It means sellers are strong in short, mid and long term.
Price needs to close above MA7 ($0.4773) first to show any strength.
*D. RSI / Momentum:
RSI is around 25-28 on 1D. This is oversold zone.
Oversold does NOT mean buy immediately. It means price has fallen too fast, so a small bounce can come, but trend can stay oversold for many days.
E. Volume:
When price was falling from $0.96, volume was high. Now when price is near $0.43, volume is decreasing. This means sellers are tired, but buyers are also not coming. Market is in fear
3. Key Support and Resistance Levels
This is the most important part.
Support Levels (Neeche):
Support Price Importance
S1 - Immediate Support $0.4347 Price is sitting on this right now. If it breaks, next fall starts
S2 - Strong Support $0.4228 This is the All-Time Low area. Last defence
**S3 - Breakdown Target $0.350 - $0.340** If $0.4228 breaks with daily close, price can go here
S4 - Worst Case $0.3088 Year-end bearish prediction
*Resistance Levels (Upar):
Resistance Price Importance
R1 - First Resistance $0.465 1D pivot, small bounce target
R2 - MA7 Resistance $0.4773 Need to break this to stop downtrend
R3 - Strong Resistance $0.5196 Old support, now resistance
R4 - Major Resistance $0.6120 If price closes above this, then trend changes
R5 - Range Top $0.9655 - $1.00 Full recovery only above $1.00
Simple Rule:
Above $0.4650 = short bounce to $0.48 - $0.52
-Below $0.4228 = big fall to $0.35 - $0.30
Above $0.6120= trend reversal start
Above $1.00= real bull run
4. Fundamental Analysis - Why is APT Falling?
1. Token Unlocks:
Aptos has monthly unlocks. Even though on 11 Oct 2026, annual unlocks decreased by 60%, still new tokens are coming into market every month, creating selling pressure.
2. Whole Market Down:
BTC and whole altcoin market is down. When BTC falls, Layer-1 coins like APT fall 2x more.
3. No New Hype:
Aptos is a Layer-1 blockchain using Move language. It is fast and secure, but it has not got new big hype like Solana or Sui. Users are not growing fast.
4. Investors Selling:
Early investors who bought at $1 - $5 are now selling at loss to cut loss. That is why price keeps falling.
Positive Point:Aptos team is still working. They did a big protocol upgrade in Q4 2026 to improve tokenomics. If market recovers, APT can bounce fast because it is oversold.
5. 3 Possible Scenarios for Next Days
Scenario 1 - Bounce (40% Chance)
Price holds $0.4228, RSI oversold bounce comes.
Price goes to $0.4650 -> $0.4868.
This will be a selling opportunity, not a trend change.
Scenario 2 - Sideways (35% Chance)
Price moves between $0.4228 - $0.4650 for few days, makes base.
Then it will decide next direction.
Scenario 3 - Breakdown (25% Chance)
Price closes daily below $0.4228.
Then next target $0.35, then $0.3088.
This will be very bearish.
6. What Should You Do? - Strategy
If You Are Holding APT in Loss:
1. Do NOT panic sell at bottom. Price is near ATL, panic selling is worst.
2. Do NOT buy more in full amount at once. Use DCA - buy small-small.
3. Example DCA: Buy 25% at $0.43, 25% at $0.38, 25% at $0.34, 25% at $0.30.
4. Keep stop-loss: If you are a trader, stop-loss below $0.42 daily close.
5. If you are long-term holder, hold only that amount which you can afford to lose.
If You Want to Buy Fresh:
1. Wait for daily close above $0.4650 for safe entry. Target $0.51, Stop-loss $0.42.
2. Risky entry: Buy now at $0.43, but keep stop-loss at $0.4150. Target $0.48.
3. Do NOT use leverage in this market. Leverage will liquidate you in this volatility.
If You Want to Short:
Do NOT short at bottom. Price is already oversold. Short only if price goes to $0.48 - $0.51 and rejects from there.
7. Long Term Prediction (Not Guarantee)
According to different models:
End 2026: $0.3088 - $0.5604
End 2027: $0.2694 - $0.8562
End 2030: $0.2024 - $1.93
If APT recovers above $1.00 with volume, next target is $2.05.
Final Summary in 1 Line:
> APT is in strong downtrend, sitting on its last support $0.4228. Hold with patience, don't panic, and don't buy with leverage. Wait for $0.4650 breakout for confirmation
Tell me:
1. Aap ne APT kis price pe buy kiya hai
#VisaPlansStablecoinPrefundingForAPACCrossBorderPayments
2. Kitna amount lagaya hai.
3. Hold karna hai ya trade karna hai.
#NvidiaBeatsEstimatesWith$130BQ4Outlook #RussianCentralBankPlansToAllowFundsToHoldCryptoIn2027
1. $APT /USDT - Current Situation
Price in your screenshot: $0.4344
Live Price now: $0.4287 - down *-2.72%* in 24h
24h High: $0.4574
24h Low: $0.4220
24h Volume: 9.17M APT / $4.05M USDT on Binance - volume is low, which means buyers are not interested right now.
Market Cap: $396 Million
Rank: #86 - #94
Circulating Supply: 889M APT
Total Supply: 1.21B APT
Max Supply: 2.10B APT
That means only 42% supply is in market. 58% supply is still locked. This is a big risk for long term.
Performance:
5 Days: -18.77%
1 Month: -48.37%
6 Months: -53.19%
Year to Date: -76.65%
1 Year: -84.92%
From ATH $20.40 (Jan 2023): -97.6% down.
So APT is in one of its worst crashes ever. It has made a new All-Time Low on 14 Nov 2026.
2. Chart Analysis - Your Screenshot (1D Timeframe)
Your chart is 1D, and it is telling a very clear story.
A. The Top:
Price went up and made a top at $0.9655 around early October 2026.
After that, buyers failed, and sellers took full control.
B. The Downtrend:
From $0.9655 to $0.4283, price has fallen -55% in just 1.5 months without any big bounce.
In your screenshot, you can see a big red channel - price is falling inside that channel, making lower highs and lower lows. This is classic bearish downtrend.
Every time price tried to go up, it was rejected from MA.
C. Moving Averages - All Bearish:
MA(7): 0.4773
MA(25): 0.5853
MA(99): 0.6640
Price $0.43 is below all 3 MAs. And MA7 is below MA25, MA25 is below MA99. This is called Death Cross alignment. It means sellers are strong in short, mid and long term.
Price needs to close above MA7 ($0.4773) first to show any strength.
*D. RSI / Momentum:
RSI is around 25-28 on 1D. This is oversold zone.
Oversold does NOT mean buy immediately. It means price has fallen too fast, so a small bounce can come, but trend can stay oversold for many days.
E. Volume:
When price was falling from $0.96, volume was high. Now when price is near $0.43, volume is decreasing. This means sellers are tired, but buyers are also not coming. Market is in fear
3. Key Support and Resistance Levels
This is the most important part.
Support Levels (Neeche):
Support Price Importance
S1 - Immediate Support $0.4347 Price is sitting on this right now. If it breaks, next fall starts
S2 - Strong Support $0.4228 This is the All-Time Low area. Last defence
**S3 - Breakdown Target $0.350 - $0.340** If $0.4228 breaks with daily close, price can go here
S4 - Worst Case $0.3088 Year-end bearish prediction
*Resistance Levels (Upar):
Resistance Price Importance
R1 - First Resistance $0.465 1D pivot, small bounce target
R2 - MA7 Resistance $0.4773 Need to break this to stop downtrend
R3 - Strong Resistance $0.5196 Old support, now resistance
R4 - Major Resistance $0.6120 If price closes above this, then trend changes
R5 - Range Top $0.9655 - $1.00 Full recovery only above $1.00
Simple Rule:
Above $0.4650 = short bounce to $0.48 - $0.52
-Below $0.4228 = big fall to $0.35 - $0.30
Above $0.6120= trend reversal start
Above $1.00= real bull run
4. Fundamental Analysis - Why is APT Falling?
1. Token Unlocks:
Aptos has monthly unlocks. Even though on 11 Oct 2026, annual unlocks decreased by 60%, still new tokens are coming into market every month, creating selling pressure.
2. Whole Market Down:
BTC and whole altcoin market is down. When BTC falls, Layer-1 coins like APT fall 2x more.
3. No New Hype:
Aptos is a Layer-1 blockchain using Move language. It is fast and secure, but it has not got new big hype like Solana or Sui. Users are not growing fast.
4. Investors Selling:
Early investors who bought at $1 - $5 are now selling at loss to cut loss. That is why price keeps falling.
Positive Point:Aptos team is still working. They did a big protocol upgrade in Q4 2026 to improve tokenomics. If market recovers, APT can bounce fast because it is oversold.
5. 3 Possible Scenarios for Next Days
Scenario 1 - Bounce (40% Chance)
Price holds $0.4228, RSI oversold bounce comes.
Price goes to $0.4650 -> $0.4868.
This will be a selling opportunity, not a trend change.
Scenario 2 - Sideways (35% Chance)
Price moves between $0.4228 - $0.4650 for few days, makes base.
Then it will decide next direction.
Scenario 3 - Breakdown (25% Chance)
Price closes daily below $0.4228.
Then next target $0.35, then $0.3088.
This will be very bearish.
6. What Should You Do? - Strategy
If You Are Holding APT in Loss:
1. Do NOT panic sell at bottom. Price is near ATL, panic selling is worst.
2. Do NOT buy more in full amount at once. Use DCA - buy small-small.
3. Example DCA: Buy 25% at $0.43, 25% at $0.38, 25% at $0.34, 25% at $0.30.
4. Keep stop-loss: If you are a trader, stop-loss below $0.42 daily close.
5. If you are long-term holder, hold only that amount which you can afford to lose.
If You Want to Buy Fresh:
1. Wait for daily close above $0.4650 for safe entry. Target $0.51, Stop-loss $0.42.
2. Risky entry: Buy now at $0.43, but keep stop-loss at $0.4150. Target $0.48.
3. Do NOT use leverage in this market. Leverage will liquidate you in this volatility.
If You Want to Short:
Do NOT short at bottom. Price is already oversold. Short only if price goes to $0.48 - $0.51 and rejects from there.
7. Long Term Prediction (Not Guarantee)
According to different models:
End 2026: $0.3088 - $0.5604
End 2027: $0.2694 - $0.8562
End 2030: $0.2024 - $1.93
If APT recovers above $1.00 with volume, next target is $2.05.
Final Summary in 1 Line:
> APT is in strong downtrend, sitting on its last support $0.4228. Hold with patience, don't panic, and don't buy with leverage. Wait for $0.4650 breakout for confirmation
Tell me:
1. Aap ne APT kis price pe buy kiya hai
#VisaPlansStablecoinPrefundingForAPACCrossBorderPayments
2. Kitna amount lagaya hai.
3. Hold karna hai ya trade karna hai.
#NvidiaBeatsEstimatesWith$130BQ4Outlook #RussianCentralBankPlansToAllowFundsToHoldCryptoIn2027
Mikhail_777:
Неплохо расписал сеасибо 🤟🏽 или это ИИ))
1
2
231
BREAKING: Jim Cramer declares Nvidia’s next CEO “can be great,” even if they’re no Jensen Huang.
#NvidiaBeatsEstimatesWith$130BQ4Outlook #AnthropicIPOPriceCouldExceed$80 #RussiaCentralBankAddsAlfaBankToCryptoExchangeRegister #RussianCentralBankPlansToAllowFundsToHoldCryptoIn2027 #VisaPlansStablecoinPrefundingForAPACCrossBorderPayments
BREAKING: Jim Cramer declares Nvidia’s next CEO “can be great,” even if they’re no Jensen Huang.
#NvidiaBeatsEstimatesWith$130BQ4Outlook #AnthropicIPOPriceCouldExceed$80 #RussiaCentralBankAddsAlfaBankToCryptoExchangeRegister #RussianCentralBankPlansToAllowFundsToHoldCryptoIn2027 #VisaPlansStablecoinPrefundingForAPACCrossBorderPayments
#NvidiaBeatsEstimatesWith$130BQ4Outlook #AnthropicIPOPriceCouldExceed$80 #RussiaCentralBankAddsAlfaBankToCryptoExchangeRegister #RussianCentralBankPlansToAllowFundsToHoldCryptoIn2027 #VisaPlansStablecoinPrefundingForAPACCrossBorderPayments


322
The most important detail on this cover;
Gematria SECRET CODE : √, Σ, π : 1338
The list of those who will be coded 1338..
Finally;
Revelation 13:11(38)
Then I saw another beast coming up out of the earth. It had two horns like a lamb and spoke like a dragon.
#NvidiaBeatsEstimatesWith$130BQ4Outlook #AnthropicIPOPriceCouldExceed$80 #RussiaCentralBankAddsAlfaBankToCryptoExchangeRegister #RussianCentralBankPlansToAllowFundsToHoldCryptoIn2027 #VisaPlansStablecoinPrefundingForAPACCrossBorderPayments
The most important detail on this cover;
Gematria SECRET CODE : √, Σ, π : 1338
The list of those who will be coded 1338..
Finally;
Revelation 13:11(38)
Then I saw another beast coming up out of the earth. It had two horns like a lamb and spoke like a dragon.
#NvidiaBeatsEstimatesWith$130BQ4Outlook #AnthropicIPOPriceCouldExceed$80 #RussiaCentralBankAddsAlfaBankToCryptoExchangeRegister #RussianCentralBankPlansToAllowFundsToHoldCryptoIn2027 #VisaPlansStablecoinPrefundingForAPACCrossBorderPayments
Gematria SECRET CODE : √, Σ, π : 1338
The list of those who will be coded 1338..
Finally;
Revelation 13:11(38)
Then I saw another beast coming up out of the earth. It had two horns like a lamb and spoke like a dragon.
#NvidiaBeatsEstimatesWith$130BQ4Outlook #AnthropicIPOPriceCouldExceed$80 #RussiaCentralBankAddsAlfaBankToCryptoExchangeRegister #RussianCentralBankPlansToAllowFundsToHoldCryptoIn2027 #VisaPlansStablecoinPrefundingForAPACCrossBorderPayments


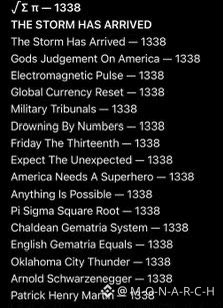
61

·
--
Bearish
$BTC
{future}(BTCUSDT)
🚨Global stablecoin supply has fallen by about $16 billion in 30 days, according to Nansen, as Bitcoin has touched a four-month low and Bitget Wallet has recorded steadier balances in emerging markets.#VisaPlansStablecoinPrefundingForAPACCrossBorderPayments
$BTC
🚨Global stablecoin supply has fallen by about $16 billion in 30 days, according to Nansen, as Bitcoin has touched a four-month low and Bitget Wallet has recorded steadier balances in emerging markets.#VisaPlansStablecoinPrefundingForAPACCrossBorderPayments
🚨Global stablecoin supply has fallen by about $16 billion in 30 days, according to Nansen, as Bitcoin has touched a four-month low and Bitget Wallet has recorded steadier balances in emerging markets.#VisaPlansStablecoinPrefundingForAPACCrossBorderPayments

46

·
--

Article
🌍 THE NEXT FINANCIAL REVOLUTION: DBS, CIRCLE & NVIDIA SIGNAL A NEW ERA FOR DIGITAL FINANCE
The glo🌍 THE NEXT FINANCIAL REVOLUTION: DBS, CIRCLE & NVIDIA SIGNAL A NEW ERA FOR DIGITAL FINANCE
The global financial landscape is entering a new phase as traditional banking, blockchain technology and artificial intelligence move closer together. Two major developments on November 18 deserve serious attention from crypto investors.
🔵 1. DBS & Circle: Stablecoins Enter Traditional Banking
Singapore-based DBS and Circle have announced a partnership to expand institutional access to USDC across Asia.
Under this arrangement, eligible institutional clients will be able to mint and redeem USDC directly through DBS, with 24/7 USD-USDC settlement.
This is an important development because it connects regulated banking infrastructure with blockchain-based payments.
The partnership also highlights growing institutional interest in tokenized money. According to DBS, 88% of large corporations surveyed are already deploying or piloting tokenized-money use cases.
The message is clear: stablecoins are increasingly becoming part of the global financial infrastructure.
🟢 2. NVIDIA: AI Demand Continues to Accelerate
NVIDIA has delivered another powerful financial performance.
The company reported third-quarter fiscal 2027 revenue of $115.8 billion, representing 103% year-over-year growth.
Its Data Center business generated $107.6 billion, up 110% from a year earlier.
Even more significant is its fourth-quarter revenue outlook of approximately $130 billion.
These figures demonstrate how strongly demand for AI computing infrastructure continues to grow.
🟡 3. What Does This Mean for Crypto?
These developments represent two important forces shaping the digital economy.
• Stablecoins are strengthening the connection between traditional finance and blockchain.
• AI infrastructure is attracting enormous investment and creating new opportunities across technology markets.
For Bitcoin, Ethereum and other major digital assets, institutional adoption remains an important long-term development. However, stronger financial infrastructure does not automatically mean immediate price increases.
🔴 My Market Perspective
The crypto market is currently facing extreme fear, with the Fear & Greed Index at 12. Short-term price pressure remains a serious concern.
Nevertheless, the expansion of institutional stablecoin access and accelerating AI investment show that the broader digital economy continues to develop.
The future of finance will not be shaped by one technology alone. It will be built through the convergence of banking, blockchain and artificial intelligence.
What do you believe will have the greatest impact on crypto adoption: Stablecoins or AI?
❤️ Like | 🔄 Share | ➕ Follow for more independent market analysis.
#Crypto #USDC #NVIDIA #Blockchain #Binance
#NvidiaBeatsEstimatesWith$130BQ4Outlook #CanNvidia’sDataCenterGrowthContinue?
#BankOfEnglandUnveilsClearingHousePathwayCoveringDLTFirms #CanadaAndUSLaunchOperationNiagaraAgainstApprovalPhishing #VisaPlansStablecoinPrefundingForAPACCrossBorderPayments
{spot}(BTCUSDT)
{spot}(NVDABUSDT)
🌍 THE NEXT FINANCIAL REVOLUTION: DBS, CIRCLE & NVIDIA SIGNAL A NEW ERA FOR DIGITAL FINANCE The glo
🌍 THE NEXT FINANCIAL REVOLUTION: DBS, CIRCLE & NVIDIA SIGNAL A NEW ERA FOR DIGITAL FINANCE
The global financial landscape is entering a new phase as traditional banking, blockchain technology and artificial intelligence move closer together. Two major developments on November 18 deserve serious attention from crypto investors.
🔵 1. DBS & Circle: Stablecoins Enter Traditional Banking
Singapore-based DBS and Circle have announced a partnership to expand institutional access to USDC across Asia.
Under this arrangement, eligible institutional clients will be able to mint and redeem USDC directly through DBS, with 24/7 USD-USDC settlement.
This is an important development because it connects regulated banking infrastructure with blockchain-based payments.
The partnership also highlights growing institutional interest in tokenized money. According to DBS, 88% of large corporations surveyed are already deploying or piloting tokenized-money use cases.
The message is clear: stablecoins are increasingly becoming part of the global financial infrastructure.
🟢 2. NVIDIA: AI Demand Continues to Accelerate
NVIDIA has delivered another powerful financial performance.
The company reported third-quarter fiscal 2027 revenue of $115.8 billion, representing 103% year-over-year growth.
Its Data Center business generated $107.6 billion, up 110% from a year earlier.
Even more significant is its fourth-quarter revenue outlook of approximately $130 billion.
These figures demonstrate how strongly demand for AI computing infrastructure continues to grow.
🟡 3. What Does This Mean for Crypto?
These developments represent two important forces shaping the digital economy.
• Stablecoins are strengthening the connection between traditional finance and blockchain.
• AI infrastructure is attracting enormous investment and creating new opportunities across technology markets.
For Bitcoin, Ethereum and other major digital assets, institutional adoption remains an important long-term development. However, stronger financial infrastructure does not automatically mean immediate price increases.
🔴 My Market Perspective
The crypto market is currently facing extreme fear, with the Fear & Greed Index at 12. Short-term price pressure remains a serious concern.
Nevertheless, the expansion of institutional stablecoin access and accelerating AI investment show that the broader digital economy continues to develop.
The future of finance will not be shaped by one technology alone. It will be built through the convergence of banking, blockchain and artificial intelligence.
What do you believe will have the greatest impact on crypto adoption: Stablecoins or AI?
❤️ Like | 🔄 Share | ➕ Follow for more independent market analysis.
#Crypto #USDC #NVIDIA #Blockchain #Binance
#NvidiaBeatsEstimatesWith$130BQ4Outlook #CanNvidia’sDataCenterGrowthContinue?
#BankOfEnglandUnveilsClearingHousePathwayCoveringDLTFirms #CanadaAndUSLaunchOperationNiagaraAgainstApprovalPhishing #VisaPlansStablecoinPrefundingForAPACCrossBorderPayments
The global financial landscape is entering a new phase as traditional banking, blockchain technology and artificial intelligence move closer together. Two major developments on November 18 deserve serious attention from crypto investors.
🔵 1. DBS & Circle: Stablecoins Enter Traditional Banking
Singapore-based DBS and Circle have announced a partnership to expand institutional access to USDC across Asia.
Under this arrangement, eligible institutional clients will be able to mint and redeem USDC directly through DBS, with 24/7 USD-USDC settlement.
This is an important development because it connects regulated banking infrastructure with blockchain-based payments.
The partnership also highlights growing institutional interest in tokenized money. According to DBS, 88% of large corporations surveyed are already deploying or piloting tokenized-money use cases.
The message is clear: stablecoins are increasingly becoming part of the global financial infrastructure.
🟢 2. NVIDIA: AI Demand Continues to Accelerate
NVIDIA has delivered another powerful financial performance.
The company reported third-quarter fiscal 2027 revenue of $115.8 billion, representing 103% year-over-year growth.
Its Data Center business generated $107.6 billion, up 110% from a year earlier.
Even more significant is its fourth-quarter revenue outlook of approximately $130 billion.
These figures demonstrate how strongly demand for AI computing infrastructure continues to grow.
🟡 3. What Does This Mean for Crypto?
These developments represent two important forces shaping the digital economy.
• Stablecoins are strengthening the connection between traditional finance and blockchain.
• AI infrastructure is attracting enormous investment and creating new opportunities across technology markets.
For Bitcoin, Ethereum and other major digital assets, institutional adoption remains an important long-term development. However, stronger financial infrastructure does not automatically mean immediate price increases.
🔴 My Market Perspective
The crypto market is currently facing extreme fear, with the Fear & Greed Index at 12. Short-term price pressure remains a serious concern.
Nevertheless, the expansion of institutional stablecoin access and accelerating AI investment show that the broader digital economy continues to develop.
The future of finance will not be shaped by one technology alone. It will be built through the convergence of banking, blockchain and artificial intelligence.
What do you believe will have the greatest impact on crypto adoption: Stablecoins or AI?
❤️ Like | 🔄 Share | ➕ Follow for more independent market analysis.
#Crypto #USDC #NVIDIA #Blockchain #Binance
#NvidiaBeatsEstimatesWith$130BQ4Outlook #CanNvidia’sDataCenterGrowthContinue?
#BankOfEnglandUnveilsClearingHousePathwayCoveringDLTFirms #CanadaAndUSLaunchOperationNiagaraAgainstApprovalPhishing #VisaPlansStablecoinPrefundingForAPACCrossBorderPayments
96

$AMZNB Current Price: ~$63,000 – $64,000
Bullet Market Sentiment: Bearish / Short-Term Correction
Bullet Key Support: $60,000 – $63,000
Bullet Key Resistance: $66,000 – $69,000
Short-Term Technical Analysis
Bitcoin has faced sustained downward pressure, retreating roughly 22% over the trailing month as macro pressures, potential Federal Reserve rate hike concerns, and consecutive weeks of spot ETF outflows weigh heavily on market liquidity.
Bullet Momentum & Indicators: Technical oscillators (such as the 14-day RSI hovering near 30) suggest the asset is testing oversold territory. Moving averages across daily timeframes maintain a cautious "Strong Sell" bias.
Bullet Outlook: While low RSI values can sometimes spark a relief bounce or consolidation phase, a decisive breakdown below the immediate $60,000 support psychological floor could trigger extended downside. Bulls need to recapture the $66,000 mark to reverse the current short-term downtrend.
{spot}(AMZNBUSDT)
#NvidiaBeatsEstimatesWith$130BQ4Outlook #AnthropicIPOPriceCouldExceed$80 #RussiaCentralBankAddsAlfaBankToCryptoExchangeRegister #VisaPlansStablecoinPrefundingForAPACCrossBorderPayments $#RussianCentralBankPlansToAllowFundsToHoldCryptoIn2027
$AMZNB Current Price: ~$63,000 – $64,000
Bullet Market Sentiment: Bearish / Short-Term Correction
Bullet Key Support: $60,000 – $63,000
Bullet Key Resistance: $66,000 – $69,000
Short-Term Technical Analysis
Bitcoin has faced sustained downward pressure, retreating roughly 22% over the trailing month as macro pressures, potential Federal Reserve rate hike concerns, and consecutive weeks of spot ETF outflows weigh heavily on market liquidity.
Bullet Momentum & Indicators: Technical oscillators (such as the 14-day RSI hovering near 30) suggest the asset is testing oversold territory. Moving averages across daily timeframes maintain a cautious "Strong Sell" bias.
Bullet Outlook: While low RSI values can sometimes spark a relief bounce or consolidation phase, a decisive breakdown below the immediate $60,000 support psychological floor could trigger extended downside. Bulls need to recapture the $66,000 mark to reverse the current short-term downtrend.
#NvidiaBeatsEstimatesWith$130BQ4Outlook #AnthropicIPOPriceCouldExceed$80 #RussiaCentralBankAddsAlfaBankToCryptoExchangeRegister #VisaPlansStablecoinPrefundingForAPACCrossBorderPayments $#RussianCentralBankPlansToAllowFundsToHoldCryptoIn2027
Bullet Market Sentiment: Bearish / Short-Term Correction
Bullet Key Support: $60,000 – $63,000
Bullet Key Resistance: $66,000 – $69,000
Short-Term Technical Analysis
Bitcoin has faced sustained downward pressure, retreating roughly 22% over the trailing month as macro pressures, potential Federal Reserve rate hike concerns, and consecutive weeks of spot ETF outflows weigh heavily on market liquidity.
Bullet Momentum & Indicators: Technical oscillators (such as the 14-day RSI hovering near 30) suggest the asset is testing oversold territory. Moving averages across daily timeframes maintain a cautious "Strong Sell" bias.
Bullet Outlook: While low RSI values can sometimes spark a relief bounce or consolidation phase, a decisive breakdown below the immediate $60,000 support psychological floor could trigger extended downside. Bulls need to recapture the $66,000 mark to reverse the current short-term downtrend.
#NvidiaBeatsEstimatesWith$130BQ4Outlook #AnthropicIPOPriceCouldExceed$80 #RussiaCentralBankAddsAlfaBankToCryptoExchangeRegister #VisaPlansStablecoinPrefundingForAPACCrossBorderPayments $#RussianCentralBankPlansToAllowFundsToHoldCryptoIn2027
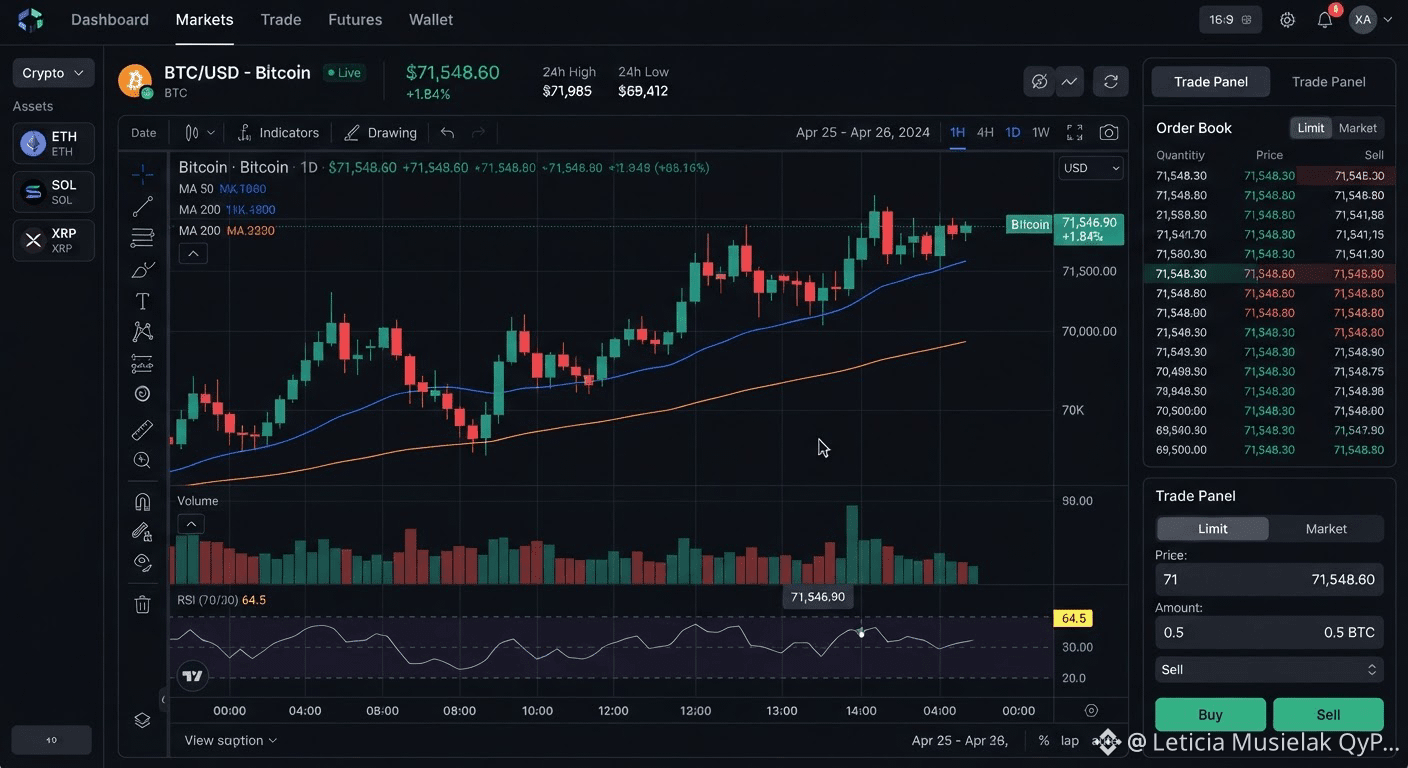
165
·
--
Article
📉 Bitcoin's Biggest Challenge Right Now Is Investor Confidence!
The crypto market is experiencing aThe crypto market is experiencing a difficult phase, and Bitcoin is feeling the pressure.
On November 18, Bitcoin was trading near $64,000, while Ethereum was struggling to maintain the $1,800 level.
But here's an interesting question:
Is this market weakness simply a temporary correction, or are investors becoming more cautious about crypto?
Three things worth watching:
ETF Outflows: Institutional money leaving Bitcoin investment funds is creating additional pressure.
Market Sentiment: Fear is influencing investor decisions.
Liquidity: Lower market liquidity can make price movements more volatile.
My takeaway: Short-term market movements don't tell the whole story. Understanding market sentiment, liquidity and long-term developments is equally important.
💬 What do you think? Is Bitcoin preparing for a recovery, or could the market remain under pressure?
#NvidiaBeatsEstimatesWith$130BQ4Outlook #AnthropicIPOPriceCouldExceed$80 #RussiaCentralBankAddsAlfaBankToCryptoExchangeRegister #RussianCentralBankPlansToAllowFundsToHoldCryptoIn2027 #VisaPlansStablecoinPrefundingForAPACCrossBorderPayments
📉 Bitcoin's Biggest Challenge Right Now Is Investor Confidence! The crypto market is experiencing a
The crypto market is experiencing a difficult phase, and Bitcoin is feeling the pressure.
On November 18, Bitcoin was trading near $64,000, while Ethereum was struggling to maintain the $1,800 level.
But here's an interesting question:
Is this market weakness simply a temporary correction, or are investors becoming more cautious about crypto?
Three things worth watching:
ETF Outflows: Institutional money leaving Bitcoin investment funds is creating additional pressure.
Market Sentiment: Fear is influencing investor decisions.
Liquidity: Lower market liquidity can make price movements more volatile.
My takeaway: Short-term market movements don't tell the whole story. Understanding market sentiment, liquidity and long-term developments is equally important.
💬 What do you think? Is Bitcoin preparing for a recovery, or could the market remain under pressure?
#NvidiaBeatsEstimatesWith$130BQ4Outlook #AnthropicIPOPriceCouldExceed$80 #RussiaCentralBankAddsAlfaBankToCryptoExchangeRegister #RussianCentralBankPlansToAllowFundsToHoldCryptoIn2027 #VisaPlansStablecoinPrefundingForAPACCrossBorderPayments
On November 18, Bitcoin was trading near $64,000, while Ethereum was struggling to maintain the $1,800 level.
But here's an interesting question:
Is this market weakness simply a temporary correction, or are investors becoming more cautious about crypto?
Three things worth watching:
ETF Outflows: Institutional money leaving Bitcoin investment funds is creating additional pressure.
Market Sentiment: Fear is influencing investor decisions.
Liquidity: Lower market liquidity can make price movements more volatile.
My takeaway: Short-term market movements don't tell the whole story. Understanding market sentiment, liquidity and long-term developments is equally important.
💬 What do you think? Is Bitcoin preparing for a recovery, or could the market remain under pressure?
#NvidiaBeatsEstimatesWith$130BQ4Outlook #AnthropicIPOPriceCouldExceed$80 #RussiaCentralBankAddsAlfaBankToCryptoExchangeRegister #RussianCentralBankPlansToAllowFundsToHoldCryptoIn2027 #VisaPlansStablecoinPrefundingForAPACCrossBorderPayments
145
Log in to explore more content
Join global crypto users on Binance Square
⚡️ Get latest and useful information about crypto.
💬 Trusted by the world’s largest crypto exchange.
👍 Discover real insights from verified creators.
Email / Phone number
Trending Topics
1
#MoreHikesExpectedIsBTCUnderPressure
97 views
14 Discussing
2
#NvidiaBeatsEstimatesWith$130BQ4Outlook
62,099 views
287 Discussing
3
#AnthropicIPOPriceCouldExceed$80
62,936 views
240 Discussing
4
#RussiaCentralBankAddsAlfaBankToCryptoExchangeRegister
4,390 views
52 Discussing
5
#VisaPlansStablecoinPrefundingForAPACCrossBorderPayments
4,370 views
39 Discussing
6
#CanadaAndUSLaunchOperationNiagaraAgainstApprovalPhishing
38,284 views
55 Discussing
7
#BankOfEnglandUnveilsClearingHousePathwayCoveringDLTFirms
4,469 views
66 Discussing
8
#DBSAndCirclePartnerToExpandAsianInstitutionsUSDCAccess
5,758 views
66 Discussing
9
#LedgerHardwareImplantReportsExtendToDubai
96,150 views
865 Discussing
10
#NvidiaBoardNotConsideringHuang’sReturnasCEO
273,543 views
1,637 Discussing