

#usjobsdata
usjobsdata
59.3M views
430,997 Discussing
U.S. lost 105,000 jobs in October and added 64,000 in November, according to delayed data. Headline unemployment rate continued to climb and hit 4.6%, a four-year high in November.Fed Chair Jerome Powell cautioned that jobs figures are likely worse than the numbers that have been reported, these comments coming after the Fed announced it was cutting interest rates by a quarter point. How will the crypto market react to this?
Hot
Latest


·
--
U.S. Market Today: U.S. Added Stronger-Than-Forecast 119K Jobs in September, but Unemployment Rate Rises to 4.4%The U.S. labor market posted a stronger-than-expected gain of 119,000 jobs in September, even as the unemployment rate unexpectedly climbed to 4.4%, according to long-delayed government data released Thursday.The report — originally scheduled for early October — was pushed back six weeks due to the federal government shutdown, leaving markets without timely labor figures throughout a volatile period.What to KnowThe U.S. added 119,000 jobs, beating economist expectations of 50,000.The unemployment rate rose to 4.4%, above the 4.3% forecast.The shutdown-delayed jobs report arrives as markets weigh fading Fed rate-cut odds.Bitcoin held modest gains around $91,900 following strong Nvidia earnings.Next up-to-date labor data will not be released until mid-December.Delayed Report Shows Labor Market Firmer Than ExpectedThe Bureau of Labor Statistics data showed nonfarm payrolls rising by 119,000 in September. Economists had projected 50,000, following a revised 4,000-job decline in August (originally reported as a 22,000 gain).However, the unemployment rate ticked up to 4.4%, suggesting a softening in labor-market conditions despite stronger hiring.The late release complicates the near-term economic outlook, as policymakers, analysts and traders lack fresh data heading into the Federal Reserve’s final 2025 meeting.Market Reaction: Bitcoin Holds Gains, Nasdaq Futures JumpBitcoin continued to hold its modest overnight lift, trading near $91,900 after Nvidia’s strong earnings and upbeat outlook calmed jittery markets late Wednesday.U.S. equity futures extended those gains:Nasdaq futures +1.9%S&P 500 and Dow futures higher10-year Treasury yield steady at 4.11%U.S. dollar index slightly strongerThe jobs report did not materially shift sentiment, as markets had already priced out a December rate cut.Fed Rate Cut Expectations Unlikely to ChangeTraders had largely eliminated the possibility of a December interest rate cut prior to the data release, citing:the Federal Reserve’s hawkish tone in recent speechesuncertainty caused by missing labor-market dataconcerns about inflation persistenceThursday’s numbers — strong on payrolls but weaker on unemployment — are unlikely to alter those expectations.With no updated employment report arriving until mid-December, the Fed will go into its final 2025 meeting with only partial visibility into labor conditions.OutlookThe September report offers a backward-looking snapshot of a labor market that remains resilient but is showing signs of cooling at the margins. Markets now await the next batch of timely data, though it may arrive after key policy decisions are already made.For now:hiring is strongerunemployment is risingand the Fed’s December calculus remains unchangedCrypto and equities continue to take signals primarily from earnings strength, tech momentum and shifting rate expectations rather than delayed economic data.
U.S. Market Today: U.S. Added Stronger-Than-Forecast 119K Jobs in September, but Unemployment Rate Rises to 4.4%
The U.S. labor market posted a stronger-than-expected gain of 119,000 jobs in September, even as the unemployment rate unexpectedly climbed to 4.4%, according to long-delayed government data released Thursday.The report — originally scheduled for early October — was pushed back six weeks due to the federal government shutdown, leaving markets without timely labor figures throughout a volatile period.What to KnowThe U.S. added 119,000 jobs, beating economist expectations of 50,000.The unemployment rate rose to 4.4%, above the 4.3% forecast.The shutdown-delayed jobs report arrives as markets weigh fading Fed rate-cut odds.Bitcoin held modest gains around $91,900 following strong Nvidia earnings.Next up-to-date labor data will not be released until mid-December.Delayed Report Shows Labor Market Firmer Than ExpectedThe Bureau of Labor Statistics data showed nonfarm payrolls rising by 119,000 in September. Economists had projected 50,000, following a revised 4,000-job decline in August (originally reported as a 22,000 gain).However, the unemployment rate ticked up to 4.4%, suggesting a softening in labor-market conditions despite stronger hiring.The late release complicates the near-term economic outlook, as policymakers, analysts and traders lack fresh data heading into the Federal Reserve’s final 2025 meeting.Market Reaction: Bitcoin Holds Gains, Nasdaq Futures JumpBitcoin continued to hold its modest overnight lift, trading near $91,900 after Nvidia’s strong earnings and upbeat outlook calmed jittery markets late Wednesday.U.S. equity futures extended those gains:Nasdaq futures +1.9%S&P 500 and Dow futures higher10-year Treasury yield steady at 4.11%U.S. dollar index slightly strongerThe jobs report did not materially shift sentiment, as markets had already priced out a December rate cut.Fed Rate Cut Expectations Unlikely to ChangeTraders had largely eliminated the possibility of a December interest rate cut prior to the data release, citing:the Federal Reserve’s hawkish tone in recent speechesuncertainty caused by missing labor-market dataconcerns about inflation persistenceThursday’s numbers — strong on payrolls but weaker on unemployment — are unlikely to alter those expectations.With no updated employment report arriving until mid-December, the Fed will go into its final 2025 meeting with only partial visibility into labor conditions.OutlookThe September report offers a backward-looking snapshot of a labor market that remains resilient but is showing signs of cooling at the margins. Markets now await the next batch of timely data, though it may arrive after key policy decisions are already made.For now:hiring is strongerunemployment is risingand the Fed’s December calculus remains unchangedCrypto and equities continue to take signals primarily from earnings strength, tech momentum and shifting rate expectations rather than delayed economic data.
66
26
117
36.4k

🚨 US Jobs Data Today! 🚨
The US unemployment rate is coming out today. Experts expect 4.1%.
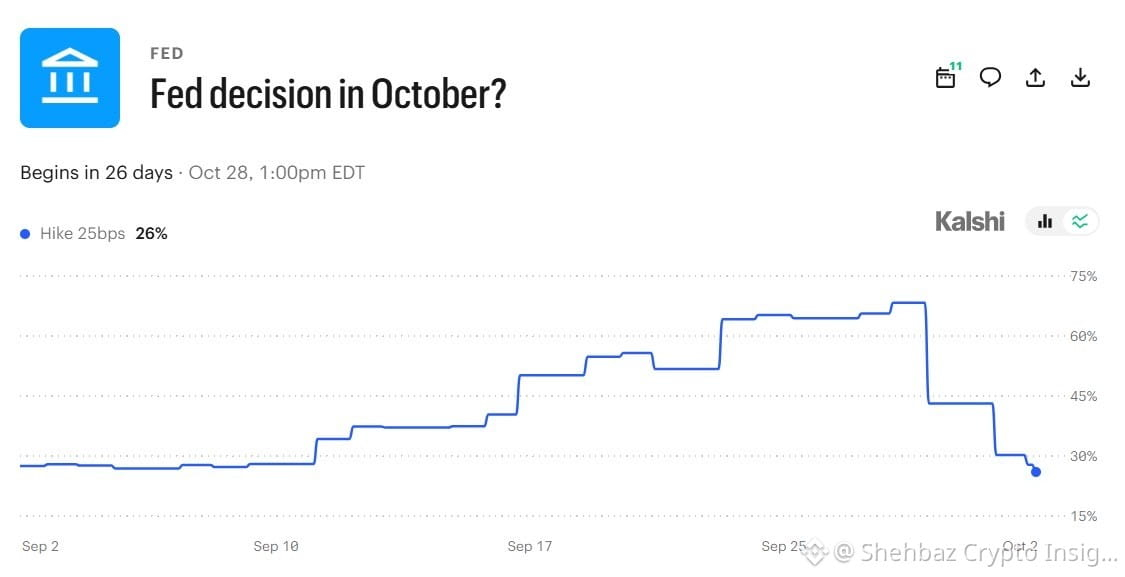
📊 Right now, the chance of a Fed rate hike is only 26%.
Here's what could happen:
🔻 Unemployment above 4.1% → The job market looks weak → Rate hike odds go down
🔺 Unemployment below 4.1% → The job market looks strong → Rate hike odds could go up
⚡ Expect big moves in the market today. Stay alert and manage your risk!
#USJobsData #Unemployment #FedRateHike #Crypto
🚨 US Jobs Data Today! 🚨
The US unemployment rate is coming out today. Experts expect 4.1%.
📊 Right now, the chance of a Fed rate hike is only 26%.
Here's what could happen:
🔻 Unemployment above 4.1% → The job market looks weak → Rate hike odds go down
🔺 Unemployment below 4.1% → The job market looks strong → Rate hike odds could go up
⚡ Expect big moves in the market today. Stay alert and manage your risk!
#USJobsData #Unemployment #FedRateHike #Crypto
The US unemployment rate is coming out today. Experts expect 4.1%.
📊 Right now, the chance of a Fed rate hike is only 26%.
Here's what could happen:
🔻 Unemployment above 4.1% → The job market looks weak → Rate hike odds go down
🔺 Unemployment below 4.1% → The job market looks strong → Rate hike odds could go up
⚡ Expect big moves in the market today. Stay alert and manage your risk!
#USJobsData #Unemployment #FedRateHike #Crypto
1
102

BTC Slips Under 80K on Macro Fears
Bitcoin dipped below the 80,000 mark as strong US jobs data stoked fears of more Fed rate hikes.
#USJobsData #BitcoinResistance
BTC Slips Under 80K on Macro Fears
Bitcoin dipped below the 80,000 mark as strong US jobs data stoked fears of more Fed rate hikes.
#USJobsData #BitcoinResistance
Bitcoin dipped below the 80,000 mark as strong US jobs data stoked fears of more Fed rate hikes.
#USJobsData #BitcoinResistance

1
65


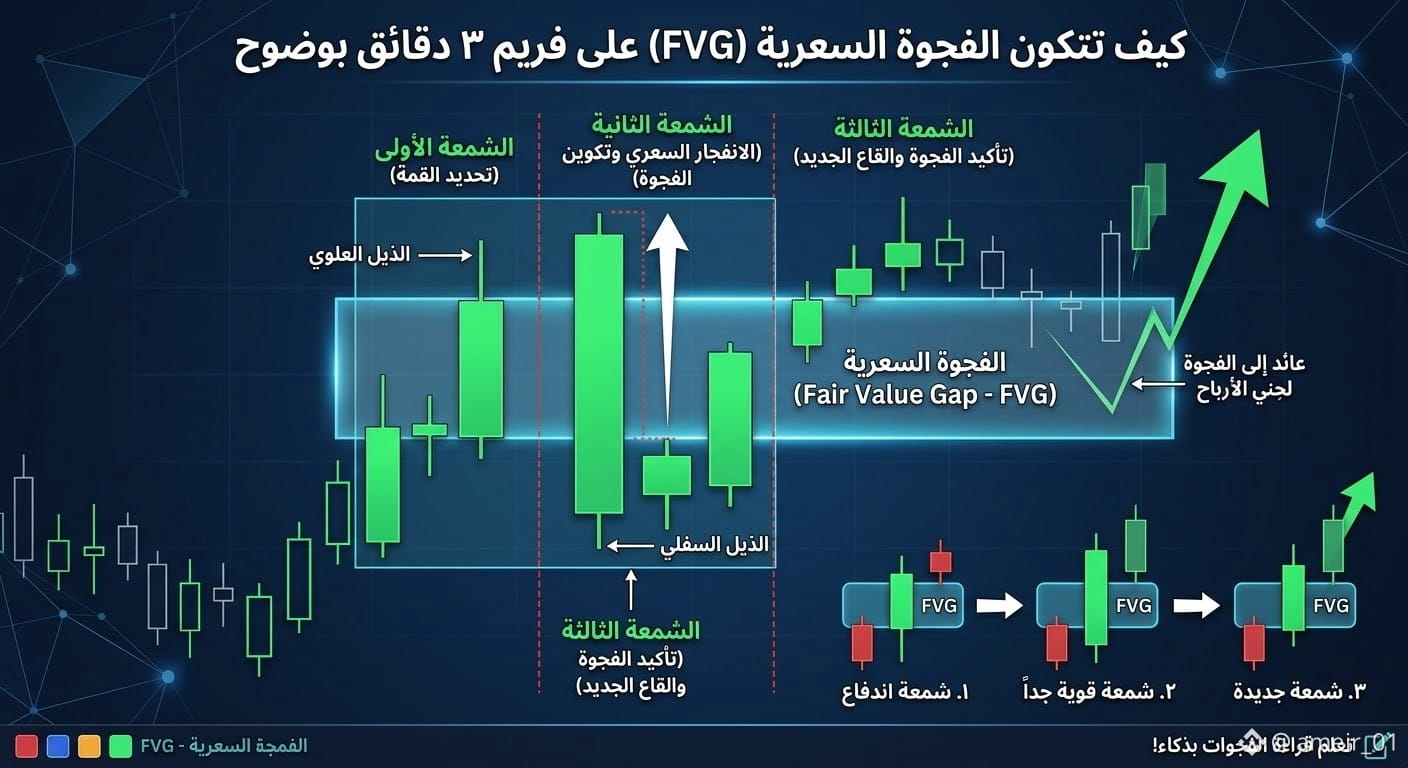
💡 How to catch a Fair Value Gap (FVG) before the price takes off without you? 🚀⚡
Many traders complain about missing opportunities while waiting for higher-timeframe candles to close (such as the 15-minute or 1-hour candle)... The price moves fast, and the entry zone is gone! 📉
📐 The golden solution: Multi-Timeframe Analysis
1️⃣ Higher timeframe (15 minutes / 1 hour):
We use it to identify the overall direction (Bullish/Bearish) and key liquidity zones, without entering directly from it.
2️⃣ Lower timeframe (3 minutes / 1 minute):
Once the direction is confirmed, we immediately switch to the 3-minute timeframe to spot the Fair Value Gap with great precision and catch the price explosion from the very start! 🌊💪
🎯 Benefits of this approach:
⚡ Early entry into the first impulsive move.
🛡️ A very tight stop loss (Tight SL).
💰 An excellent risk-to-reward ratio.
💡 Tip: Follow the trend on the higher timeframe, and catch the launch point on the lower timeframe! 📈
#BinanceHODLerBREV #USJobsData #CPIWatch #BTCVSGOLD #WriteToEarnUpgrade
💡 How to catch a Fair Value Gap (FVG) before the price takes off without you? 🚀⚡
Many traders complain about missing opportunities while waiting for higher-timeframe candles to close (such as the 15-minute or 1-hour candle)... The price moves fast, and the entry zone is gone! 📉
📐 The golden solution: Multi-Timeframe Analysis
1️⃣ Higher timeframe (15 minutes / 1 hour):
We use it to identify the overall direction (Bullish/Bearish) and key liquidity zones, without entering directly from it.
2️⃣ Lower timeframe (3 minutes / 1 minute):
Once the direction is confirmed, we immediately switch to the 3-minute timeframe to spot the Fair Value Gap with great precision and catch the price explosion from the very start! 🌊💪
🎯 Benefits of this approach:
⚡ Early entry into the first impulsive move.
🛡️ A very tight stop loss (Tight SL).
💰 An excellent risk-to-reward ratio.
💡 Tip: Follow the trend on the higher timeframe, and catch the launch point on the lower timeframe! 📈
#BinanceHODLerBREV #USJobsData #CPIWatch #BTCVSGOLD #WriteToEarnUpgrade
Many traders complain about missing opportunities while waiting for higher-timeframe candles to close (such as the 15-minute or 1-hour candle)... The price moves fast, and the entry zone is gone! 📉
📐 The golden solution: Multi-Timeframe Analysis
1️⃣ Higher timeframe (15 minutes / 1 hour):
We use it to identify the overall direction (Bullish/Bearish) and key liquidity zones, without entering directly from it.
2️⃣ Lower timeframe (3 minutes / 1 minute):
Once the direction is confirmed, we immediately switch to the 3-minute timeframe to spot the Fair Value Gap with great precision and catch the price explosion from the very start! 🌊💪
🎯 Benefits of this approach:
⚡ Early entry into the first impulsive move.
🛡️ A very tight stop loss (Tight SL).
💰 An excellent risk-to-reward ratio.
💡 Tip: Follow the trend on the higher timeframe, and catch the launch point on the lower timeframe! 📈
#BinanceHODLerBREV #USJobsData #CPIWatch #BTCVSGOLD #WriteToEarnUpgrade
2
43
📚 Professional Guide: Parabolic SAR and EMA Crossover Strategy (Buy - Long) 🚀
Hello everyone! 🌟 A powerful strategy for highly professional intraday trading.
⏱️ Time frame: 5 minutes (5m) ⏱️
- Ideal for catching rapid breakouts and market momentum.
🎯 Entry Conditions (LONG):
1. Parabolic SAR indicator:
- Condition: The indicator dots must be positioned directly below the price.
- Reason: This confirms the start of upward momentum and buyer dominance.
2. Moving average crossover:
- Condition: EMA 9 must be above EMA 21.
- Reason: This indicates accelerating buying momentum and rising prices.
💡 Why does it work?
- Double confirmation reduces false signals and provides high timing accuracy, along with strict risk management.
I've shared the strategy with you. Don't forget to support the post and share it so others can benefit! 📈🚀
#ZTCBinanceTGE #ETHWhaleWatch #USJobsData #BTCVSGOLD #WriteToEarnUpgrade
📚 Professional Guide: Parabolic SAR and EMA Crossover Strategy (Buy - Long) 🚀
Hello everyone! 🌟 A powerful strategy for highly professional intraday trading.
⏱️ Time frame: 5 minutes (5m) ⏱️
- Ideal for catching rapid breakouts and market momentum.
🎯 Entry Conditions (LONG):
1. Parabolic SAR indicator:
- Condition: The indicator dots must be positioned directly below the price.
- Reason: This confirms the start of upward momentum and buyer dominance.
2. Moving average crossover:
- Condition: EMA 9 must be above EMA 21.
- Reason: This indicates accelerating buying momentum and rising prices.
💡 Why does it work?
- Double confirmation reduces false signals and provides high timing accuracy, along with strict risk management.
I've shared the strategy with you. Don't forget to support the post and share it so others can benefit! 📈🚀
#ZTCBinanceTGE #ETHWhaleWatch #USJobsData #BTCVSGOLD #WriteToEarnUpgrade
Hello everyone! 🌟 A powerful strategy for highly professional intraday trading.
⏱️ Time frame: 5 minutes (5m) ⏱️
- Ideal for catching rapid breakouts and market momentum.
🎯 Entry Conditions (LONG):
1. Parabolic SAR indicator:
- Condition: The indicator dots must be positioned directly below the price.
- Reason: This confirms the start of upward momentum and buyer dominance.
2. Moving average crossover:
- Condition: EMA 9 must be above EMA 21.
- Reason: This indicates accelerating buying momentum and rising prices.
💡 Why does it work?
- Double confirmation reduces false signals and provides high timing accuracy, along with strict risk management.
I've shared the strategy with you. Don't forget to support the post and share it so others can benefit! 📈🚀
#ZTCBinanceTGE #ETHWhaleWatch #USJobsData #BTCVSGOLD #WriteToEarnUpgrade

1
166

·
--
Bearish
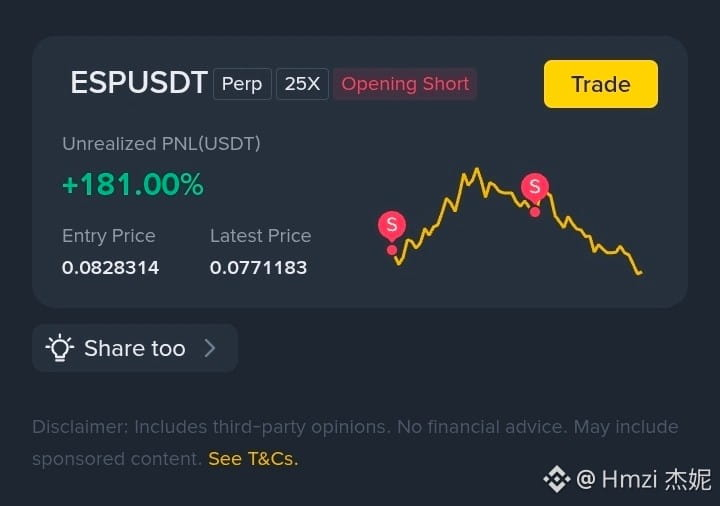
$ESP
Strong reversal pressure so get it guys...
Get in with limit order as short now.
Gud Luck as i have already done it.
#WhenWillCLARITYActPass #StrategyBTCPurchase #PredictionMarketsCFTCBacking #HarvardAddsETHExposure #USJobsData
$ESP
Strong reversal pressure so get it guys...
Get in with limit order as short now.
Gud Luck as i have already done it.
#WhenWillCLARITYActPass #StrategyBTCPurchase #PredictionMarketsCFTCBacking #HarvardAddsETHExposure #USJobsData
Strong reversal pressure so get it guys...
Get in with limit order as short now.
Gud Luck as i have already done it.
#WhenWillCLARITYActPass #StrategyBTCPurchase #PredictionMarketsCFTCBacking #HarvardAddsETHExposure #USJobsData
103


·
--
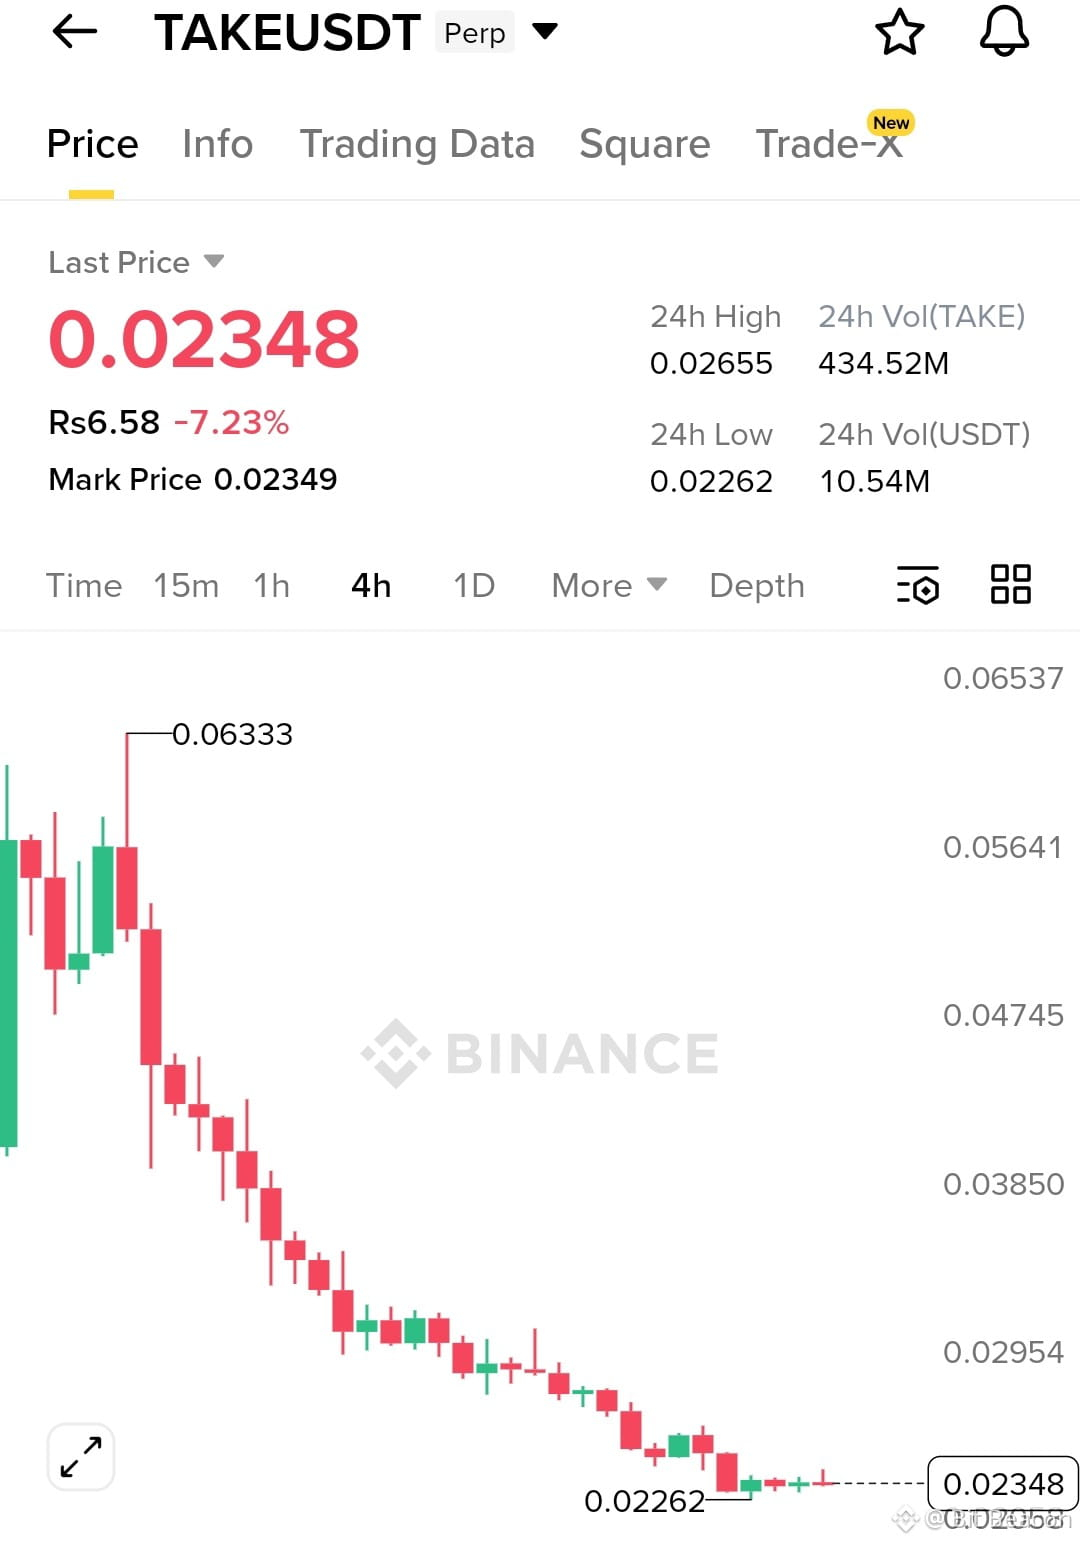
$TAKE is compressing at the lows after a brutal bleed, and price is sitting right on the 0.0226 sweep zone. If this base holds, relief can rip fast into overhead supply.
Buy Zone: 0.0228–0.0236
TP1: 0.0260
TP2: 0.0295
TP3: 0.0335
Stop Loss: 0.0219
EP: 0.0235
TP: 0.0260 / 0.0295 / 0.0335
SL: 0.0219
{future}(TAKEUSDT)
#WhenWillCLARITYActPass #PredictionMarketsCFTCBacking #OpenClawFounderJoinsOpenAI #TradeCryptosOnX #USJobsData
$TAKE is compressing at the lows after a brutal bleed, and price is sitting right on the 0.0226 sweep zone. If this base holds, relief can rip fast into overhead supply.
Buy Zone: 0.0228–0.0236
TP1: 0.0260
TP2: 0.0295
TP3: 0.0335
Stop Loss: 0.0219
EP: 0.0235
TP: 0.0260 / 0.0295 / 0.0335
SL: 0.0219
#WhenWillCLARITYActPass #PredictionMarketsCFTCBacking #OpenClawFounderJoinsOpenAI #TradeCryptosOnX #USJobsData
Buy Zone: 0.0228–0.0236
TP1: 0.0260
TP2: 0.0295
TP3: 0.0335
Stop Loss: 0.0219
EP: 0.0235
TP: 0.0260 / 0.0295 / 0.0335
SL: 0.0219
#WhenWillCLARITYActPass #PredictionMarketsCFTCBacking #OpenClawFounderJoinsOpenAI #TradeCryptosOnX #USJobsData
3
653


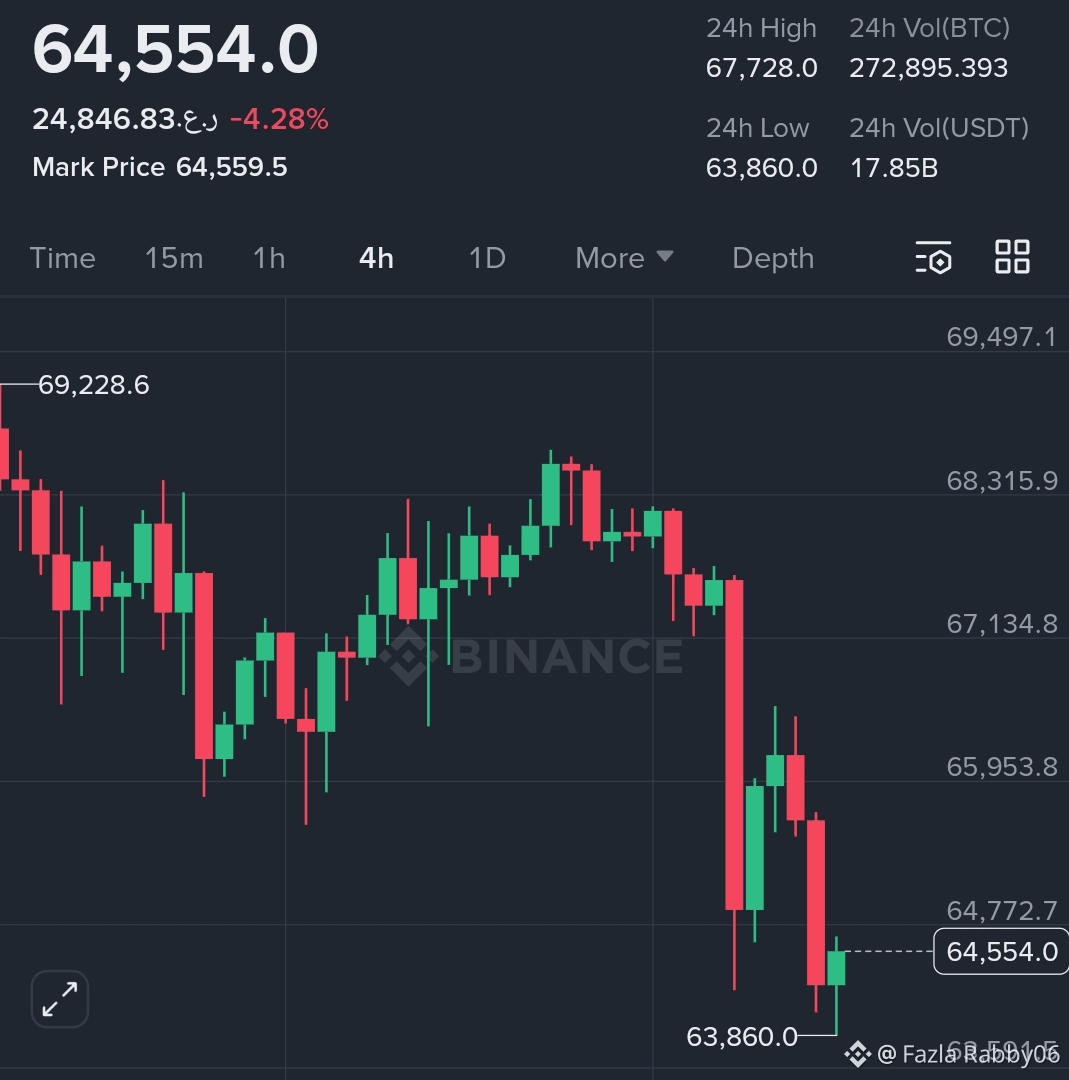
1️⃣ Current Situation (Daily Chart Analysis) $BTC
Price: ~64,500
Recent low: ~59,800
RSI(6): 25 → Oversold zone
OBV: Downtrend → Strong selling pressure🔴
🔮 What Could Happen $BTC Next?
I will explain 3 realistic scenarios:
🟥 Bearish Scenario (Higher Probability Right Now)
If:
59.8k support breaks
Daily candle closes below 59k
Then possible next targets:
55k - 52k✅
Extreme case: 48k⚡
Estimated probability: 60–65%
(Based on current market structure)
🟨 Short-Term Bounce Scenario
RSI is oversold (25), so a short-term relief bounce is possible.
If bounce happens:
68k – 72k resistance zone⚡
But trend will not change unless:
75k–78k breaks with strong volume✅
Estimated probability: 30%
🟩 Bullish Reversal Scenario
For a full bullish reversal:
Price must break above 75k
Create a higher high
Volume must increase
Right now, this looks less likely.
Estimated probability: 10%
🎯 Long-Term View (1–2 Years)
Historically:
Bitcoin follows a 4-year cycle
After big corrections, it makes strong bull runs
If this is a normal cycle correction,
we could see a new all-time high again in 2026–2027.
Long-term outlook: Bullish🟢
Short-term outlook: Bearish🔴
#StrategyBTCPurchase #TrumpNewTariffs #PredictionMarketsCFTCBacking #USJobsData
1️⃣ Current Situation (Daily Chart Analysis) $BTC
Price: ~64,500
Recent low: ~59,800
RSI(6): 25 → Oversold zone
OBV: Downtrend → Strong selling pressure🔴
🔮 What Could Happen $BTC Next?
I will explain 3 realistic scenarios:
🟥 Bearish Scenario (Higher Probability Right Now)
If:
59.8k support breaks
Daily candle closes below 59k
Then possible next targets:
55k - 52k✅
Extreme case: 48k⚡
Estimated probability: 60–65%
(Based on current market structure)
🟨 Short-Term Bounce Scenario
RSI is oversold (25), so a short-term relief bounce is possible.
If bounce happens:
68k – 72k resistance zone⚡
But trend will not change unless:
75k–78k breaks with strong volume✅
Estimated probability: 30%
🟩 Bullish Reversal Scenario
For a full bullish reversal:
Price must break above 75k
Create a higher high
Volume must increase
Right now, this looks less likely.
Estimated probability: 10%
🎯 Long-Term View (1–2 Years)
Historically:
Bitcoin follows a 4-year cycle
After big corrections, it makes strong bull runs
If this is a normal cycle correction,
we could see a new all-time high again in 2026–2027.
Long-term outlook: Bullish🟢
Short-term outlook: Bearish🔴
#StrategyBTCPurchase #TrumpNewTariffs #PredictionMarketsCFTCBacking #USJobsData
Price: ~64,500
Recent low: ~59,800
RSI(6): 25 → Oversold zone
OBV: Downtrend → Strong selling pressure🔴
🔮 What Could Happen $BTC Next?
I will explain 3 realistic scenarios:
🟥 Bearish Scenario (Higher Probability Right Now)
If:
59.8k support breaks
Daily candle closes below 59k
Then possible next targets:
55k - 52k✅
Extreme case: 48k⚡
Estimated probability: 60–65%
(Based on current market structure)
🟨 Short-Term Bounce Scenario
RSI is oversold (25), so a short-term relief bounce is possible.
If bounce happens:
68k – 72k resistance zone⚡
But trend will not change unless:
75k–78k breaks with strong volume✅
Estimated probability: 30%
🟩 Bullish Reversal Scenario
For a full bullish reversal:
Price must break above 75k
Create a higher high
Volume must increase
Right now, this looks less likely.
Estimated probability: 10%
🎯 Long-Term View (1–2 Years)
Historically:
Bitcoin follows a 4-year cycle
After big corrections, it makes strong bull runs
If this is a normal cycle correction,
we could see a new all-time high again in 2026–2027.
Long-term outlook: Bullish🟢
Short-term outlook: Bearish🔴
#StrategyBTCPurchase #TrumpNewTariffs #PredictionMarketsCFTCBacking #USJobsData
2
214

·
--
Bullish
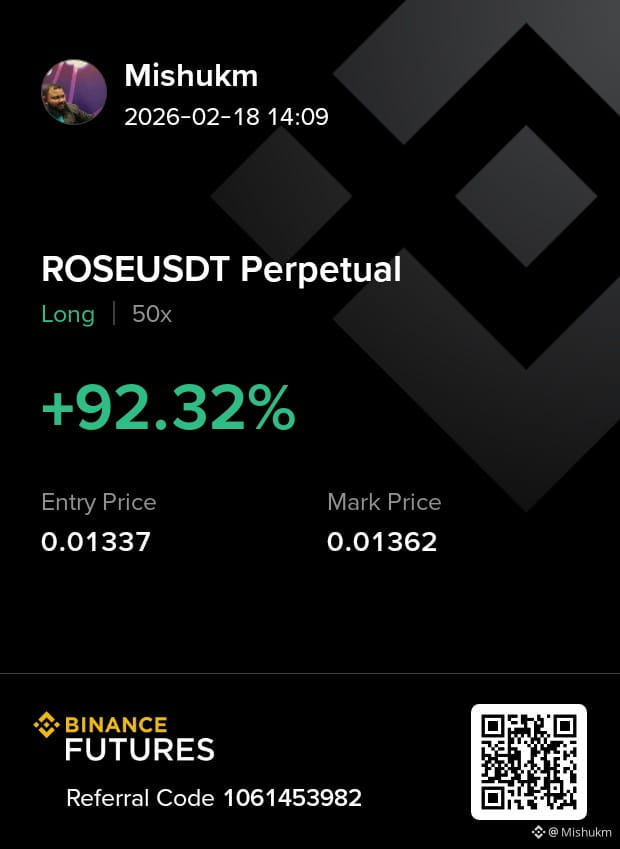
My 🌹 $ROSE USDT — Results 100% LONG Trade PRINTING Cash 🚀 Let's Earn Together @MishukTrader 🤝 🤝 👇 👇 👇
Setup: Momentum continuation after reclaiming short-term support with bullish expansion.
Entry Zone: 0.01345 – 0.01360
Take Profit Targets:
• TP1: 0.01410
• TP2: 0.01485
• TP3: 0.01590
Stop Loss: 0.01275
📊 Technical Reasoning
• Price holding above recent breakout zone
• Strong bullish momentum confirmed by continuation move
• Higher low structure forming
• Liquidity sitting above 0.01480 and 0.01580
⚡ Trade Management
• Secure partial profits at TP1
• Move SL to breakeven after TP1 hit
• Let remaining position ride toward TP3
🔥 Binance Square Caption (Viral Style)
#ROSE is waking up 🌹
Momentum is building and bulls are stepping in.
Breakout continuation in progress and liquidity sitting higher.
Targets are locked. Structure is bullish.
Watch this move carefully. 🚀
Engagement.#PredictionMarketsCFTCBacking #OpenClawFounderJoinsOpenAI #TradeCryptosOnX #USJobsData
My 🌹 $ROSE USDT — Results 100% LONG Trade PRINTING Cash 🚀 Let's Earn Together @Mishukm 🤝 🤝 👇 👇 👇
Setup: Momentum continuation after reclaiming short-term support with bullish expansion.
Entry Zone: 0.01345 – 0.01360
Take Profit Targets:
• TP1: 0.01410
• TP2: 0.01485
• TP3: 0.01590
Stop Loss: 0.01275
📊 Technical Reasoning
• Price holding above recent breakout zone
• Strong bullish momentum confirmed by continuation move
• Higher low structure forming
• Liquidity sitting above 0.01480 and 0.01580
⚡ Trade Management
• Secure partial profits at TP1
• Move SL to breakeven after TP1 hit
• Let remaining position ride toward TP3
🔥 Binance Square Caption (Viral Style)
#ROSE is waking up 🌹
Momentum is building and bulls are stepping in.
Breakout continuation in progress and liquidity sitting higher.
Targets are locked. Structure is bullish.
Watch this move carefully. 🚀
Engagement.#PredictionMarketsCFTCBacking #OpenClawFounderJoinsOpenAI #TradeCryptosOnX #USJobsData
Setup: Momentum continuation after reclaiming short-term support with bullish expansion.
Entry Zone: 0.01345 – 0.01360
Take Profit Targets:
• TP1: 0.01410
• TP2: 0.01485
• TP3: 0.01590
Stop Loss: 0.01275
📊 Technical Reasoning
• Price holding above recent breakout zone
• Strong bullish momentum confirmed by continuation move
• Higher low structure forming
• Liquidity sitting above 0.01480 and 0.01580
⚡ Trade Management
• Secure partial profits at TP1
• Move SL to breakeven after TP1 hit
• Let remaining position ride toward TP3
🔥 Binance Square Caption (Viral Style)
#ROSE is waking up 🌹
Momentum is building and bulls are stepping in.
Breakout continuation in progress and liquidity sitting higher.
Targets are locked. Structure is bullish.
Watch this move carefully. 🚀
Engagement.#PredictionMarketsCFTCBacking #OpenClawFounderJoinsOpenAI #TradeCryptosOnX #USJobsData
3
113

·
--
Bullish
Listen up, this long on $PONKE is about to explode upwards, and if you're not in, shorts are gonna get absolutely wrecked attack now or step aside.
Solana memes are heating up again with fresh liquidity flowing in post-upgrade, volume doubled overnight on buys, and OI ramping as bulls dominate the tape. Funding's gone positive at 0.01%, making shorts bleed while they wait, and with mid-caps leading the charge in this rotation, the timing couldn't be better to pile in aggressive.
Entry Zone: 0.38 - 0.40
TP1: 0.45
TP2: 0.50
TP3: 0.60
SL: 0.35
Liquidity pools are thin above the 0.40 resistance, ready to get hunted once we push through, creating that fast upside wick. Funding bias screams longs, punishing shorts and attracting more leveraged buyers. OI's up 18% today alone, all on the buy side without signs of exhaustion. This is classic breakout setup over the weekly high, squeezing shorts hard as stops trigger momentum here expands wild in funding-imbalanced perps, especially with volume confirming the move, potentially doubling in days.
No hesitation, smash the buy button and dominate this trade weakness gets punished, strength gets rewarded big.
Also monitoring $BOME and $MEW for rotation.
#BTC100kNext? #USJobsData #PredictionMarketsCFTCBacking #ZAMAPreTGESale
Listen up, this long on $PONKE is about to explode upwards, and if you're not in, shorts are gonna get absolutely wrecked attack now or step aside.
Solana memes are heating up again with fresh liquidity flowing in post-upgrade, volume doubled overnight on buys, and OI ramping as bulls dominate the tape. Funding's gone positive at 0.01%, making shorts bleed while they wait, and with mid-caps leading the charge in this rotation, the timing couldn't be better to pile in aggressive.
Entry Zone: 0.38 - 0.40
TP1: 0.45
TP2: 0.50
TP3: 0.60
SL: 0.35
Liquidity pools are thin above the 0.40 resistance, ready to get hunted once we push through, creating that fast upside wick. Funding bias screams longs, punishing shorts and attracting more leveraged buyers. OI's up 18% today alone, all on the buy side without signs of exhaustion. This is classic breakout setup over the weekly high, squeezing shorts hard as stops trigger momentum here expands wild in funding-imbalanced perps, especially with volume confirming the move, potentially doubling in days.
No hesitation, smash the buy button and dominate this trade weakness gets punished, strength gets rewarded big.
Also monitoring $BOME and $MEW for rotation.
#BTC100kNext? #USJobsData #PredictionMarketsCFTCBacking #ZAMAPreTGESale
Solana memes are heating up again with fresh liquidity flowing in post-upgrade, volume doubled overnight on buys, and OI ramping as bulls dominate the tape. Funding's gone positive at 0.01%, making shorts bleed while they wait, and with mid-caps leading the charge in this rotation, the timing couldn't be better to pile in aggressive.
Entry Zone: 0.38 - 0.40
TP1: 0.45
TP2: 0.50
TP3: 0.60
SL: 0.35
Liquidity pools are thin above the 0.40 resistance, ready to get hunted once we push through, creating that fast upside wick. Funding bias screams longs, punishing shorts and attracting more leveraged buyers. OI's up 18% today alone, all on the buy side without signs of exhaustion. This is classic breakout setup over the weekly high, squeezing shorts hard as stops trigger momentum here expands wild in funding-imbalanced perps, especially with volume confirming the move, potentially doubling in days.
No hesitation, smash the buy button and dominate this trade weakness gets punished, strength gets rewarded big.
Also monitoring $BOME and $MEW for rotation.
#BTC100kNext? #USJobsData #PredictionMarketsCFTCBacking #ZAMAPreTGESale

1
323
·
--
Bearish
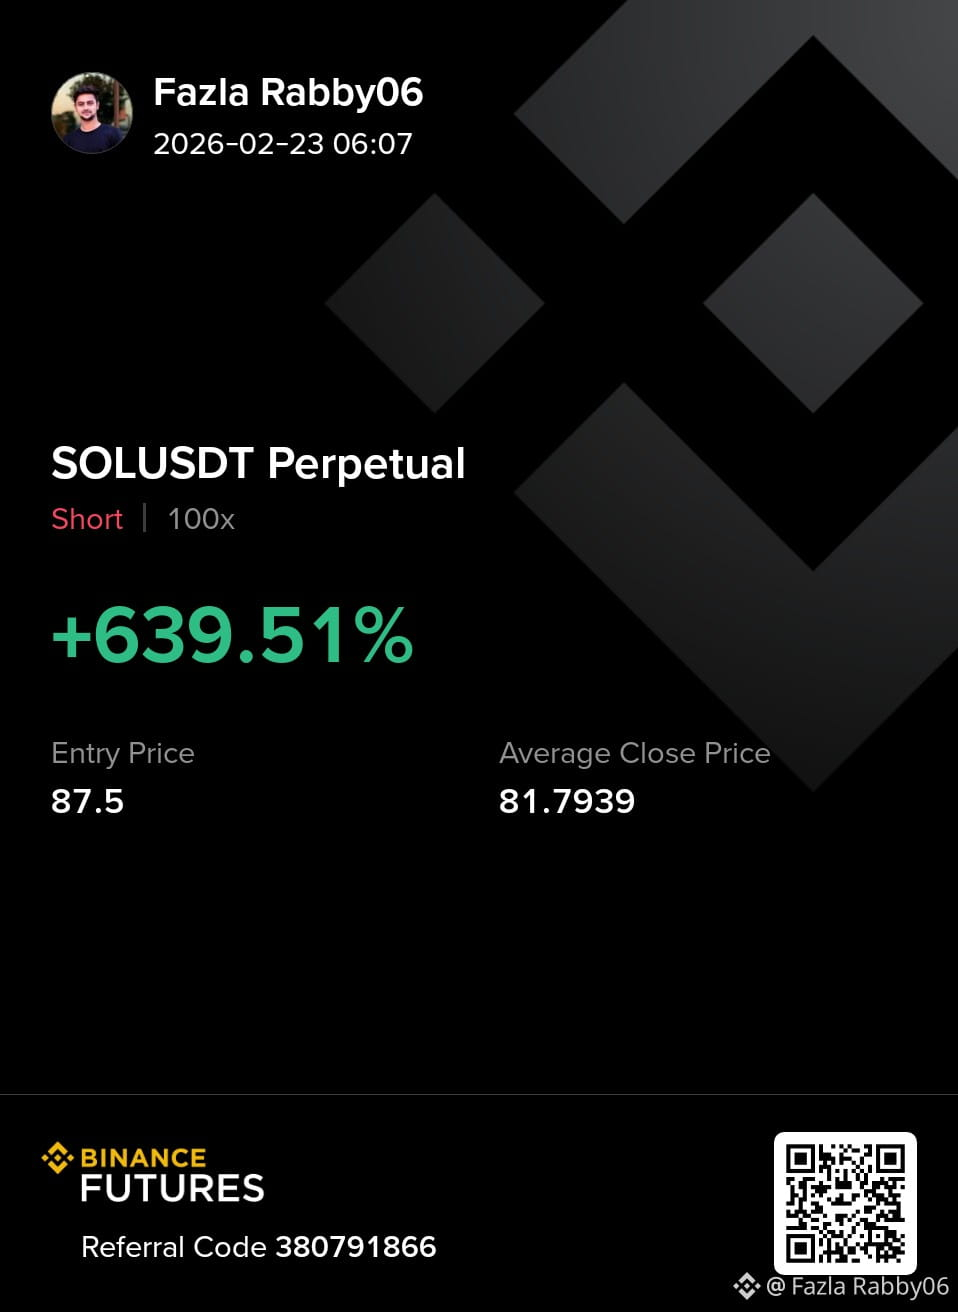
$SOL Another Sure Shot🎯🤤
Perfect Catche🎯Looks my Entry👀
#USJobsData #WhenWillCLARITYActPass #PredictionMarketsCFTCBacking
$SOL Another Sure Shot🎯🤤
Perfect Catche🎯Looks my Entry👀
#USJobsData #WhenWillCLARITYActPass #PredictionMarketsCFTCBacking
Perfect Catche🎯Looks my Entry👀
#USJobsData #WhenWillCLARITYActPass #PredictionMarketsCFTCBacking
1
109

·
--
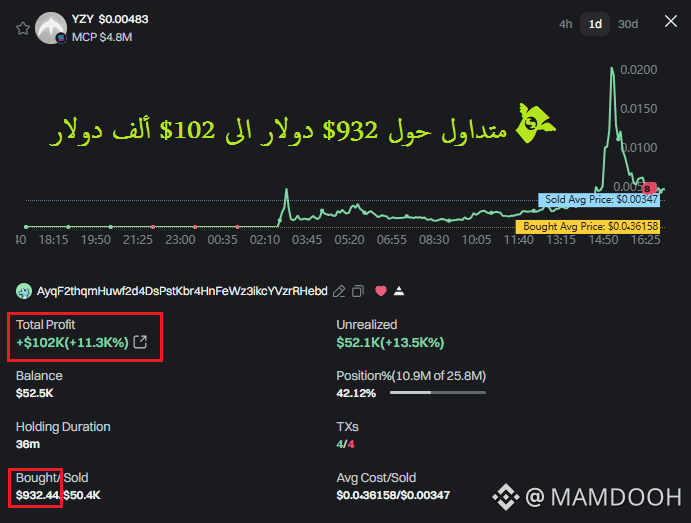
Can $932 really turn into $102,000?
Yes, and that's what happened with a trader who invested in the currency $YZY and made a profit of +11,300% 💸 $SOL
But how does this happen and what lessons should you learn?🧵👇
1️⃣ Jumping on the wave early
The trader bought at a moment when the currency was under the radar, before the "herd" joined in.
In crypto, those who enter first often reap the biggest rewards.
2️⃣ Small capital = calculated risk
The nice thing is that he didn't risk a huge amount, just $932.
If he lost it, his life wouldn't collapse, and if he won (as happened), it turns into a dream.
3️⃣ Exiting during madness
The value skyrocketed.
But the trader didn't get greedy; he sold at the right time before the price collapsed again.
In meme coins, staying too long = deadly risk.
4️⃣ The most important lesson
Opportunities like this are rare and fleeting.
Not every currency will make you a millionaire, but the secret is:
Paying attention to the market,
Monitoring smart portfolios,
Entering with small capital,
Knowing when to exit.
🔥 Crypto is not just a game of luck but a game of speed + intelligence + discipline
$ZEN #WhenWillCLARITYActPass #PredictionMarketsCFTCBacking #OpenClawFounderJoinsOpenAI #StrategyBTCPurchase #USJobsData
Can $932 really turn into $102,000?
Yes, and that's what happened with a trader who invested in the currency $YZY and made a profit of +11,300% 💸 $SOL
But how does this happen and what lessons should you learn?🧵👇
1️⃣ Jumping on the wave early
The trader bought at a moment when the currency was under the radar, before the "herd" joined in.
In crypto, those who enter first often reap the biggest rewards.
2️⃣ Small capital = calculated risk
The nice thing is that he didn't risk a huge amount, just $932.
If he lost it, his life wouldn't collapse, and if he won (as happened), it turns into a dream.
3️⃣ Exiting during madness
The value skyrocketed.
But the trader didn't get greedy; he sold at the right time before the price collapsed again.
In meme coins, staying too long = deadly risk.
4️⃣ The most important lesson
Opportunities like this are rare and fleeting.
Not every currency will make you a millionaire, but the secret is:
Paying attention to the market,
Monitoring smart portfolios,
Entering with small capital,
Knowing when to exit.
🔥 Crypto is not just a game of luck but a game of speed + intelligence + discipline
$ZEN #WhenWillCLARITYActPass #PredictionMarketsCFTCBacking #OpenClawFounderJoinsOpenAI #StrategyBTCPurchase #USJobsData
Yes, and that's what happened with a trader who invested in the currency $YZY and made a profit of +11,300% 💸 $SOL
But how does this happen and what lessons should you learn?🧵👇
1️⃣ Jumping on the wave early
The trader bought at a moment when the currency was under the radar, before the "herd" joined in.
In crypto, those who enter first often reap the biggest rewards.
2️⃣ Small capital = calculated risk
The nice thing is that he didn't risk a huge amount, just $932.
If he lost it, his life wouldn't collapse, and if he won (as happened), it turns into a dream.
3️⃣ Exiting during madness
The value skyrocketed.
But the trader didn't get greedy; he sold at the right time before the price collapsed again.
In meme coins, staying too long = deadly risk.
4️⃣ The most important lesson
Opportunities like this are rare and fleeting.
Not every currency will make you a millionaire, but the secret is:
Paying attention to the market,
Monitoring smart portfolios,
Entering with small capital,
Knowing when to exit.
🔥 Crypto is not just a game of luck but a game of speed + intelligence + discipline
$ZEN #WhenWillCLARITYActPass #PredictionMarketsCFTCBacking #OpenClawFounderJoinsOpenAI #StrategyBTCPurchase #USJobsData
1
1
2
1.4k



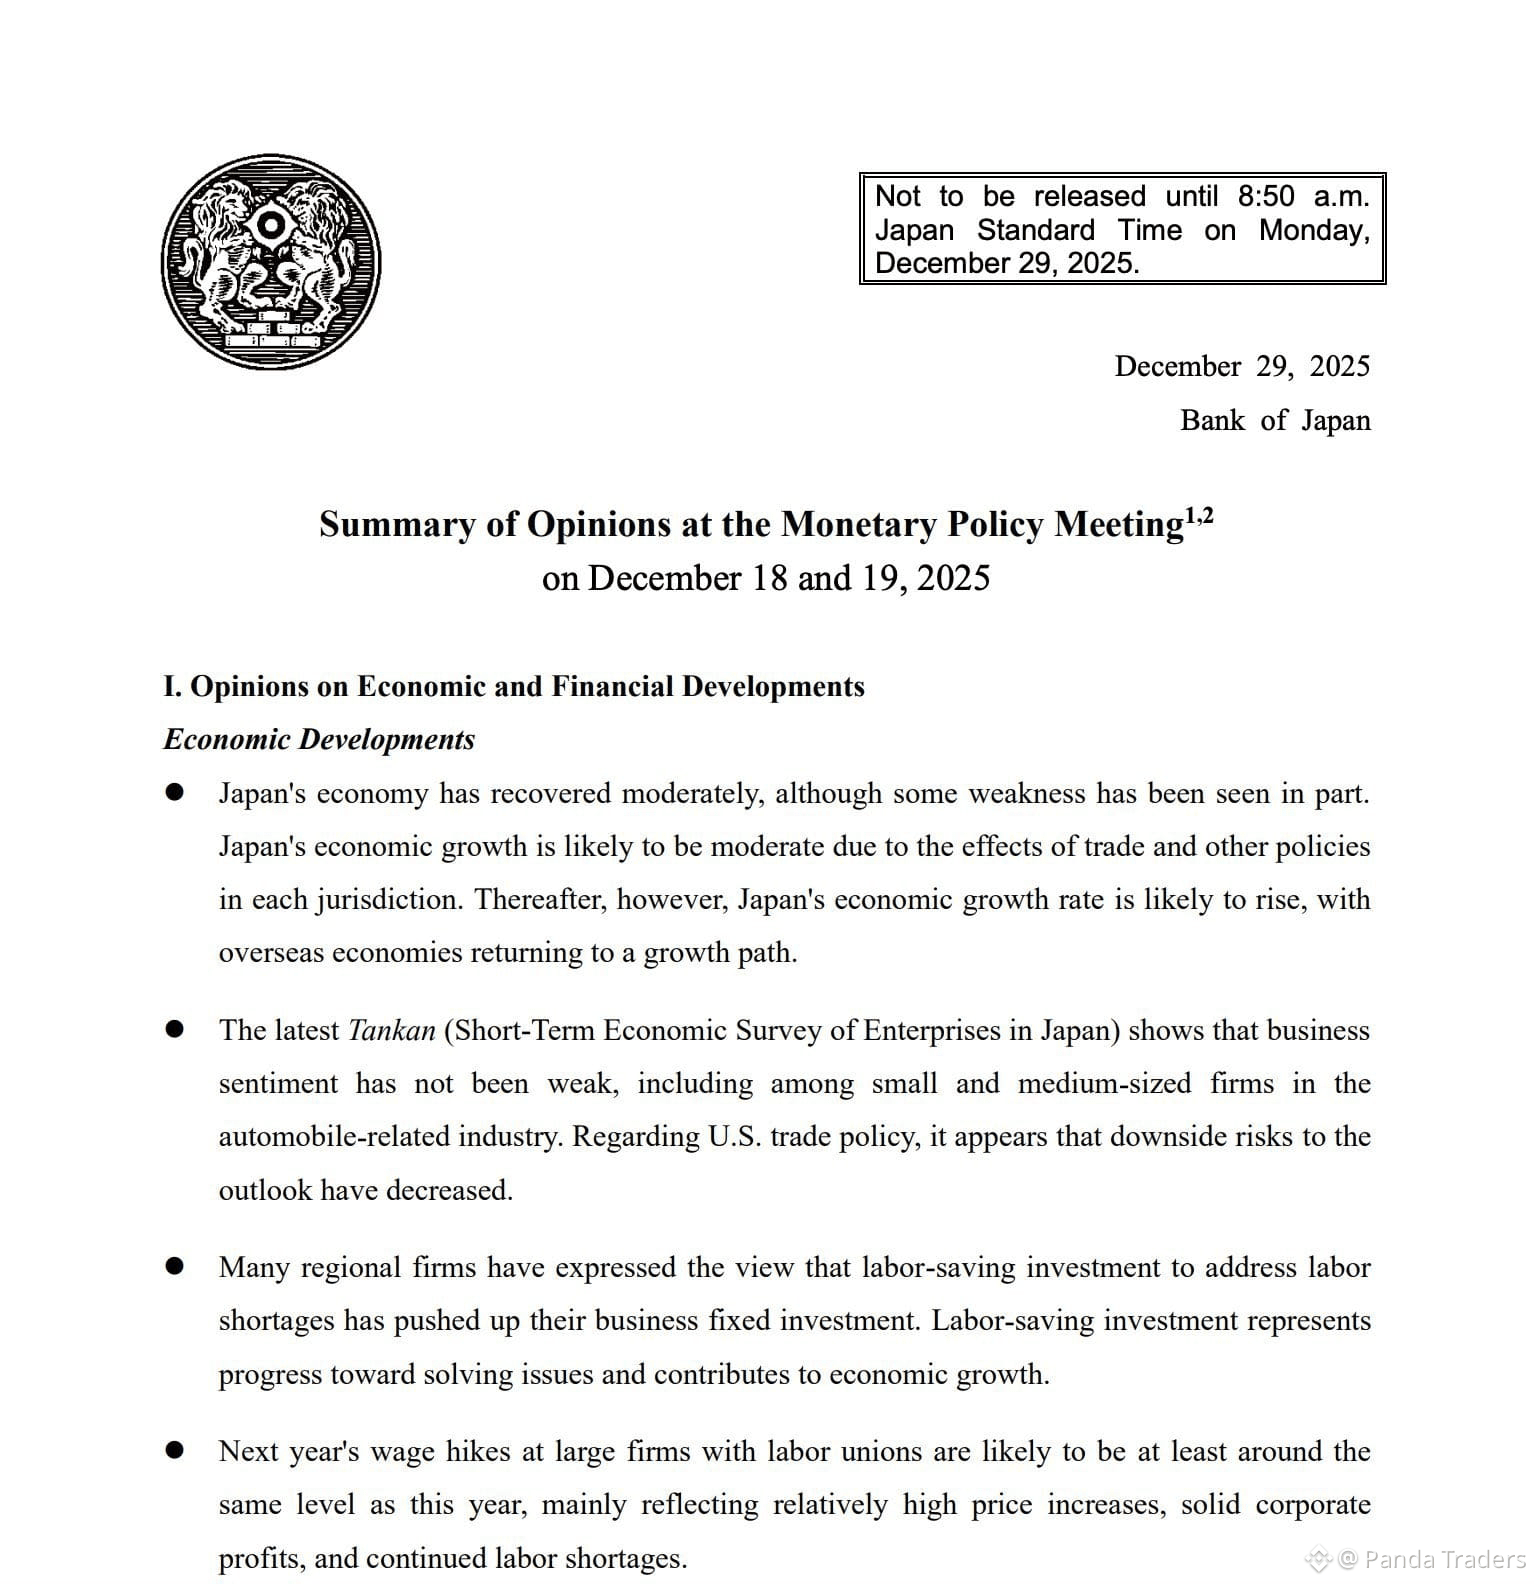
Okkkkkk‼️‼️ BOJ minutes just dropped 🇯🇵😭
they’re saying japan economy is “recovering moderately” business mood still firm labor shortages still there and big companies will keep pushing wage hikes next year too 👀
and you know what that means…
growth + wages = BOJ stays tight rate hike path still alive 😱
so yeah… every BOJ headline is officially a jump scare now
$BTC $ETH $LINK
{future}(LINKUSDT)
{future}(ETHUSDT)
{future}(BTCUSDT)
#BTC90kChristmas #USGDPUpdate #USJobsData #CPIWatch #WriteToEarnUpgrade
Okkkkkk‼️‼️ BOJ minutes just dropped 🇯🇵😭
they’re saying japan economy is “recovering moderately” business mood still firm labor shortages still there and big companies will keep pushing wage hikes next year too 👀
and you know what that means…
growth + wages = BOJ stays tight rate hike path still alive 😱
so yeah… every BOJ headline is officially a jump scare now
$BTC $ETH $LINK
#BTC90kChristmas #USGDPUpdate #USJobsData #CPIWatch #WriteToEarnUpgrade
they’re saying japan economy is “recovering moderately” business mood still firm labor shortages still there and big companies will keep pushing wage hikes next year too 👀
and you know what that means…
growth + wages = BOJ stays tight rate hike path still alive 😱
so yeah… every BOJ headline is officially a jump scare now
$BTC $ETH $LINK
#BTC90kChristmas #USGDPUpdate #USJobsData #CPIWatch #WriteToEarnUpgrade

34
12
30
14.7k


·
--
Bullish
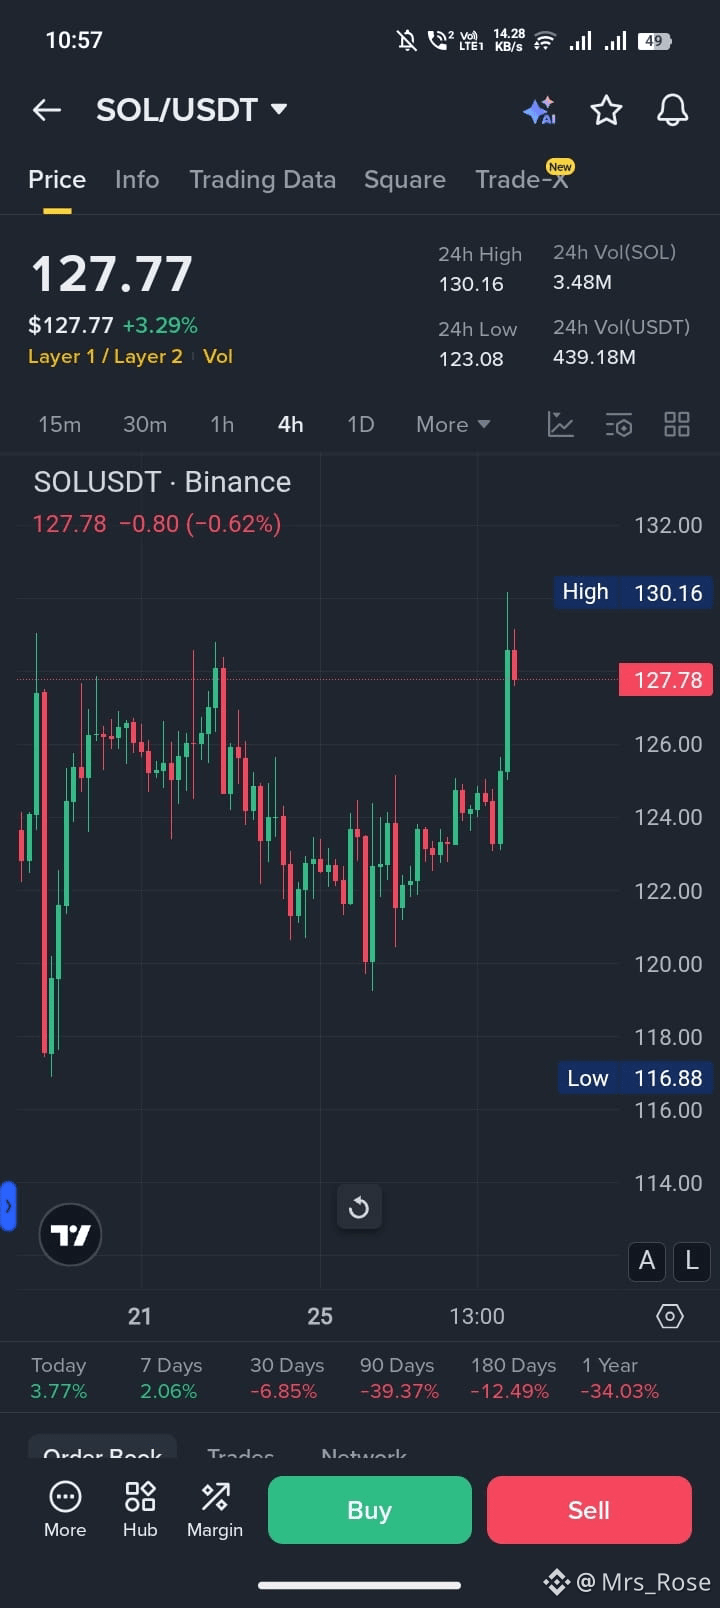
$SOL /USDT BULLISH STRUCTURE HOLDING ABOVE KEY SUPPORT📈💯
SOL continues to trade within a healthy bullish structure after defending its demand zone. The recent pullback was corrective and followed by a steady recovery, showing buyers remain active on dips. As long as price holds above the marked support area, continuation toward higher resistance levels remains the higher probability move.
Targets
TP1: 132
TP2: 138
TP3: 146
Stop Loss
SL below 123
Risk Management
Risk 1 to 2 percent per trade. Take partial profits at first target and move stop to breakeven.
#SOLUSDT #BTC90kChristmas #USGDPUpdate #USJobsData
$SOL /USDT BULLISH STRUCTURE HOLDING ABOVE KEY SUPPORT📈💯
SOL continues to trade within a healthy bullish structure after defending its demand zone. The recent pullback was corrective and followed by a steady recovery, showing buyers remain active on dips. As long as price holds above the marked support area, continuation toward higher resistance levels remains the higher probability move.
Targets
TP1: 132
TP2: 138
TP3: 146
Stop Loss
SL below 123
Risk Management
Risk 1 to 2 percent per trade. Take partial profits at first target and move stop to breakeven.
#SOLUSDT #BTC90kChristmas #USGDPUpdate #USJobsData
SOL continues to trade within a healthy bullish structure after defending its demand zone. The recent pullback was corrective and followed by a steady recovery, showing buyers remain active on dips. As long as price holds above the marked support area, continuation toward higher resistance levels remains the higher probability move.
Targets
TP1: 132
TP2: 138
TP3: 146
Stop Loss
SL below 123
Risk Management
Risk 1 to 2 percent per trade. Take partial profits at first target and move stop to breakeven.
#SOLUSDT #BTC90kChristmas #USGDPUpdate #USJobsData
2
154

·
--
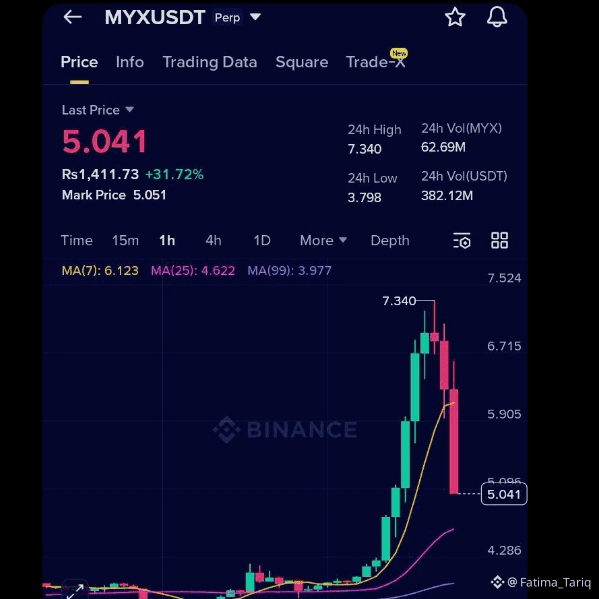
Dear #LearnWithFatima family ! $MYX As it's goes to moon 🌝 now it's time for $MYX to land on earth 🌎 ! Take profits and keep patience ! #MYX #WriteToEarnUpgrade #CPIWatch #USJobsData
Dear #LearnWithFatima family ! $MYX As it's goes to moon 🌝 now it's time for $MYX to land on earth 🌎 ! Take profits and keep patience ! #MYX #WriteToEarnUpgrade #CPIWatch #USJobsData
6
1k

·
--
Bearish
Hello And Welcome Everyone
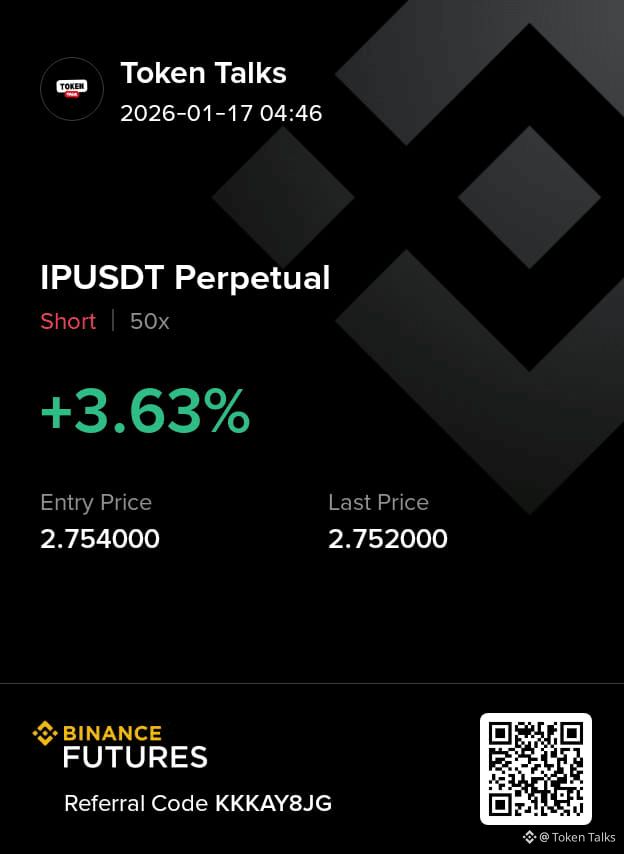
It's time to short $IP coin once again
Entry now like me or wait for 2.80 – 2.88
Take Profit from 2.70 to 2.60
Stop Loss: 2.95
Leverage: 20x – 50x
Margin: 1% – 3%
Risk Tip: Take partial profit at TP1 and move stop-loss to entry.
#USJobsData #BTC100kNext?
Short #IP Here 👇👇
Hello And Welcome Everyone
It's time to short $IP coin once again
Entry now like me or wait for 2.80 – 2.88
Take Profit from 2.70 to 2.60
Stop Loss: 2.95
Leverage: 20x – 50x
Margin: 1% – 3%
Risk Tip: Take partial profit at TP1 and move stop-loss to entry.
#USJobsData #BTC100kNext?
Short #IP Here 👇👇
It's time to short $IP coin once again
Entry now like me or wait for 2.80 – 2.88
Take Profit from 2.70 to 2.60
Stop Loss: 2.95
Leverage: 20x – 50x
Margin: 1% – 3%
Risk Tip: Take partial profit at TP1 and move stop-loss to entry.
#USJobsData #BTC100kNext?
Short #IP Here 👇👇
3
2.6k
Log in to explore more content
Join global crypto users on Binance Square
⚡️ Get latest and useful information about crypto.
💬 Trusted by the world’s largest crypto exchange.
👍 Discover real insights from verified creators.
Email / Phone number
Trending Topics
1
#BinanceRestores28FiatWithdrawals
80 views
19 Discussing
2
#BinanceProcesses$4.65BWithdrawals
58,432 views
252 Discussing
3
#BitcoinDropsBelow$78K
52 views
22 Discussing
4
#EthereumSurpasses$2300
3,083 views
59 Discussing
5
#BitcoinSpotETFsPost$203MWeeklyOutflow
3,776 views
37 Discussing
6
#SouthKoreanLawmakerProposesReviewOfAllListedDigitalAssets
1,512 views
41 Discussing
7
#SolanaMobileRemovesMaliciousSKRClaimApp
1 views
13 Discussing
8
#BrazilVirtualAssetLicenseDeadlineDrawsAbout40Firms
25,241 views
452 Discussing
9
#BTCPayServerUrgesOperatorsToShutDownInstances
19,516 views
366 Discussing
10
#BankOfKoreaSurveysFinancialFirmsOnVirtualAssetRisks
652 views
22 Discussing