#syscoinbridgepausedafterexploit
syscoinbridgepausedafterexploit
58,572 views
475 Discussing
Hot
Latest

$MBOX
{future}(MBOXUSDT)
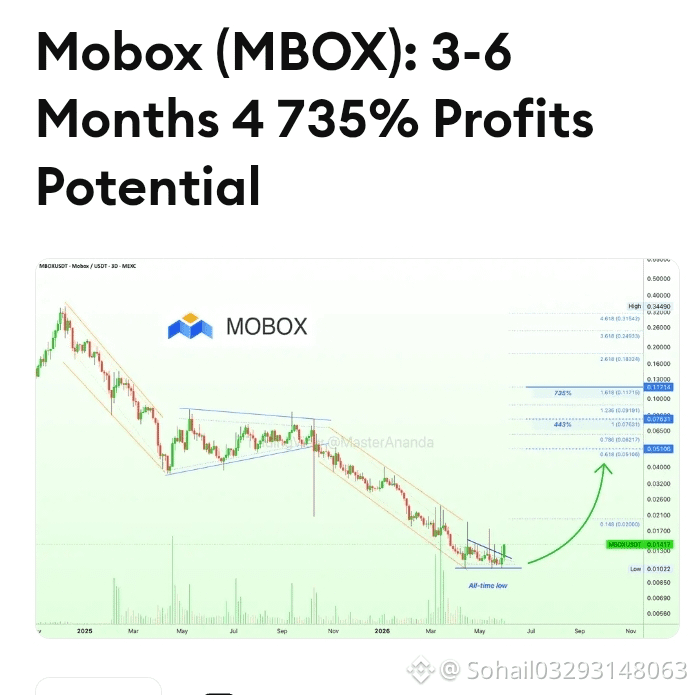
#MBOX Dropping since November 2021; we will focus only on the final down-leg and what the future has in store for us, for the Cryptocurrency market and this project—MBOXUSDT (Mobox).
The downtrend stopped in April 2026 but volume started to rise in March, the highest volume ever, clearly revealing the upcoming bottom. I see a bottom now followed by a bullish breakout, very early.
In April 2025 a very strong increase in trading volume also preceded a change in market behavior. The market changed from downward to sideways. This time from downward to upward is my guess.
There isn't much to speculate here. Once we hit bottom, the only place left to go is up. MBOX crashed and completed a full bearish cycle. This chart and project is now ready to grow. We can expect a massive bullish wave. Something extraordinary—the best ever.
The targets highlighted on the chart are the levels we can expect will be hit within this market phase. This bullish phase can unravel in a period of 3-6 months.
#TrumpSaysIranAttackWillNotAffectUSDeal
#SyscoinBridgePausedAfterExploit
#YugaLabsRescues62NFTsFromFlooringProtocol
#SaylorHintsStrategyBitcoinBuy
$MBOX
#MBOX Dropping since November 2021; we will focus only on the final down-leg and what the future has in store for us, for the Cryptocurrency market and this project—MBOXUSDT (Mobox).
The downtrend stopped in April 2026 but volume started to rise in March, the highest volume ever, clearly revealing the upcoming bottom. I see a bottom now followed by a bullish breakout, very early.
In April 2025 a very strong increase in trading volume also preceded a change in market behavior. The market changed from downward to sideways. This time from downward to upward is my guess.
There isn't much to speculate here. Once we hit bottom, the only place left to go is up. MBOX crashed and completed a full bearish cycle. This chart and project is now ready to grow. We can expect a massive bullish wave. Something extraordinary—the best ever.
The targets highlighted on the chart are the levels we can expect will be hit within this market phase. This bullish phase can unravel in a period of 3-6 months.
#TrumpSaysIranAttackWillNotAffectUSDeal
#SyscoinBridgePausedAfterExploit
#YugaLabsRescues62NFTsFromFlooringProtocol
#SaylorHintsStrategyBitcoinBuy
#MBOX Dropping since November 2021; we will focus only on the final down-leg and what the future has in store for us, for the Cryptocurrency market and this project—MBOXUSDT (Mobox).
The downtrend stopped in April 2026 but volume started to rise in March, the highest volume ever, clearly revealing the upcoming bottom. I see a bottom now followed by a bullish breakout, very early.
In April 2025 a very strong increase in trading volume also preceded a change in market behavior. The market changed from downward to sideways. This time from downward to upward is my guess.
There isn't much to speculate here. Once we hit bottom, the only place left to go is up. MBOX crashed and completed a full bearish cycle. This chart and project is now ready to grow. We can expect a massive bullish wave. Something extraordinary—the best ever.
The targets highlighted on the chart are the levels we can expect will be hit within this market phase. This bullish phase can unravel in a period of 3-6 months.
#TrumpSaysIranAttackWillNotAffectUSDeal
#SyscoinBridgePausedAfterExploit
#YugaLabsRescues62NFTsFromFlooringProtocol
#SaylorHintsStrategyBitcoinBuy
1
506

·
--
Bullish
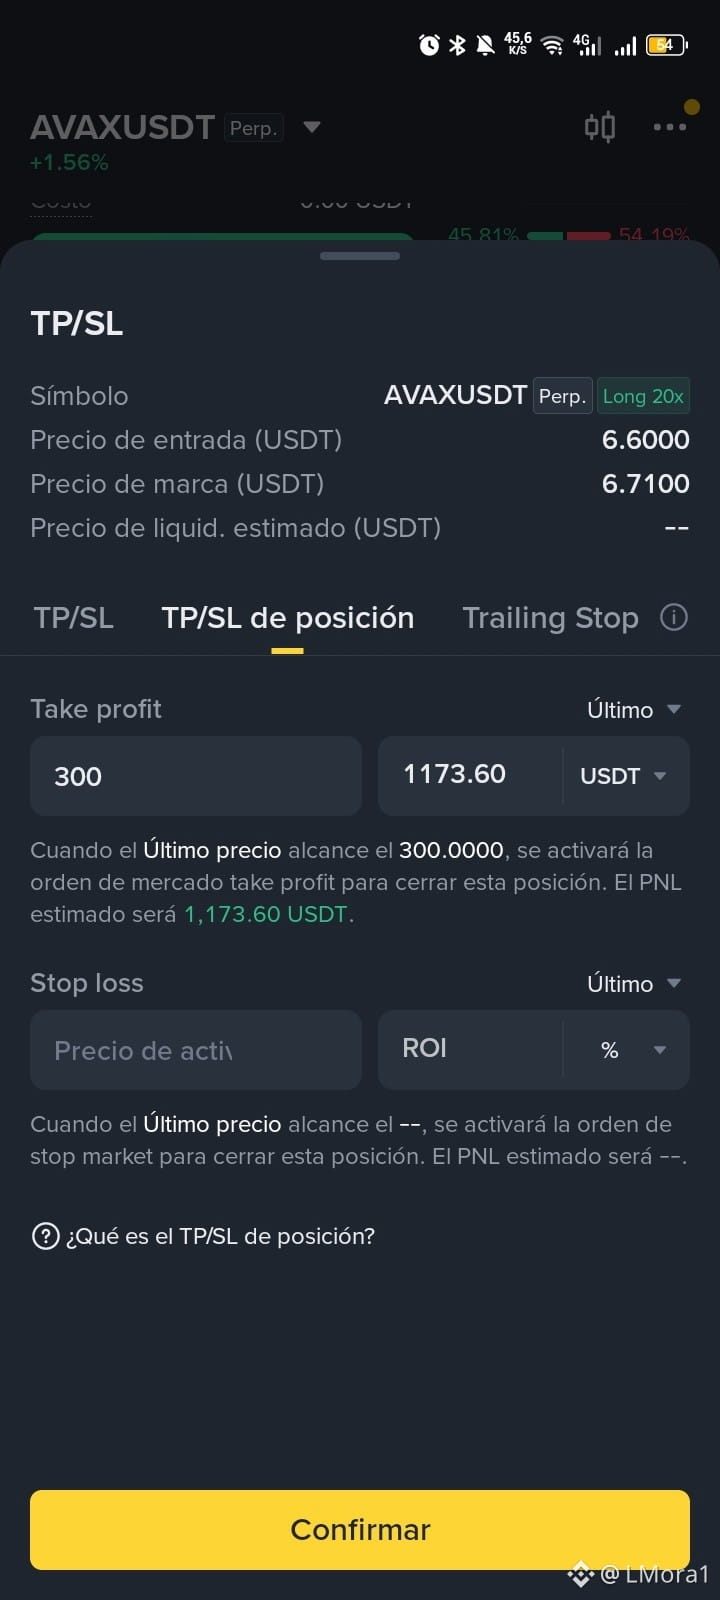
$AVAX One day you'll hit $300 in 2100, but you'll get there 😂😂😂😂#NYJudgePausesDormantBitcoinWalletsLawsuit #IsraelStrikesIranMilitaryTargets #SyscoinBridgePausedAfterExploit
$AVAX One day you'll hit $300 in 2100, but you'll get there 😂😂😂😂#NYJudgePausesDormantBitcoinWalletsLawsuit #IsraelStrikesIranMilitaryTargets #SyscoinBridgePausedAfterExploit
5
2.9k

·
--
Bullish
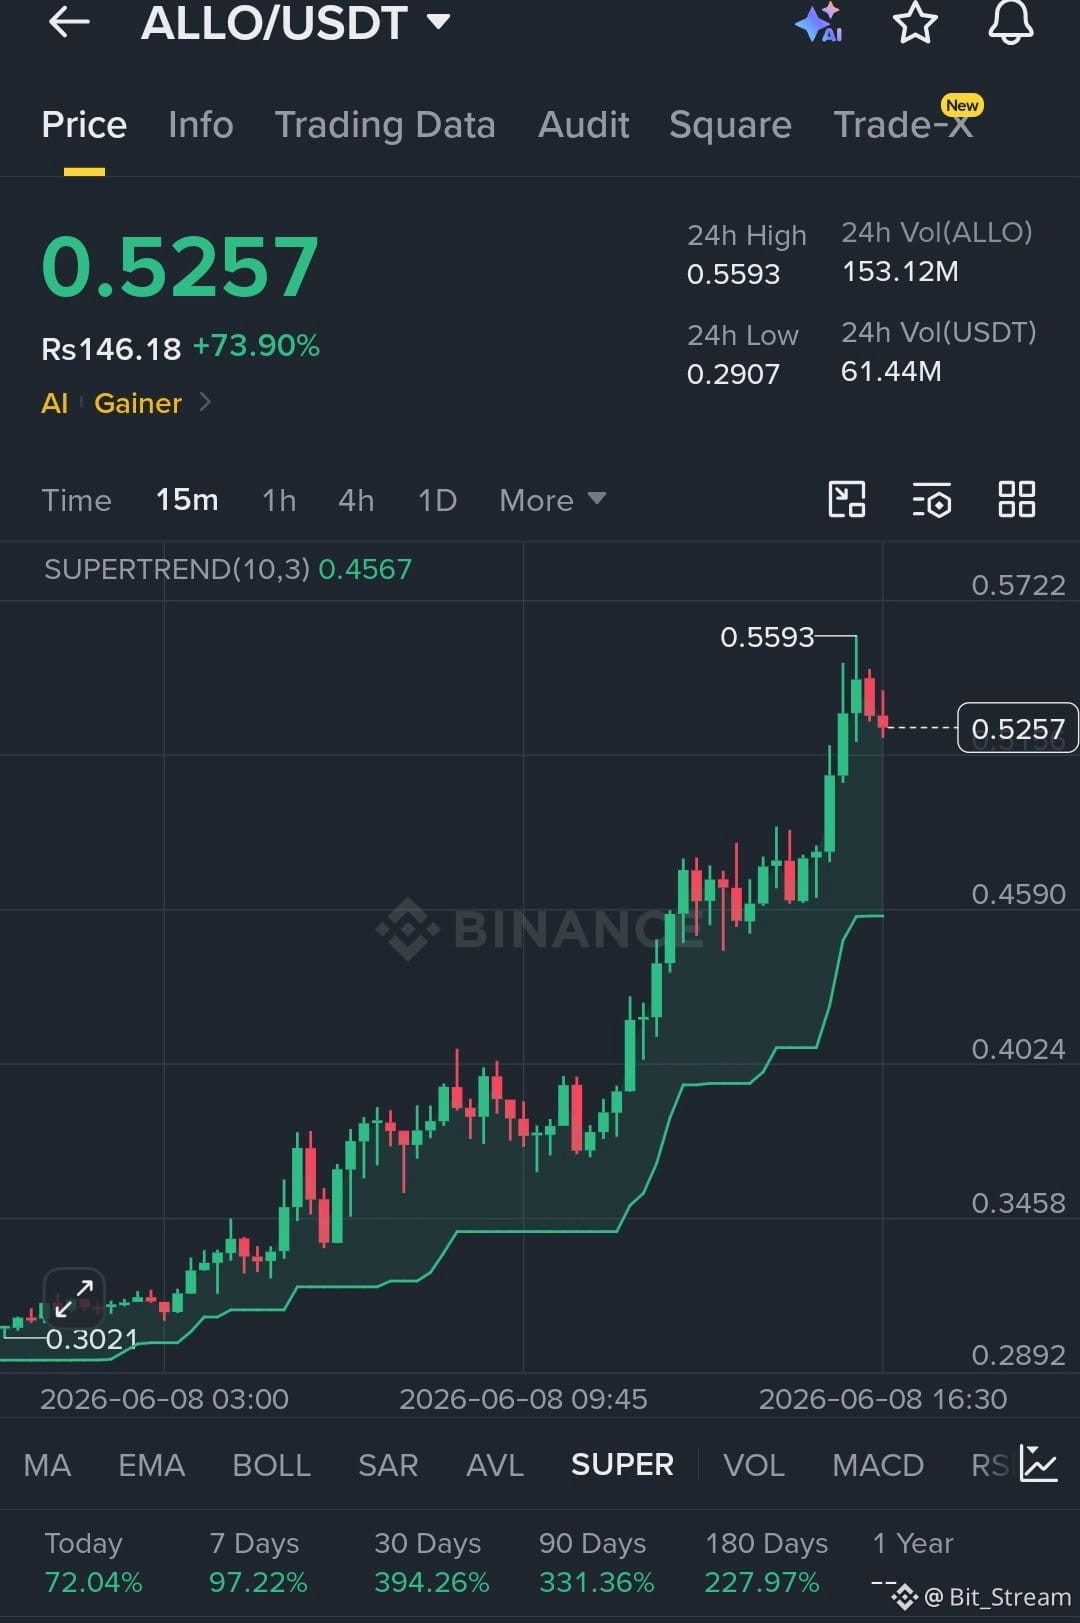
$ALLO Strong Bullish Continuation Setup
Buy Zone: 0.5000 – 0.5300
TP1: 0.5800
TP2: 0.6500
TP3: 0.7200
Stop Loss: 0.4600
Momentum remains bullish with buyers in control. Holding above breakout zone keeps trend continuation toward higher targets in play.
{spot}(ALLOUSDT)
#NYJudgePausesDormantBitcoinWalletsLawsuit #IsraelStrikesIranMilitaryTargets #YugaLabsRescues62NFTsFromFlooringProtocol #SyscoinBridgePausedAfterExploit #TrumpSaysIranAttackWillNotAffectUSDeal
$ALLO Strong Bullish Continuation Setup
Buy Zone: 0.5000 – 0.5300
TP1: 0.5800
TP2: 0.6500
TP3: 0.7200
Stop Loss: 0.4600
Momentum remains bullish with buyers in control. Holding above breakout zone keeps trend continuation toward higher targets in play.
#NYJudgePausesDormantBitcoinWalletsLawsuit #IsraelStrikesIranMilitaryTargets #YugaLabsRescues62NFTsFromFlooringProtocol #SyscoinBridgePausedAfterExploit #TrumpSaysIranAttackWillNotAffectUSDeal
Buy Zone: 0.5000 – 0.5300
TP1: 0.5800
TP2: 0.6500
TP3: 0.7200
Stop Loss: 0.4600
Momentum remains bullish with buyers in control. Holding above breakout zone keeps trend continuation toward higher targets in play.
#NYJudgePausesDormantBitcoinWalletsLawsuit #IsraelStrikesIranMilitaryTargets #YugaLabsRescues62NFTsFromFlooringProtocol #SyscoinBridgePausedAfterExploit #TrumpSaysIranAttackWillNotAffectUSDeal
281



·
--
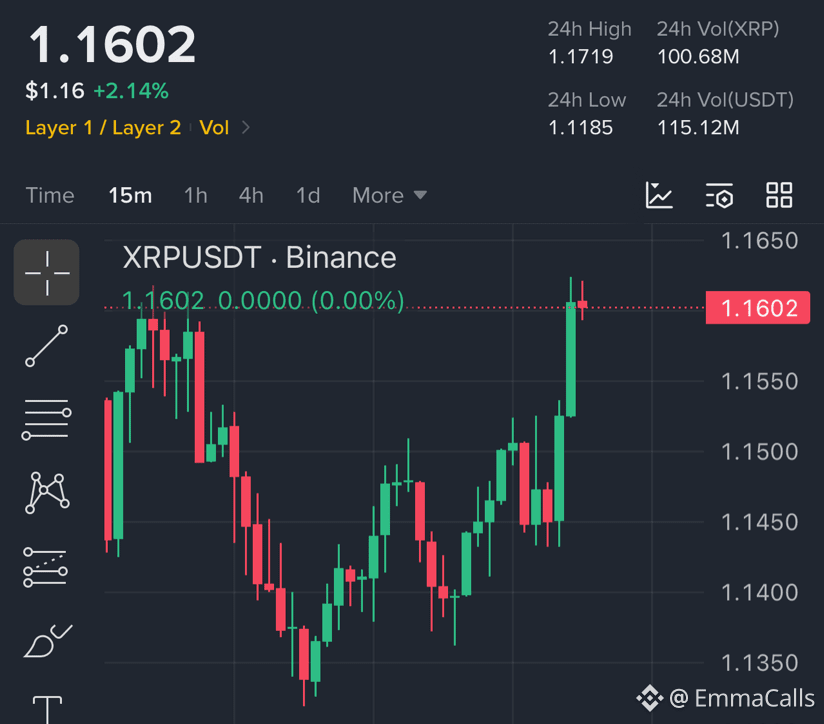
$XRP Breakout Loading
Entry Zone: $1.150 - $1.160
TP1: $1.190
TP2: $1.220
TP3: $1.280
SL: $1.130**
#SaylorHintsStrategyBitcoinBuy #SyscoinBridgePausedAfterExploit
{spot}(XRPUSDT)
$XRP Breakout Loading
Entry Zone: $1.150 - $1.160
TP1: $1.190
TP2: $1.220
TP3: $1.280
SL: $1.130**
#SaylorHintsStrategyBitcoinBuy #SyscoinBridgePausedAfterExploit
Entry Zone: $1.150 - $1.160
TP1: $1.190
TP2: $1.220
TP3: $1.280
SL: $1.130**
#SaylorHintsStrategyBitcoinBuy #SyscoinBridgePausedAfterExploit
57

·
--
$FIL
LONG
Entry: 0.765188
✋️SL: 0.734574
🫰0.794378
🫰0.811465
🫰0.837095
Trade from here👇
{future}(FILUSDT)
BitcoinBreaksAbove$63K#SaylorHintsStrategyBitcoinBuy #YugaLabsRescues62NFTsFromFlooringProtocol #SyscoinBridgePausedAfterExploit #TrumpSaysIranAttackWillNotAffectUSDeal #IranStrikesIsraelOilPriceRises
$FIL
LONG
Entry: 0.765188
✋️SL: 0.734574
🫰0.794378
🫰0.811465
🫰0.837095
Trade from here👇
BitcoinBreaksAbove$63K#SaylorHintsStrategyBitcoinBuy #YugaLabsRescues62NFTsFromFlooringProtocol #SyscoinBridgePausedAfterExploit #TrumpSaysIranAttackWillNotAffectUSDeal #IranStrikesIsraelOilPriceRises
LONG
Entry: 0.765188
✋️SL: 0.734574
🫰0.794378
🫰0.811465
🫰0.837095
Trade from here👇
BitcoinBreaksAbove$63K#SaylorHintsStrategyBitcoinBuy #YugaLabsRescues62NFTsFromFlooringProtocol #SyscoinBridgePausedAfterExploit #TrumpSaysIranAttackWillNotAffectUSDeal #IranStrikesIsraelOilPriceRises
1
180

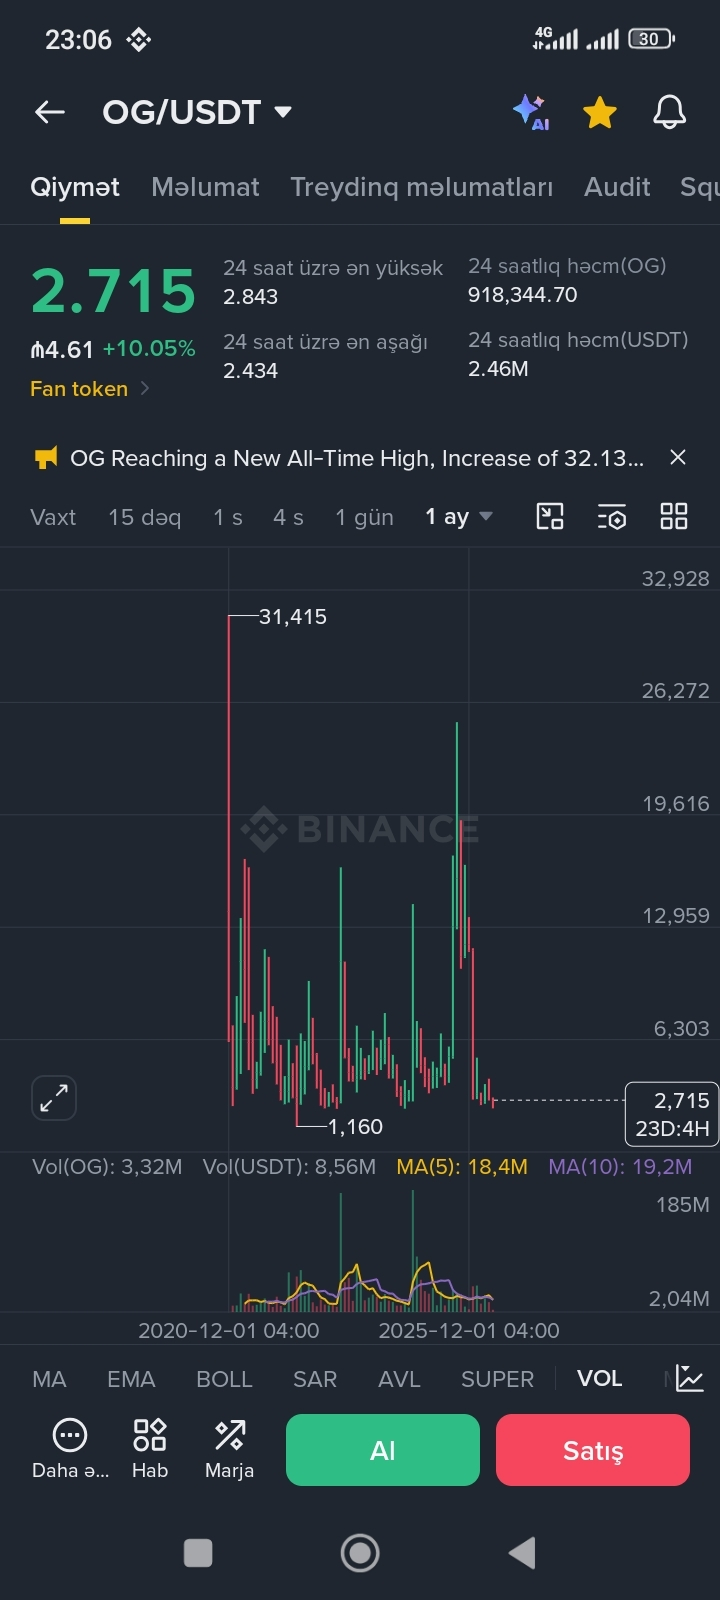
Is the price of #TicarətləriniziPaylaşın $OG #SyscoinBridgePausedAfterExploit #IranStrikesIsraelOilPriceRises #VietnamPlansCryptoAssetTradingPilot #JPMorganBofACitiPlanTokenizedDepositNetwork og going to pump back up to 25 bucks? That's a potential 10x gain!
Is the price of #TicarətləriniziPaylaşın $OG #SyscoinBridgePausedAfterExploit #IranStrikesIsraelOilPriceRises #VietnamPlansCryptoAssetTradingPilot #JPMorganBofACitiPlanTokenizedDepositNetwork og going to pump back up to 25 bucks? That's a potential 10x gain!
183


·
--
Bullish
#NYJudgePausesDormantBitcoinWalletsLawsuit BitcoinBreaksAbove$63K#IsraelStrikesIranMilitaryTargets #SaylorHintsStrategyBitcoinBuy #SyscoinBridgePausedAfterExploit #bedrock $BR
$BTC $ETH
#NYJudgePausesDormantBitcoinWalletsLawsuit BitcoinBreaksAbove$63K#IsraelStrikesIranMilitaryTargets #SaylorHintsStrategyBitcoinBuy #SyscoinBridgePausedAfterExploit #bedrock $BR
$BTC $ETH
$BTC $ETH

Best wishes
From free_earn_
2
32

·
--
Bullish
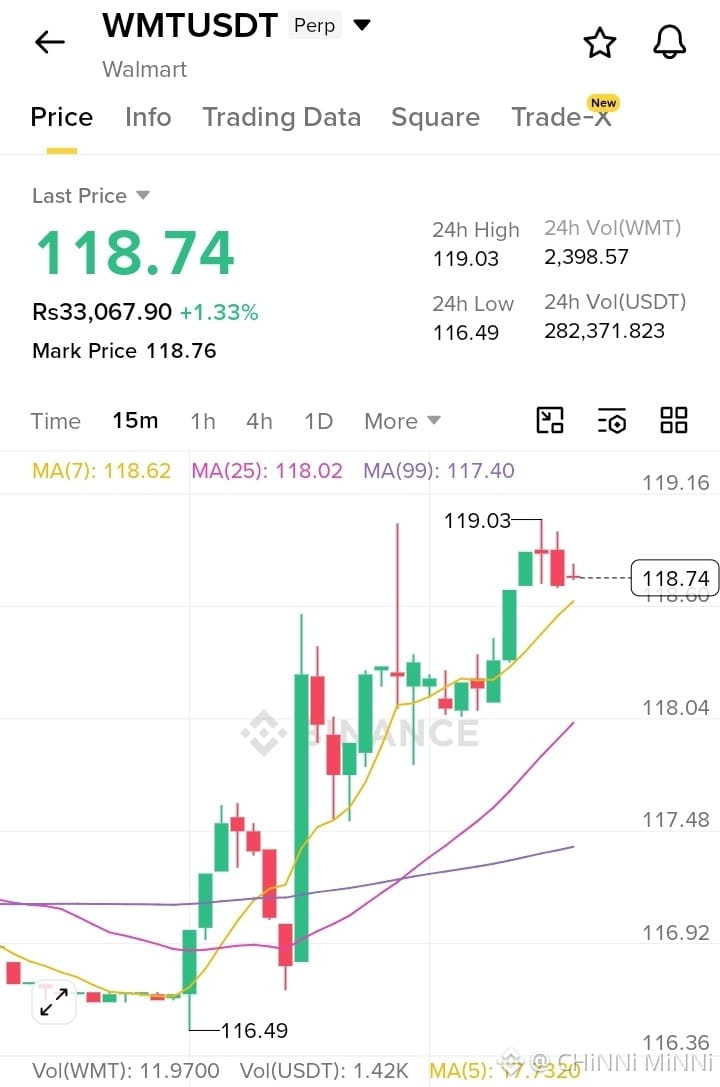
🚀 $WMT USDT PERP | Bulls Still in Control?
WMT is trading at 118.74 USDT (+1.33%) after a strong intraday rally from the 116.49 low to a 119.03 high. The 15-minute chart shows a clear bullish structure with price holding above all key moving averages:
• MA(7): 118.62
• MA(25): 118.02
• MA(99): 117.40
The trend remains positive as long as price stays above 118.00. Buyers defended every dip and pushed WMT close to the session high, signaling strong momentum.
Key Levels 🟢 Support: 118.00 – 118.20
🟢 Major Support: 117.40
🔴 Resistance: 119.03
🔴 Breakout Target: 120.00+
A clean break above 119.03 could trigger another wave of buying and open the door toward the psychological 120 USDT level. However, failure to hold 118.00 may invite short-term profit-taking.
Volume remains healthy, and the market structure favors bulls for now. The next few candles around resistance could decide whether WMT explodes into a fresh breakout or pauses for consolidation.
Eyes on 119.03 — the next move could be explosive. 🔥📈
{future}(WMTUSDT)
#SaylorHintsStrategyBitcoinBuy
#SyscoinBridgePausedAfterExploit
#IranStrikesIsraelOilPriceRises
#ECBExpectedToRaiseRates25Bps
🚀 $WMT USDT PERP | Bulls Still in Control?
WMT is trading at 118.74 USDT (+1.33%) after a strong intraday rally from the 116.49 low to a 119.03 high. The 15-minute chart shows a clear bullish structure with price holding above all key moving averages:
• MA(7): 118.62
• MA(25): 118.02
• MA(99): 117.40
The trend remains positive as long as price stays above 118.00. Buyers defended every dip and pushed WMT close to the session high, signaling strong momentum.
Key Levels 🟢 Support: 118.00 – 118.20
🟢 Major Support: 117.40
🔴 Resistance: 119.03
🔴 Breakout Target: 120.00+
A clean break above 119.03 could trigger another wave of buying and open the door toward the psychological 120 USDT level. However, failure to hold 118.00 may invite short-term profit-taking.
Volume remains healthy, and the market structure favors bulls for now. The next few candles around resistance could decide whether WMT explodes into a fresh breakout or pauses for consolidation.
Eyes on 119.03 — the next move could be explosive. 🔥📈
#SaylorHintsStrategyBitcoinBuy
#SyscoinBridgePausedAfterExploit
#IranStrikesIsraelOilPriceRises
#ECBExpectedToRaiseRates25Bps
WMT is trading at 118.74 USDT (+1.33%) after a strong intraday rally from the 116.49 low to a 119.03 high. The 15-minute chart shows a clear bullish structure with price holding above all key moving averages:
• MA(7): 118.62
• MA(25): 118.02
• MA(99): 117.40
The trend remains positive as long as price stays above 118.00. Buyers defended every dip and pushed WMT close to the session high, signaling strong momentum.
Key Levels 🟢 Support: 118.00 – 118.20
🟢 Major Support: 117.40
🔴 Resistance: 119.03
🔴 Breakout Target: 120.00+
A clean break above 119.03 could trigger another wave of buying and open the door toward the psychological 120 USDT level. However, failure to hold 118.00 may invite short-term profit-taking.
Volume remains healthy, and the market structure favors bulls for now. The next few candles around resistance could decide whether WMT explodes into a fresh breakout or pauses for consolidation.
Eyes on 119.03 — the next move could be explosive. 🔥📈
#SaylorHintsStrategyBitcoinBuy
#SyscoinBridgePausedAfterExploit
#IranStrikesIsraelOilPriceRises
#ECBExpectedToRaiseRates25Bps
2
129

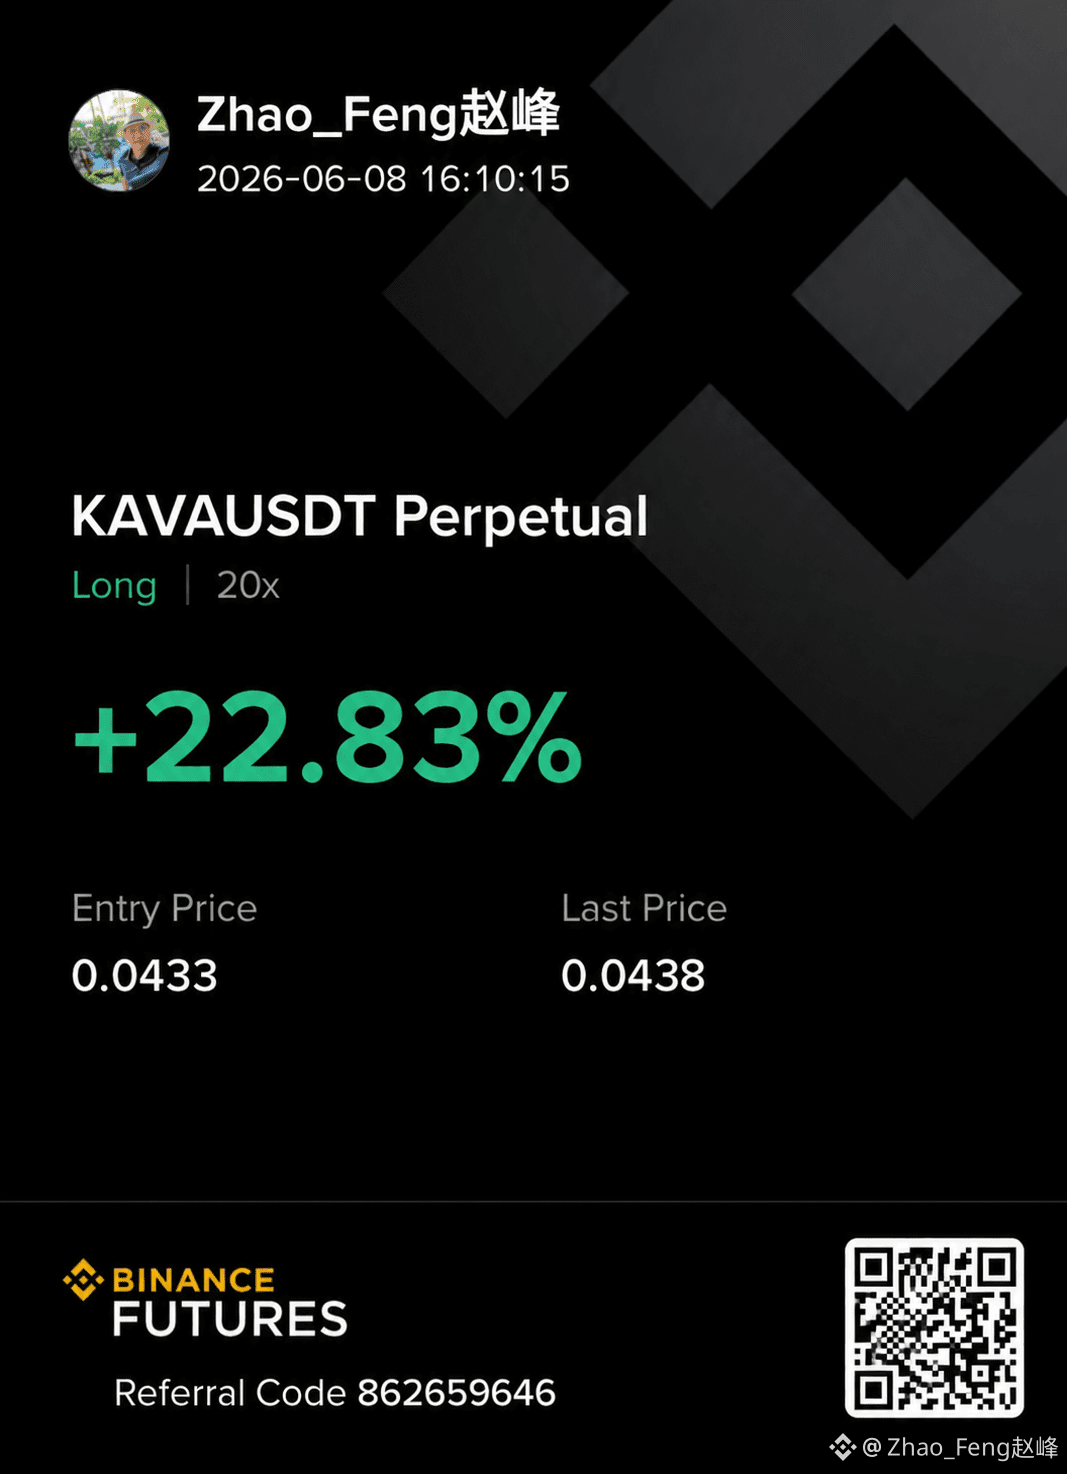
🚨 $KAVA is starting to wake up.
After weeks of pressure, buyers are finally stepping back in and the chart is showing signs of a potential trend reversal. The structure is slowly shifting from defensive to bullish, and momentum is building where it matters most.
🎯 Long Zone: 0.0430 – 0.0440
🎯 Targets: 0.0460 → 0.0500 → 0.0560
🛑 Risk Level: 0.0400
If this recovery continues, the move could accelerate fast. Keeping $KAVA on the watchlist—sometimes the biggest opportunities appear when the crowd is still looking the other way. 👀🔥
#SyscoinBridgePausedAfterExploit #YugaLabsRescues62NFTsFromFlooringProtocol #SaylorHintsStrategyBitcoinBuy #IsraelStrikesIranMilitaryTargets #NYJudgePausesDormantBitcoinWalletsLawsuit
🚨 $KAVA is starting to wake up.
After weeks of pressure, buyers are finally stepping back in and the chart is showing signs of a potential trend reversal. The structure is slowly shifting from defensive to bullish, and momentum is building where it matters most.
🎯 Long Zone: 0.0430 – 0.0440
🎯 Targets: 0.0460 → 0.0500 → 0.0560
🛑 Risk Level: 0.0400
If this recovery continues, the move could accelerate fast. Keeping $KAVA on the watchlist—sometimes the biggest opportunities appear when the crowd is still looking the other way. 👀🔥
#SyscoinBridgePausedAfterExploit #YugaLabsRescues62NFTsFromFlooringProtocol #SaylorHintsStrategyBitcoinBuy #IsraelStrikesIranMilitaryTargets #NYJudgePausesDormantBitcoinWalletsLawsuit
After weeks of pressure, buyers are finally stepping back in and the chart is showing signs of a potential trend reversal. The structure is slowly shifting from defensive to bullish, and momentum is building where it matters most.
🎯 Long Zone: 0.0430 – 0.0440
🎯 Targets: 0.0460 → 0.0500 → 0.0560
🛑 Risk Level: 0.0400
If this recovery continues, the move could accelerate fast. Keeping $KAVA on the watchlist—sometimes the biggest opportunities appear when the crowd is still looking the other way. 👀🔥
#SyscoinBridgePausedAfterExploit #YugaLabsRescues62NFTsFromFlooringProtocol #SaylorHintsStrategyBitcoinBuy #IsraelStrikesIranMilitaryTargets #NYJudgePausesDormantBitcoinWalletsLawsuit
234


Article
📢 Direct & News-Focused🚨 Former FTX CEO Sam Bankman-Fried (SBF) has officially submitted a pardon request to Donald Trump. Earlier in January, Trump stated in a New York Times interview that he did not intend to pardon Bankman-Fried. In late February, the White House reiterated that Trump had no plans to grant a pardon to SBF.
#SaylorHintsStrategyBitcoinBuy
#KOSPIDropsOver8PctTradingHalt #SyscoinBridgePausedAfterExploit
📢 Direct & News-Focused
🚨 Former FTX CEO Sam Bankman-Fried (SBF) has officially submitted a pardon request to Donald Trump. Earlier in January, Trump stated in a New York Times interview that he did not intend to pardon Bankman-Fried. In late February, the White House reiterated that Trump had no plans to grant a pardon to SBF.
#SaylorHintsStrategyBitcoinBuy
#KOSPIDropsOver8PctTradingHalt #SyscoinBridgePausedAfterExploit
#SaylorHintsStrategyBitcoinBuy
#KOSPIDropsOver8PctTradingHalt #SyscoinBridgePausedAfterExploit
1
236

·
--
#SyscoinBridgePausedAfterExploit
Goldman Sachs believes that the robust labor market delays rate cuts to 2027, hike probability at 20%.
$SYS
$DEXE
$ENA
#SyscoinBridgePausedAfterExploit
Goldman Sachs believes that the robust labor market delays rate cuts to 2027, hike probability at 20%.
$SYS
$DEXE
$ENA
Goldman Sachs believes that the robust labor market delays rate cuts to 2027, hike probability at 20%.
$SYS
$DEXE
$ENA
203
📈 $BTC is trading around $63,000–$64,000 today, showing a recovery after recently testing the $60,000 support zone. Market sentiment has improved slightly as buyers stepped back into the market.
#IsraelStrikesIranMilitaryTargets
#SaylorHintsStrategyBitcoinBuy
#SyscoinBridgePausedAfterExploit
#TrumpSaysIranAttackWillNotAffectUSDeal
{spot}(BTCUSDT)
📈 $BTC is trading around $63,000–$64,000 today, showing a recovery after recently testing the $60,000 support zone. Market sentiment has improved slightly as buyers stepped back into the market.
#IsraelStrikesIranMilitaryTargets
#SaylorHintsStrategyBitcoinBuy
#SyscoinBridgePausedAfterExploit
#TrumpSaysIranAttackWillNotAffectUSDeal
#IsraelStrikesIranMilitaryTargets
#SaylorHintsStrategyBitcoinBuy
#SyscoinBridgePausedAfterExploit
#TrumpSaysIranAttackWillNotAffectUSDeal

108

·
--
Bullish
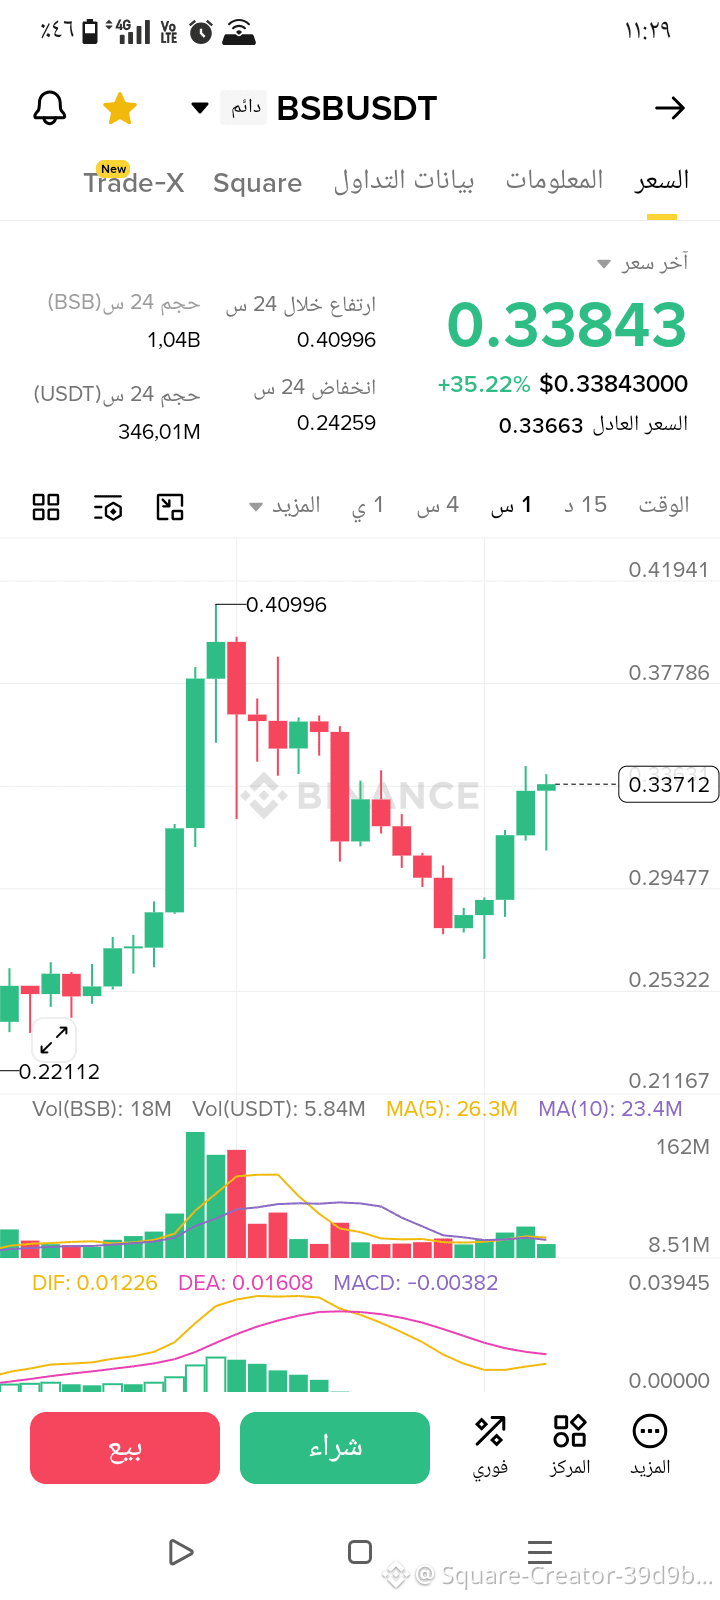
It's time for a quick buy 🚴🏃
The rally is super strong for $BSB 🔥😱
Momentum is back in full force and trading volume is clearly on the rise, with the market eyeing new breakouts that could push the price to higher levels soon 📈
Coinfomania +1
Seize this opportunity and jump in for a buy right here 👇
$BSB
{future}(BSBUSDT)
#SyscoinBridgePausedAfterExploit #YugaLabsRescues62NFTsFromFlooringProtocol #IsraelStrikesIranMilitaryTargets
It's time for a quick buy 🚴🏃
The rally is super strong for $BSB 🔥😱
Momentum is back in full force and trading volume is clearly on the rise, with the market eyeing new breakouts that could push the price to higher levels soon 📈
Coinfomania +1
Seize this opportunity and jump in for a buy right here 👇
$BSB
#SyscoinBridgePausedAfterExploit #YugaLabsRescues62NFTsFromFlooringProtocol #IsraelStrikesIranMilitaryTargets
The rally is super strong for $BSB 🔥😱
Momentum is back in full force and trading volume is clearly on the rise, with the market eyeing new breakouts that could push the price to higher levels soon 📈
Coinfomania +1
Seize this opportunity and jump in for a buy right here 👇
$BSB
#SyscoinBridgePausedAfterExploit #YugaLabsRescues62NFTsFromFlooringProtocol #IsraelStrikesIranMilitaryTargets
3
1.6k

·
--
Bullish
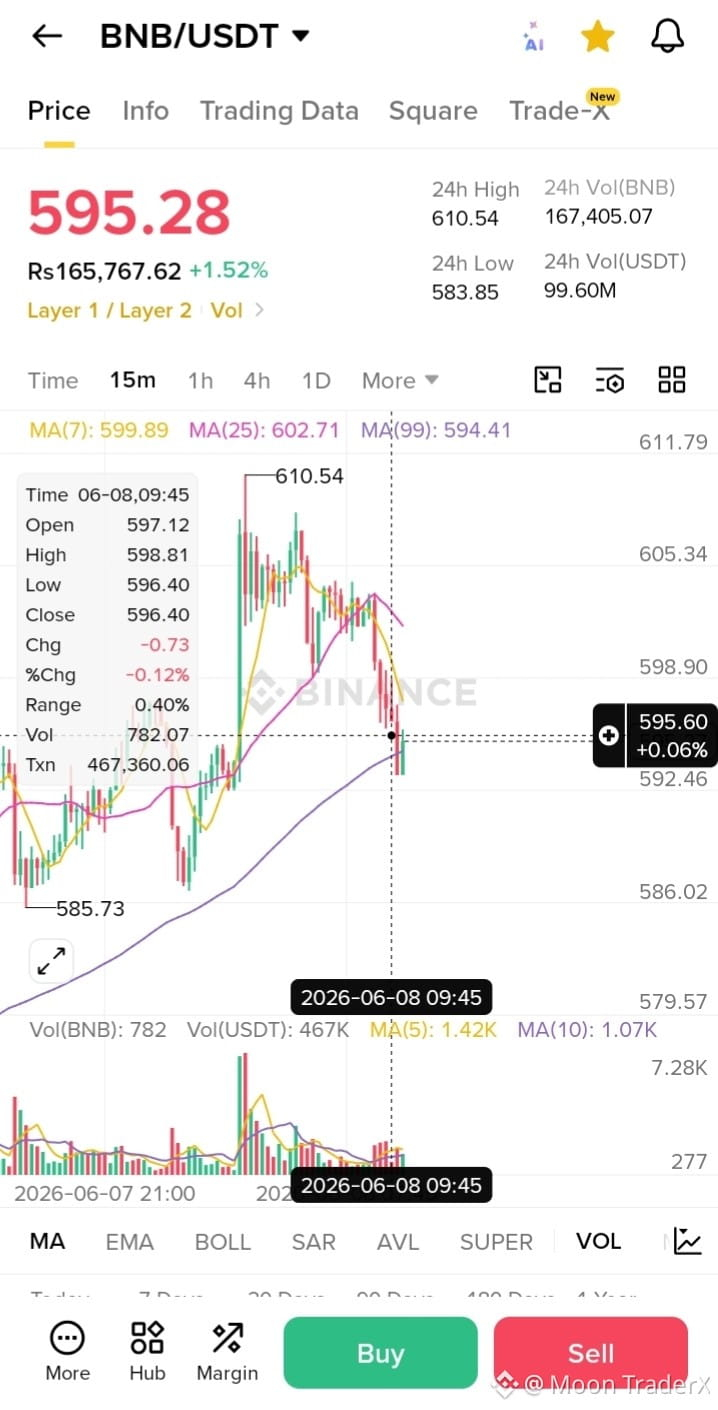
🚨 $BNB looking ready for a violent move!
After touching the $610 zone,$BNB BNB saw a sharp pullback — but buyers are stepping back in around the MA99 support. 👀
⚡ If bulls reclaim $600+, momentum could explode fast toward the previous highs.
📉 Weak hands got shaken out… now the market waits for the next breakout candle.
🔥 Smart money watches support.
🔥 Retail chases green candles.
🔥 Which side are you on?$BNB
{spot}(BNBUSDT)
#SyscoinBridgePausedAfterExploit
🚨 $BNB looking ready for a violent move!
After touching the $610 zone,$BNB BNB saw a sharp pullback — but buyers are stepping back in around the MA99 support. 👀
⚡ If bulls reclaim $600+, momentum could explode fast toward the previous highs.
📉 Weak hands got shaken out… now the market waits for the next breakout candle.
🔥 Smart money watches support.
🔥 Retail chases green candles.
🔥 Which side are you on?$BNB
#SyscoinBridgePausedAfterExploit
After touching the $610 zone,$BNB BNB saw a sharp pullback — but buyers are stepping back in around the MA99 support. 👀
⚡ If bulls reclaim $600+, momentum could explode fast toward the previous highs.
📉 Weak hands got shaken out… now the market waits for the next breakout candle.
🔥 Smart money watches support.
🔥 Retail chases green candles.
🔥 Which side are you on?$BNB
#SyscoinBridgePausedAfterExploit
1
201

·
--
Bullish
Green is green. Take what the market gives you.
$BNB "+0.51% green — bnb is bnb-ing up."
Entry: 596.5 – 598.5
SL: 594.0
TP1: 601.0 / TP2: 603.5 / TP3: 607.0
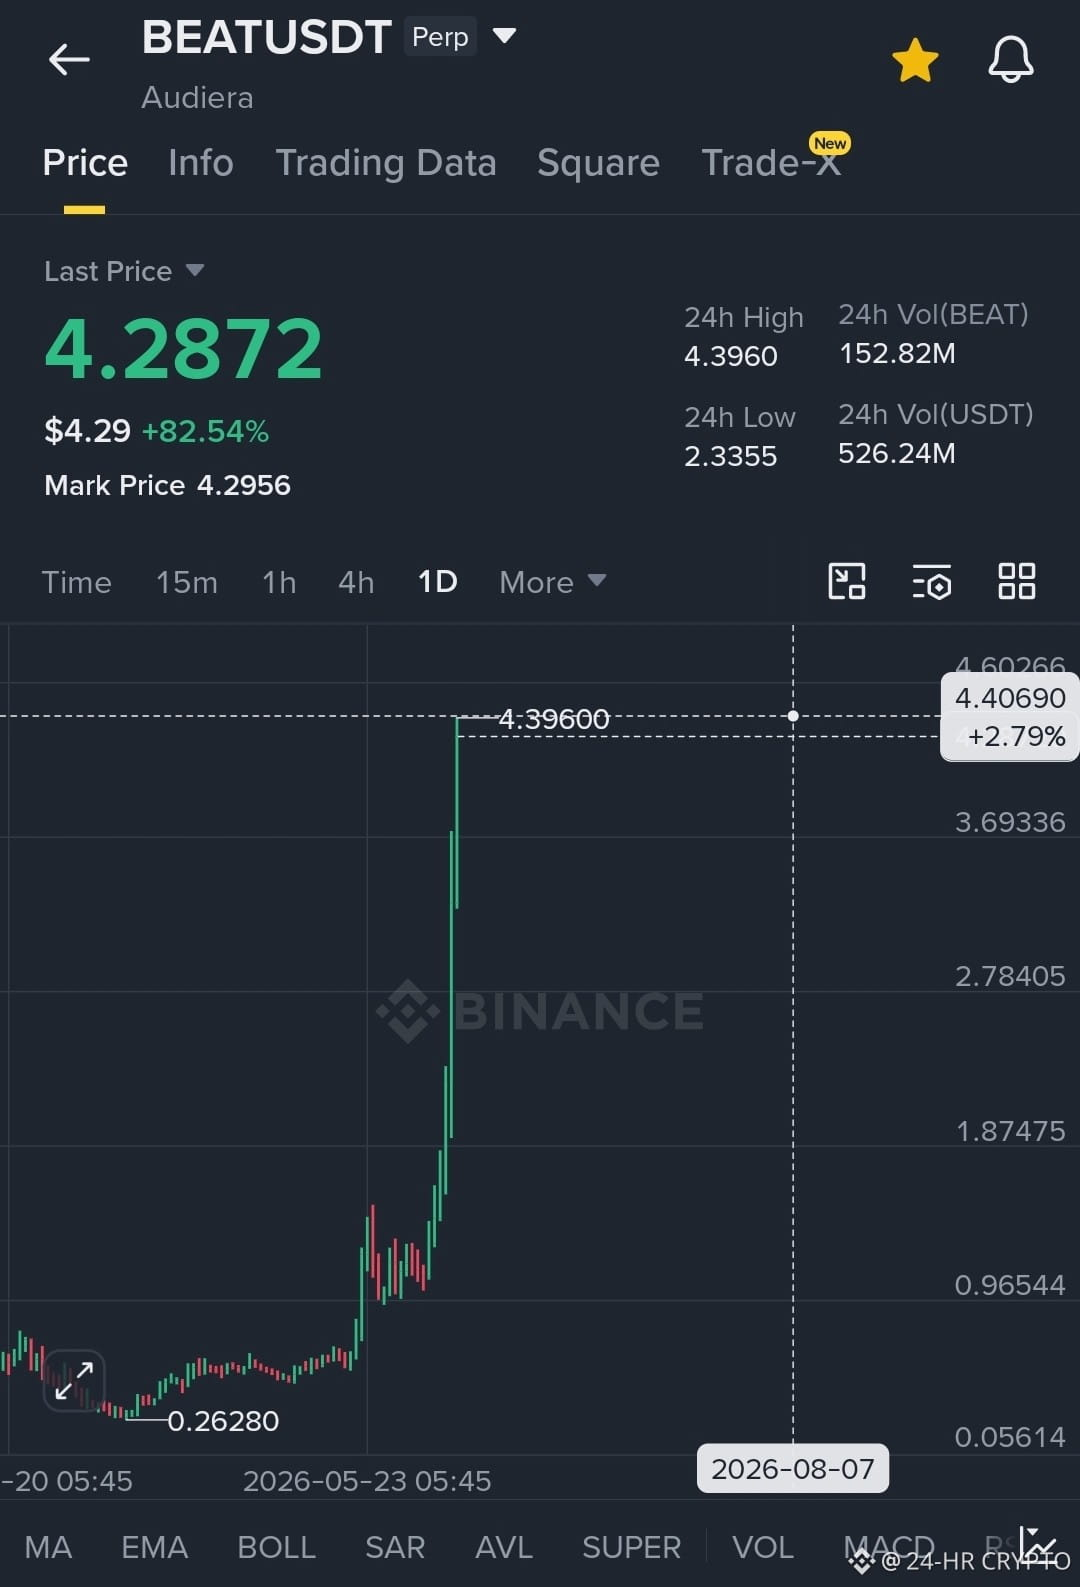
$BEAT $ESPORTS
#NYJudgePausesDormantBitcoinWalletsLawsuit
#YugaLabsRescues62NFTsFromFlooringProtocol
#SaylorHintsStrategyBitcoinBuy
#SyscoinBridgePausedAfterExploit
#SyscoinBridgePausedAfterExploit
Green is green. Take what the market gives you.
$BNB "+0.51% green — bnb is bnb-ing up."
Entry: 596.5 – 598.5
SL: 594.0
TP1: 601.0 / TP2: 603.5 / TP3: 607.0
$BEAT $ESPORTS
#NYJudgePausesDormantBitcoinWalletsLawsuit
#YugaLabsRescues62NFTsFromFlooringProtocol
#SaylorHintsStrategyBitcoinBuy
#SyscoinBridgePausedAfterExploit
#SyscoinBridgePausedAfterExploit
$BNB "+0.51% green — bnb is bnb-ing up."
Entry: 596.5 – 598.5
SL: 594.0
TP1: 601.0 / TP2: 603.5 / TP3: 607.0
$BEAT $ESPORTS
#NYJudgePausesDormantBitcoinWalletsLawsuit
#YugaLabsRescues62NFTsFromFlooringProtocol
#SaylorHintsStrategyBitcoinBuy
#SyscoinBridgePausedAfterExploit
#SyscoinBridgePausedAfterExploit
314
·
--
Bullish
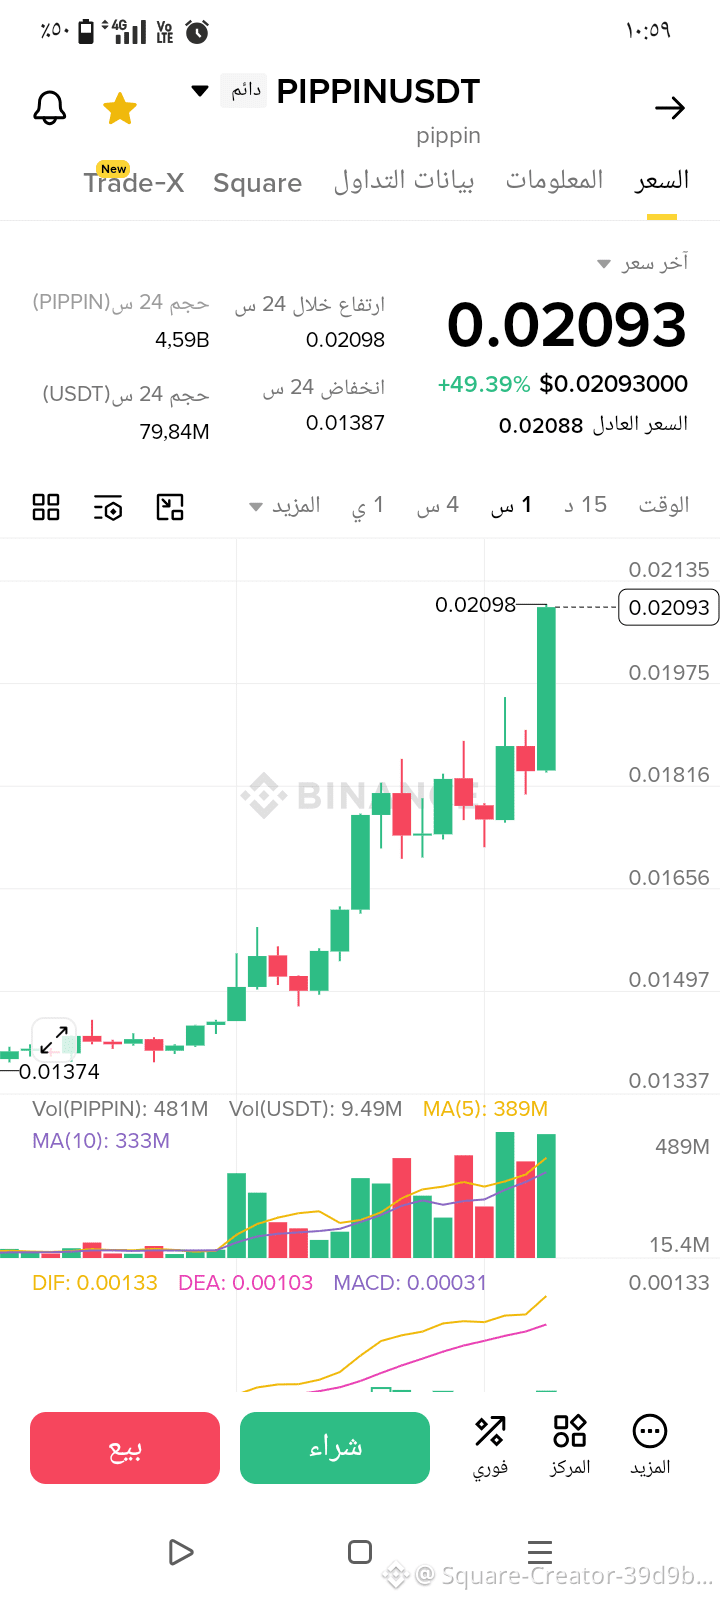
This quick pump might not last long...🤔
Jump in for a buy, take profits, and exit in time—don't be greedy.
Don't forget to make a quick long on $ESPORTS .
Time's ticking, get in from here 👇
$PIPPIN
{future}(PIPPINUSDT)
#TrumpSaysIranAttackWillNotAffectUSDeal #SyscoinBridgePausedAfterExploit #YugaLabsRescues62NFTsFromFlooringProtocol
This quick pump might not last long...🤔
Jump in for a buy, take profits, and exit in time—don't be greedy.
Don't forget to make a quick long on $ESPORTS .
Time's ticking, get in from here 👇
$PIPPIN
#TrumpSaysIranAttackWillNotAffectUSDeal #SyscoinBridgePausedAfterExploit #YugaLabsRescues62NFTsFromFlooringProtocol
Jump in for a buy, take profits, and exit in time—don't be greedy.
Don't forget to make a quick long on $ESPORTS .
Time's ticking, get in from here 👇
$PIPPIN
#TrumpSaysIranAttackWillNotAffectUSDeal #SyscoinBridgePausedAfterExploit #YugaLabsRescues62NFTsFromFlooringProtocol
1
1
442

·
--
Bullish
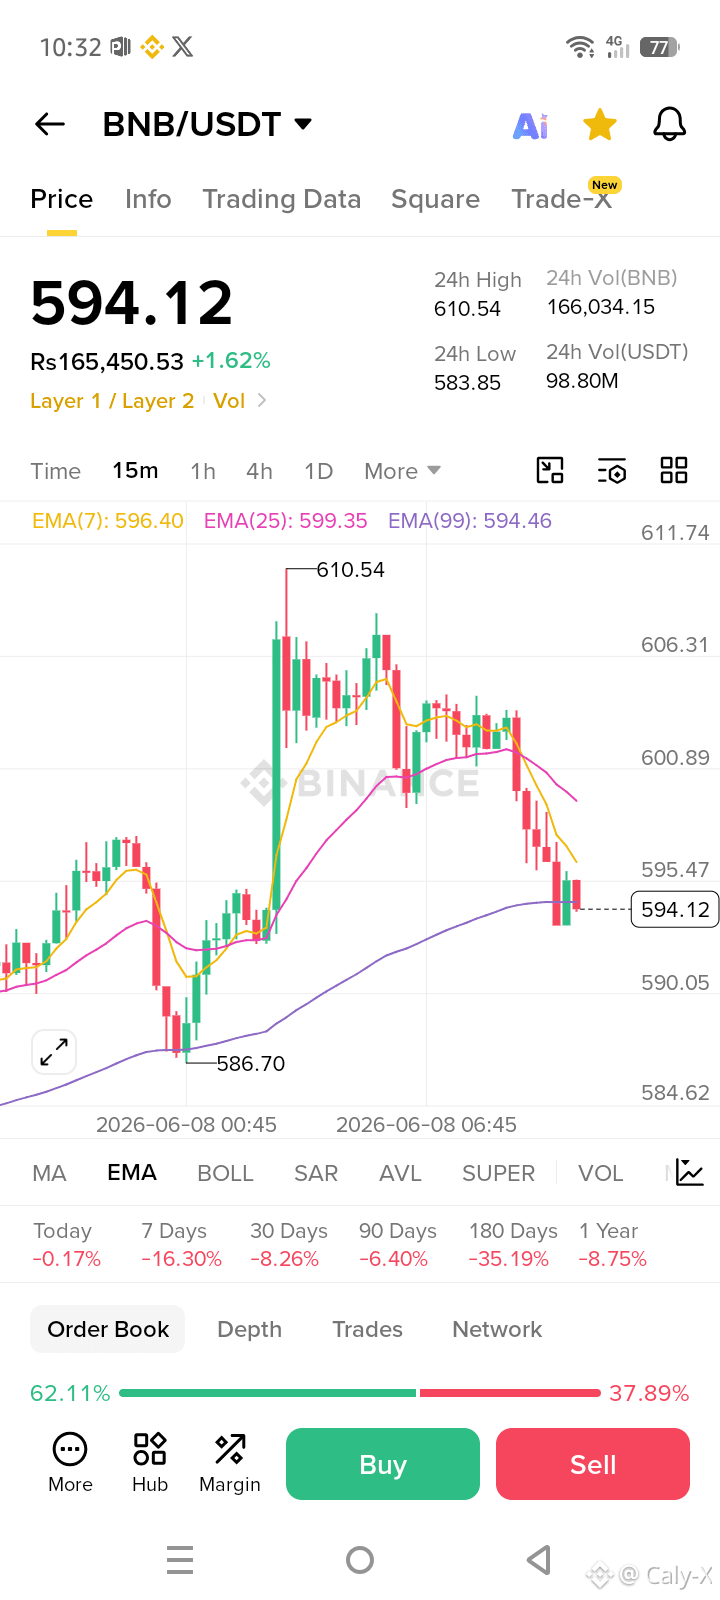
$BNB /USDT Long Setup 🚀
BNB is showing signs of defending a key support zone after a sharp pullback. If buyers step in, momentum could return fast.
💰 Entry: $594 - $595
🎯 TP1: $600
🎯 TP2: $606
🎯 TP3: $610
🛑 SL: $590
A clean reclaim of $600 could open the door for a quick move toward the recent high zone. Eyes on volume and momentum. 👀
{spot}(BNBUSDT)
#SaylorHintsStrategyBitcoinBuy #YugaLabsRescues62NFTsFromFlooringProtocol #SyscoinBridgePausedAfterExploit #TrumpSaysIranAttackWillNotAffectUSDeal #IranStrikesIsraelOilPriceRises
$BNB /USDT Long Setup 🚀
BNB is showing signs of defending a key support zone after a sharp pullback. If buyers step in, momentum could return fast.
💰 Entry: $594 - $595
🎯 TP1: $600
🎯 TP2: $606
🎯 TP3: $610
🛑 SL: $590
A clean reclaim of $600 could open the door for a quick move toward the recent high zone. Eyes on volume and momentum. 👀
#SaylorHintsStrategyBitcoinBuy #YugaLabsRescues62NFTsFromFlooringProtocol #SyscoinBridgePausedAfterExploit #TrumpSaysIranAttackWillNotAffectUSDeal #IranStrikesIsraelOilPriceRises
BNB is showing signs of defending a key support zone after a sharp pullback. If buyers step in, momentum could return fast.
💰 Entry: $594 - $595
🎯 TP1: $600
🎯 TP2: $606
🎯 TP3: $610
🛑 SL: $590
A clean reclaim of $600 could open the door for a quick move toward the recent high zone. Eyes on volume and momentum. 👀
#SaylorHintsStrategyBitcoinBuy #YugaLabsRescues62NFTsFromFlooringProtocol #SyscoinBridgePausedAfterExploit #TrumpSaysIranAttackWillNotAffectUSDeal #IranStrikesIsraelOilPriceRises
168

·
--
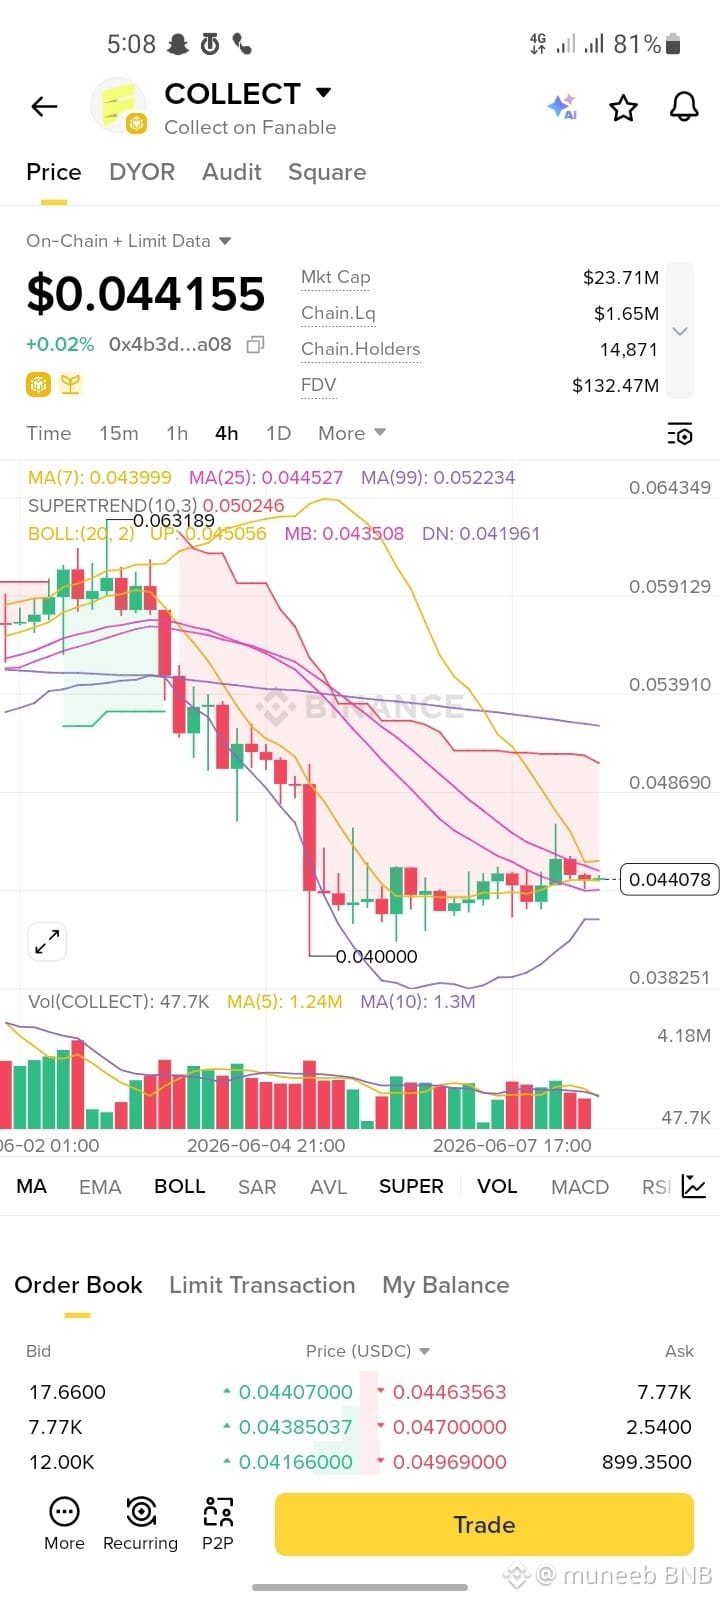
here is a short analysis of the COLLECT/USDT pair and potential price levels:
Technical Analysis
Trend: The overall trend is bearish, as indicated by the price trading below the Supertrend line ($0.0502) and the long-term moving average MA(99) ($0.0522).
Current State: The asset is currently in a consolidation phase at the bottom, tight within the Bollinger Bands. It is currently testing the Middle Band (MB: $0.0435) as local support.
Volume: Volume has decreased significantly compared to the earlier sell-off, showing a lack of strong momentum in either direction.
Potential Next Movements
Scenario A (Bullish Breakout): If the price manages to hold above $0.0440 and breaks past the Upper Bollinger Band ($0.0450), a minor relief rally toward the MA(25) ($0.0445) and psychological resistance at $0.0486 is likely.
Scenario B (Bearish Continuation): If it fails to hold the middle band, it will likely retest the recent swing low support at $0.0400.
$COLLECT
{alpha}(560x4b3d30992f003c8167699735f5ab2831b2a087d3)
#NYJudgePausesDormantBitcoinWalletsLawsuit BitcoinBreaksAbove$63K#IsraelStrikesIranMilitaryTargets #SaylorHintsStrategyBitcoinBuy #YugaLabsRescues62NFTsFromFlooringProtocol #SyscoinBridgePausedAfterExploit
here is a short analysis of the COLLECT/USDT pair and potential price levels:
Technical Analysis
Trend: The overall trend is bearish, as indicated by the price trading below the Supertrend line ($0.0502) and the long-term moving average MA(99) ($0.0522).
Current State: The asset is currently in a consolidation phase at the bottom, tight within the Bollinger Bands. It is currently testing the Middle Band (MB: $0.0435) as local support.
Volume: Volume has decreased significantly compared to the earlier sell-off, showing a lack of strong momentum in either direction.
Potential Next Movements
Scenario A (Bullish Breakout): If the price manages to hold above $0.0440 and breaks past the Upper Bollinger Band ($0.0450), a minor relief rally toward the MA(25) ($0.0445) and psychological resistance at $0.0486 is likely.
Scenario B (Bearish Continuation): If it fails to hold the middle band, it will likely retest the recent swing low support at $0.0400.
$COLLECT
#NYJudgePausesDormantBitcoinWalletsLawsuit BitcoinBreaksAbove$63K#IsraelStrikesIranMilitaryTargets #SaylorHintsStrategyBitcoinBuy #YugaLabsRescues62NFTsFromFlooringProtocol #SyscoinBridgePausedAfterExploit
Technical Analysis
Trend: The overall trend is bearish, as indicated by the price trading below the Supertrend line ($0.0502) and the long-term moving average MA(99) ($0.0522).
Current State: The asset is currently in a consolidation phase at the bottom, tight within the Bollinger Bands. It is currently testing the Middle Band (MB: $0.0435) as local support.
Volume: Volume has decreased significantly compared to the earlier sell-off, showing a lack of strong momentum in either direction.
Potential Next Movements
Scenario A (Bullish Breakout): If the price manages to hold above $0.0440 and breaks past the Upper Bollinger Band ($0.0450), a minor relief rally toward the MA(25) ($0.0445) and psychological resistance at $0.0486 is likely.
Scenario B (Bearish Continuation): If it fails to hold the middle band, it will likely retest the recent swing low support at $0.0400.
$COLLECT
#NYJudgePausesDormantBitcoinWalletsLawsuit BitcoinBreaksAbove$63K#IsraelStrikesIranMilitaryTargets #SaylorHintsStrategyBitcoinBuy #YugaLabsRescues62NFTsFromFlooringProtocol #SyscoinBridgePausedAfterExploit
199
Log in to explore more content
Join global crypto users on Binance Square
⚡️ Get latest and useful information about crypto.
💬 Trusted by the world’s largest crypto exchange.
👍 Discover real insights from verified creators.
Email / Phone number
Trending Topics
1
#WhatWillDriveCryptoandStocks’NextRebound?
50,006 views
698 Discussing
2
#Anthropic’s6xIPODemandSignalsPotentialRecordRaise
16,274 views
340 Discussing
3
#USCryptoETFsLose$1.48BInFiveDays
95 views
3 Discussing
4
#KoreaDigitalAssetBasicActFinalDraftExpectedEarlyJanuary
10 views
2 Discussing
5
#JaneStreetNearlyOctuplesFidelityBitcoinETFHoldings
2,997 views
68 Discussing
6
#HuangExitNvidiaStrategyInFocus
198,094 views
1,678 Discussing
7
#AnthropicRejectsIPODelayValuationinQuestion
822,295 views
5,841 Discussing
8
#FlopLabsTestnetAndAirdropToLaunchNov24
380 views
19 Discussing
9
#HedgeFundsCMEBitcoinNetShortsFall89%
20,253 views
272 Discussing
10
#BitMineReports$6.3BNetLossForFiscal2026
28,001 views
196 Discussing