

#sapientoken
sapientoken
29,715 views
78 Discussing
Hot
Latest

Article
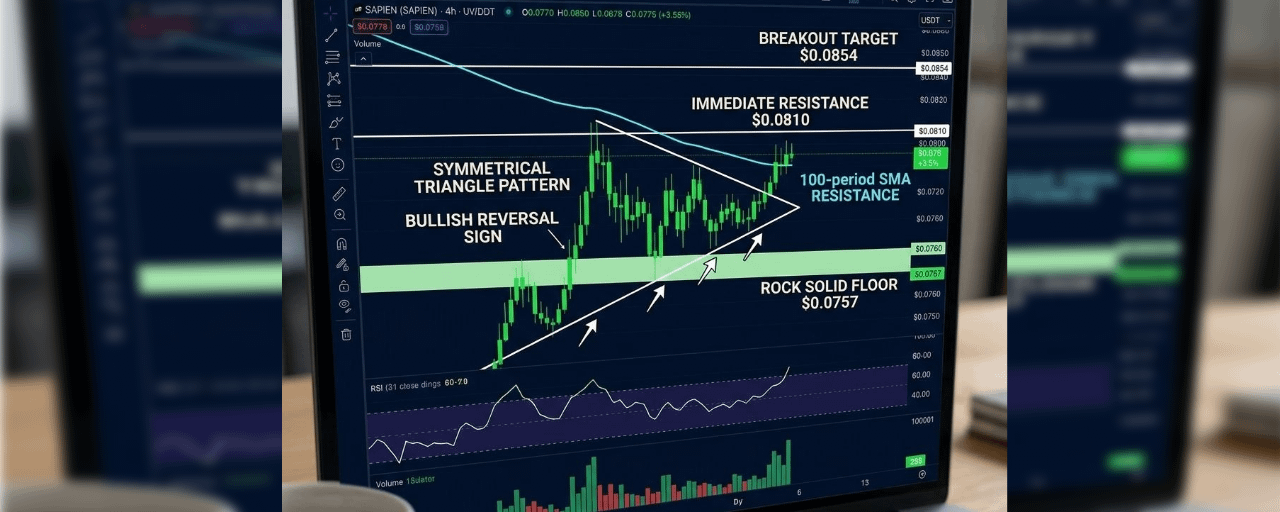
Sapien (SAPIENUSDT) Is Quietly Building a Case for a BreakoutThere's a particular kind of chart pattern that makes traders lean forward in their seats, and Sapien's $SAPIEN pair is currently drawing exactly that kind of attention. After weeks of getting pushed around, this token looks like it is finally catching its breath and setting up for something more decisive.
Where the price stands right now. SAPIEN is trading around $0.076, with the last 24 hours showing a modest but meaningful gain of roughly 3 to 4 percent. It's a small move on paper, but context matters here. This is a token that has been bruised badly over the past year, sitting more than 85 percent below its all time high of $0.5364 set back in November 2025. So a green day right now isn't just a number ticking up. It's a signal that buyers are starting to show up where sellers have dominated for months.
{future}(SAPIENUSDT)
The pattern everyone's watching. Chart watchers have been flagging SAPIENUSDT as forming a symmetrical triangle, essentially a coiled spring where the price keeps making higher lows while pressing against a ceiling above. That ceiling happens to line up closely with the 100 period moving average, which is acting as the token's main resistance right now. When a coin tightens into a pattern like this after a long downtrend, it often means selling pressure is drying up while buyers are quietly building a floor underneath. Traders describe this setup as a classic bullish reversal signal, one that frequently precedes a breakout once price finally forces its way through the ceiling.
The floor beneath the price. Support has firmed up nicely around the $0.0757 to $0.0760 zone. That level has already been tested and defended, giving the chart what analysts call a rock solid floor. As long as SAPIEN continues holding above this range, the higher low structure stays intact and the broader setup keeps favoring the bulls.
The resistance standing in the way. Just overhead, the immediate resistance sits near $0.0810. This is the first real test for anyone betting on a breakout. Clear that level with real volume behind it, and the next meaningful target opens up around $0.0854, a zone that would represent a genuinely strong move off the current base. The 100MA reclaim is the confirmation signal most chart watchers are waiting on before calling this a true breakout rather than just another bounce inside the range.
Why the setup feels different this time. What stands out is the shrinking volatility. Instead of the wild, directionless swings SAPIEN has shown for much of the year, price action has compressed into a tighter and tighter range, which is usually the market's way of building energy for its next real move. Whether that move ends up being explosive to the upside depends entirely on whether buyers can actually push volume through that $0.0810 ceiling, rather than just testing it and retreating again like has happened before.
The honest caveat. SAPIEN remains a small cap token, with a market capitalization sitting around $19 million and daily trading volume in the low single digit millions. That combination means moves can happen fast in either direction, and a bullish looking pattern can just as easily fail and roll over if broader market sentiment turns risk off. Patterns like symmetrical triangles are probabilistic tools, not guarantees, and plenty of promising setups in crypto have broken down instead of out.
Bottom line. Sapien is sitting at a genuinely interesting technical crossroads. The higher low structure is intact, support at $0.0757 is holding, and the path toward $0.0810 and then $0.0854 is clearly mapped out if bulls can find the volume to force the issue. For now, this is a setup worth watching closely rather than a breakout that has already happened, and the coming sessions around that resistance zone should tell the real story.
This is technical market commentary, not financial advice. Small cap tokens like SAPIEN carry significant volatility and risk. Always do your own research and size any position according to your own risk tolerance.
{spot}(SAPIENUSDT)
#SAPIENToken #Breakout #bullish #MarketSentimentToday #ProfitPotential
Sapien (SAPIENUSDT) Is Quietly Building a Case for a Breakout
There's a particular kind of chart pattern that makes traders lean forward in their seats, and Sapien's $SAPIEN pair is currently drawing exactly that kind of attention. After weeks of getting pushed around, this token looks like it is finally catching its breath and setting up for something more decisive.
Where the price stands right now. SAPIEN is trading around $0.076, with the last 24 hours showing a modest but meaningful gain of roughly 3 to 4 percent. It's a small move on paper, but context matters here. This is a token that has been bruised badly over the past year, sitting more than 85 percent below its all time high of $0.5364 set back in November 2025. So a green day right now isn't just a number ticking up. It's a signal that buyers are starting to show up where sellers have dominated for months.
The pattern everyone's watching. Chart watchers have been flagging SAPIENUSDT as forming a symmetrical triangle, essentially a coiled spring where the price keeps making higher lows while pressing against a ceiling above. That ceiling happens to line up closely with the 100 period moving average, which is acting as the token's main resistance right now. When a coin tightens into a pattern like this after a long downtrend, it often means selling pressure is drying up while buyers are quietly building a floor underneath. Traders describe this setup as a classic bullish reversal signal, one that frequently precedes a breakout once price finally forces its way through the ceiling.
The floor beneath the price. Support has firmed up nicely around the $0.0757 to $0.0760 zone. That level has already been tested and defended, giving the chart what analysts call a rock solid floor. As long as SAPIEN continues holding above this range, the higher low structure stays intact and the broader setup keeps favoring the bulls.
The resistance standing in the way. Just overhead, the immediate resistance sits near $0.0810. This is the first real test for anyone betting on a breakout. Clear that level with real volume behind it, and the next meaningful target opens up around $0.0854, a zone that would represent a genuinely strong move off the current base. The 100MA reclaim is the confirmation signal most chart watchers are waiting on before calling this a true breakout rather than just another bounce inside the range.
Why the setup feels different this time. What stands out is the shrinking volatility. Instead of the wild, directionless swings SAPIEN has shown for much of the year, price action has compressed into a tighter and tighter range, which is usually the market's way of building energy for its next real move. Whether that move ends up being explosive to the upside depends entirely on whether buyers can actually push volume through that $0.0810 ceiling, rather than just testing it and retreating again like has happened before.
The honest caveat. SAPIEN remains a small cap token, with a market capitalization sitting around $19 million and daily trading volume in the low single digit millions. That combination means moves can happen fast in either direction, and a bullish looking pattern can just as easily fail and roll over if broader market sentiment turns risk off. Patterns like symmetrical triangles are probabilistic tools, not guarantees, and plenty of promising setups in crypto have broken down instead of out.
Bottom line. Sapien is sitting at a genuinely interesting technical crossroads. The higher low structure is intact, support at $0.0757 is holding, and the path toward $0.0810 and then $0.0854 is clearly mapped out if bulls can find the volume to force the issue. For now, this is a setup worth watching closely rather than a breakout that has already happened, and the coming sessions around that resistance zone should tell the real story.
This is technical market commentary, not financial advice. Small cap tokens like SAPIEN carry significant volatility and risk. Always do your own research and size any position according to your own risk tolerance.
#SAPIENToken #Breakout #bullish #MarketSentimentToday #ProfitPotential
Where the price stands right now. SAPIEN is trading around $0.076, with the last 24 hours showing a modest but meaningful gain of roughly 3 to 4 percent. It's a small move on paper, but context matters here. This is a token that has been bruised badly over the past year, sitting more than 85 percent below its all time high of $0.5364 set back in November 2025. So a green day right now isn't just a number ticking up. It's a signal that buyers are starting to show up where sellers have dominated for months.
The pattern everyone's watching. Chart watchers have been flagging SAPIENUSDT as forming a symmetrical triangle, essentially a coiled spring where the price keeps making higher lows while pressing against a ceiling above. That ceiling happens to line up closely with the 100 period moving average, which is acting as the token's main resistance right now. When a coin tightens into a pattern like this after a long downtrend, it often means selling pressure is drying up while buyers are quietly building a floor underneath. Traders describe this setup as a classic bullish reversal signal, one that frequently precedes a breakout once price finally forces its way through the ceiling.
The floor beneath the price. Support has firmed up nicely around the $0.0757 to $0.0760 zone. That level has already been tested and defended, giving the chart what analysts call a rock solid floor. As long as SAPIEN continues holding above this range, the higher low structure stays intact and the broader setup keeps favoring the bulls.
The resistance standing in the way. Just overhead, the immediate resistance sits near $0.0810. This is the first real test for anyone betting on a breakout. Clear that level with real volume behind it, and the next meaningful target opens up around $0.0854, a zone that would represent a genuinely strong move off the current base. The 100MA reclaim is the confirmation signal most chart watchers are waiting on before calling this a true breakout rather than just another bounce inside the range.
Why the setup feels different this time. What stands out is the shrinking volatility. Instead of the wild, directionless swings SAPIEN has shown for much of the year, price action has compressed into a tighter and tighter range, which is usually the market's way of building energy for its next real move. Whether that move ends up being explosive to the upside depends entirely on whether buyers can actually push volume through that $0.0810 ceiling, rather than just testing it and retreating again like has happened before.
The honest caveat. SAPIEN remains a small cap token, with a market capitalization sitting around $19 million and daily trading volume in the low single digit millions. That combination means moves can happen fast in either direction, and a bullish looking pattern can just as easily fail and roll over if broader market sentiment turns risk off. Patterns like symmetrical triangles are probabilistic tools, not guarantees, and plenty of promising setups in crypto have broken down instead of out.
Bottom line. Sapien is sitting at a genuinely interesting technical crossroads. The higher low structure is intact, support at $0.0757 is holding, and the path toward $0.0810 and then $0.0854 is clearly mapped out if bulls can find the volume to force the issue. For now, this is a setup worth watching closely rather than a breakout that has already happened, and the coming sessions around that resistance zone should tell the real story.
This is technical market commentary, not financial advice. Small cap tokens like SAPIEN carry significant volatility and risk. Always do your own research and size any position according to your own risk tolerance.
#SAPIENToken #Breakout #bullish #MarketSentimentToday #ProfitPotential
280

·
--
$SAPIEN
{future}(SAPIENUSDT)
Long: 0.08700 – 0.08750
Targets:
TP1: 0.08870
TP2: 0.08920
TP3: 0.09000
TP4: 0.09200
Stop Loss: 0.08400
#SAPIENToken
#SapienToMoon
$SAPIEN
Long: 0.08700 – 0.08750
Targets:
TP1: 0.08870
TP2: 0.08920
TP3: 0.09000
TP4: 0.09200
Stop Loss: 0.08400
#SAPIENToken
#SapienToMoon
Long: 0.08700 – 0.08750
Targets:
TP1: 0.08870
TP2: 0.08920
TP3: 0.09000
TP4: 0.09200
Stop Loss: 0.08400
#SAPIENToken
#SapienToMoon
2
125

·
--
$SAPIEN
{future}(SAPIENUSDT)
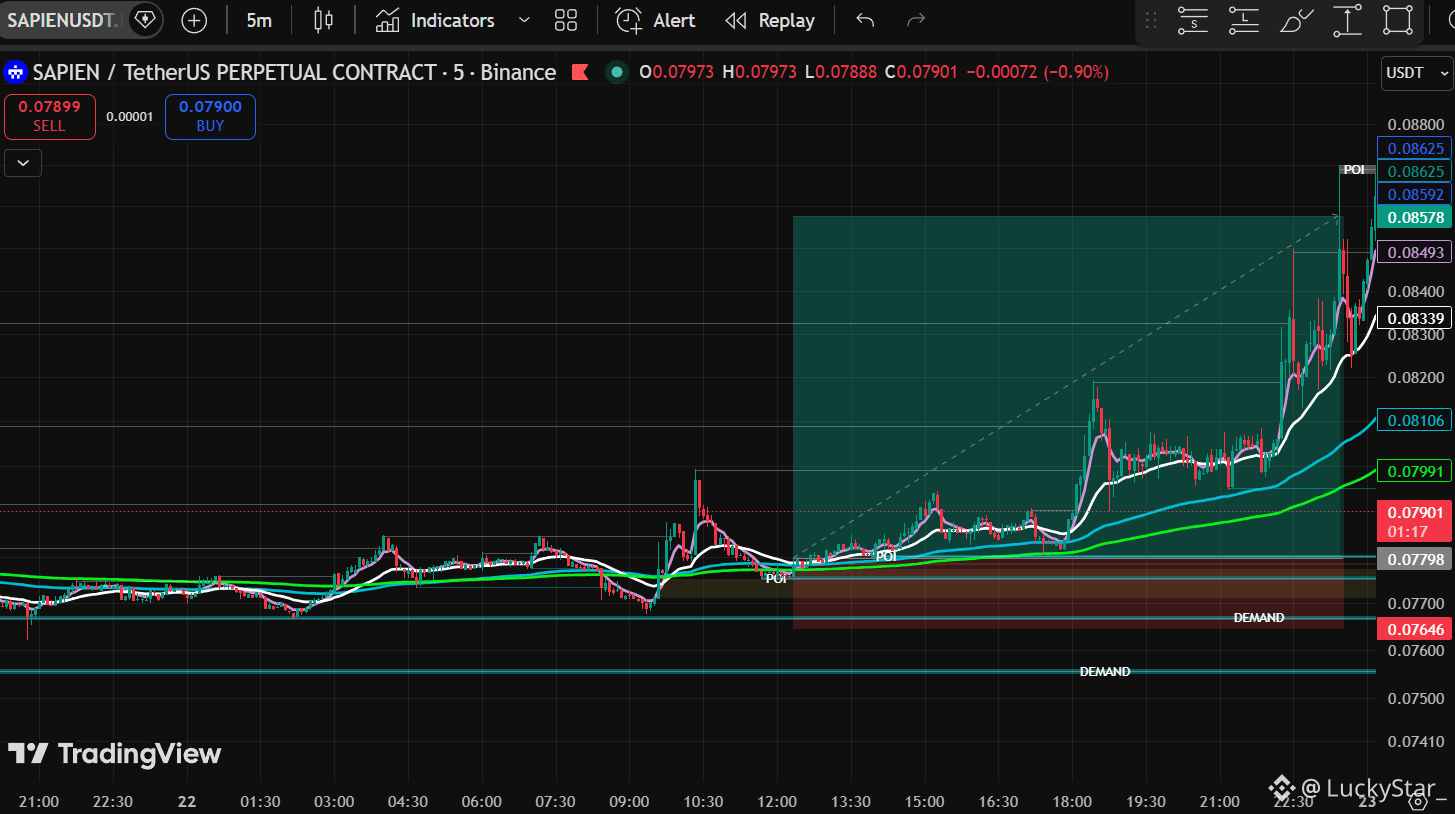
The market once again delivered a clean technical move. The position quickly moved into profit territory. Another successful trade according to the plan.
#technical_analysis #SAPIENToken $ARIA #crypto
$SAPIEN
The market once again delivered a clean technical move. The position quickly moved into profit territory. Another successful trade according to the plan.
#technical_analysis #SAPIENToken $ARIA #crypto
The market once again delivered a clean technical move. The position quickly moved into profit territory. Another successful trade according to the plan.
#technical_analysis #SAPIENToken $ARIA #crypto
LuckyStar_
·
--
$SAPIEN
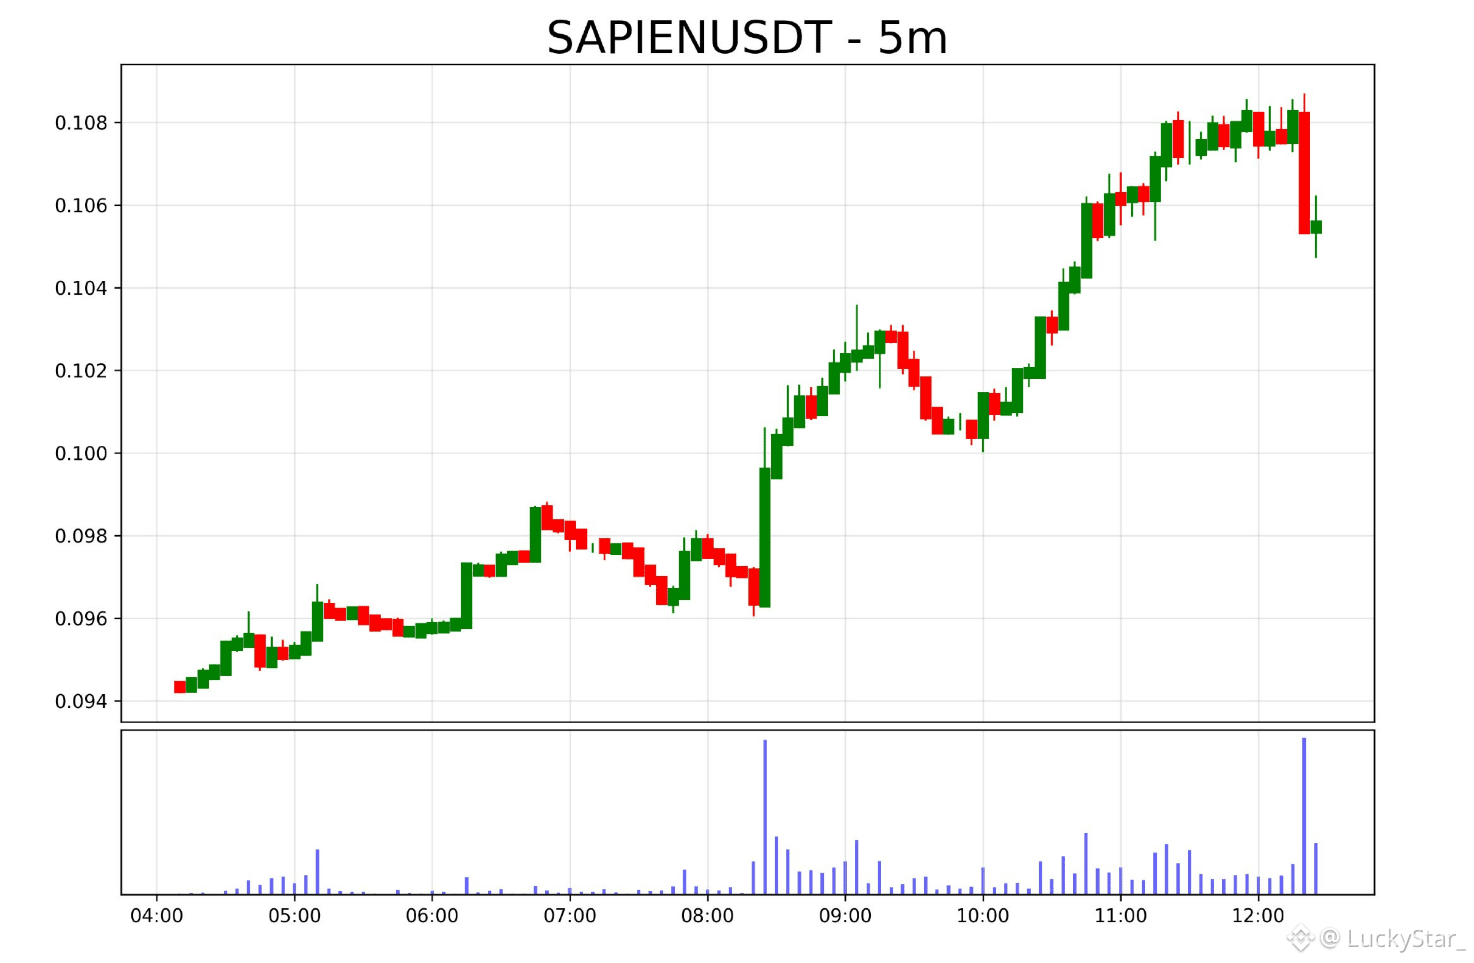
📊 Similar formations have repeatedly ended with strong impulses.
Buyers continue to defend key levels, which supports the positive market structure. If this zone holds, a new upward impulse may begin from here.
The nearest candles may determine the direction of movement for the coming days. I will closely monitor the development of the situation and share new updates.
#SAPİEN $WLD #SAPIENUSDT $BILL #crypto
📊 Similar formations have repeatedly ended with strong impulses.
Buyers continue to defend key levels, which supports the positive market structure. If this zone holds, a new upward impulse may begin from here.
The nearest candles may determine the direction of movement for the coming days. I will closely monitor the development of the situation and share new updates.
#SAPİEN $WLD #SAPIENUSDT $BILL #crypto
221

·
--
🚨 THESE 3 COINS ARE GETTING ATTENTION 👀
Not every trending coin deserves a trade — but these are worth watching:
🟢 $SAPIEN — AI + data narrative watch
🔥 $PROVE — ZK infrastructure watch
⚡ $WAL — New ecosystem momentum watch
The key isn’t chasing the first green candle.
Watch volume + market structure first. 🎯
👇 Which one would you research first?
$SAPINE / $PRIVE / $WAL
#BinanceSquare #Crypto #Altcoins #SAPIENToken #prove
🚨 THESE 3 COINS ARE GETTING ATTENTION 👀
Not every trending coin deserves a trade — but these are worth watching:
🟢 $SAPIEN — AI + data narrative watch
🔥 $PROVE — ZK infrastructure watch
⚡ $WAL — New ecosystem momentum watch
The key isn’t chasing the first green candle.
Watch volume + market structure first. 🎯
👇 Which one would you research first?
$SAPINE / $PRIVE / $WAL
#BinanceSquare #Crypto #Altcoins #SAPIENToken #prove
Not every trending coin deserves a trade — but these are worth watching:
🟢 $SAPIEN — AI + data narrative watch
🔥 $PROVE — ZK infrastructure watch
⚡ $WAL — New ecosystem momentum watch
The key isn’t chasing the first green candle.
Watch volume + market structure first. 🎯
👇 Which one would you research first?
$SAPINE / $PRIVE / $WAL
#BinanceSquare #Crypto #Altcoins #SAPIENToken #prove

66
·
--
$SAPIEN
{future}(SAPIENUSDT)
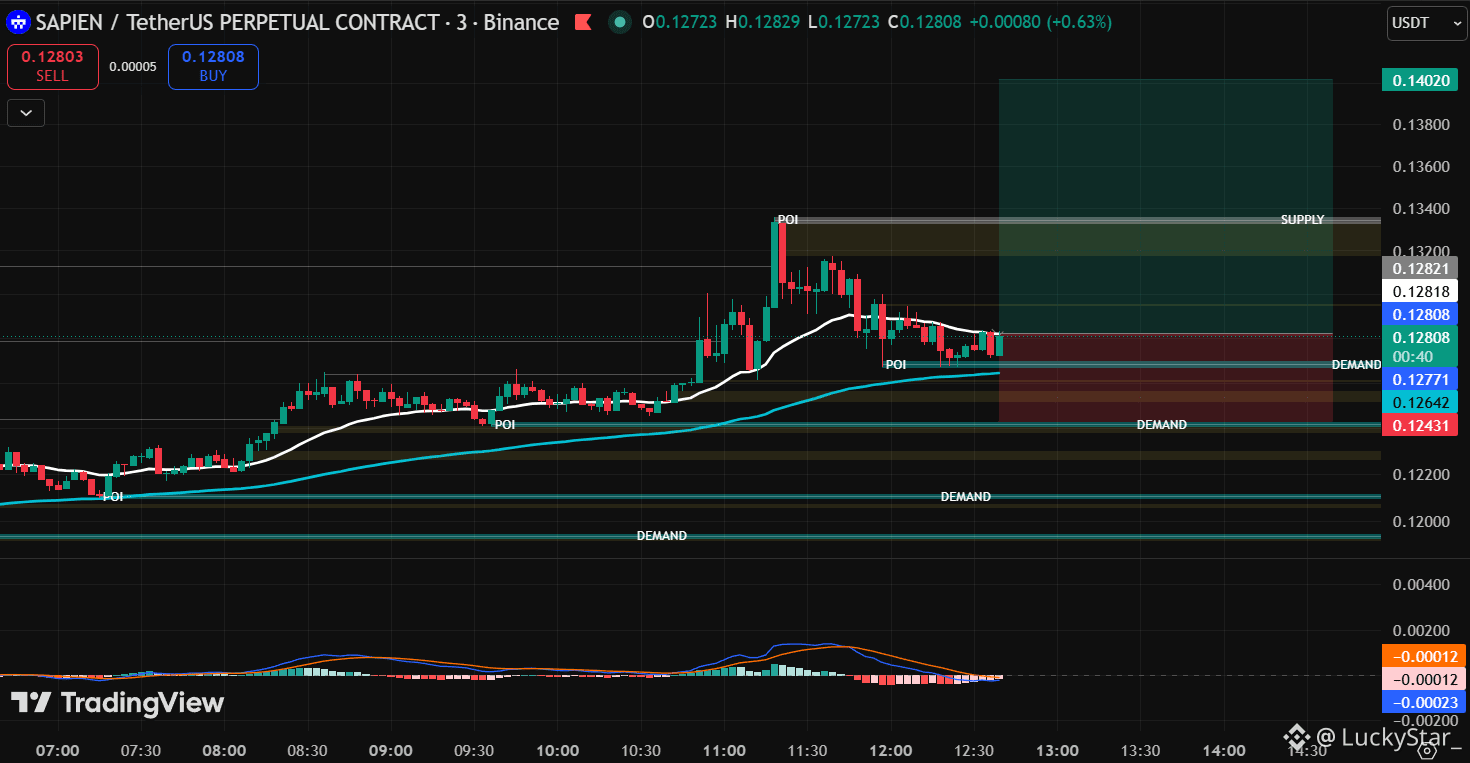
The price showed the reaction of buyers near the key support zone. A long position was opened in anticipation of a continuation of the upward movement.
#SAPİEN #SAPIENToken #trading
$SAPIEN
The price showed the reaction of buyers near the key support zone. A long position was opened in anticipation of a continuation of the upward movement.
#SAPİEN #SAPIENToken #trading
The price showed the reaction of buyers near the key support zone. A long position was opened in anticipation of a continuation of the upward movement.
#SAPİEN #SAPIENToken #trading
1
42

·
--
$SAPIEN SAPIEN Token on May 7, 2026: Holding Steady Above $0.09 with AI Integration on the Horizon
On this day, Thursday, May 7, 2026, SAPIEN is emerging as a hot asset in the AI-driven data governance sector. As the network continues to roll out its roadmap for 2026, the token is showing price consolidation above key support levels, fueled by community optimism around the upcoming updates for the "Proof of Quality" platform aimed at enhancing the accuracy of data used in training large language models.
Current Market Status (Update May 7)
Live data from global exchanges (like Kraken and MEXC) indicates steady performance:
Current Price: SAPIEN is trading at approximately $0.0965.
Price in Local Currency: Roughly equivalent to 0.89 Moroccan Dirhams.
Daily Performance: The token has recorded a slight uptick of 1.08% over the past 24 hours, maintaining its weekly gains despite overall market volatility.
$SAPIEN #SAPİEN #SAPIENTrade #SAPIENToken
$SAPIEN SAPIEN Token on May 7, 2026: Holding Steady Above $0.09 with AI Integration on the Horizon
On this day, Thursday, May 7, 2026, SAPIEN is emerging as a hot asset in the AI-driven data governance sector. As the network continues to roll out its roadmap for 2026, the token is showing price consolidation above key support levels, fueled by community optimism around the upcoming updates for the "Proof of Quality" platform aimed at enhancing the accuracy of data used in training large language models.
Current Market Status (Update May 7)
Live data from global exchanges (like Kraken and MEXC) indicates steady performance:
Current Price: SAPIEN is trading at approximately $0.0965.
Price in Local Currency: Roughly equivalent to 0.89 Moroccan Dirhams.
Daily Performance: The token has recorded a slight uptick of 1.08% over the past 24 hours, maintaining its weekly gains despite overall market volatility.
$SAPIEN #SAPİEN #SAPIENTrade #SAPIENToken
On this day, Thursday, May 7, 2026, SAPIEN is emerging as a hot asset in the AI-driven data governance sector. As the network continues to roll out its roadmap for 2026, the token is showing price consolidation above key support levels, fueled by community optimism around the upcoming updates for the "Proof of Quality" platform aimed at enhancing the accuracy of data used in training large language models.
Current Market Status (Update May 7)
Live data from global exchanges (like Kraken and MEXC) indicates steady performance:
Current Price: SAPIEN is trading at approximately $0.0965.
Price in Local Currency: Roughly equivalent to 0.89 Moroccan Dirhams.
Daily Performance: The token has recorded a slight uptick of 1.08% over the past 24 hours, maintaining its weekly gains despite overall market volatility.
$SAPIEN #SAPİEN #SAPIENTrade #SAPIENToken

120
·
--
$SAPIEN
{future}(SAPIENUSDT)
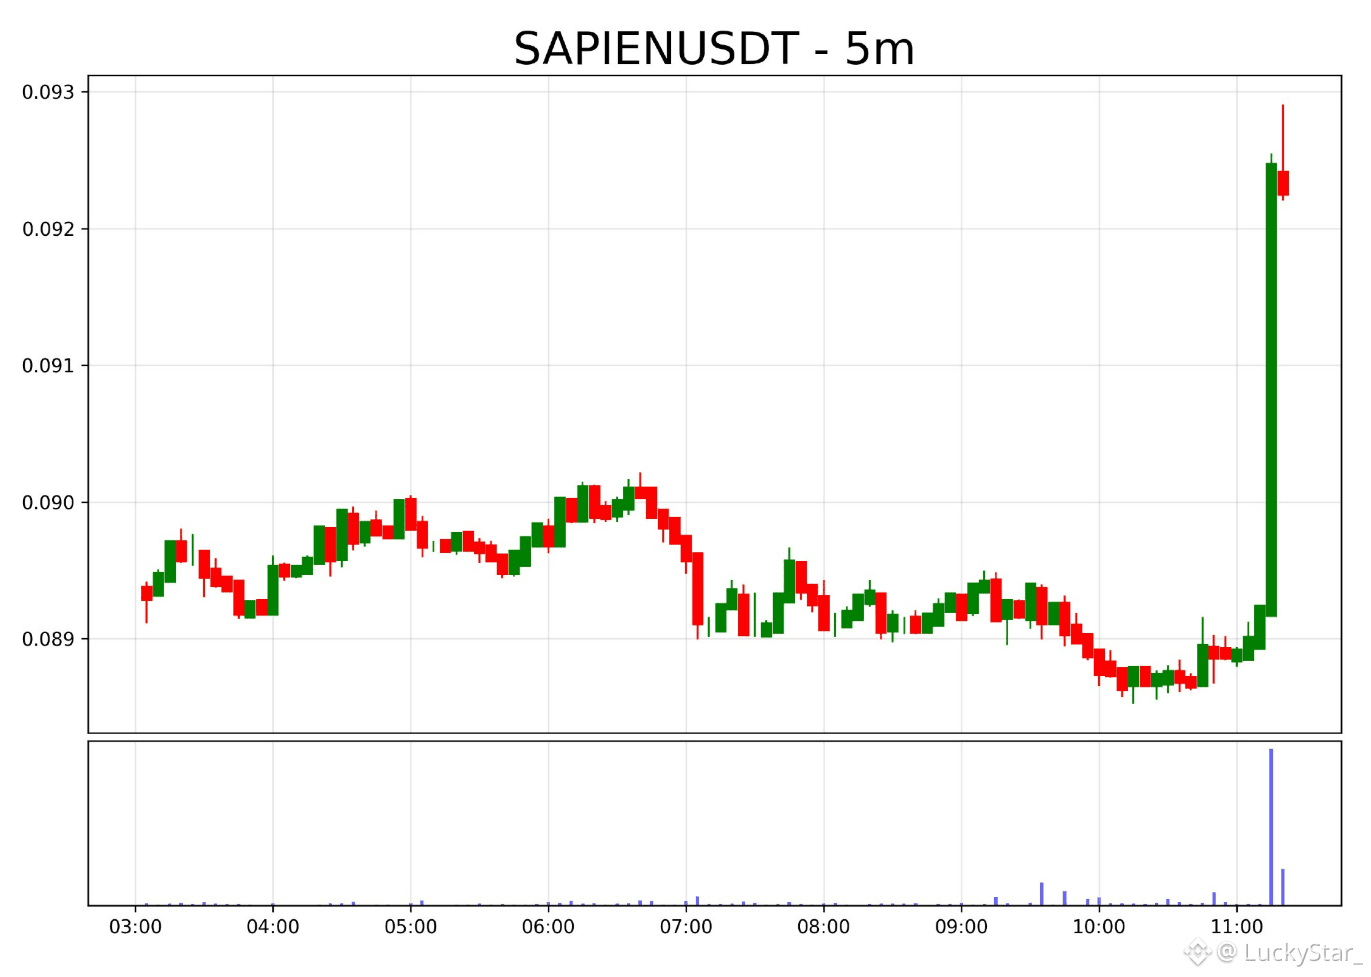
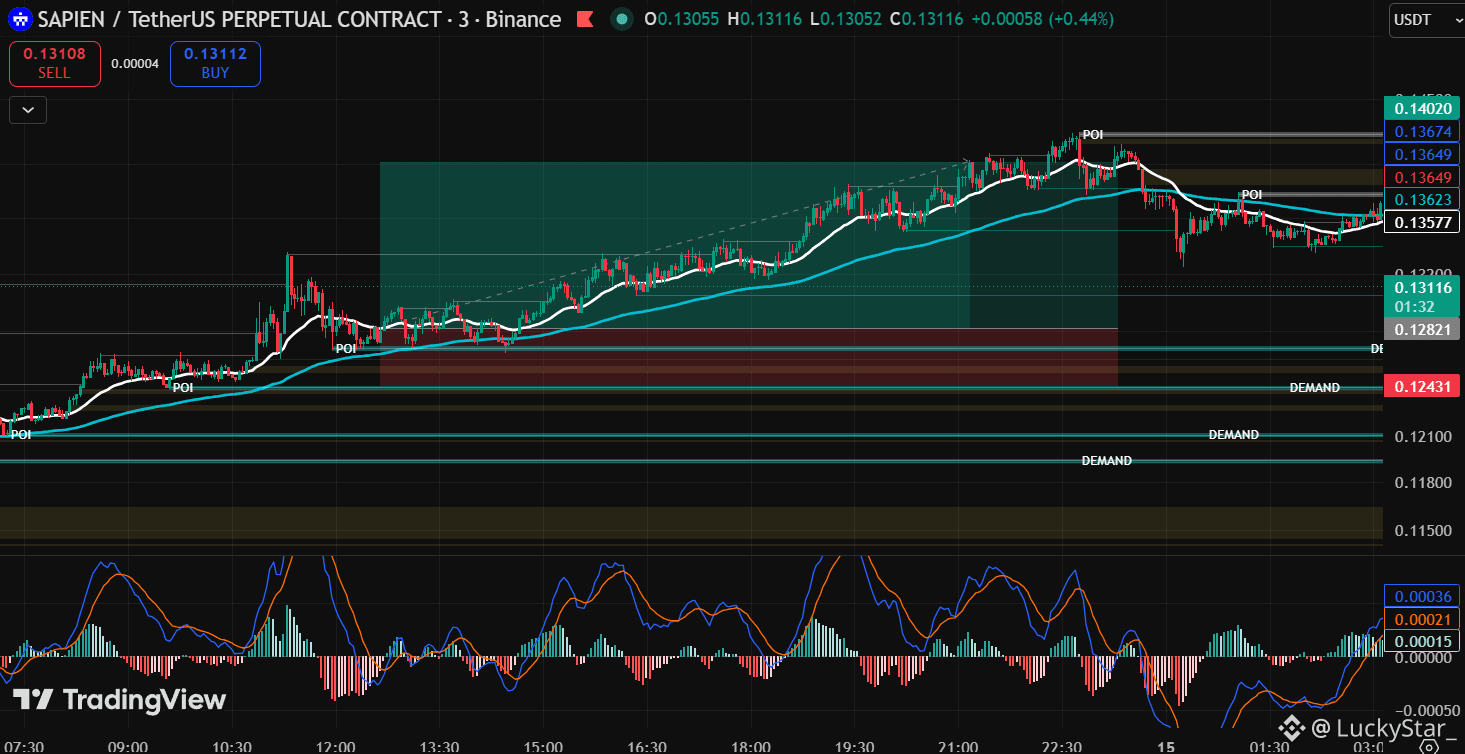
The coin showed an excellent reaction from the key zone. The move was strong and clean along the trend. Another setup delivered an outstanding result.
#SAPİEN #SAPIENToken #technical_analysis
$SAPIEN
The coin showed an excellent reaction from the key zone. The move was strong and clean along the trend. Another setup delivered an outstanding result.
#SAPİEN #SAPIENToken #technical_analysis
The coin showed an excellent reaction from the key zone. The move was strong and clean along the trend. Another setup delivered an outstanding result.
#SAPİEN #SAPIENToken #technical_analysis
LuckyStar_
·
--
$SAPIEN
The price showed the reaction of buyers near the key support zone. A long position was opened in anticipation of a continuation of the upward movement.
#SAPİEN #SAPIENToken #trading
The price showed the reaction of buyers near the key support zone. A long position was opened in anticipation of a continuation of the upward movement.
#SAPİEN #SAPIENToken #trading
117
·
--
$SAPIEN
{future}(SAPIENUSDT)
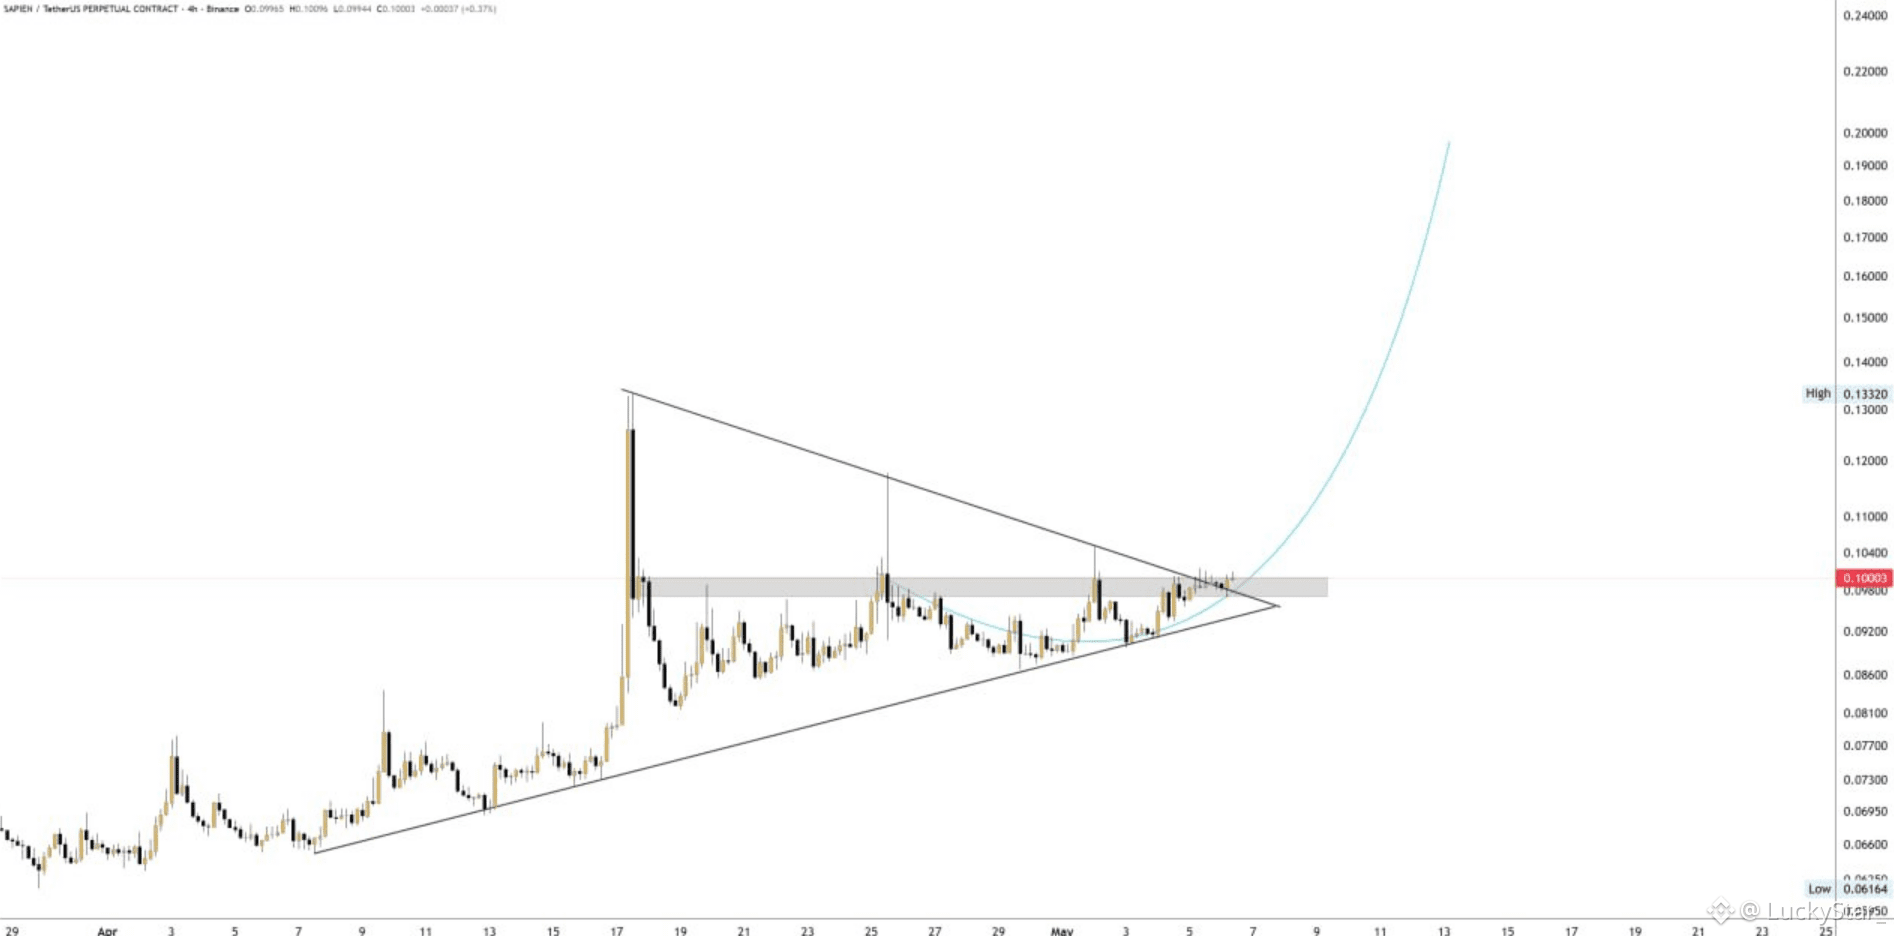
The SAPIEN/USDT price ≈ 0.10003 forms a classic symmetrical triangle on the 4-hour chart, indicating a gradual compression of volatility before a potential breakout.
Support is growing along the ascending trendline, and resistance is gradually decreasing - the balance of power is shifting in favor of buyers, especially after the candle closes above the gray consolidation zone.
#SAPİEN #SAPIENToken #trading
$SAPIEN
The SAPIEN/USDT price ≈ 0.10003 forms a classic symmetrical triangle on the 4-hour chart, indicating a gradual compression of volatility before a potential breakout.
Support is growing along the ascending trendline, and resistance is gradually decreasing - the balance of power is shifting in favor of buyers, especially after the candle closes above the gray consolidation zone.
#SAPİEN #SAPIENToken #trading
The SAPIEN/USDT price ≈ 0.10003 forms a classic symmetrical triangle on the 4-hour chart, indicating a gradual compression of volatility before a potential breakout.
Support is growing along the ascending trendline, and resistance is gradually decreasing - the balance of power is shifting in favor of buyers, especially after the candle closes above the gray consolidation zone.
#SAPİEN #SAPIENToken #trading
134
Log in to explore more content
Join global crypto users on Binance Square
⚡️ Get latest and useful information about crypto.
💬 Trusted by the world’s largest crypto exchange.
👍 Discover real insights from verified creators.
Email / Phone number
Trending Topics
1
#CircleMints500MUSDCOnSolana
46,212 views
1,186 Discussing
2
#PolymarketBankFailureBetsDrawFDICConcern
59,779 views
1,273 Discussing
3
#BlackRockBuildsTokenizedPortfoliosForOndo
47,092 views
879 Discussing
4
#BitwiseFilesToListNEARETFOnNYSEArca
45,661 views
782 Discussing
5
#SECCommissionerPeirceToLeaveOct2
41,930 views
623 Discussing
6
#SECSaysBuybacksUpgradesDontMakeTokenSecurity
38,016 views
494 Discussing
7
#StrategyProposesDailyDividendsForPreferreds
6,769 views
162 Discussing
8
#CircleTetherFreezeBitgetHackerWallet
5,850 views
93 Discussing
9
#CoinMarketCapCompletesCoinglassAcquisition
8,926 views
126 Discussing
10
#QNTRises39%
98,755 views
1,563 Discussing