
#rangewatch
rangewatch
2,596 views
74 Discussing
Hot
Latest

WHERE PRICE SITS | $INJ
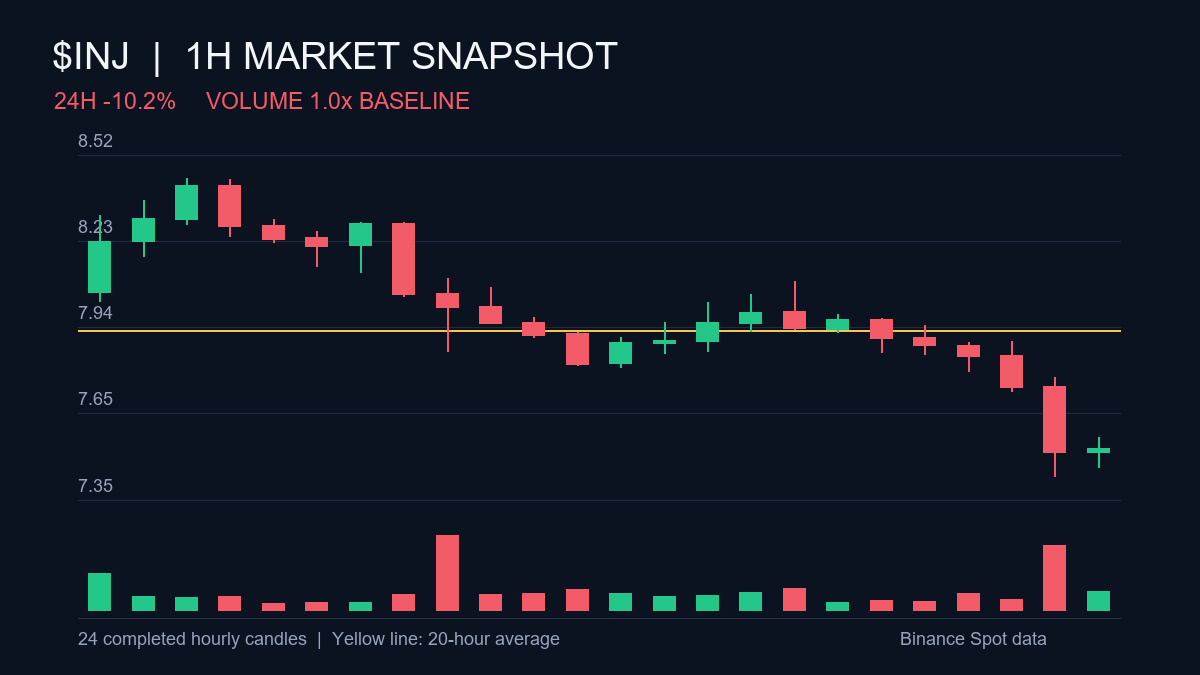
OBSERVATION — $INJ sits 2% of the way from its 24h low ($7.43) to its high ($8.44).
CONTEXT — Latest price is 13.4% below the 24h high.
NEXT CHECK — Range position gives context; it is not breakout confirmation.
#INJ #AltcoinFlow #RangeWatch
WHERE PRICE SITS | $INJ
OBSERVATION — $INJ sits 2% of the way from its 24h low ($7.43) to its high ($8.44).
CONTEXT — Latest price is 13.4% below the 24h high.
NEXT CHECK — Range position gives context; it is not breakout confirmation.
#INJ #AltcoinFlow #RangeWatch
OBSERVATION — $INJ sits 2% of the way from its 24h low ($7.43) to its high ($8.44).
CONTEXT — Latest price is 13.4% below the 24h high.
NEXT CHECK — Range position gives context; it is not breakout confirmation.
#INJ #AltcoinFlow #RangeWatch
199

·
--
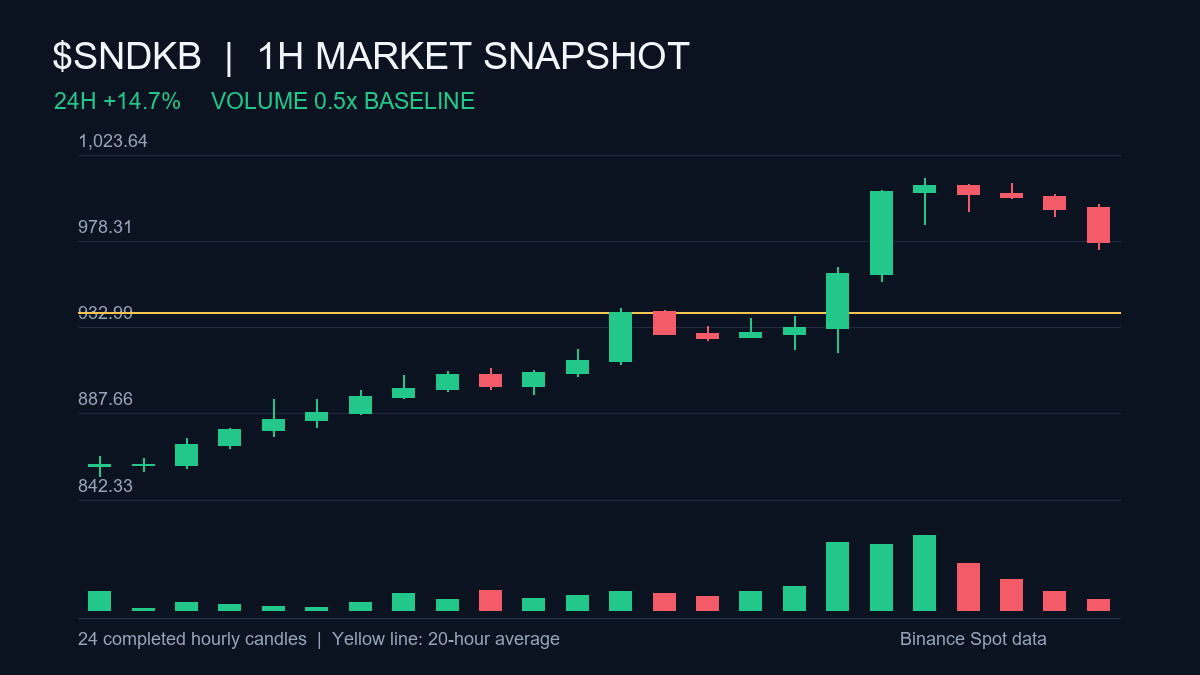
$SNDKB sits 85% of the way from its 24h low ($857.09) to its high ($1,011.14).
Context check: Latest price is 2.3% below the 24h high.
Does this range position look settled, or still in motion?
#SNDKB #AltcoinFlow #RangeWatch
$SNDKB sits 85% of the way from its 24h low ($857.09) to its high ($1,011.14).
Context check: Latest price is 2.3% below the 24h high.
Does this range position look settled, or still in motion?
#SNDKB #AltcoinFlow #RangeWatch
Context check: Latest price is 2.3% below the 24h high.
Does this range position look settled, or still in motion?
#SNDKB #AltcoinFlow #RangeWatch
125
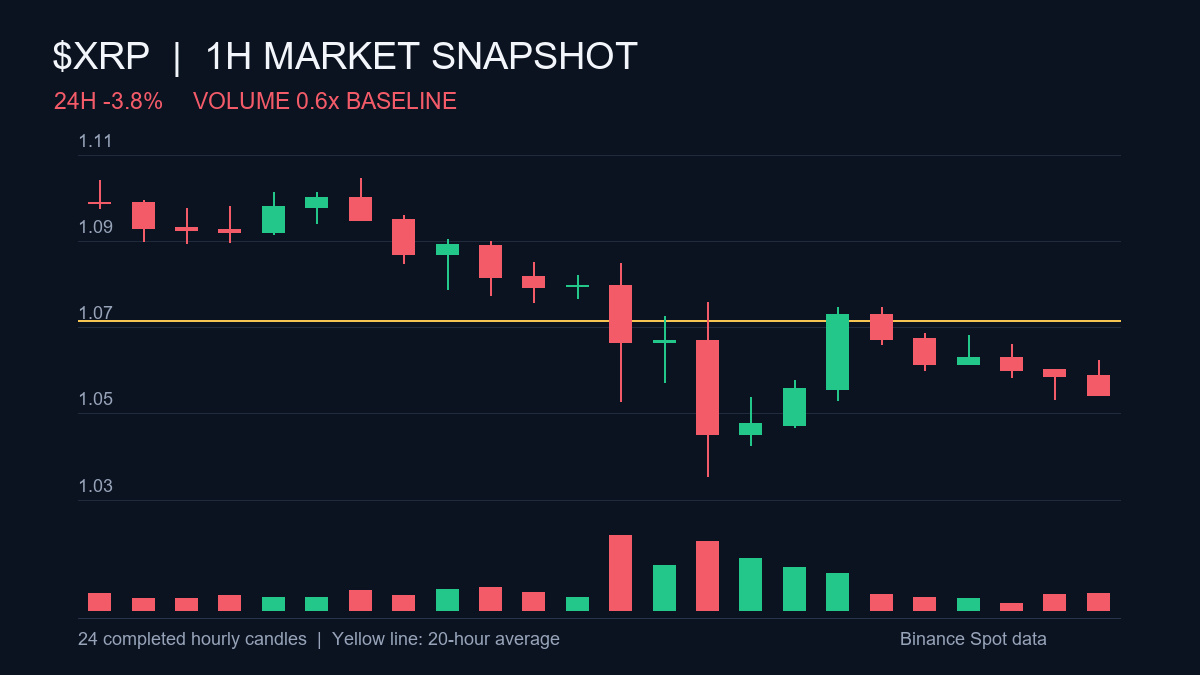
$XRP sits 36% of the way from its 24h low ($1.03) to its high ($1.11).
Context: Latest price is 4.6% below the 24h high.
What would count as a real break from this 24h range for you?
#XRP #LargeCaps #RangeWatch
$XRP sits 36% of the way from its 24h low ($1.03) to its high ($1.11).
Context: Latest price is 4.6% below the 24h high.
What would count as a real break from this 24h range for you?
#XRP #LargeCaps #RangeWatch
Context: Latest price is 4.6% below the 24h high.
What would count as a real break from this 24h range for you?
#XRP #LargeCaps #RangeWatch
114
Numbers in focus:
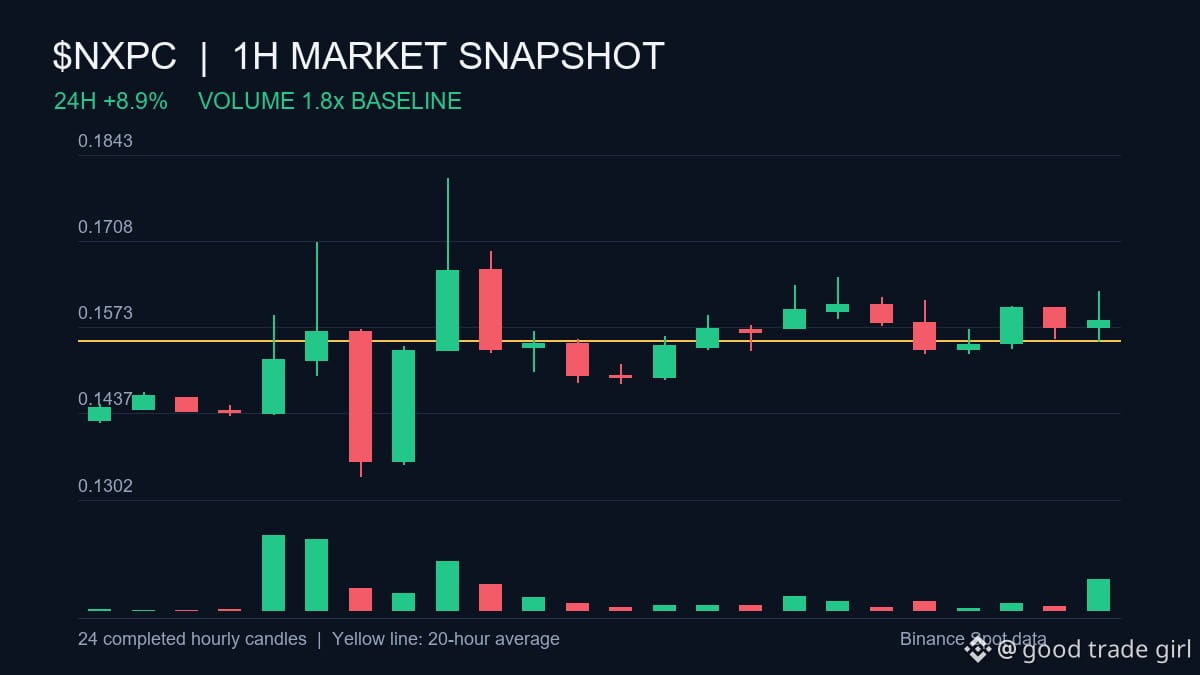
Latest price is 14.5% below the 24h high.
$NXPC sits 51% of the way from its 24h low ($0.1339) to its high ($0.1806).
What would count as a real break from this 24h range for you?
#NXPC #AltcoinFlow #RangeWatch
Numbers in focus:
Latest price is 14.5% below the 24h high.
$NXPC sits 51% of the way from its 24h low ($0.1339) to its high ($0.1806).
What would count as a real break from this 24h range for you?
#NXPC #AltcoinFlow #RangeWatch
Latest price is 14.5% below the 24h high.
$NXPC sits 51% of the way from its 24h low ($0.1339) to its high ($0.1806).
What would count as a real break from this 24h range for you?
#NXPC #AltcoinFlow #RangeWatch
240
·
--
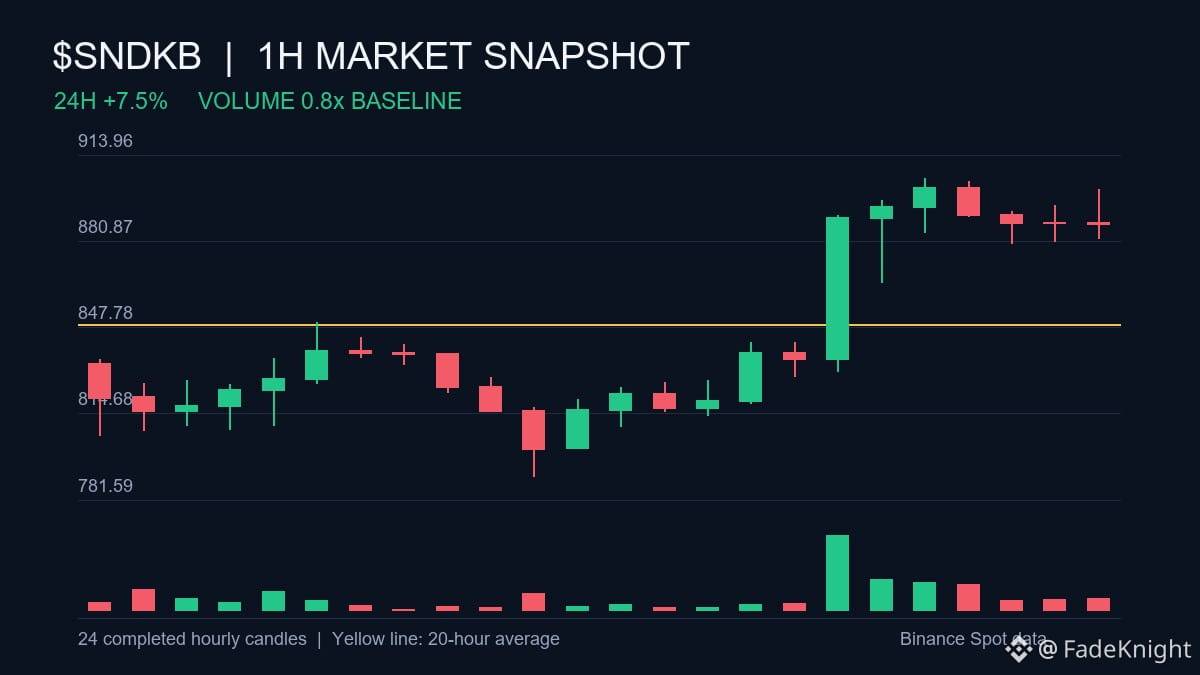
One thing the chart says: Latest price is 1.4% below the 24h high.
$SNDKB sits 89% of the way from its 24h low ($790.72) to its high ($904.83).
Does this range position look settled, or still in motion?
#SNDKB #AltcoinFlow #RangeWatch
One thing the chart says: Latest price is 1.4% below the 24h high.
$SNDKB sits 89% of the way from its 24h low ($790.72) to its high ($904.83).
Does this range position look settled, or still in motion?
#SNDKB #AltcoinFlow #RangeWatch
$SNDKB sits 89% of the way from its 24h low ($790.72) to its high ($904.83).
Does this range position look settled, or still in motion?
#SNDKB #AltcoinFlow #RangeWatch
165
·
--
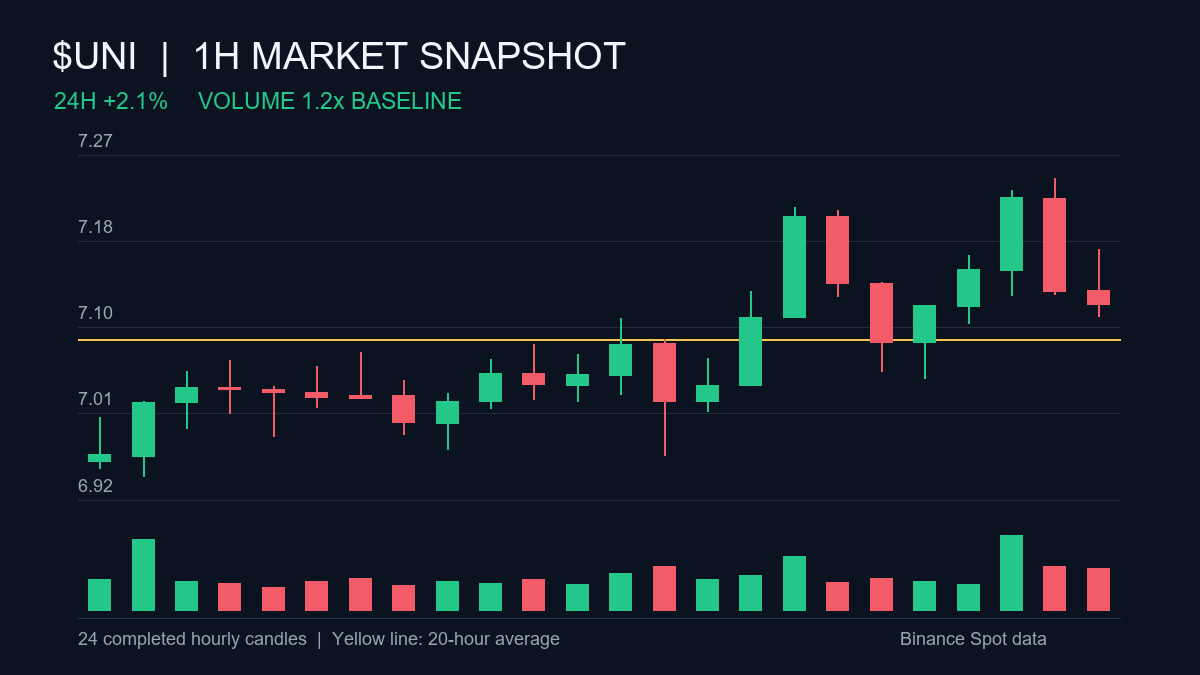
The chart says $UNI sits 56% of the way from its 24h low ($6.95) to its high ($7.25).
The data footnote is Latest price is 1.9% below the 24h high.
Is price holding the upper half of the range, or drifting back toward the middle?
#UNI #AltcoinFlow #RangeWatch
The chart says $UNI sits 56% of the way from its 24h low ($6.95) to its high ($7.25).
The data footnote is Latest price is 1.9% below the 24h high.
Is price holding the upper half of the range, or drifting back toward the middle?
#UNI #AltcoinFlow #RangeWatch
The data footnote is Latest price is 1.9% below the 24h high.
Is price holding the upper half of the range, or drifting back toward the middle?
#UNI #AltcoinFlow #RangeWatch
119
RANGE POSITION | $WLD
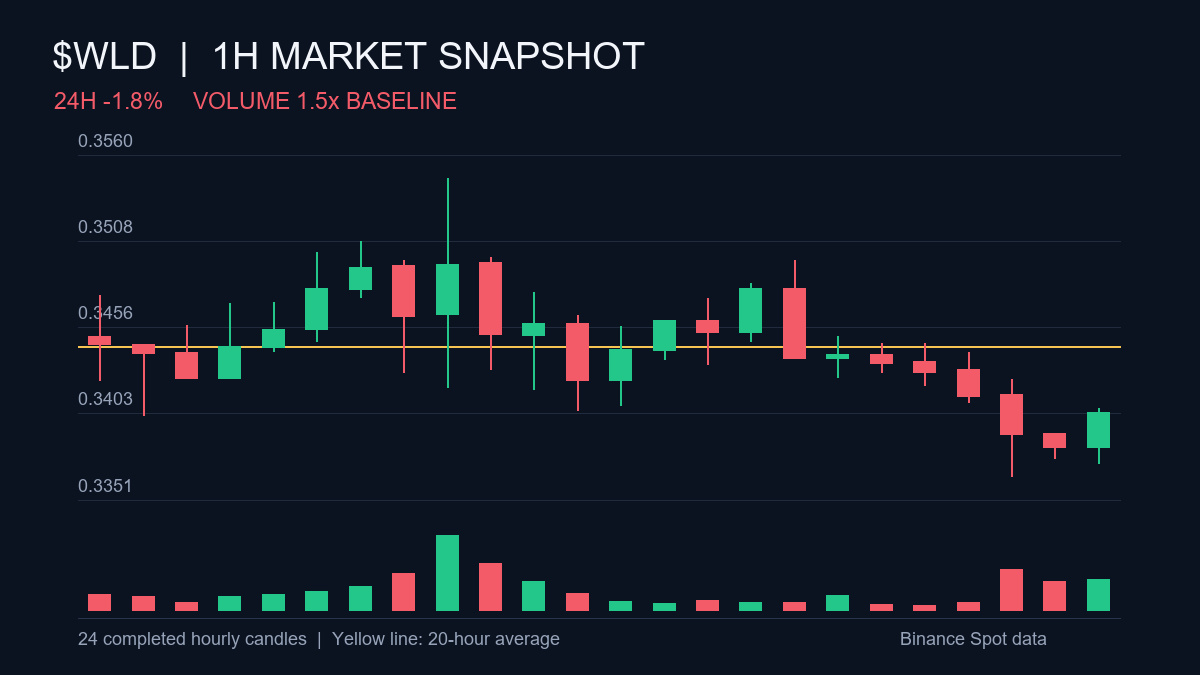
OBSERVATION — $WLD sits 19% of the way from its 24h low ($0.3365) to its high ($0.3546).
CONTEXT — Latest price is 4.3% below the 24h high.
NEXT CHECK — Range position gives context; it is not breakout confirmation.
#WLD #AltcoinFlow #RangeWatch
RANGE POSITION | $WLD
OBSERVATION — $WLD sits 19% of the way from its 24h low ($0.3365) to its high ($0.3546).
CONTEXT — Latest price is 4.3% below the 24h high.
NEXT CHECK — Range position gives context; it is not breakout confirmation.
#WLD #AltcoinFlow #RangeWatch
OBSERVATION — $WLD sits 19% of the way from its 24h low ($0.3365) to its high ($0.3546).
CONTEXT — Latest price is 4.3% below the 24h high.
NEXT CHECK — Range position gives context; it is not breakout confirmation.
#WLD #AltcoinFlow #RangeWatch
491
·
--
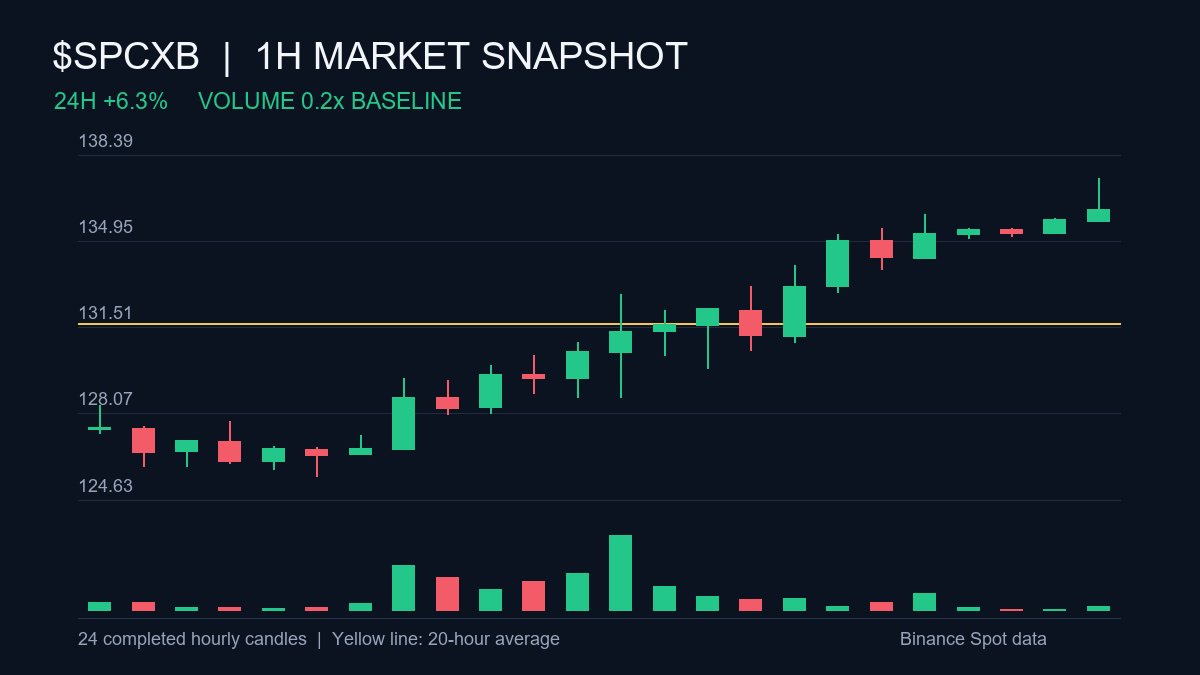
$SPCXB sits 86% of the way from its 24h low ($125.58) to its high ($137.44).
Context check: Latest price is 1.3% below the 24h high.
What would count as a real break from this 24h range for you?
#SPCXB #AltcoinFlow #RangeWatch
$SPCXB sits 86% of the way from its 24h low ($125.58) to its high ($137.44).
Context check: Latest price is 1.3% below the 24h high.
What would count as a real break from this 24h range for you?
#SPCXB #AltcoinFlow #RangeWatch
Context check: Latest price is 1.3% below the 24h high.
What would count as a real break from this 24h range for you?
#SPCXB #AltcoinFlow #RangeWatch
159
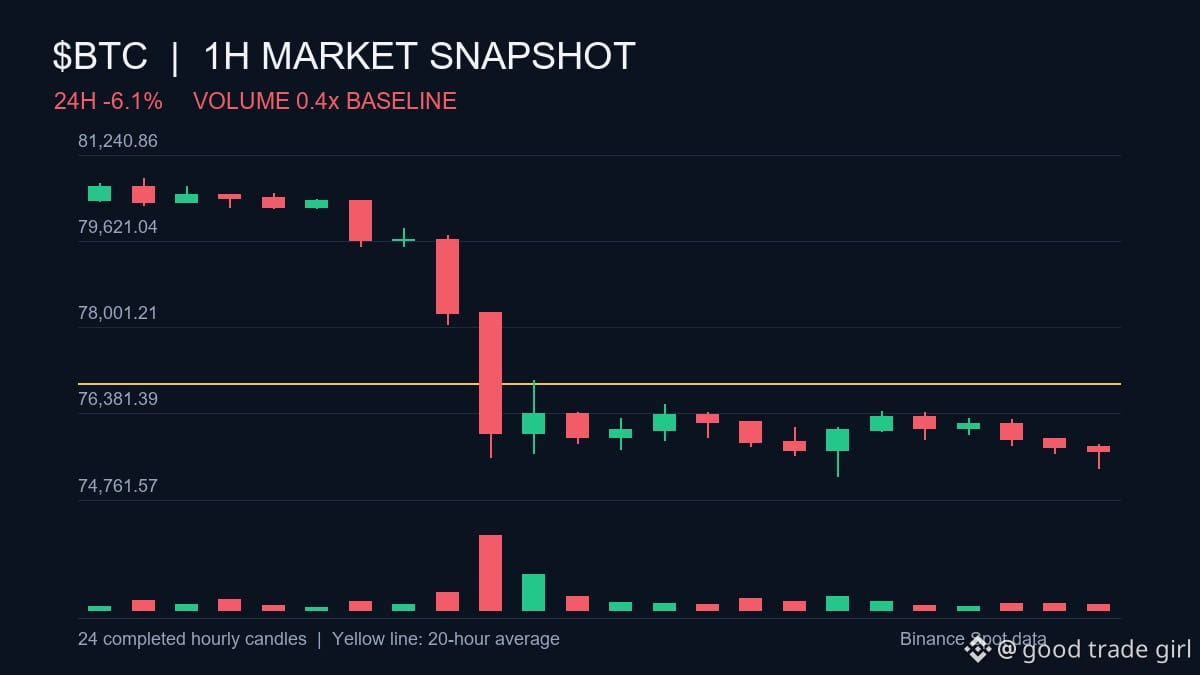
$BTC sits 8% of the way from its 24h low ($75,208.42) to its high ($80,794.01).
Context: Latest price is 6.8% below the 24h high.
Is price holding the upper half of the range, or drifting back toward the middle?
#BTC #LargeCaps #RangeWatch
$BTC sits 8% of the way from its 24h low ($75,208.42) to its high ($80,794.01).
Context: Latest price is 6.8% below the 24h high.
Is price holding the upper half of the range, or drifting back toward the middle?
#BTC #LargeCaps #RangeWatch
Context: Latest price is 6.8% below the 24h high.
Is price holding the upper half of the range, or drifting back toward the middle?
#BTC #LargeCaps #RangeWatch
97
·
--
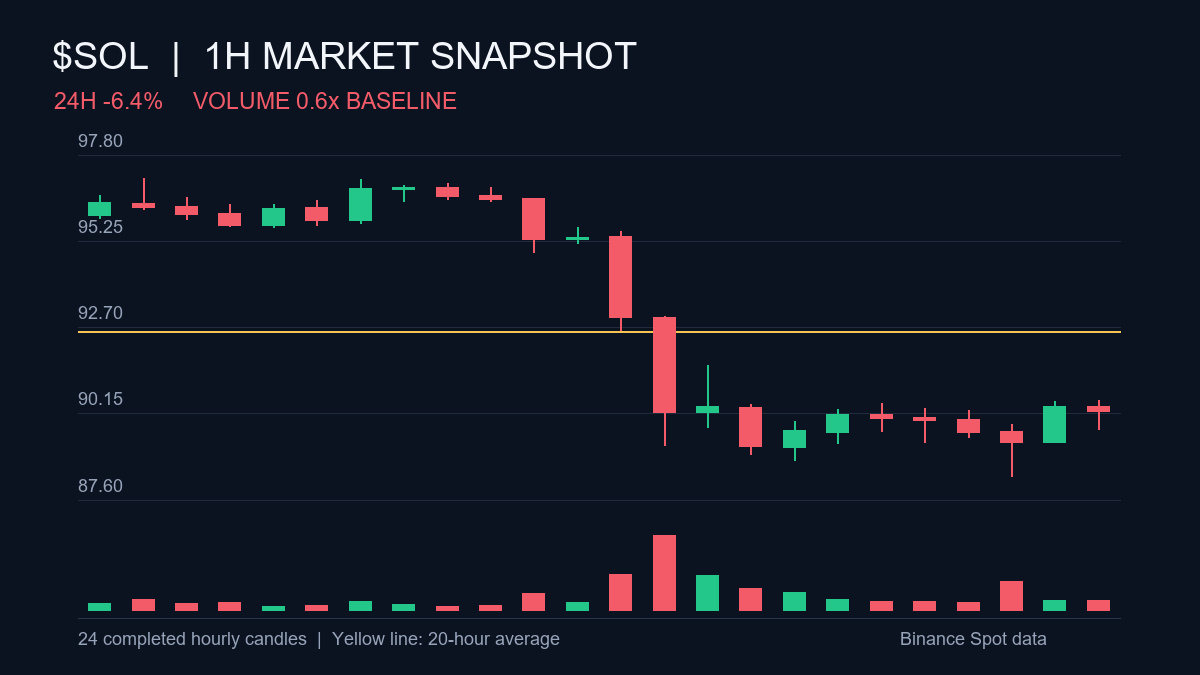
• $SOL sits 20% of the way from its 24h low ($88.30) to its high ($97.10).
• Latest price is 7.8% below the 24h high.
Does this range position look settled, or still in motion?
#SOL #LargeCaps #RangeWatch
• $SOL sits 20% of the way from its 24h low ($88.30) to its high ($97.10).
• Latest price is 7.8% below the 24h high.
Does this range position look settled, or still in motion?
#SOL #LargeCaps #RangeWatch
• Latest price is 7.8% below the 24h high.
Does this range position look settled, or still in motion?
#SOL #LargeCaps #RangeWatch
69
Numbers in focus:
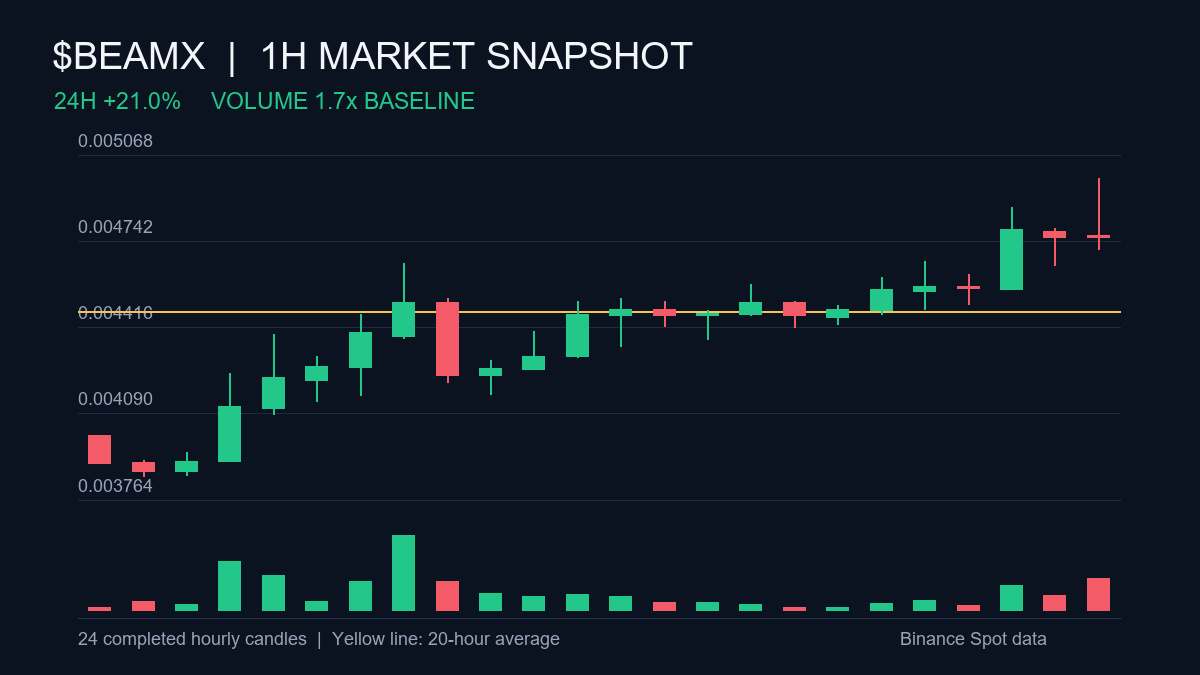
Latest price is 4.5% below the 24h high.
$BEAMX sits 81% of the way from its 24h low ($0.003854) to its high ($0.004978).
Is price holding the upper half of the range, or drifting back toward the middle?
#BEAMX #AltcoinFlow #RangeWatch
Numbers in focus:
Latest price is 4.5% below the 24h high.
$BEAMX sits 81% of the way from its 24h low ($0.003854) to its high ($0.004978).
Is price holding the upper half of the range, or drifting back toward the middle?
#BEAMX #AltcoinFlow #RangeWatch
Latest price is 4.5% below the 24h high.
$BEAMX sits 81% of the way from its 24h low ($0.003854) to its high ($0.004978).
Is price holding the upper half of the range, or drifting back toward the middle?
#BEAMX #AltcoinFlow #RangeWatch
144
·
--
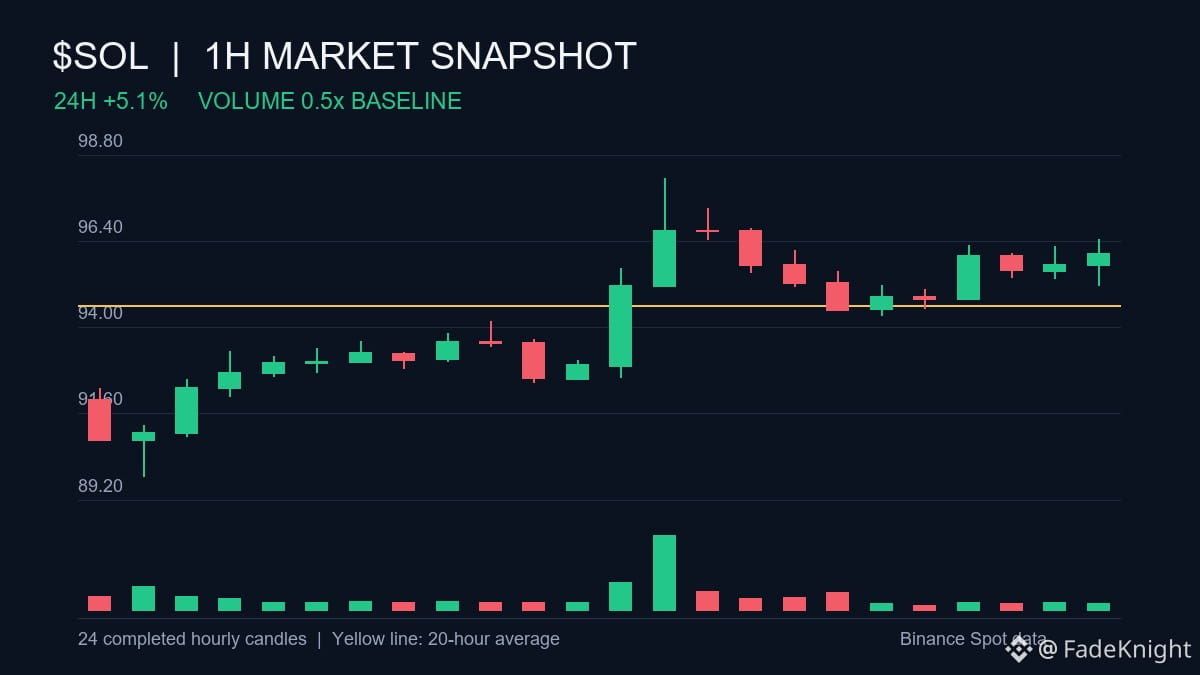
Quick tape read: Latest price is 2.0% below the 24h high.
$SOL sits 77% of the way from its 24h low ($89.86) to its high ($98.14).
Is price holding the upper half of the range, or drifting back toward the middle?
#SOL #LargeCaps #RangeWatch
Quick tape read: Latest price is 2.0% below the 24h high.
$SOL sits 77% of the way from its 24h low ($89.86) to its high ($98.14).
Is price holding the upper half of the range, or drifting back toward the middle?
#SOL #LargeCaps #RangeWatch
$SOL sits 77% of the way from its 24h low ($89.86) to its high ($98.14).
Is price holding the upper half of the range, or drifting back toward the middle?
#SOL #LargeCaps #RangeWatch
102
·
--
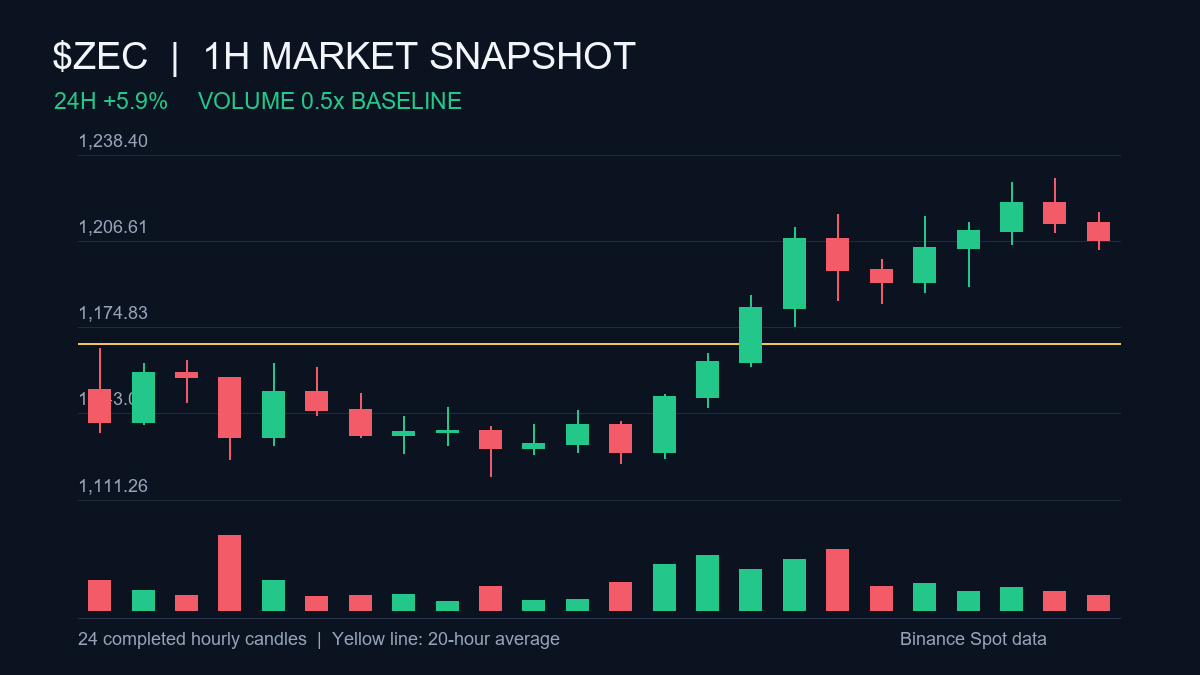
The chart says $ZEC sits 84% of the way from its 24h low ($1,120.03) to its high ($1,229.63).
The data footnote is Latest price is 1.5% below the 24h high.
What would count as a real break from this 24h range for you?
#ZEC #AltcoinFlow #RangeWatch
The chart says $ZEC sits 84% of the way from its 24h low ($1,120.03) to its high ($1,229.63).
The data footnote is Latest price is 1.5% below the 24h high.
What would count as a real break from this 24h range for you?
#ZEC #AltcoinFlow #RangeWatch
The data footnote is Latest price is 1.5% below the 24h high.
What would count as a real break from this 24h range for you?
#ZEC #AltcoinFlow #RangeWatch
1
284
WHERE PRICE SITS | $INTWB
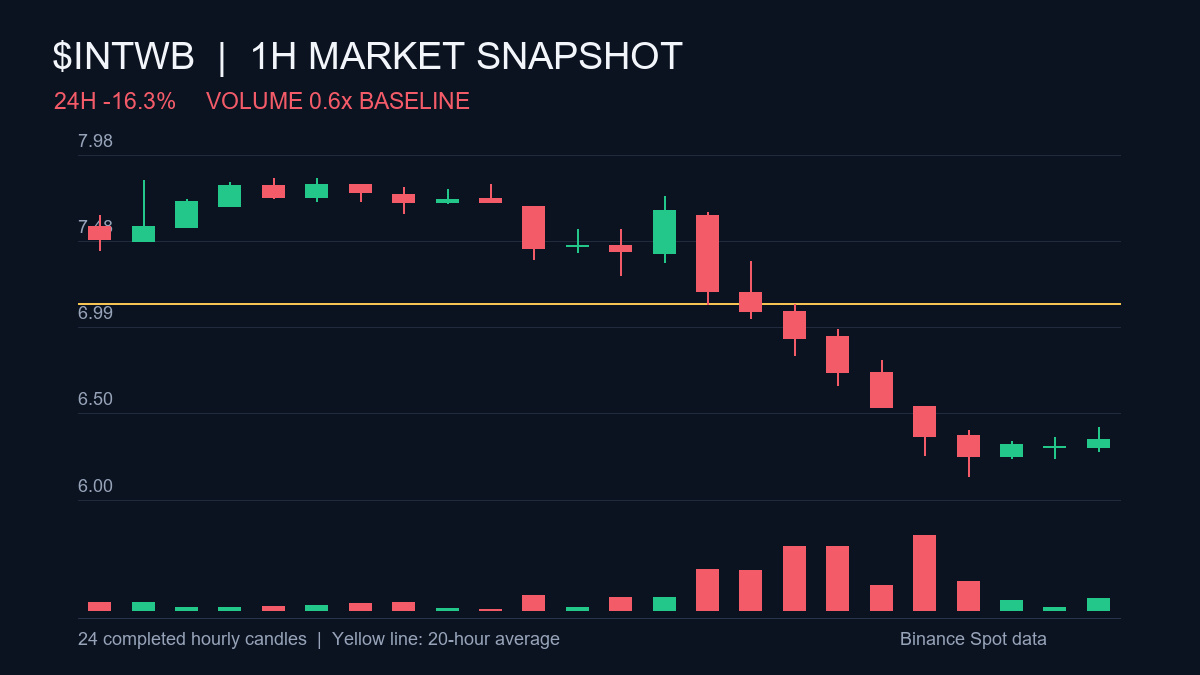
OBSERVATION — $INTWB sits 12% of the way from its 24h low ($6.14) to its high ($7.84).
CONTEXT — Latest price is 23.5% below the 24h high.
NEXT CHECK — Range position gives context; it is not breakout confirmation.
#INTWB #AltcoinFlow #RangeWatch
WHERE PRICE SITS | $INTWB
OBSERVATION — $INTWB sits 12% of the way from its 24h low ($6.14) to its high ($7.84).
CONTEXT — Latest price is 23.5% below the 24h high.
NEXT CHECK — Range position gives context; it is not breakout confirmation.
#INTWB #AltcoinFlow #RangeWatch
OBSERVATION — $INTWB sits 12% of the way from its 24h low ($6.14) to its high ($7.84).
CONTEXT — Latest price is 23.5% below the 24h high.
NEXT CHECK — Range position gives context; it is not breakout confirmation.
#INTWB #AltcoinFlow #RangeWatch
336
·
--
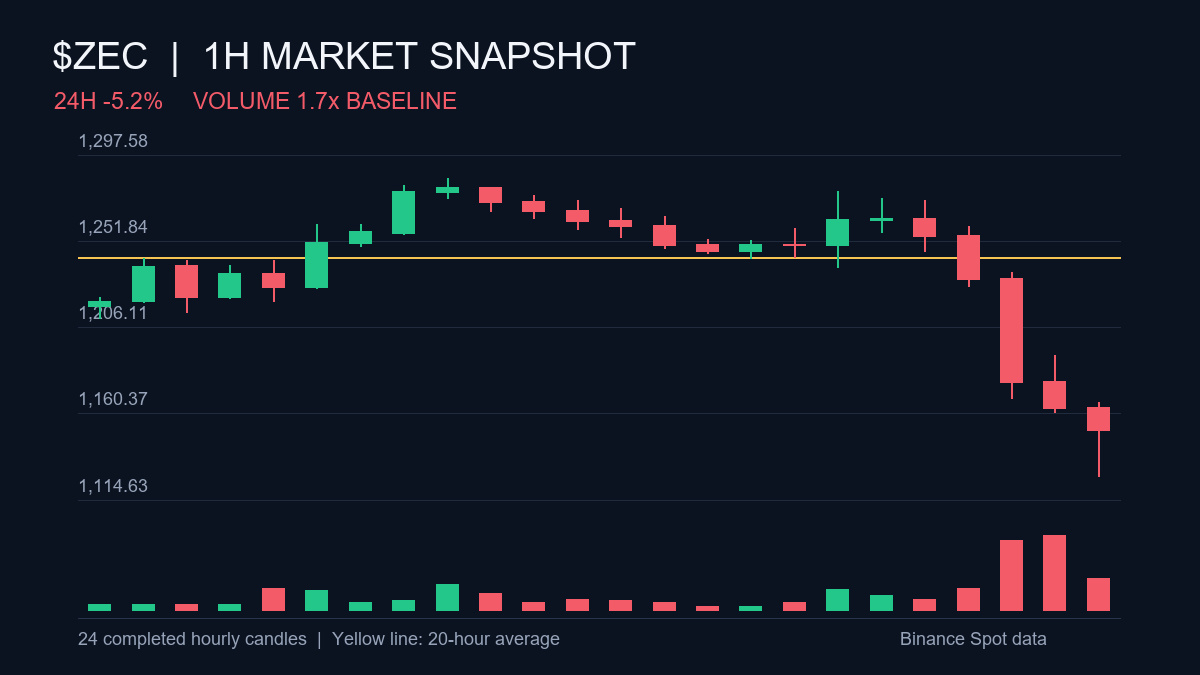
$ZEC sits 18% of the way from its 24h low ($1,127.25) to its high ($1,284.96).
Context check: Latest price is 11.1% below the 24h high.
Is price holding the upper half of the range, or drifting back toward the middle?
#ZEC #AltcoinFlow #RangeWatch
$ZEC sits 18% of the way from its 24h low ($1,127.25) to its high ($1,284.96).
Context check: Latest price is 11.1% below the 24h high.
Is price holding the upper half of the range, or drifting back toward the middle?
#ZEC #AltcoinFlow #RangeWatch
Context check: Latest price is 11.1% below the 24h high.
Is price holding the upper half of the range, or drifting back toward the middle?
#ZEC #AltcoinFlow #RangeWatch
41
·
--
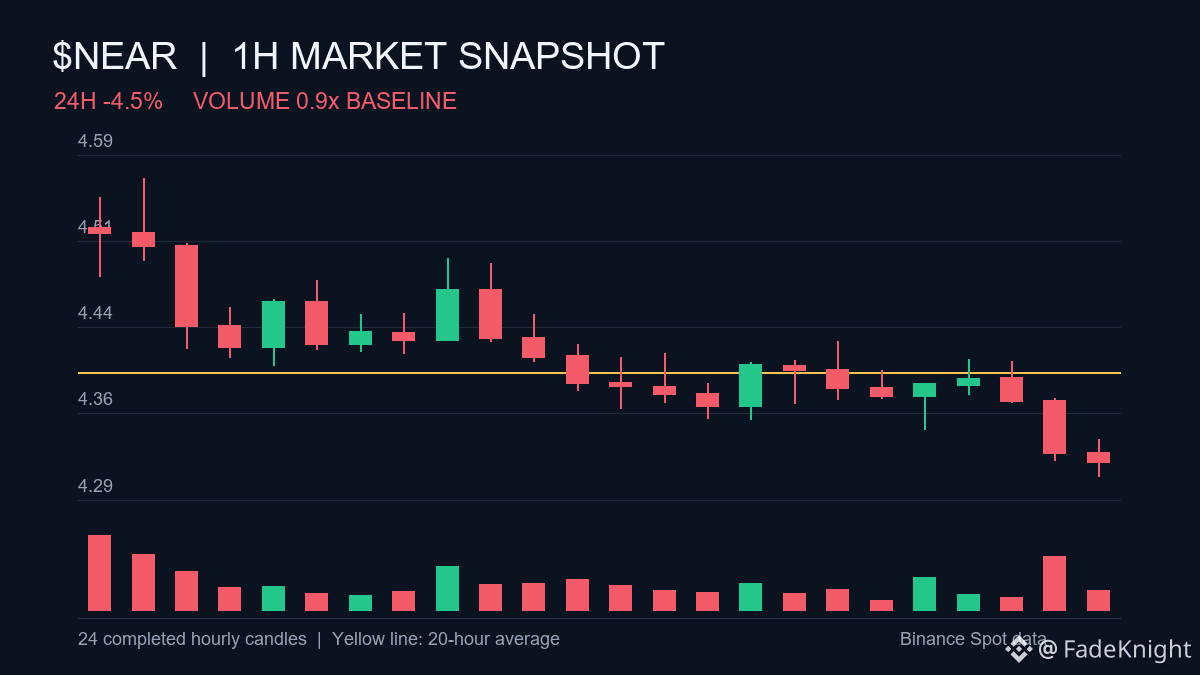
• $NEAR sits 5% of the way from its 24h low ($4.30) to its high ($4.57).
• Latest price is 5.9% below the 24h high.
What would count as a real break from this 24h range for you?
#NEAR #AltcoinFlow #RangeWatch
• $NEAR sits 5% of the way from its 24h low ($4.30) to its high ($4.57).
• Latest price is 5.9% below the 24h high.
What would count as a real break from this 24h range for you?
#NEAR #AltcoinFlow #RangeWatch
• Latest price is 5.9% below the 24h high.
What would count as a real break from this 24h range for you?
#NEAR #AltcoinFlow #RangeWatch
44
Numbers in focus:
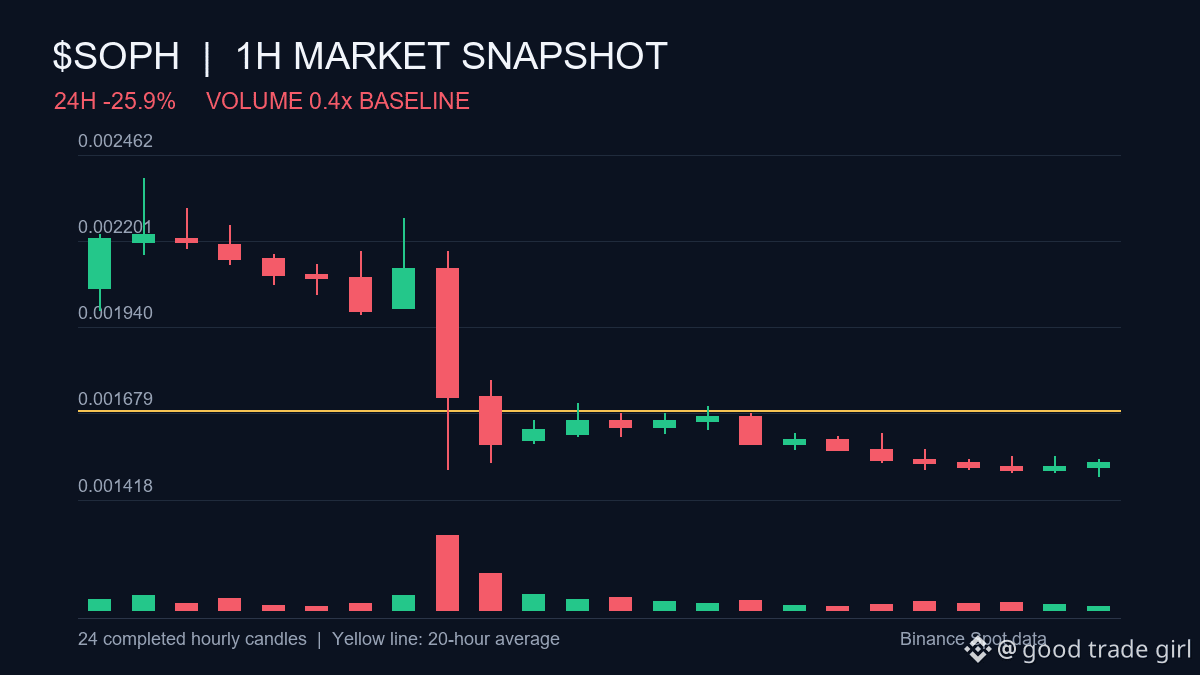
Latest price is 57.2% below the 24h high.
$SOPH sits 3% of the way from its 24h low ($0.001490) to its high ($0.002390).
Is price holding the upper half of the range, or drifting back toward the middle?
#SOPH #AltcoinFlow #RangeWatch
Numbers in focus:
Latest price is 57.2% below the 24h high.
$SOPH sits 3% of the way from its 24h low ($0.001490) to its high ($0.002390).
Is price holding the upper half of the range, or drifting back toward the middle?
#SOPH #AltcoinFlow #RangeWatch
Latest price is 57.2% below the 24h high.
$SOPH sits 3% of the way from its 24h low ($0.001490) to its high ($0.002390).
Is price holding the upper half of the range, or drifting back toward the middle?
#SOPH #AltcoinFlow #RangeWatch
9

·
--
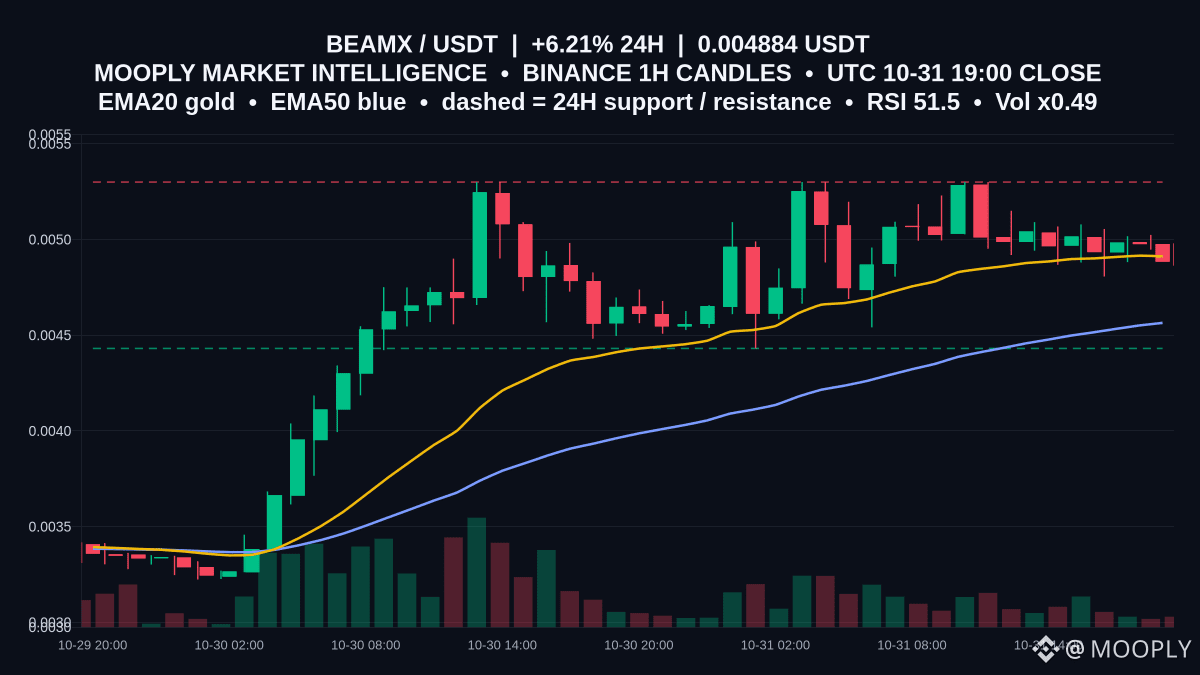
$BEAMX is pausing at 0.004884 after a +6.208% day, boxed between nearby moving averages.
Price sits just under EMA20 0.0049125 while holding above EMA50 0.0045645—this squeeze often decides the next push. With RSI 51.51 and MACD below its signal, momentum is muted and participation is light (vol x0.49).
Range setup: support at 0.004431 and resistance at 0.0053. The range holds while 0.004431 attracts bids and 0.0053 caps bounces. A firm 1h close above 0.0053 would confirm expansion; a close below 0.004431 would tilt bias lower.
Are you watching a reclaim of 0.0049125 first, or a liquidity sweep toward 0.004431?
Not financial advice.
#BEAMX #MarketContext #RangeWatch
$BEAMX is pausing at 0.004884 after a +6.208% day, boxed between nearby moving averages.
Price sits just under EMA20 0.0049125 while holding above EMA50 0.0045645—this squeeze often decides the next push. With RSI 51.51 and MACD below its signal, momentum is muted and participation is light (vol x0.49).
Range setup: support at 0.004431 and resistance at 0.0053. The range holds while 0.004431 attracts bids and 0.0053 caps bounces. A firm 1h close above 0.0053 would confirm expansion; a close below 0.004431 would tilt bias lower.
Are you watching a reclaim of 0.0049125 first, or a liquidity sweep toward 0.004431?
Not financial advice.
#BEAMX #MarketContext #RangeWatch
Price sits just under EMA20 0.0049125 while holding above EMA50 0.0045645—this squeeze often decides the next push. With RSI 51.51 and MACD below its signal, momentum is muted and participation is light (vol x0.49).
Range setup: support at 0.004431 and resistance at 0.0053. The range holds while 0.004431 attracts bids and 0.0053 caps bounces. A firm 1h close above 0.0053 would confirm expansion; a close below 0.004431 would tilt bias lower.
Are you watching a reclaim of 0.0049125 first, or a liquidity sweep toward 0.004431?
Not financial advice.
#BEAMX #MarketContext #RangeWatch
36
·
--
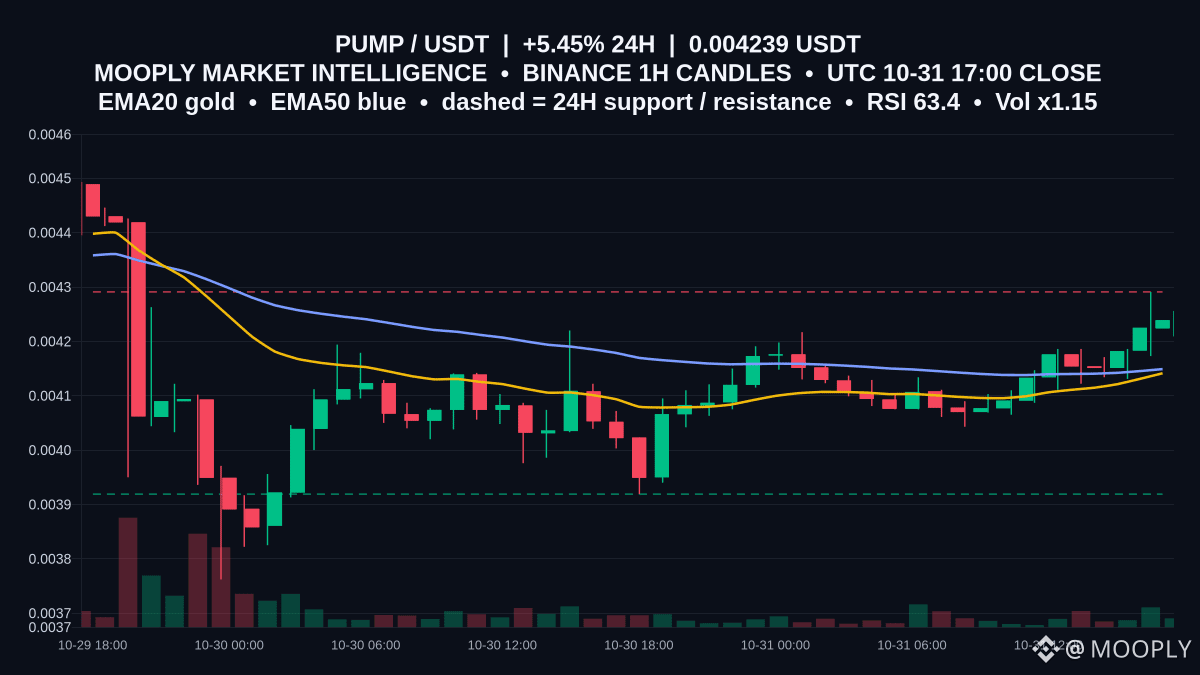
Pressing the top of its recent band, $PUMP is up 5.45% on the day.
Price sits at 0.004239, above EMA20 0.0041413 and EMA50 0.004149, with RSI 63.4 and a positive MACD over its signal—constructive but not stretched. The key level is 0.004291 resistance, which capped prior advances; it frames the range with 0.003919 as support.
In this RANGE setup, sellers have leaned on 0.004291 while buyers stepped in above 0.003919. The EMA cluster at 0.0041413–0.004149 is a useful intraband pivot; holding above it favors repeated retests of the ceiling.
A 1h close and acceptance above 0.004291 would confirm a break; rejection there or a loss of 0.003919 keeps the range intact. With volume slightly elevated (1.15x), follow-through is key.
Are you watching for a clean hourly close over 0.004291, or a rotation back toward the EMA zone first?
Not financial advice.
#PUMP #MarketContext #RangeWatch
Pressing the top of its recent band, $PUMP is up 5.45% on the day.
Price sits at 0.004239, above EMA20 0.0041413 and EMA50 0.004149, with RSI 63.4 and a positive MACD over its signal—constructive but not stretched. The key level is 0.004291 resistance, which capped prior advances; it frames the range with 0.003919 as support.
In this RANGE setup, sellers have leaned on 0.004291 while buyers stepped in above 0.003919. The EMA cluster at 0.0041413–0.004149 is a useful intraband pivot; holding above it favors repeated retests of the ceiling.
A 1h close and acceptance above 0.004291 would confirm a break; rejection there or a loss of 0.003919 keeps the range intact. With volume slightly elevated (1.15x), follow-through is key.
Are you watching for a clean hourly close over 0.004291, or a rotation back toward the EMA zone first?
Not financial advice.
#PUMP #MarketContext #RangeWatch
Price sits at 0.004239, above EMA20 0.0041413 and EMA50 0.004149, with RSI 63.4 and a positive MACD over its signal—constructive but not stretched. The key level is 0.004291 resistance, which capped prior advances; it frames the range with 0.003919 as support.
In this RANGE setup, sellers have leaned on 0.004291 while buyers stepped in above 0.003919. The EMA cluster at 0.0041413–0.004149 is a useful intraband pivot; holding above it favors repeated retests of the ceiling.
A 1h close and acceptance above 0.004291 would confirm a break; rejection there or a loss of 0.003919 keeps the range intact. With volume slightly elevated (1.15x), follow-through is key.
Are you watching for a clean hourly close over 0.004291, or a rotation back toward the EMA zone first?
Not financial advice.
#PUMP #MarketContext #RangeWatch
31
·
--
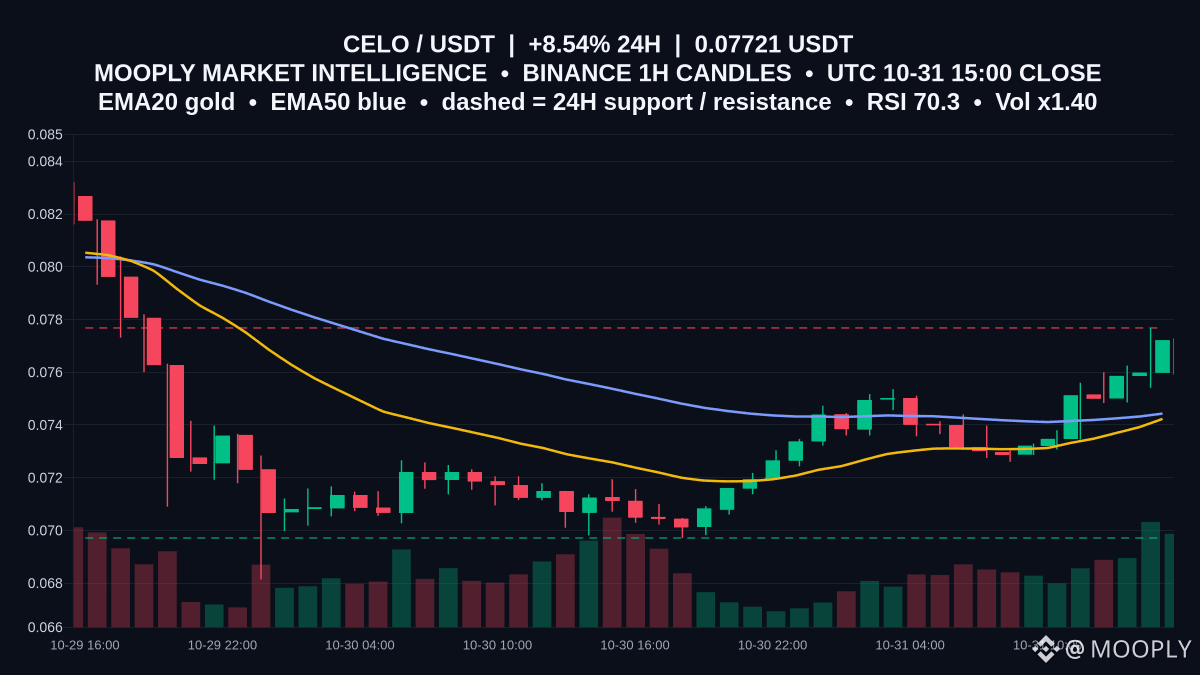
Bid pressure returns to $CELO with a 24h gain of 8.544% and price at 0.07721, sitting just beneath defined resistance at 0.07768.
Why it matters: RSI is elevated at 70.35 while price trades above EMA20 0.07423 and EMA50 0.07443, making that moving-average band the immediate test if momentum cools.
Range view: resistance 0.07768, support 0.06971. ATR14 at 0.00121 implies typical 1h swings can reject moves near the top. A firm 1h close above 0.07768 would signal range expansion; failure keeps rotation toward 0.07423–0.07443 and, if that fails, 0.06971. MACD stays positive (0.00076563 vs 0.00034641).
Will you watch for an hourly close over 0.07768, or a fade toward the 0.07423–0.07443 zone?
Not financial advice.
#CELO #MarketContext #RangeWatch
Bid pressure returns to $CELO with a 24h gain of 8.544% and price at 0.07721, sitting just beneath defined resistance at 0.07768.
Why it matters: RSI is elevated at 70.35 while price trades above EMA20 0.07423 and EMA50 0.07443, making that moving-average band the immediate test if momentum cools.
Range view: resistance 0.07768, support 0.06971. ATR14 at 0.00121 implies typical 1h swings can reject moves near the top. A firm 1h close above 0.07768 would signal range expansion; failure keeps rotation toward 0.07423–0.07443 and, if that fails, 0.06971. MACD stays positive (0.00076563 vs 0.00034641).
Will you watch for an hourly close over 0.07768, or a fade toward the 0.07423–0.07443 zone?
Not financial advice.
#CELO #MarketContext #RangeWatch
Why it matters: RSI is elevated at 70.35 while price trades above EMA20 0.07423 and EMA50 0.07443, making that moving-average band the immediate test if momentum cools.
Range view: resistance 0.07768, support 0.06971. ATR14 at 0.00121 implies typical 1h swings can reject moves near the top. A firm 1h close above 0.07768 would signal range expansion; failure keeps rotation toward 0.07423–0.07443 and, if that fails, 0.06971. MACD stays positive (0.00076563 vs 0.00034641).
Will you watch for an hourly close over 0.07768, or a fade toward the 0.07423–0.07443 zone?
Not financial advice.
#CELO #MarketContext #RangeWatch
35
Log in to explore more content
Join global crypto users on Binance Square
⚡️ Get latest and useful information about crypto.
💬 Trusted by the world’s largest crypto exchange.
👍 Discover real insights from verified creators.
Email / Phone number
Trending Topics
1
#HuangRisksOusterOverReportedAffairWithSubordinate
44,711 views
684 Discussing
2
#AnthropicRejectsIPODelayValuationinQuestion
495,592 views
4,103 Discussing
3
#CoreWeaveJumps10%On168%RevenueGrowth
78,958 views
998 Discussing
4
#ZcashFallsBelow$1000ForFirstTimeSinceSeptember
44,831 views
204 Discussing
5
#MSCIRemovalMayCurbStrategy’sBitcoinBuying
7,093 views
140 Discussing
6
#CanNvidiaEarningsEaseMarketConcerns?
190,589 views
1,914 Discussing
7
#SouthKoreaToLetExchangesSuspendWithdrawalsOnSuspectedHacks
166 views
10 Discussing
8
#PythAddsNYSERealTimeDataToMarketplace
2,949 views
83 Discussing
9
#SolanaCompanyReports$3.4MQ3Revenue
1,244 views
30 Discussing
10
#TradFiForBeginners
486,894 views
3,313 Discussing