

#qnttrading
qnttrading
4,780 views
19 Discussing
Hot
Latest

·
--
Verified
$QNT jumps 56%, with a banking announcement behind the hype.
On September 24, The Clearing House selected Quant to power its tokenized deposit payments network. This gives the rally a credible adoption catalyst, although the announcement alone doesn’t establish fresh QNT buying by banks.
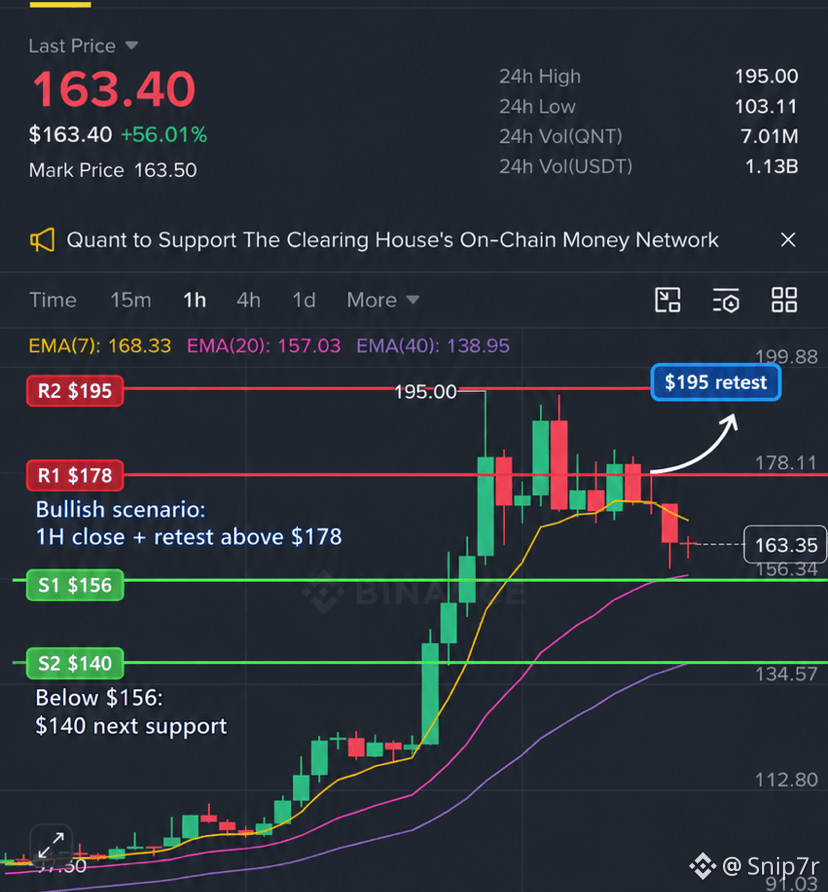
1H snapshot shows $163 after rejection at $195, with RSI cooling to 58.
A close above $178 followed by a successful retest strengthens the case for $195. Lose $156 support, and $140 becomes the next downside level.
#QNTTrading
$QNT jumps 56%, with a banking announcement behind the hype.
On September 24, The Clearing House selected Quant to power its tokenized deposit payments network. This gives the rally a credible adoption catalyst, although the announcement alone doesn’t establish fresh QNT buying by banks.
1H snapshot shows $163 after rejection at $195, with RSI cooling to 58.
A close above $178 followed by a successful retest strengthens the case for $195. Lose $156 support, and $140 becomes the next downside level.
#QNTTrading
On September 24, The Clearing House selected Quant to power its tokenized deposit payments network. This gives the rally a credible adoption catalyst, although the announcement alone doesn’t establish fresh QNT buying by banks.
1H snapshot shows $163 after rejection at $195, with RSI cooling to 58.
A close above $178 followed by a successful retest strengthens the case for $195. Lose $156 support, and $140 becomes the next downside level.
#QNTTrading
Max-Tor628:
short largo en 195 epico
2
2
5.6k

·
--
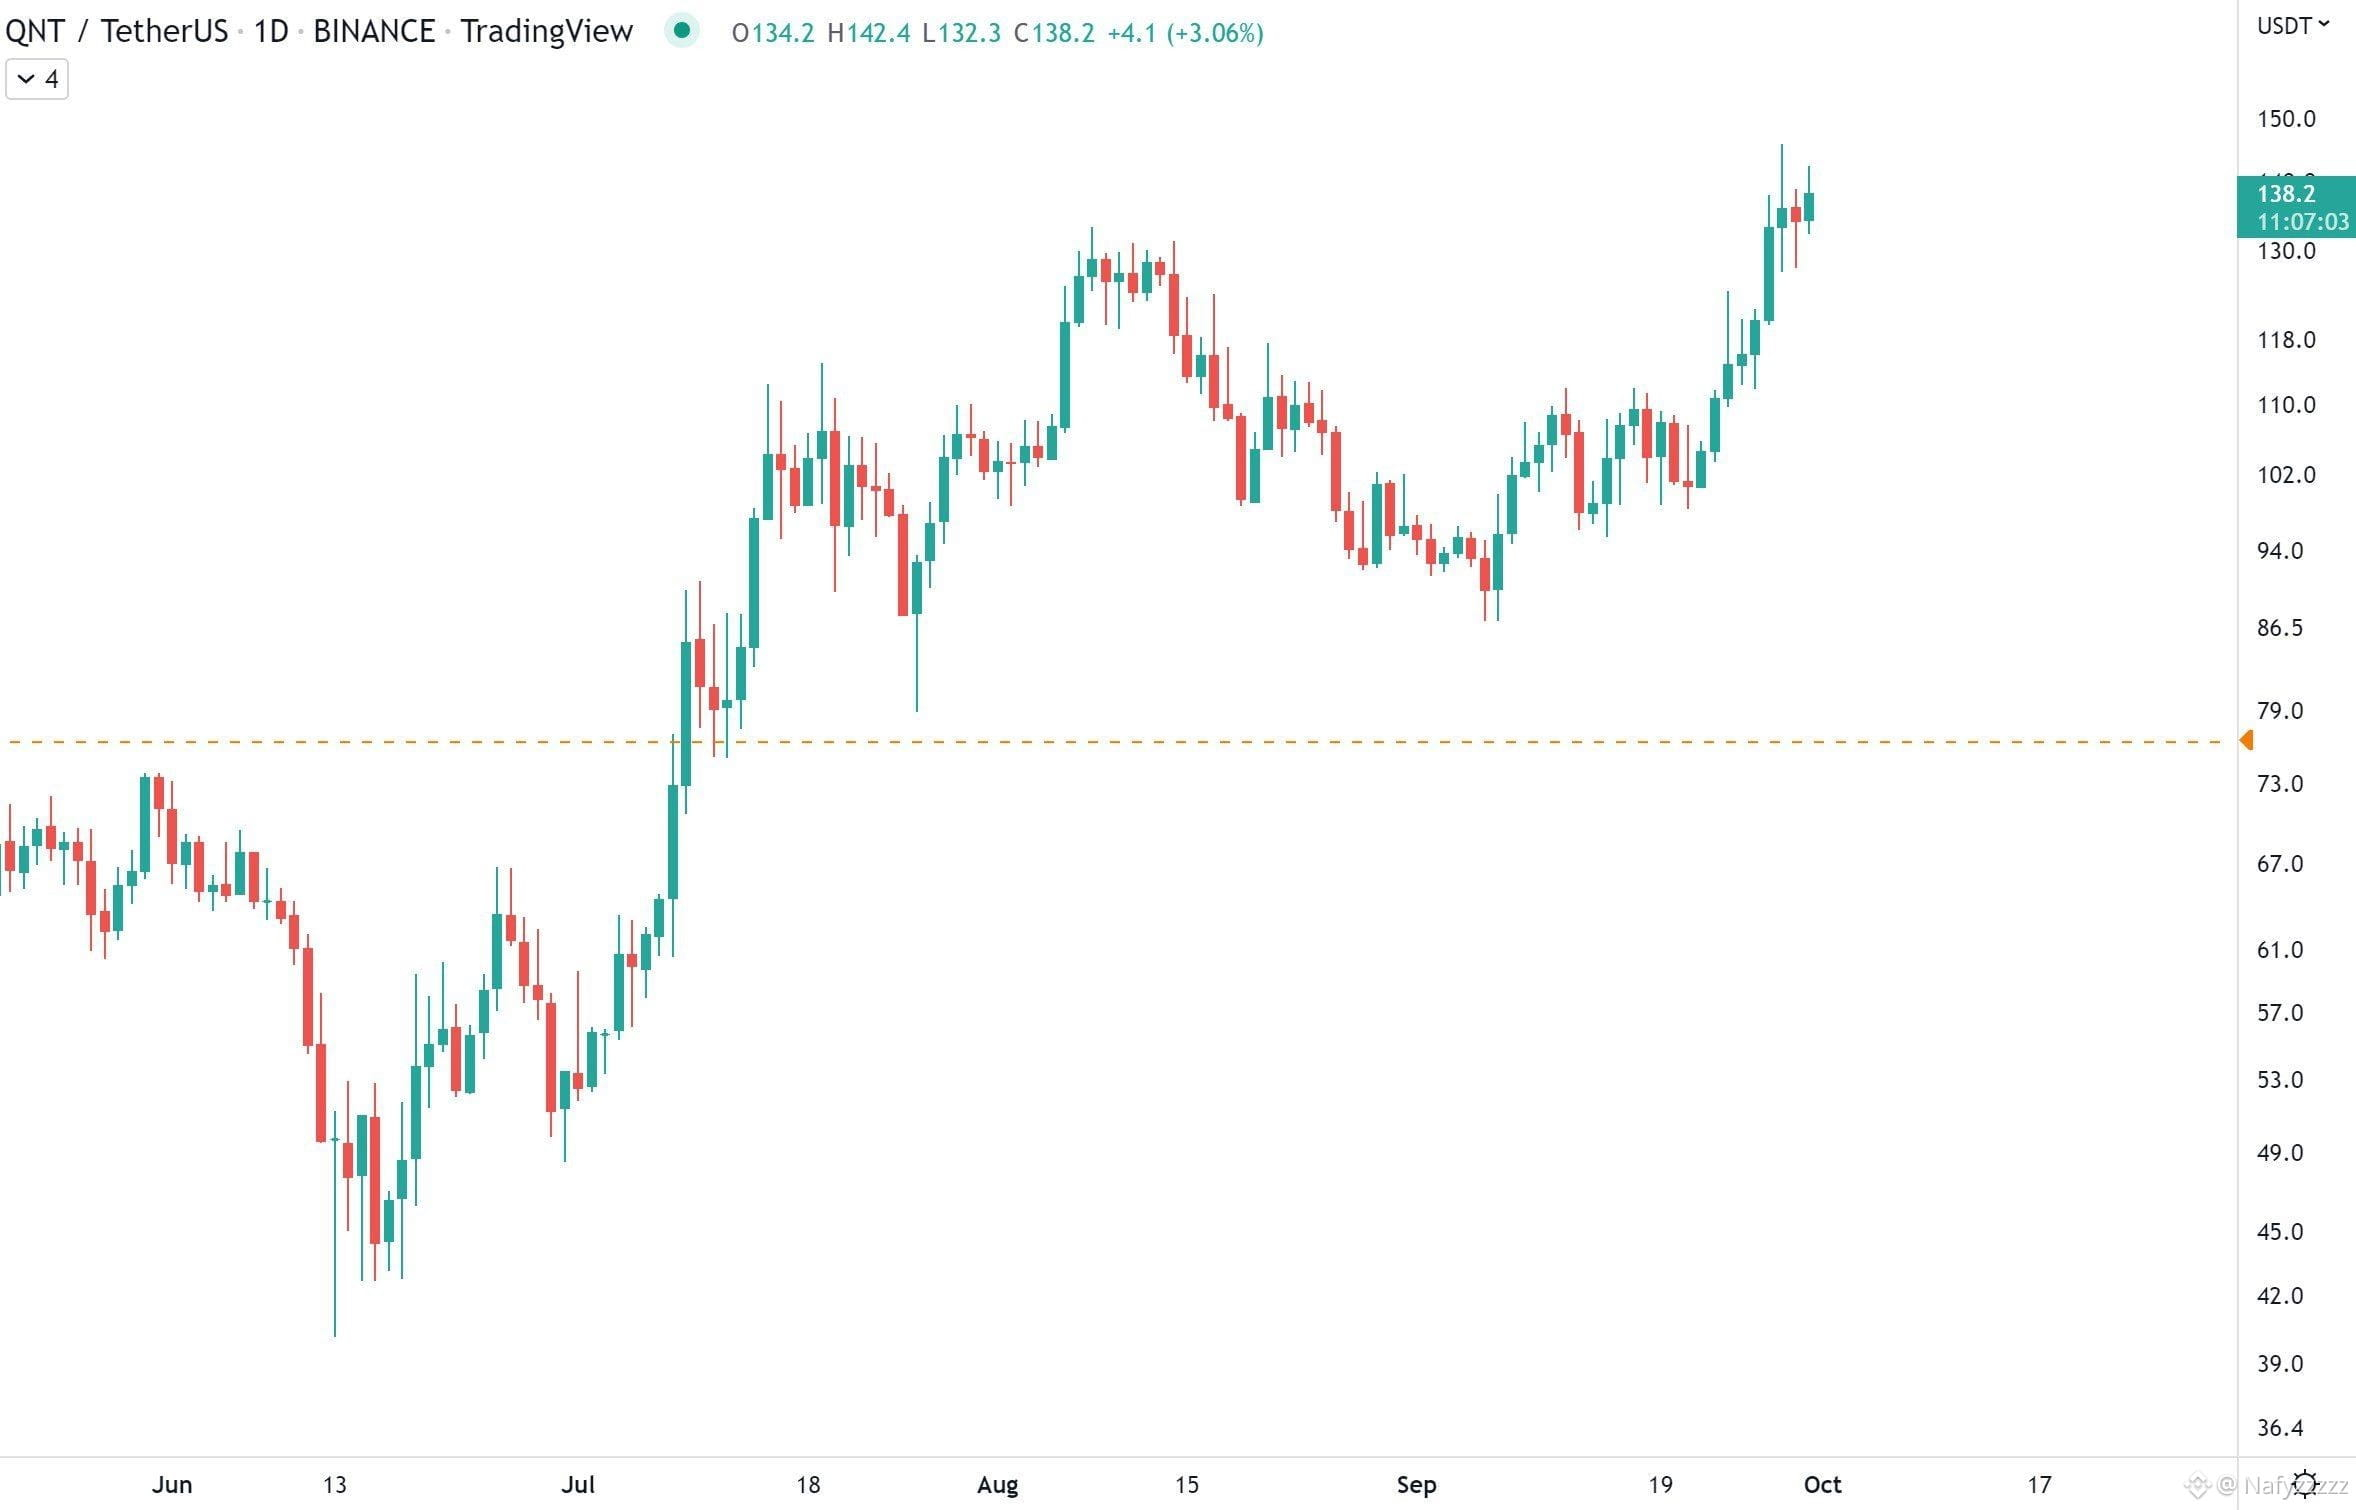
$QNT trading around $187, up roughly 52% in 24h, with strong momentum but elevated volatility; key levels to watch are $173 support and $192 resistance. #QNTupdate #QNTTrading #BitwiseFilesFinalNEARSpotETFProspectus #DogecoinETFsPostBiggestWeekSinceLaunch #StrategyStriveAdd2305BitcoinThisWeek
{spot}(QNTUSDT)
$QNT trading around $187, up roughly 52% in 24h, with strong momentum but elevated volatility; key levels to watch are $173 support and $192 resistance. #QNTupdate #QNTTrading #BitwiseFilesFinalNEARSpotETFProspectus #DogecoinETFsPostBiggestWeekSinceLaunch #StrategyStriveAdd2305BitcoinThisWeek
261

·
--
Bullish
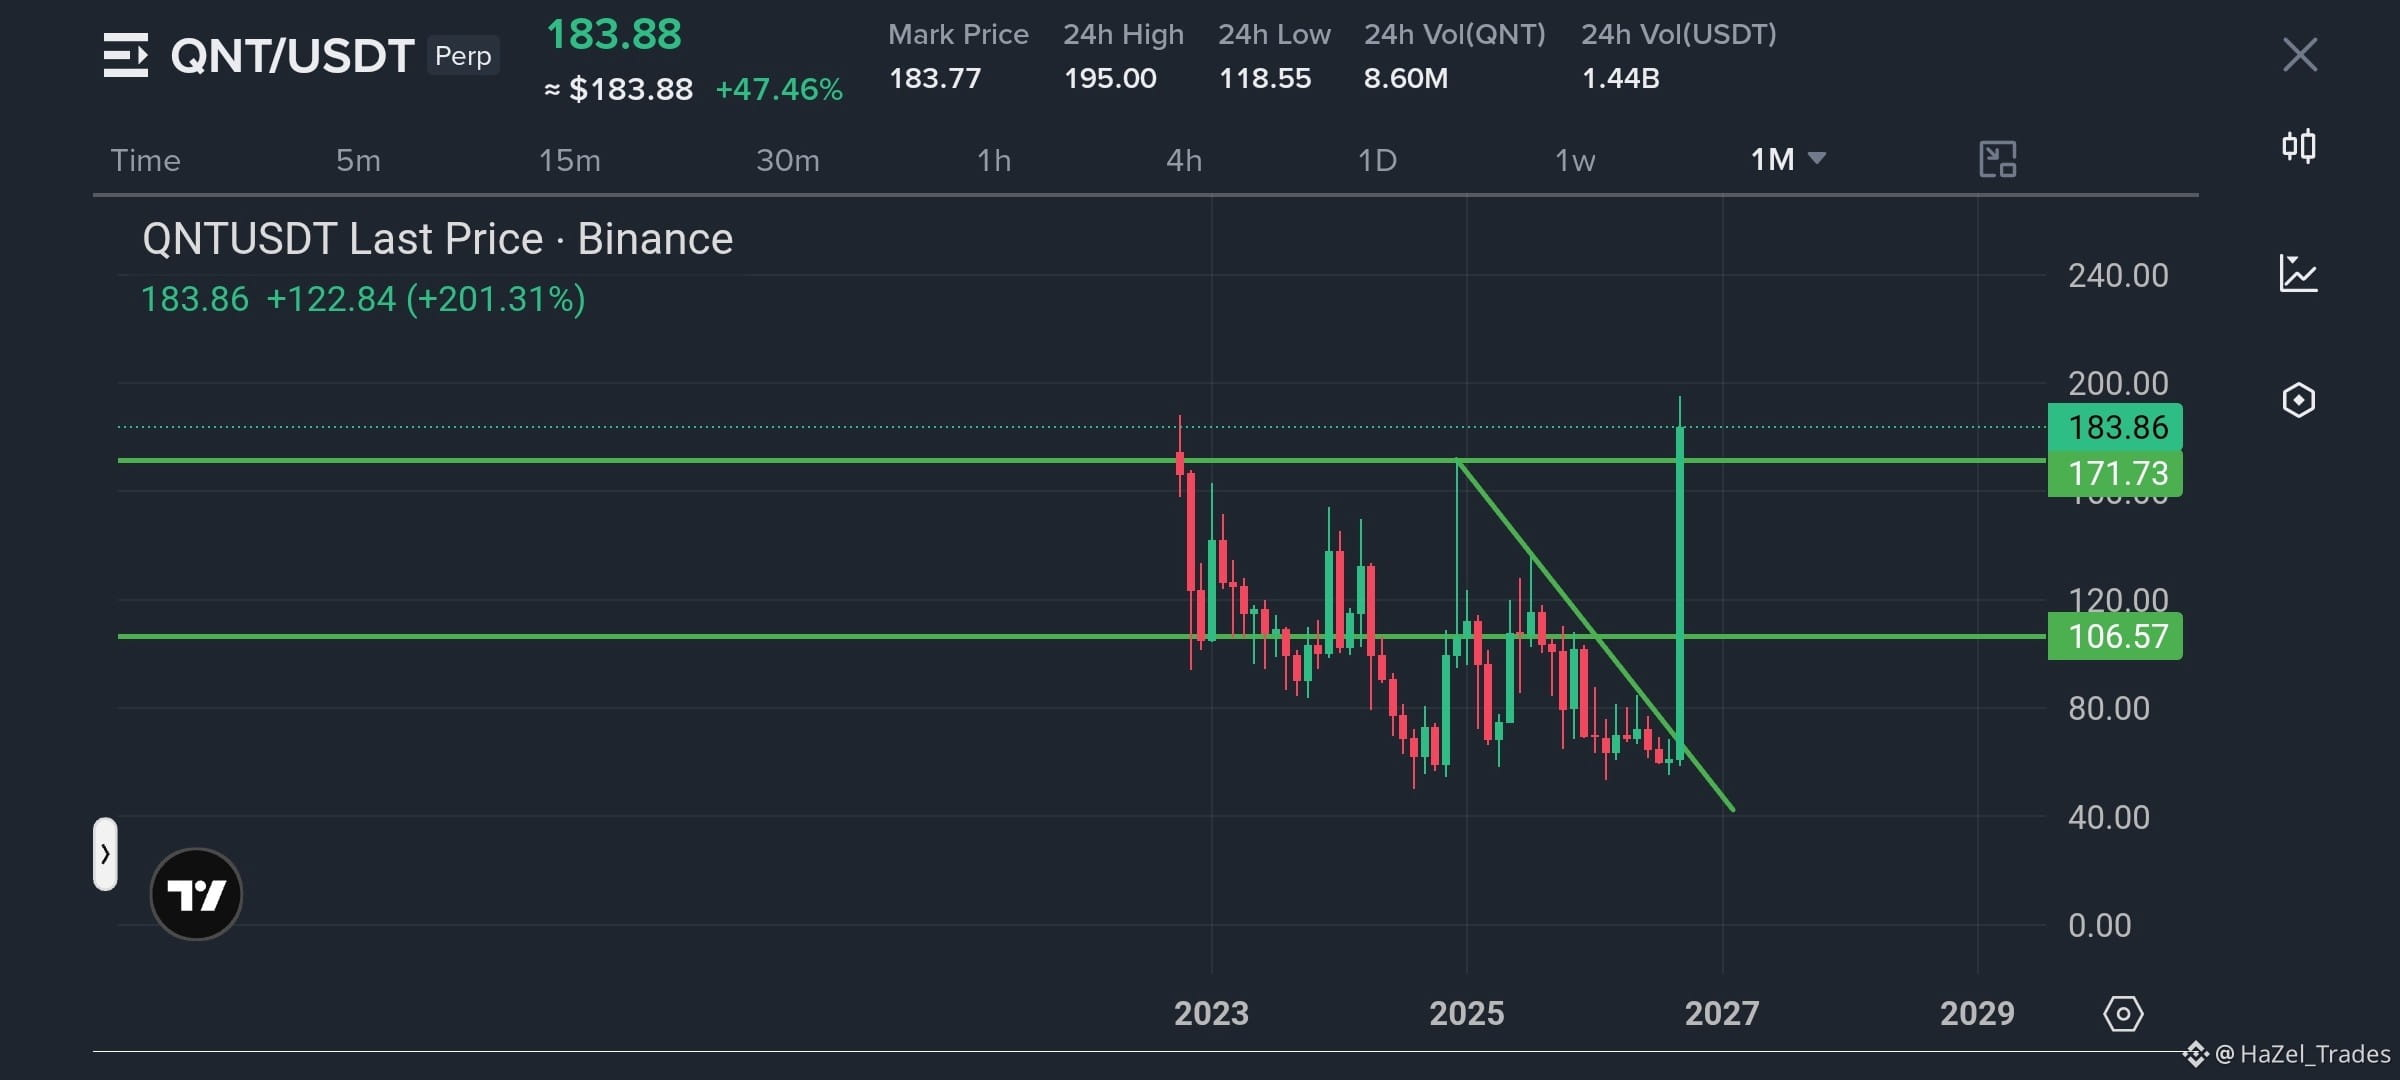
$QNT Strong upside potential holding bullish momentum with strong market presence. Looks ready for a solid expansion towards higher targets.
Long setup
Entry: $180 - $185
TP: $200 - $230 - $260 - $300 - $400
SL: $166
{future}(QNTUSDT)
#BitwiseFilesFinalNEARSpotETFProspectus #DogecoinETFsPostBiggestWeekSinceLaunch #QNTTrading
$QNT Strong upside potential holding bullish momentum with strong market presence. Looks ready for a solid expansion towards higher targets.
Long setup
Entry: $180 - $185
TP: $200 - $230 - $260 - $300 - $400
SL: $166
#BitwiseFilesFinalNEARSpotETFProspectus #DogecoinETFsPostBiggestWeekSinceLaunch #QNTTrading
Long setup
Entry: $180 - $185
TP: $200 - $230 - $260 - $300 - $400
SL: $166
#BitwiseFilesFinalNEARSpotETFProspectus #DogecoinETFsPostBiggestWeekSinceLaunch #QNTTrading
1
85

·
--
Bullish
📊 $QNT QNT (Quant) — Technical Analysis Update
QNT has recently shown strong bullish momentum after a sharp price breakout.
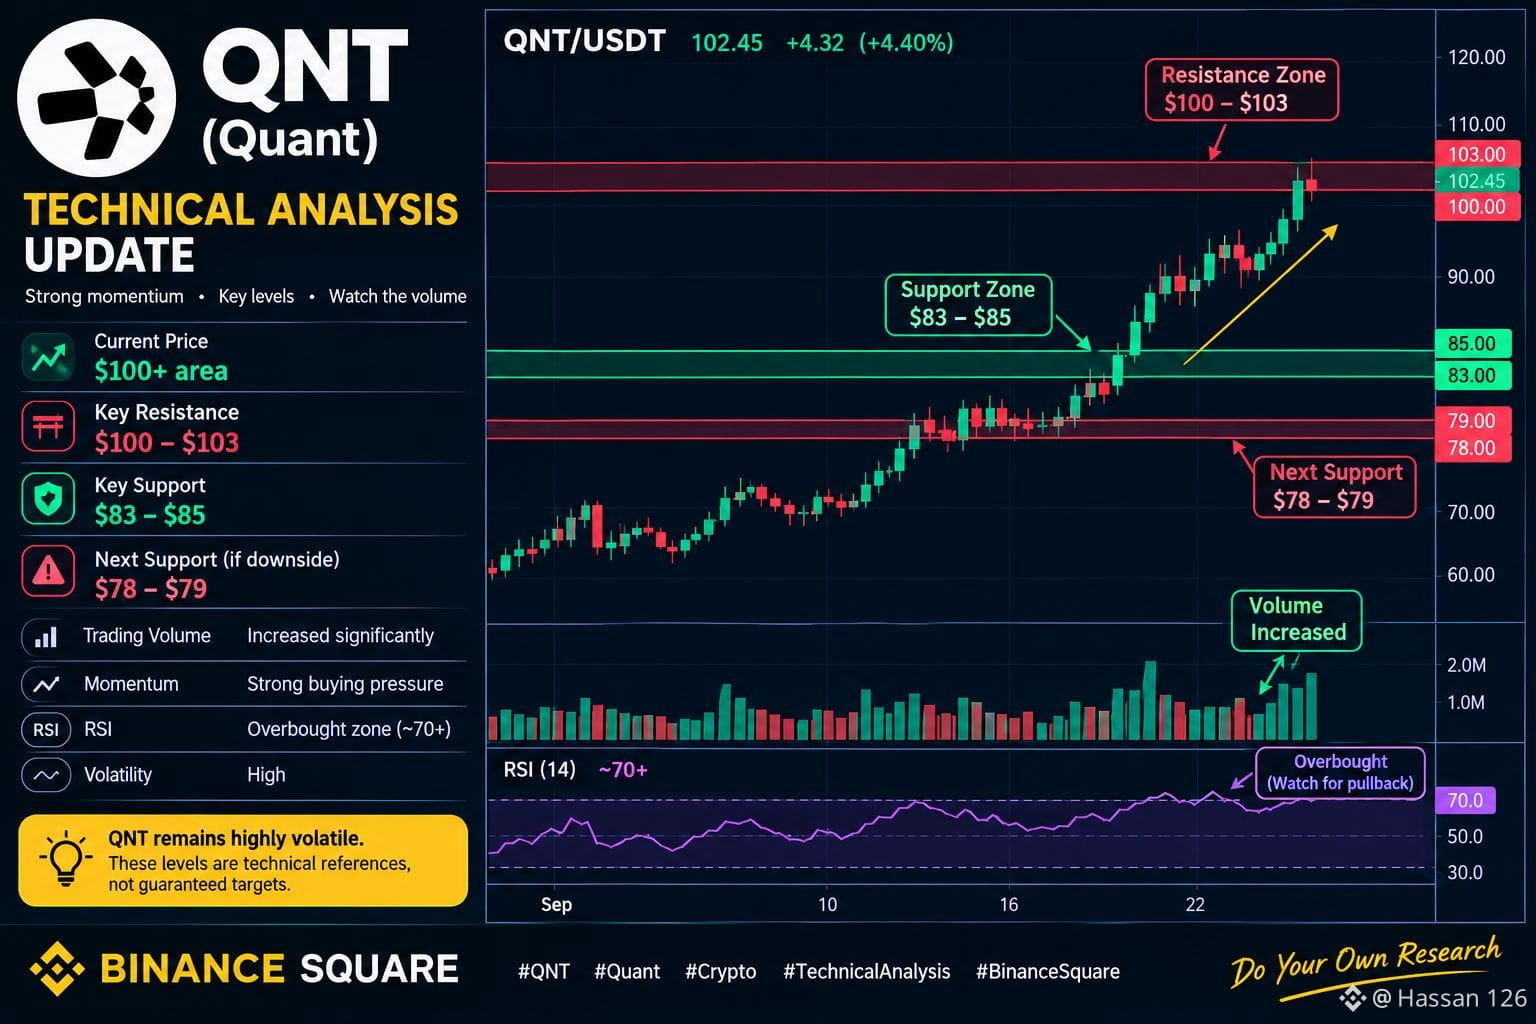
Recent market data places QNT around the $100+ area, with elevated volatility.
The $100–$103 zone is an important resistance area to watch.
A sustained move above this zone could strengthen the bullish structure.
The $83–$85 region is a key support area after the recent rally.
Another downside reference is around $78–$79 if selling pressure increases.
Trading volume has increased significantly during the recent breakout.
Momentum indicators are showing strong buying pressure, but short-term conditions may be overheated.
RSI readings reported by market analysts are around the overbought zone.
This means a pullback or consolidation could occur before another major move.
If buyers defend support, the market structure may remain constructive.
Traders should watch volume and candle closes around major resistance levels.
QNT remains highly volatile, so sudden moves in either direction are possible.
These levels are technical references, not guaranteed price targets.
Always do your own research and manage risk carefully.
#QNTUSDT #QNTTrading #QNTtoday #QNTEntry #QNT
{spot}(QNTUSDT)
📊 $QNT QNT (Quant) — Technical Analysis Update
QNT has recently shown strong bullish momentum after a sharp price breakout.
Recent market data places QNT around the $100+ area, with elevated volatility.
The $100–$103 zone is an important resistance area to watch.
A sustained move above this zone could strengthen the bullish structure.
The $83–$85 region is a key support area after the recent rally.
Another downside reference is around $78–$79 if selling pressure increases.
Trading volume has increased significantly during the recent breakout.
Momentum indicators are showing strong buying pressure, but short-term conditions may be overheated.
RSI readings reported by market analysts are around the overbought zone.
This means a pullback or consolidation could occur before another major move.
If buyers defend support, the market structure may remain constructive.
Traders should watch volume and candle closes around major resistance levels.
QNT remains highly volatile, so sudden moves in either direction are possible.
These levels are technical references, not guaranteed price targets.
Always do your own research and manage risk carefully.
#QNTUSDT #QNTTrading #QNTtoday #QNTEntry #QNT
QNT has recently shown strong bullish momentum after a sharp price breakout.
Recent market data places QNT around the $100+ area, with elevated volatility.
The $100–$103 zone is an important resistance area to watch.
A sustained move above this zone could strengthen the bullish structure.
The $83–$85 region is a key support area after the recent rally.
Another downside reference is around $78–$79 if selling pressure increases.
Trading volume has increased significantly during the recent breakout.
Momentum indicators are showing strong buying pressure, but short-term conditions may be overheated.
RSI readings reported by market analysts are around the overbought zone.
This means a pullback or consolidation could occur before another major move.
If buyers defend support, the market structure may remain constructive.
Traders should watch volume and candle closes around major resistance levels.
QNT remains highly volatile, so sudden moves in either direction are possible.
These levels are technical references, not guaranteed price targets.
Always do your own research and manage risk carefully.
#QNTUSDT #QNTTrading #QNTtoday #QNTEntry #QNT
372
Log in to explore more content
Join global crypto users on Binance Square
⚡️ Get latest and useful information about crypto.
💬 Trusted by the world’s largest crypto exchange.
👍 Discover real insights from verified creators.
Email / Phone number
Trending Topics
1
#BitwiseFilesFinalNEARSpotETFProspectus
70,840 views
1,272 Discussing
2
#BitgetHackerMoves$83MStolenXRP
29,399 views
155 Discussing
3
#SOLSpotETFWeeklyInflow$188M
18,638 views
126 Discussing
4
#DogecoinETFsPostBiggestWeekSinceLaunch
46,255 views
898 Discussing
5
#StrategyStriveAdd2305BitcoinThisWeek
127,597 views
2,067 Discussing
6
#TrumpRejectsIranHormuzReopening
113,255 views
1,566 Discussing
7
#CircleTetherFreezeBitgetHackerWallet
102,021 views
1,461 Discussing
8
#SECSaysTokenBuybacksNotAutoSecurities
67,204 views
854 Discussing
9
#ChinaUSAgreeOn$30BTariffCut
5,286 views
45 Discussing
10
#CoinMarketCapCompletesCoinglassAcquisition
71,374 views
966 Discussing