
#nbisb
nbisb
17,269 views
546 Discussing
Hot
Latest

·
--
$NBISB +8.49% | $MAGIC +8.48% | $AMDB +8.31%
#NBISB is holding at $130.82, climbing +8.49% on $2.8 M of trades. The steady rise suggests buying pressure is still intact.
#MAGIC sits at $0.0895, up +8.48% with $1.1 M volume. As the native token of Treasure, its rally may be tied to recent game‑related activity.
#AMDB trades at $449.03, gaining +8.31% on $2.7 M volume. The move mirrors the broader upward trend among midsize caps.
👀 Notice the tighter volume spread between NBISB and AMDB versus the lighter MAGIC flow—if the gap narrows, MAGIC could catch up on the upside.
#Write2Earn #Binance
$NBISB +8.49% | $MAGIC +8.48% | $AMDB +8.31%
#NBISB is holding at $130.82, climbing +8.49% on $2.8 M of trades. The steady rise suggests buying pressure is still intact.
#MAGIC sits at $0.0895, up +8.48% with $1.1 M volume. As the native token of Treasure, its rally may be tied to recent game‑related activity.
#AMDB trades at $449.03, gaining +8.31% on $2.7 M volume. The move mirrors the broader upward trend among midsize caps.
👀 Notice the tighter volume spread between NBISB and AMDB versus the lighter MAGIC flow—if the gap narrows, MAGIC could catch up on the upside.
#Write2Earn #Binance
#NBISB is holding at $130.82, climbing +8.49% on $2.8 M of trades. The steady rise suggests buying pressure is still intact.
#MAGIC sits at $0.0895, up +8.48% with $1.1 M volume. As the native token of Treasure, its rally may be tied to recent game‑related activity.
#AMDB trades at $449.03, gaining +8.31% on $2.7 M volume. The move mirrors the broader upward trend among midsize caps.
👀 Notice the tighter volume spread between NBISB and AMDB versus the lighter MAGIC flow—if the gap narrows, MAGIC could catch up on the upside.
#Write2Earn #Binance
6

·
--
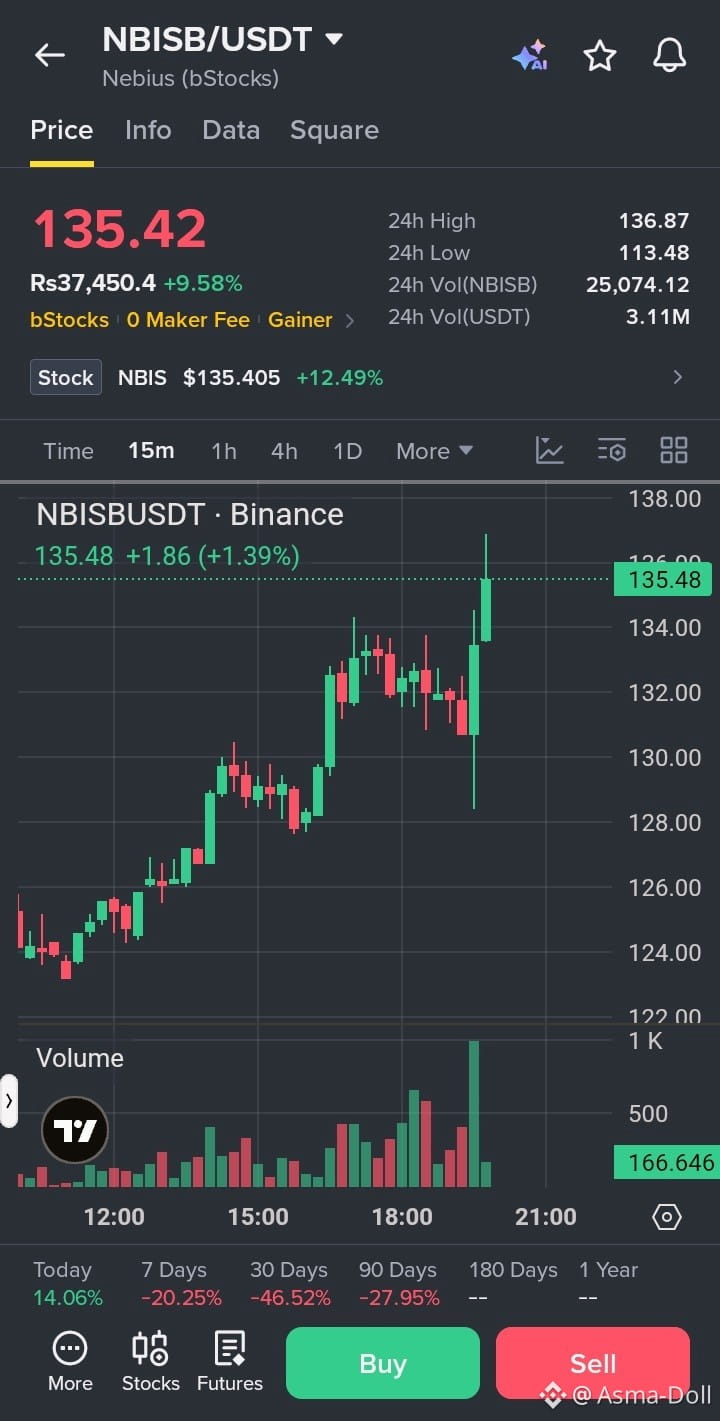
🔴 $NBISB /USDT – SHORT SIGNAL
Trade Plan:
Direction: SHORT 📉
Entry: $135.50 – $136.80
Stop Loss (SL): $140.00
Take Profit Targets:
TP1: $132.00
TP2: $128.00
TP3: $123.00
Trade here $NBISB
{spot}(NBISBUSDT)
Analysis:
NBISB is up 9.58% in 24 hours.
Price is approaching resistance near $136.87.
Strong daily recovery may attract profit-taking.
Underlying NBIS stock is also up 12.49%, indicating strong buying momentum.
Weekly and monthly performance remains weak.
Rejection near $136–$138 could create a short opportunity.
Confirmation: Wait for bearish rejection around $136–$138 and a confirmed candle close below $134 before entering SHORT.
Risk-to-Reward:
TP1: 1:0.8
TP2: 1:1.7
TP3: 1:2.8
⚠️ Risk Warning: NBISB has strong bullish momentum. Avoid chasing a SHORT position while buyers remain in control. Wait for confirmation and use controlled leverage.
#NBISB #NBIS #BinanceTrading #ShortSignal #CryptoSignals
🔴 $NBISB /USDT – SHORT SIGNAL
Trade Plan:
Direction: SHORT 📉
Entry: $135.50 – $136.80
Stop Loss (SL): $140.00
Take Profit Targets:
TP1: $132.00
TP2: $128.00
TP3: $123.00
Trade here $NBISB
Analysis:
NBISB is up 9.58% in 24 hours.
Price is approaching resistance near $136.87.
Strong daily recovery may attract profit-taking.
Underlying NBIS stock is also up 12.49%, indicating strong buying momentum.
Weekly and monthly performance remains weak.
Rejection near $136–$138 could create a short opportunity.
Confirmation: Wait for bearish rejection around $136–$138 and a confirmed candle close below $134 before entering SHORT.
Risk-to-Reward:
TP1: 1:0.8
TP2: 1:1.7
TP3: 1:2.8
⚠️ Risk Warning: NBISB has strong bullish momentum. Avoid chasing a SHORT position while buyers remain in control. Wait for confirmation and use controlled leverage.
#NBISB #NBIS #BinanceTrading #ShortSignal #CryptoSignals
Trade Plan:
Direction: SHORT 📉
Entry: $135.50 – $136.80
Stop Loss (SL): $140.00
Take Profit Targets:
TP1: $132.00
TP2: $128.00
TP3: $123.00
Trade here $NBISB
Analysis:
NBISB is up 9.58% in 24 hours.
Price is approaching resistance near $136.87.
Strong daily recovery may attract profit-taking.
Underlying NBIS stock is also up 12.49%, indicating strong buying momentum.
Weekly and monthly performance remains weak.
Rejection near $136–$138 could create a short opportunity.
Confirmation: Wait for bearish rejection around $136–$138 and a confirmed candle close below $134 before entering SHORT.
Risk-to-Reward:
TP1: 1:0.8
TP2: 1:1.7
TP3: 1:2.8
⚠️ Risk Warning: NBISB has strong bullish momentum. Avoid chasing a SHORT position while buyers remain in control. Wait for confirmation and use controlled leverage.
#NBISB #NBIS #BinanceTrading #ShortSignal #CryptoSignals
24

·
--
$NBISB +6.20% | $BONK +6.16% | $HAEDAL +5.96%
#NBISB pushes up to $149.95, gaining 6.20% on $2.4 M of trades. The price jump suggests fresh buying pressure, though the move could still be short‑term.
#BONK climbs to $0.00000293, up 6.16% with $1.3 M volume. Its tiny price rise feels modest, but the volume hints at a steadier interest than a flash spike.
#HAEDAL rises to $0.0281, up 5.96% on $1.5 M volume. The balanced volume‑price relationship may indicate a more sustainable rally, yet volatility remains possible.
📈 Watch whether the volume advantage of NBISB translates into further upside relative to the smaller‑cap moves of BONK and HAEDAL.
#Write2Earn #Binance
$NBISB +6.20% | $BONK +6.16% | $HAEDAL +5.96%
#NBISB pushes up to $149.95, gaining 6.20% on $2.4 M of trades. The price jump suggests fresh buying pressure, though the move could still be short‑term.
#BONK climbs to $0.00000293, up 6.16% with $1.3 M volume. Its tiny price rise feels modest, but the volume hints at a steadier interest than a flash spike.
#HAEDAL rises to $0.0281, up 5.96% on $1.5 M volume. The balanced volume‑price relationship may indicate a more sustainable rally, yet volatility remains possible.
📈 Watch whether the volume advantage of NBISB translates into further upside relative to the smaller‑cap moves of BONK and HAEDAL.
#Write2Earn #Binance
#NBISB pushes up to $149.95, gaining 6.20% on $2.4 M of trades. The price jump suggests fresh buying pressure, though the move could still be short‑term.
#BONK climbs to $0.00000293, up 6.16% with $1.3 M volume. Its tiny price rise feels modest, but the volume hints at a steadier interest than a flash spike.
#HAEDAL rises to $0.0281, up 5.96% on $1.5 M volume. The balanced volume‑price relationship may indicate a more sustainable rally, yet volatility remains possible.
📈 Watch whether the volume advantage of NBISB translates into further upside relative to the smaller‑cap moves of BONK and HAEDAL.
#Write2Earn #Binance
6

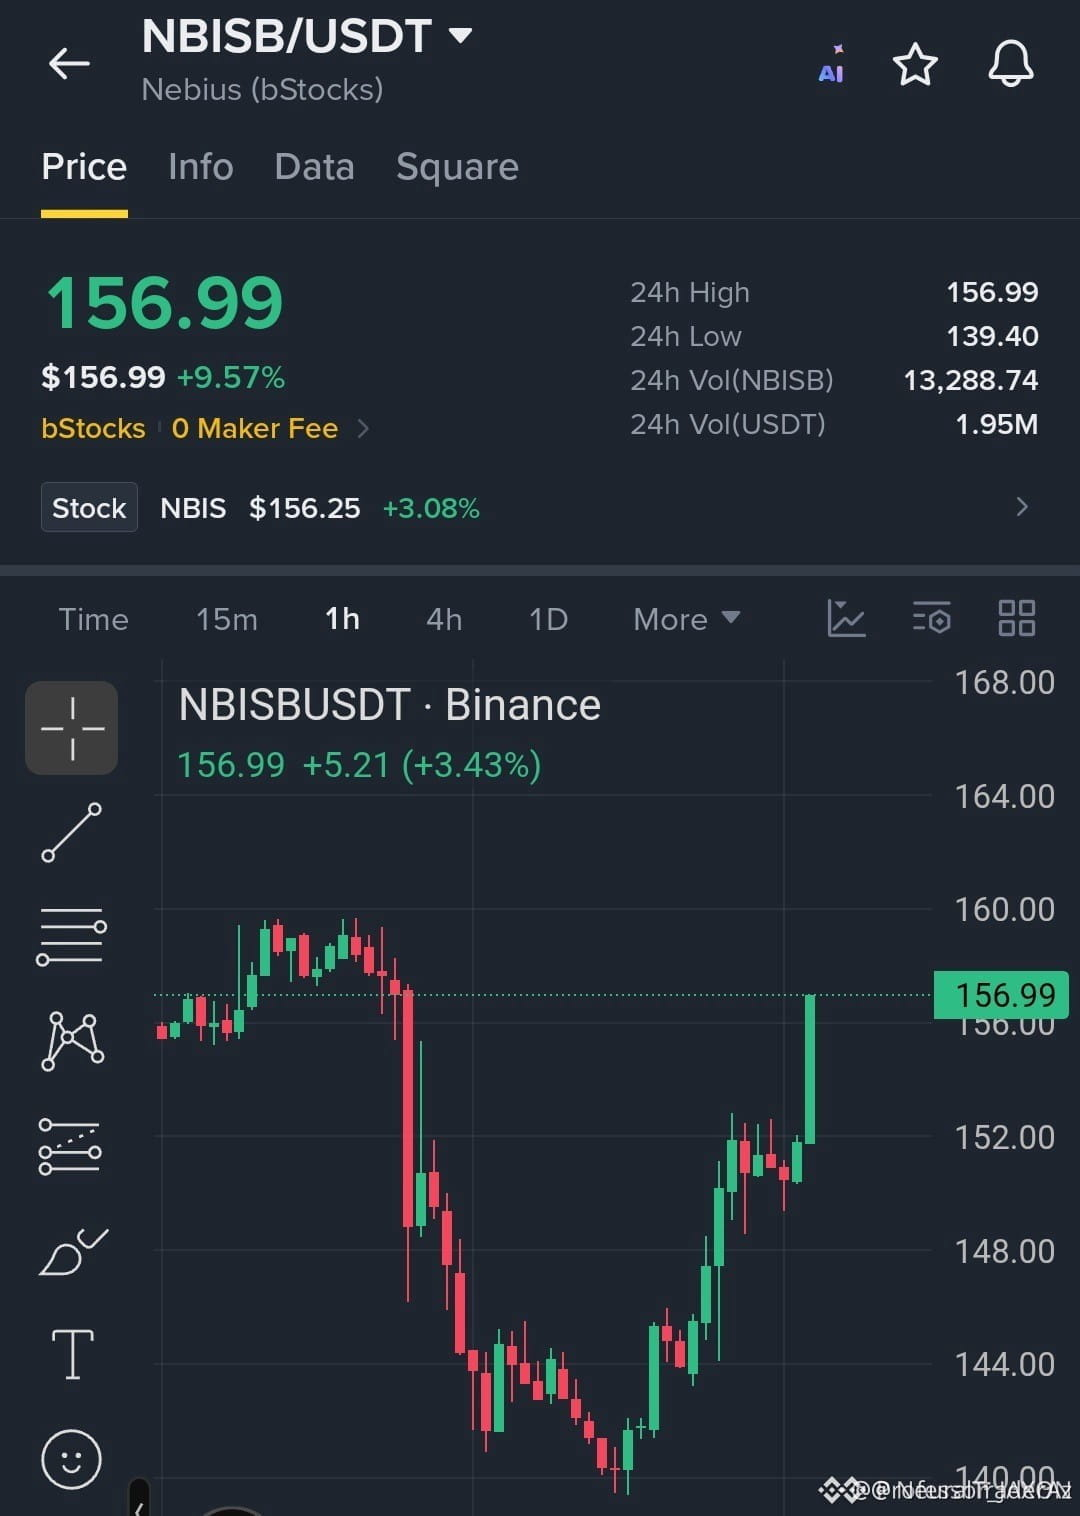
🚀 $NBISB BREAKS ABOVE RESISTANCE, BULLS REIGNITE 🟢
Entry: 155.00‑157.00 ⚡
Target: 160.00, 164.00, 168.00 🚀
Stop Loss: 152.00 ⚠️
A robust 4‑hour bullish candle ripped through the 152.00 resistance, confirming the demand block that held at 140.00. 📊 The price now sits comfortably above 155.00, a classic liquidity sweep that forces short‑covering and fuels the next thrust.
The order‑block at 155‑157 acts as a fresh supply anchor; holding here clears the path to the next resistance cluster at 160‑168. ⚡ Volume spikes on the 1‑hour chart underline institutional‑style accumulation. 💬 Are you aligning your position for the upside ladder or waiting for a retest? 👇
⚠️ Not financial advice. Always manage your risk. 🛡️
🏷️ #NBISB #LongSetup #Bullish #Crypto
🔥 💎
🚀 $NBISB BREAKS ABOVE RESISTANCE, BULLS REIGNITE 🟢
Entry: 155.00‑157.00 ⚡
Target: 160.00, 164.00, 168.00 🚀
Stop Loss: 152.00 ⚠️
A robust 4‑hour bullish candle ripped through the 152.00 resistance, confirming the demand block that held at 140.00. 📊 The price now sits comfortably above 155.00, a classic liquidity sweep that forces short‑covering and fuels the next thrust.
The order‑block at 155‑157 acts as a fresh supply anchor; holding here clears the path to the next resistance cluster at 160‑168. ⚡ Volume spikes on the 1‑hour chart underline institutional‑style accumulation. 💬 Are you aligning your position for the upside ladder or waiting for a retest? 👇
⚠️ Not financial advice. Always manage your risk. 🛡️
🏷️ #NBISB #LongSetup #Bullish #Crypto
🔥 💎
Entry: 155.00‑157.00 ⚡
Target: 160.00, 164.00, 168.00 🚀
Stop Loss: 152.00 ⚠️
A robust 4‑hour bullish candle ripped through the 152.00 resistance, confirming the demand block that held at 140.00. 📊 The price now sits comfortably above 155.00, a classic liquidity sweep that forces short‑covering and fuels the next thrust.
The order‑block at 155‑157 acts as a fresh supply anchor; holding here clears the path to the next resistance cluster at 160‑168. ⚡ Volume spikes on the 1‑hour chart underline institutional‑style accumulation. 💬 Are you aligning your position for the upside ladder or waiting for a retest? 👇
⚠️ Not financial advice. Always manage your risk. 🛡️
🏷️ #NBISB #LongSetup #Bullish #Crypto
🔥 💎
3

·
--
NBISB is currently at 173.60, up 12.53% over 24 hours but still down 1.61% over 7 days. The intraday range is 153.55–174.87, with an amplitude of 13.9%.
【Market】
There’s been an interesting pattern lately: NBISB gained 12.53% in a single day, but the level that often determines its direction is 153.55.
Everyone is watching the short-term ups and downs, but NBISB’s 153.55–174.87 range has already told the story.
After 24 hours in positive territory, it is holding near 173.60, with buyers showing relatively strong initiative in the short term.
The area around 153.55 marked the start of this rally, so a pullback to that level could offer decent value.
Over the same period, BTC gained 1.69% in 24 hours. NBISB’s 12.53% gain significantly outperformed the broader market, reflecting stronger investor preference.
【Macro】 U.S. stocks rose overnight, with the Nasdaq up 0.82% and the S&P 500 up 0.70% (close on 2026-10-27). BTC ETFs saw net outflows of about $45.2 billion this month. U.S. CPI came in at 3.7% year over year, higher than expected. The probability of an interest rate hike at the 2026-10-27/28 policy meeting is around 47%.
The short-term outlook leans bullish.
【Bullish case】
When it comes to forming a judgment, you ultimately have to figure it out for yourself—consensus is often the one that lags behind.
A single-day gain of 12.53% speaks for itself: short-term bulls are in the stronger position.
What really matters isn’t the size of the gain, but whether the 153.55 level continues to hold.
$NBISB #NBISB
NBISB is currently at 173.60, up 12.53% over 24 hours but still down 1.61% over 7 days. The intraday range is 153.55–174.87, with an amplitude of 13.9%.
【Market】
There’s been an interesting pattern lately: NBISB gained 12.53% in a single day, but the level that often determines its direction is 153.55.
Everyone is watching the short-term ups and downs, but NBISB’s 153.55–174.87 range has already told the story.
After 24 hours in positive territory, it is holding near 173.60, with buyers showing relatively strong initiative in the short term.
The area around 153.55 marked the start of this rally, so a pullback to that level could offer decent value.
Over the same period, BTC gained 1.69% in 24 hours. NBISB’s 12.53% gain significantly outperformed the broader market, reflecting stronger investor preference.
【Macro】 U.S. stocks rose overnight, with the Nasdaq up 0.82% and the S&P 500 up 0.70% (close on 2026-10-27). BTC ETFs saw net outflows of about $45.2 billion this month. U.S. CPI came in at 3.7% year over year, higher than expected. The probability of an interest rate hike at the 2026-10-27/28 policy meeting is around 47%.
The short-term outlook leans bullish.
【Bullish case】
When it comes to forming a judgment, you ultimately have to figure it out for yourself—consensus is often the one that lags behind.
A single-day gain of 12.53% speaks for itself: short-term bulls are in the stronger position.
What really matters isn’t the size of the gain, but whether the 153.55 level continues to hold.
$NBISB #NBISB
【Market】
There’s been an interesting pattern lately: NBISB gained 12.53% in a single day, but the level that often determines its direction is 153.55.
Everyone is watching the short-term ups and downs, but NBISB’s 153.55–174.87 range has already told the story.
After 24 hours in positive territory, it is holding near 173.60, with buyers showing relatively strong initiative in the short term.
The area around 153.55 marked the start of this rally, so a pullback to that level could offer decent value.
Over the same period, BTC gained 1.69% in 24 hours. NBISB’s 12.53% gain significantly outperformed the broader market, reflecting stronger investor preference.
【Macro】 U.S. stocks rose overnight, with the Nasdaq up 0.82% and the S&P 500 up 0.70% (close on 2026-10-27). BTC ETFs saw net outflows of about $45.2 billion this month. U.S. CPI came in at 3.7% year over year, higher than expected. The probability of an interest rate hike at the 2026-10-27/28 policy meeting is around 47%.
The short-term outlook leans bullish.
【Bullish case】
When it comes to forming a judgment, you ultimately have to figure it out for yourself—consensus is often the one that lags behind.
A single-day gain of 12.53% speaks for itself: short-term bulls are in the stronger position.
What really matters isn’t the size of the gain, but whether the 153.55 level continues to hold.
$NBISB #NBISB


$NBISB: Shared Direction, Unshared Evidence
Hourly price rises on $NBISB often invite comparisons with other assets moving the same way. Here, $NBISB shows an hourly direction up while volume sits above baseline. Peer observations for ETH and LSK show similar hourly upward direction and volume above their own baselines. At a glance, this looks aligned. However, matching direction on a watchlist is not the same as measuring correlation. The moves may occur in the same time window without any capital flowing between these pairs. Each asset trades on its own order book, with different participants and local liquidity conditions. The venue is shared, but the drivers are not necessarily linked. This distinction matters because assuming a common cause can lead to false confidence in trend continuation. A rise in one asset does not mechanically pull the others up. The volume above baseline confirms activity but does not confirm sustainability. To reassess this interpretation, watch how the hourly close settles relative to the daily range. If the move fades on the next interval while peers hold, the shared direction was likely coincidental timing rather than a structural rotation. Focus on the persistence of the move rather than the initial direction. A persistent rise with stable volume suggests internal interest. A fading move suggests the initial impulse was transient. This specific check applies to the current observation without assuming broader market structure. The comparison remains a hypothesis until the holding period provides clearer evidence.
Probabilistic market research, not a recommendation or guaranteed return.
The comparison to keep in mind: $ETH has hourly direction up and volume above its baseline; $LSK has hourly direction up and volume above its baseline. This alone does not establish correlation.
Which matters more in this comparison: direction or how the move holds?
#NBISB #ETH #LSK #CryptoWatchlist #CryptoLearning
Binance spot proof for $NBISB: closed price 177.48 USDT.
Source: binance. Closed candle: 2026-10-29T15:45:00+00:00.
$NBISB : Shared Direction, Unshared Evidence
Hourly price rises on $NBISB often invite comparisons with other assets moving the same way. Here, $NBISB shows an hourly direction up while volume sits above baseline. Peer observations for ETH and LSK show similar hourly upward direction and volume above their own baselines. At a glance, this looks aligned. However, matching direction on a watchlist is not the same as measuring correlation. The moves may occur in the same time window without any capital flowing between these pairs. Each asset trades on its own order book, with different participants and local liquidity conditions. The venue is shared, but the drivers are not necessarily linked. This distinction matters because assuming a common cause can lead to false confidence in trend continuation. A rise in one asset does not mechanically pull the others up. The volume above baseline confirms activity but does not confirm sustainability. To reassess this interpretation, watch how the hourly close settles relative to the daily range. If the move fades on the next interval while peers hold, the shared direction was likely coincidental timing rather than a structural rotation. Focus on the persistence of the move rather than the initial direction. A persistent rise with stable volume suggests internal interest. A fading move suggests the initial impulse was transient. This specific check applies to the current observation without assuming broader market structure. The comparison remains a hypothesis until the holding period provides clearer evidence.
Probabilistic market research, not a recommendation or guaranteed return.
The comparison to keep in mind: $ETH has hourly direction up and volume above its baseline; $LSK has hourly direction up and volume above its baseline. This alone does not establish correlation.
Which matters more in this comparison: direction or how the move holds?
#NBISB #ETH #LSK #CryptoWatchlist #CryptoLearning
Binance spot proof for $NBISB : closed price 177.48 USDT.
Source: binance. Closed candle: 2026-10-29T15:45:00+00:00.
Hourly price rises on $NBISB often invite comparisons with other assets moving the same way. Here, $NBISB shows an hourly direction up while volume sits above baseline. Peer observations for ETH and LSK show similar hourly upward direction and volume above their own baselines. At a glance, this looks aligned. However, matching direction on a watchlist is not the same as measuring correlation. The moves may occur in the same time window without any capital flowing between these pairs. Each asset trades on its own order book, with different participants and local liquidity conditions. The venue is shared, but the drivers are not necessarily linked. This distinction matters because assuming a common cause can lead to false confidence in trend continuation. A rise in one asset does not mechanically pull the others up. The volume above baseline confirms activity but does not confirm sustainability. To reassess this interpretation, watch how the hourly close settles relative to the daily range. If the move fades on the next interval while peers hold, the shared direction was likely coincidental timing rather than a structural rotation. Focus on the persistence of the move rather than the initial direction. A persistent rise with stable volume suggests internal interest. A fading move suggests the initial impulse was transient. This specific check applies to the current observation without assuming broader market structure. The comparison remains a hypothesis until the holding period provides clearer evidence.
Probabilistic market research, not a recommendation or guaranteed return.
The comparison to keep in mind: $ETH has hourly direction up and volume above its baseline; $LSK has hourly direction up and volume above its baseline. This alone does not establish correlation.
Which matters more in this comparison: direction or how the move holds?
#NBISB #ETH #LSK #CryptoWatchlist #CryptoLearning
Binance spot proof for $NBISB : closed price 177.48 USDT.
Source: binance. Closed candle: 2026-10-29T15:45:00+00:00.
64
·
--
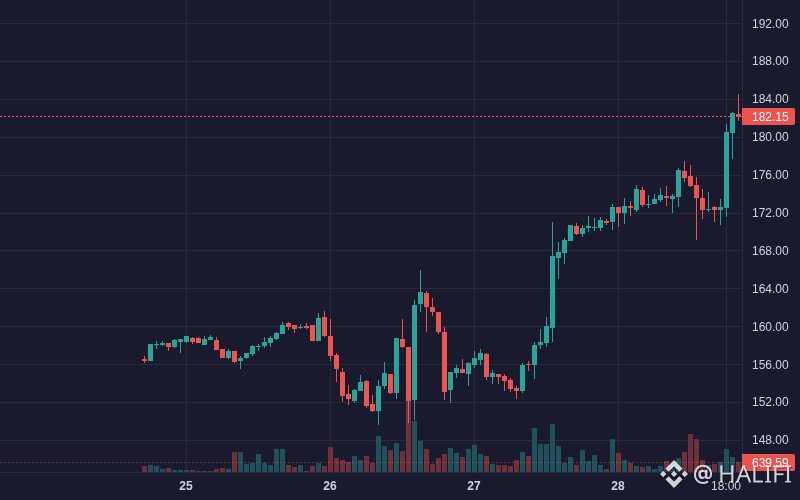
$NBISB NBISB is showing bullish movement: 6.97% (Crypto).
Volume: 3.95M | Last: $182.46
Key signals: strong momentum, high volatility.
Bias Daily: BULLISH 🟢 | Weekly: BULLISH 🟢
NBISB gained 5.8% over 24h to $180.53 following data center financing news, though overbought RSI warns of pullback.
**Infrastructure funding (High)**: Nebius secured ~€250M financing for its Lille data center → expanded AI compute capacity boosted fundamental sentiment
- **Bullish breakout (High)**: Surged from $170.54 to $180.53 (+5.8%) → broke above upper Bollinger Band ($177.64) on 568K USDT volume
- **Tokenized RWA demand (Medium)**: Steady community momentum in asset-backed equities on BNB Chain supported underlying equity peg
#NBISB #FOMCWatch #CanGoogleDefindItsCore #fomcwatch #Crypto
$NBISB NBISB is showing bullish movement: 6.97% (Crypto).
Volume: 3.95M | Last: $182.46
Key signals: strong momentum, high volatility.
Bias Daily: BULLISH 🟢 | Weekly: BULLISH 🟢
NBISB gained 5.8% over 24h to $180.53 following data center financing news, though overbought RSI warns of pullback.
**Infrastructure funding (High)**: Nebius secured ~€250M financing for its Lille data center → expanded AI compute capacity boosted fundamental sentiment
- **Bullish breakout (High)**: Surged from $170.54 to $180.53 (+5.8%) → broke above upper Bollinger Band ($177.64) on 568K USDT volume
- **Tokenized RWA demand (Medium)**: Steady community momentum in asset-backed equities on BNB Chain supported underlying equity peg
#NBISB #FOMCWatch #CanGoogleDefindItsCore #fomcwatch #Crypto
Volume: 3.95M | Last: $182.46
Key signals: strong momentum, high volatility.
Bias Daily: BULLISH 🟢 | Weekly: BULLISH 🟢
NBISB gained 5.8% over 24h to $180.53 following data center financing news, though overbought RSI warns of pullback.
**Infrastructure funding (High)**: Nebius secured ~€250M financing for its Lille data center → expanded AI compute capacity boosted fundamental sentiment
- **Bullish breakout (High)**: Surged from $170.54 to $180.53 (+5.8%) → broke above upper Bollinger Band ($177.64) on 568K USDT volume
- **Tokenized RWA demand (Medium)**: Steady community momentum in asset-backed equities on BNB Chain supported underlying equity peg
#NBISB #FOMCWatch #CanGoogleDefindItsCore #fomcwatch #Crypto
2
9

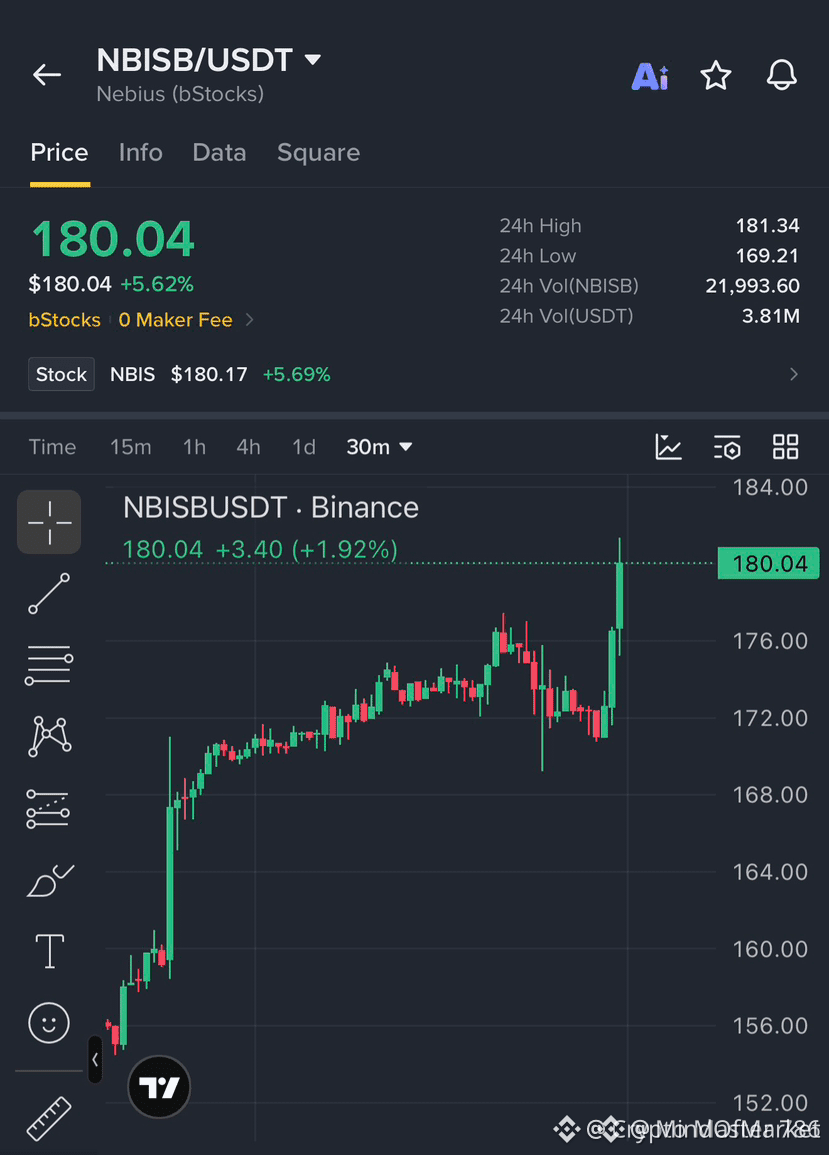
🚀 $NBISB ON THE VERGE OF A BREAKOUT SURGE! 🟢
Entry: 178.50‑180.50 ⚡
Target: 181.50/183.00/185.00 🚀
Stop Loss: 175.50 ⚠️
Liquidity is stacking at the $181.34 ceiling, and smart money is whispering a flip. 📊 The order flow shows buyers swallowing the sell wall faster than the last three cycles.
If the price tears through, we could ride a wave straight to $185, with the next resistance acting as a runway for another push. 🦈 Keep eyes on volume spikes and the 4‑hour candle confirmation before committing.
💬 Who’s ready to lock in the upside before the next liquidity sweep?
⚠️ Not financial advice. Always manage your risk. 🛡️
🏷️ #NBISB #LongSetup #Breakout #Crypto
🔥 💎
🚀 $NBISB ON THE VERGE OF A BREAKOUT SURGE! 🟢
Entry: 178.50‑180.50 ⚡
Target: 181.50/183.00/185.00 🚀
Stop Loss: 175.50 ⚠️
Liquidity is stacking at the $181.34 ceiling, and smart money is whispering a flip. 📊 The order flow shows buyers swallowing the sell wall faster than the last three cycles.
If the price tears through, we could ride a wave straight to $185, with the next resistance acting as a runway for another push. 🦈 Keep eyes on volume spikes and the 4‑hour candle confirmation before committing.
💬 Who’s ready to lock in the upside before the next liquidity sweep?
⚠️ Not financial advice. Always manage your risk. 🛡️
🏷️ #NBISB #LongSetup #Breakout #Crypto
🔥 💎
Entry: 178.50‑180.50 ⚡
Target: 181.50/183.00/185.00 🚀
Stop Loss: 175.50 ⚠️
Liquidity is stacking at the $181.34 ceiling, and smart money is whispering a flip. 📊 The order flow shows buyers swallowing the sell wall faster than the last three cycles.
If the price tears through, we could ride a wave straight to $185, with the next resistance acting as a runway for another push. 🦈 Keep eyes on volume spikes and the 4‑hour candle confirmation before committing.
💬 Who’s ready to lock in the upside before the next liquidity sweep?
⚠️ Not financial advice. Always manage your risk. 🛡️
🏷️ #NBISB #LongSetup #Breakout #Crypto
🔥 💎
3

·
--
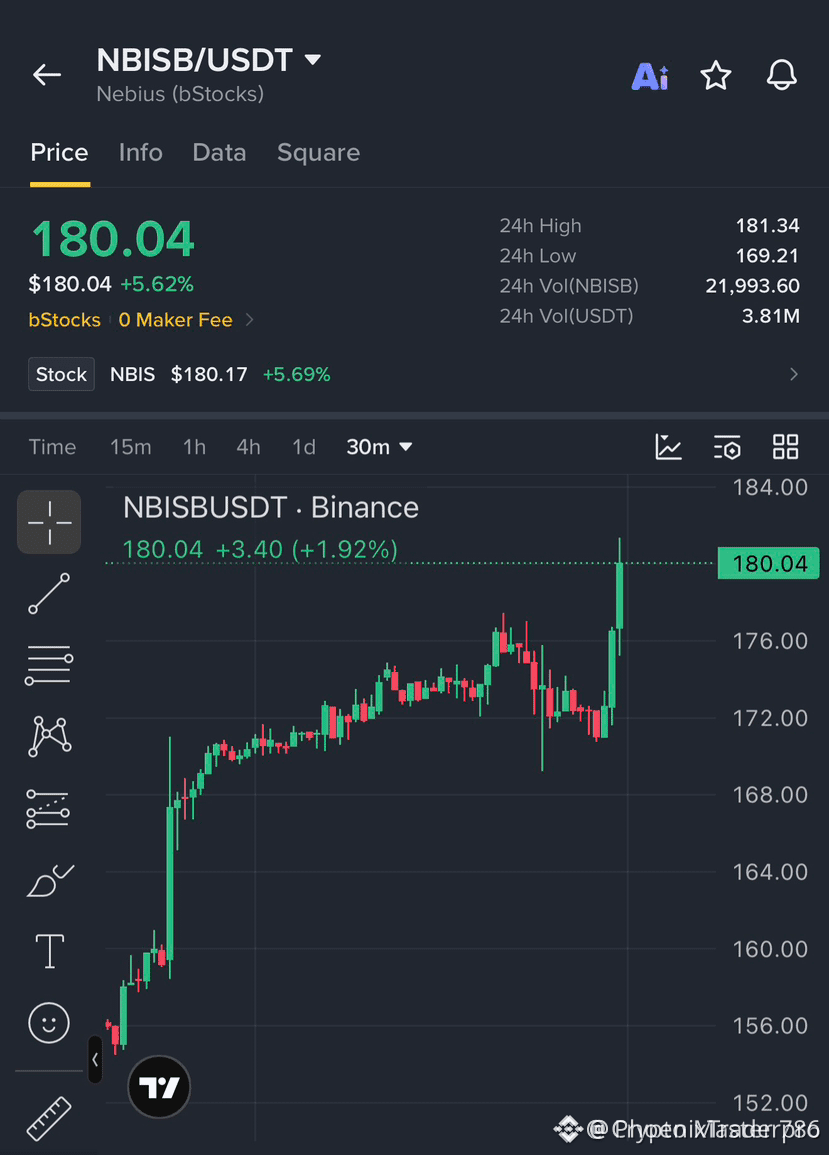
🚀 $NBISB ON THE CUSP OF A LIQUIDITY SURGE! 📈
Entry: 178.50-180.50 ⚡
Target: 181.50 / 183.00 / 185.00 🚀
Stop Loss: 175.50 ⚠️
📊 The demand block anchored around 178.50 has repeatedly absorbed sell pressure, signaling a smart‑money accumulation zone. 🦈 As price edges toward the 181.34 resistance, a clean break could unleash the next liquidity hunt, feeding the upside thrust. 📌 Volume on the 4H is expanding, and the RSI is nudging out of oversold territory, reinforcing the bullish bias.
💬 Are you positioned to catch the next liquidity sweep? 👇
⚠️ Not financial advice. Always manage your risk. 🛡️
🏷️ #NBISB #LongSetup #Breakout #Crypto
🔥 💎
🚀 $NBISB ON THE CUSP OF A LIQUIDITY SURGE! 📈
Entry: 178.50-180.50 ⚡
Target: 181.50 / 183.00 / 185.00 🚀
Stop Loss: 175.50 ⚠️
📊 The demand block anchored around 178.50 has repeatedly absorbed sell pressure, signaling a smart‑money accumulation zone. 🦈 As price edges toward the 181.34 resistance, a clean break could unleash the next liquidity hunt, feeding the upside thrust. 📌 Volume on the 4H is expanding, and the RSI is nudging out of oversold territory, reinforcing the bullish bias.
💬 Are you positioned to catch the next liquidity sweep? 👇
⚠️ Not financial advice. Always manage your risk. 🛡️
🏷️ #NBISB #LongSetup #Breakout #Crypto
🔥 💎
Entry: 178.50-180.50 ⚡
Target: 181.50 / 183.00 / 185.00 🚀
Stop Loss: 175.50 ⚠️
📊 The demand block anchored around 178.50 has repeatedly absorbed sell pressure, signaling a smart‑money accumulation zone. 🦈 As price edges toward the 181.34 resistance, a clean break could unleash the next liquidity hunt, feeding the upside thrust. 📌 Volume on the 4H is expanding, and the RSI is nudging out of oversold territory, reinforcing the bullish bias.
💬 Are you positioned to catch the next liquidity sweep? 👇
⚠️ Not financial advice. Always manage your risk. 🛡️
🏷️ #NBISB #LongSetup #Breakout #Crypto
🔥 💎
5

·
--
⚠️ A steady slide|$NBISB 24-hour trading volume: 5037893.35 USDT; current price: 172.35 USDT.
📊 Data Snapshot
· Current price: 172.35 USDT
· 24h: -0.74%
· Range: 169.09 — 184.47
· Trading volume: 5037893.35 USDT
Volume keeps declining, and the price has softened too. Put simply, not many people are willing to make a move here. Both bulls and bears are waiting on the sidelines, and neither dares to play the first card. Volume matters more than price—when trading volume has shrunk this much, don’t rush to take sides before a clear direction emerges.
What do you think? 👇
#市场观察 #NBISB #Binance
⚠️ A steady slide|$NBISB 24-hour trading volume: 5037893.35 USDT; current price: 172.35 USDT.
📊 Data Snapshot
· Current price: 172.35 USDT
· 24h: -0.74%
· Range: 169.09 — 184.47
· Trading volume: 5037893.35 USDT
Volume keeps declining, and the price has softened too. Put simply, not many people are willing to make a move here. Both bulls and bears are waiting on the sidelines, and neither dares to play the first card. Volume matters more than price—when trading volume has shrunk this much, don’t rush to take sides before a clear direction emerges.
What do you think? 👇
#市场观察 #NBISB #Binance
📊 Data Snapshot
· Current price: 172.35 USDT
· 24h: -0.74%
· Range: 169.09 — 184.47
· Trading volume: 5037893.35 USDT
Volume keeps declining, and the price has softened too. Put simply, not many people are willing to make a move here. Both bulls and bears are waiting on the sidelines, and neither dares to play the first card. Volume matters more than price—when trading volume has shrunk this much, don’t rush to take sides before a clear direction emerges.
What do you think? 👇
#市场观察 #NBISB #Binance

$NBISB: NBISB: The Entry Trap
Chasing price often sacrifices entry quality.
Right now $NBISB trades at 175.83 with volume above baseline. The hourly direction is up. This creates urgency. Many feel the need to act immediately. However, urgency rarely improves specific trade outcomes.
Consider a simple thought experiment. You enter at 175.83. Your invalidation level is 172.04. The distance between these points defines your risk. If you chase, you might buy higher. Then your stop must widen to cover the same loss amount. A wider stop means holding the position longer during chop.
Volume confirms the move. Relative volume is 4.0082. This suggests participation is real. But real participation can fade quickly. The trade-off is between acting now and waiting for a pullback. Waiting reduces entry risk. It also increases the chance of missing the move entirely.
Check your assumption. Is the move driven by trend or a spike? If it is a spike, the invalidation level 172.04 might break easily. A meaningful stop should sit below structure. If 172.04 is too far, the stop is not meaningful. It is just a wide distance.
Define your reassessment trigger. If price closes hourly below 168.695, the setup weakens. Do not just watch the chart. Set a mental checkpoint. This separates observation from decision. You decide what evidence would prove you wrong. Then you wait for that evidence. This approach respects the uncertainty in the current range.
Probabilistic market research, not a recommendation or guaranteed return.
Would you wait for clearer structure or reassess the risk first?
#NBISB #RiskManagement
$NBISB : NBISB: The Entry Trap
Chasing price often sacrifices entry quality.
Right now $NBISB trades at 175.83 with volume above baseline. The hourly direction is up. This creates urgency. Many feel the need to act immediately. However, urgency rarely improves specific trade outcomes.
Consider a simple thought experiment. You enter at 175.83. Your invalidation level is 172.04. The distance between these points defines your risk. If you chase, you might buy higher. Then your stop must widen to cover the same loss amount. A wider stop means holding the position longer during chop.
Volume confirms the move. Relative volume is 4.0082. This suggests participation is real. But real participation can fade quickly. The trade-off is between acting now and waiting for a pullback. Waiting reduces entry risk. It also increases the chance of missing the move entirely.
Check your assumption. Is the move driven by trend or a spike? If it is a spike, the invalidation level 172.04 might break easily. A meaningful stop should sit below structure. If 172.04 is too far, the stop is not meaningful. It is just a wide distance.
Define your reassessment trigger. If price closes hourly below 168.695, the setup weakens. Do not just watch the chart. Set a mental checkpoint. This separates observation from decision. You decide what evidence would prove you wrong. Then you wait for that evidence. This approach respects the uncertainty in the current range.
Probabilistic market research, not a recommendation or guaranteed return.
Would you wait for clearer structure or reassess the risk first?
#NBISB #RiskManagement
Chasing price often sacrifices entry quality.
Right now $NBISB trades at 175.83 with volume above baseline. The hourly direction is up. This creates urgency. Many feel the need to act immediately. However, urgency rarely improves specific trade outcomes.
Consider a simple thought experiment. You enter at 175.83. Your invalidation level is 172.04. The distance between these points defines your risk. If you chase, you might buy higher. Then your stop must widen to cover the same loss amount. A wider stop means holding the position longer during chop.
Volume confirms the move. Relative volume is 4.0082. This suggests participation is real. But real participation can fade quickly. The trade-off is between acting now and waiting for a pullback. Waiting reduces entry risk. It also increases the chance of missing the move entirely.
Check your assumption. Is the move driven by trend or a spike? If it is a spike, the invalidation level 172.04 might break easily. A meaningful stop should sit below structure. If 172.04 is too far, the stop is not meaningful. It is just a wide distance.
Define your reassessment trigger. If price closes hourly below 168.695, the setup weakens. Do not just watch the chart. Set a mental checkpoint. This separates observation from decision. You decide what evidence would prove you wrong. Then you wait for that evidence. This approach respects the uncertainty in the current range.
Probabilistic market research, not a recommendation or guaranteed return.
Would you wait for clearer structure or reassess the risk first?
#NBISB #RiskManagement
50
·
--
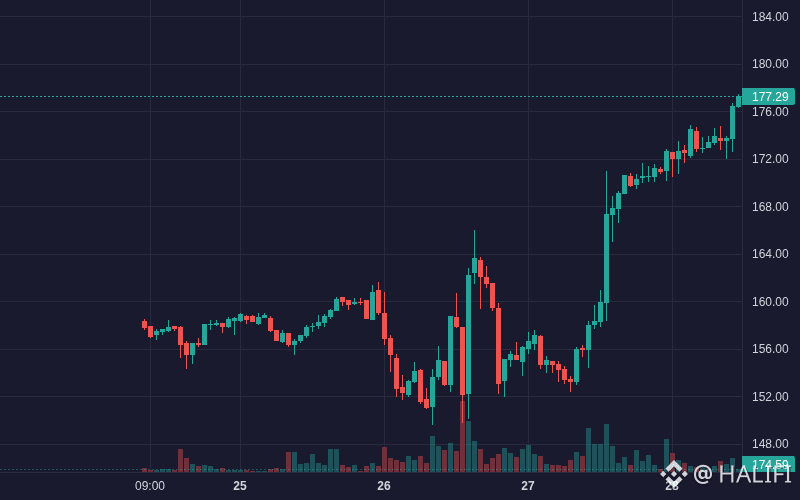
$NBISB NBISB is showing bullish movement: 11.56% (Crypto).
Volume: 4.10M | Last: $176.79
Key signals: strong momentum, high volatility.
Bias Daily: BULLISH 🟢 | Weekly: BULLISH 🟢
NBISB gained 9.9% over 24 hours following AI ETF inclusion and infrastructure funding, though momentum is tapering.
**ETF inclusion & expansion (High)**: Grayscale included Nebius in its AI compute ETF alongside a €250M data center funding deal → sparked massive institutional interest
- **Aggressive capital inflows (Medium)**: Early net inflows exceeded $627K with large buyer concentration → pushed price past $174 resistance
- **Bullish momentum breakout (Medium)**: Price crossed above key EMAs with RSI spiking above 90 → accelerated short-term trend expansion
#NBISB #BinanceSquare #FOMCWatch #fomcwatch #Crypto
$NBISB NBISB is showing bullish movement: 11.56% (Crypto).
Volume: 4.10M | Last: $176.79
Key signals: strong momentum, high volatility.
Bias Daily: BULLISH 🟢 | Weekly: BULLISH 🟢
NBISB gained 9.9% over 24 hours following AI ETF inclusion and infrastructure funding, though momentum is tapering.
**ETF inclusion & expansion (High)**: Grayscale included Nebius in its AI compute ETF alongside a €250M data center funding deal → sparked massive institutional interest
- **Aggressive capital inflows (Medium)**: Early net inflows exceeded $627K with large buyer concentration → pushed price past $174 resistance
- **Bullish momentum breakout (Medium)**: Price crossed above key EMAs with RSI spiking above 90 → accelerated short-term trend expansion
#NBISB #BinanceSquare #FOMCWatch #fomcwatch #Crypto
Volume: 4.10M | Last: $176.79
Key signals: strong momentum, high volatility.
Bias Daily: BULLISH 🟢 | Weekly: BULLISH 🟢
NBISB gained 9.9% over 24 hours following AI ETF inclusion and infrastructure funding, though momentum is tapering.
**ETF inclusion & expansion (High)**: Grayscale included Nebius in its AI compute ETF alongside a €250M data center funding deal → sparked massive institutional interest
- **Aggressive capital inflows (Medium)**: Early net inflows exceeded $627K with large buyer concentration → pushed price past $174 resistance
- **Bullish momentum breakout (Medium)**: Price crossed above key EMAs with RSI spiking above 90 → accelerated short-term trend expansion
#NBISB #BinanceSquare #FOMCWatch #fomcwatch #Crypto
21
·
--
$NBISB +12.55% | $HUMA +10.58% | $CBRSB +10.18%
#NBISB is trading at 174.12, up 12.55% with about $4.6 M changing hands. The move feels solid, though the price could still wobble on thin order books.
#HUMA slipped to 0.0280, gaining 10.58% on a surprisingly high $11.0 M of volume. That liquidity may help sustain the rally, but the token remains very price‑sensitive.
#CBRSB sits at 118.97, climbing 10.18% while $1.7 M trades. It’s the smallest‑volume player here, so any further spikes could be volatile 🤞.
Watch the interplay between HUMA’s strong flow and the more modest activity in NBISB and CBRSB; shifting capital could quickly reshape the leader board.
#Write2Earn #Binance
$NBISB +12.55% | $HUMA +10.58% | $CBRSB +10.18%
#NBISB is trading at 174.12, up 12.55% with about $4.6 M changing hands. The move feels solid, though the price could still wobble on thin order books.
#HUMA slipped to 0.0280, gaining 10.58% on a surprisingly high $11.0 M of volume. That liquidity may help sustain the rally, but the token remains very price‑sensitive.
#CBRSB sits at 118.97, climbing 10.18% while $1.7 M trades. It’s the smallest‑volume player here, so any further spikes could be volatile 🤞.
Watch the interplay between HUMA’s strong flow and the more modest activity in NBISB and CBRSB; shifting capital could quickly reshape the leader board.
#Write2Earn #Binance
#NBISB is trading at 174.12, up 12.55% with about $4.6 M changing hands. The move feels solid, though the price could still wobble on thin order books.
#HUMA slipped to 0.0280, gaining 10.58% on a surprisingly high $11.0 M of volume. That liquidity may help sustain the rally, but the token remains very price‑sensitive.
#CBRSB sits at 118.97, climbing 10.18% while $1.7 M trades. It’s the smallest‑volume player here, so any further spikes could be volatile 🤞.
Watch the interplay between HUMA’s strong flow and the more modest activity in NBISB and CBRSB; shifting capital could quickly reshape the leader board.
#Write2Earn #Binance
7

·
--
Bullish
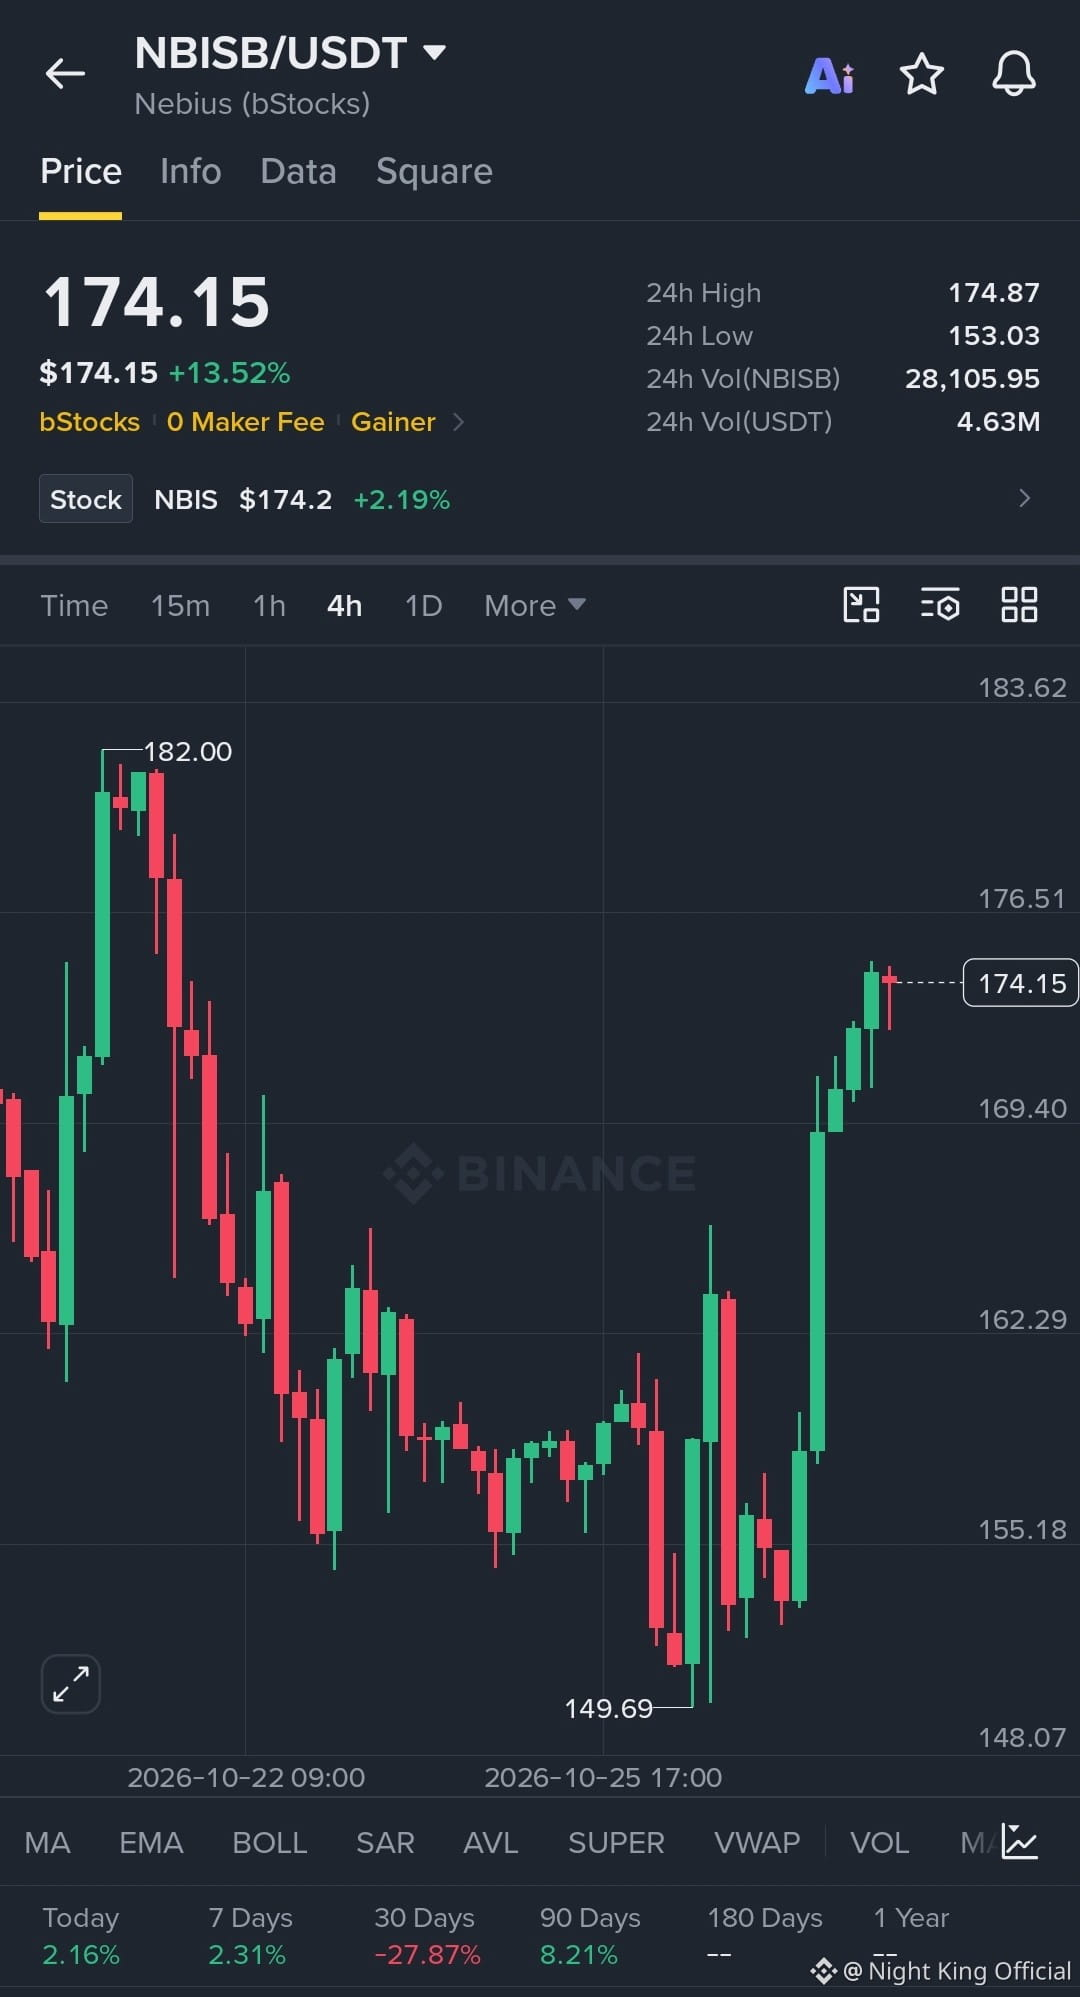
$NBISB Strong Rally Meets the 24h High
Long Plan
Entry Range: 169.40 – 174.15
TP1: 174.87
TP2: 176.51
TP3: 182.00
SL: 4H close below 162.29
Price rallied on the 4H from the 149.69 swing low to just under the 24h High of 174.87, so a pullback toward the 169.40 area would not be surprising before any continuation.
Will $NBISB build above 174.87, or does it cool off first and revisit 169.40?
Not financial advice. DYOR.
#NBISB #BinanceSquare #CryptoSignals
{spot}(NBISBUSDT)
$NBISB Strong Rally Meets the 24h High
Long Plan
Entry Range: 169.40 – 174.15
TP1: 174.87
TP2: 176.51
TP3: 182.00
SL: 4H close below 162.29
Price rallied on the 4H from the 149.69 swing low to just under the 24h High of 174.87, so a pullback toward the 169.40 area would not be surprising before any continuation.
Will $NBISB build above 174.87, or does it cool off first and revisit 169.40?
Not financial advice. DYOR.
#NBISB #BinanceSquare #CryptoSignals
Long Plan
Entry Range: 169.40 – 174.15
TP1: 174.87
TP2: 176.51
TP3: 182.00
SL: 4H close below 162.29
Price rallied on the 4H from the 149.69 swing low to just under the 24h High of 174.87, so a pullback toward the 169.40 area would not be surprising before any continuation.
Will $NBISB build above 174.87, or does it cool off first and revisit 169.40?
Not financial advice. DYOR.
#NBISB #BinanceSquare #CryptoSignals
1
146

·
--
📊 NBISB Recommendation
🔴 Direction: Potential SHORT
* Price: 179.57
* RSI: 70 — Overbought on the 30-minute timeframe.
* Entry: After a downward move is confirmed and nearby support is broken.
* First target: 177.80
* Second target: 176.00
* Stop loss: 180.80
⚠️ Overbought conditions alone do not confirm a downward move; wait for a clear reversal signal.
🔥 Look for opportunities
$NBISB #NBISB
📊 NBISB Recommendation
🔴 Direction: Potential SHORT
* Price: 179.57
* RSI: 70 — Overbought on the 30-minute timeframe.
* Entry: After a downward move is confirmed and nearby support is broken.
* First target: 177.80
* Second target: 176.00
* Stop loss: 180.80
⚠️ Overbought conditions alone do not confirm a downward move; wait for a clear reversal signal.
🔥 Look for opportunities
$NBISB #NBISB
🔴 Direction: Potential SHORT
* Price: 179.57
* RSI: 70 — Overbought on the 30-minute timeframe.
* Entry: After a downward move is confirmed and nearby support is broken.
* First target: 177.80
* Second target: 176.00
* Stop loss: 180.80
⚠️ Overbought conditions alone do not confirm a downward move; wait for a clear reversal signal.
🔥 Look for opportunities
$NBISB #NBISB
77

·
--
NBISB: A STRONG STORY, BUT THE MARKET HASN'T PICKED A SIDE.
THE MARKET READ
173.67 | 24H +12.69%
4H STRUCTURE: RANGE
1H CONFIRMATION: BULLISH
RELATIVE VOLUME: 0.73x
THE NARRATIVE
Nebius (bStocks Tokenized Stock) is positioned around Tokenized Assets, BNB Chain Ecosystem, Tokenized Stocks. These are the core themes behind the token's ecosystem narrative.
MY VIEW — NEUTRAL
Neutral. The narrative may attract attention, but price structure has not yet shown which side is in control.
WHAT WOULD CONFIRM IT
Technical confirmation is weak: wait for cleaner structure and stronger participation before drawing a firm conclusion.
This is narrative analysis, not a trade signal. Verify current market data and project claims before acting.
#NBISB #Crypto #MarketStructure
NBISB: A STRONG STORY, BUT THE MARKET HASN'T PICKED A SIDE.
THE MARKET READ
173.67 | 24H +12.69%
4H STRUCTURE: RANGE
1H CONFIRMATION: BULLISH
RELATIVE VOLUME: 0.73x
THE NARRATIVE
Nebius (bStocks Tokenized Stock) is positioned around Tokenized Assets, BNB Chain Ecosystem, Tokenized Stocks. These are the core themes behind the token's ecosystem narrative.
MY VIEW — NEUTRAL
Neutral. The narrative may attract attention, but price structure has not yet shown which side is in control.
WHAT WOULD CONFIRM IT
Technical confirmation is weak: wait for cleaner structure and stronger participation before drawing a firm conclusion.
This is narrative analysis, not a trade signal. Verify current market data and project claims before acting.
#NBISB #Crypto #MarketStructure
THE MARKET READ
173.67 | 24H +12.69%
4H STRUCTURE: RANGE
1H CONFIRMATION: BULLISH
RELATIVE VOLUME: 0.73x
THE NARRATIVE
Nebius (bStocks Tokenized Stock) is positioned around Tokenized Assets, BNB Chain Ecosystem, Tokenized Stocks. These are the core themes behind the token's ecosystem narrative.
MY VIEW — NEUTRAL
Neutral. The narrative may attract attention, but price structure has not yet shown which side is in control.
WHAT WOULD CONFIRM IT
Technical confirmation is weak: wait for cleaner structure and stronger participation before drawing a firm conclusion.
This is narrative analysis, not a trade signal. Verify current market data and project claims before acting.
#NBISB #Crypto #MarketStructure
27
·
--
$NBISB +12.27% | $TUT +11.98% | $CBRSB +11.04%
#NBISB pushes up to $173.36, a +12.27% rise on $4.7 M of volume. The jump suggests fresh buying pressure, though the rally could cool if broader sentiment shifts.
#TUT climbs to $0.0193, gaining +11.98% with $4.1 M traded. The token stems from a developer’s tutorial on launching BNB‑chain tokens, a quirky origin that may attract speculative interest.
#CBRSB nudges to $119.99, up +11.04% on $1.7 M of volume. The modest flow hints at a quieter base of supporters compared with the other two movers.
👀 Watch how the differing volume levels affect the durability of each price surge.
#Write2Earn #Binance
$NBISB +12.27% | $TUT +11.98% | $CBRSB +11.04%
#NBISB pushes up to $173.36, a +12.27% rise on $4.7 M of volume. The jump suggests fresh buying pressure, though the rally could cool if broader sentiment shifts.
#TUT climbs to $0.0193, gaining +11.98% with $4.1 M traded. The token stems from a developer’s tutorial on launching BNB‑chain tokens, a quirky origin that may attract speculative interest.
#CBRSB nudges to $119.99, up +11.04% on $1.7 M of volume. The modest flow hints at a quieter base of supporters compared with the other two movers.
👀 Watch how the differing volume levels affect the durability of each price surge.
#Write2Earn #Binance
#NBISB pushes up to $173.36, a +12.27% rise on $4.7 M of volume. The jump suggests fresh buying pressure, though the rally could cool if broader sentiment shifts.
#TUT climbs to $0.0193, gaining +11.98% with $4.1 M traded. The token stems from a developer’s tutorial on launching BNB‑chain tokens, a quirky origin that may attract speculative interest.
#CBRSB nudges to $119.99, up +11.04% on $1.7 M of volume. The modest flow hints at a quieter base of supporters compared with the other two movers.
👀 Watch how the differing volume levels affect the durability of each price surge.
#Write2Earn #Binance
3

·
--
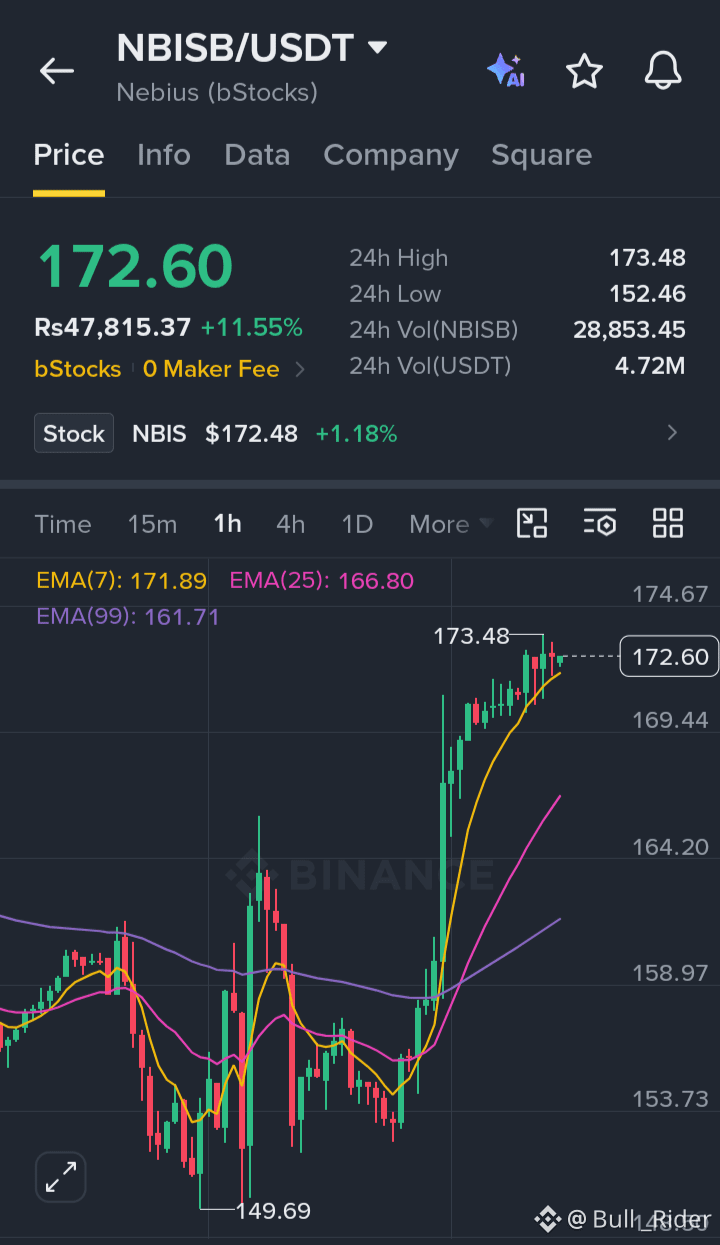
Bullish
$NBISB is showing strength above key support, with buyers maintaining control and momentum building for a potential continuation move. Price is trading near the 24-hour high, with bullish EMA alignment supporting the upward trend.
Entry: 172.60
TP1: 175.00
TP2: 178.00
TP3: 182.00
SL: 168.00
Buy and Trade $TUT
#NBISB $龙虾
{alpha}(560xeccbb861c0dda7efd964010085488b69317e4444)
{spot}(NBISBUSDT)
{future}(TUTUSDT)
$NBISB is showing strength above key support, with buyers maintaining control and momentum building for a potential continuation move. Price is trading near the 24-hour high, with bullish EMA alignment supporting the upward trend.
Entry: 172.60
TP1: 175.00
TP2: 178.00
TP3: 182.00
SL: 168.00
Buy and Trade $TUT
#NBISB $龙虾
Entry: 172.60
TP1: 175.00
TP2: 178.00
TP3: 182.00
SL: 168.00
Buy and Trade $TUT
#NBISB $龙虾
1
71

·
--
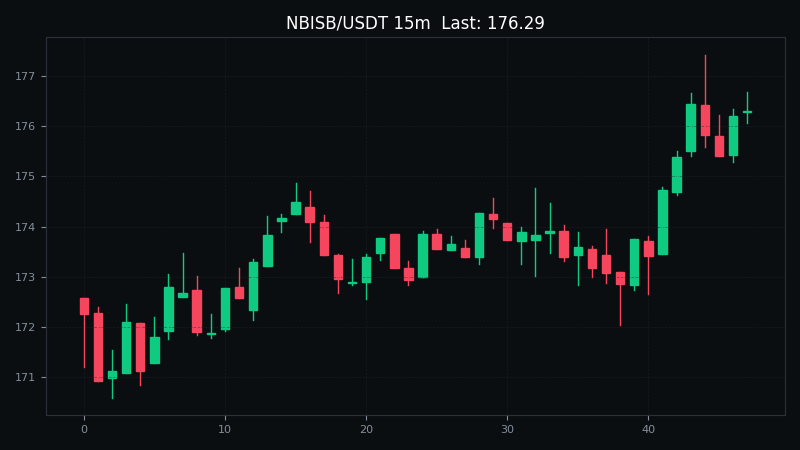
Time for a multiple-choice question: $NBISB 24h, up 11.5%, with the current price at 176.35.
A. Jump in now—the trend is king
B. Wait for a pullback—safety first
C. Start with a small position and add in stages
D. Stay away—if I don’t understand it, I don’t trade it
There’s no single right answer. Each choice reflects a different trading strategy. Pick one and tell us why. #NBISB
For discussion purposes only. This is not investment advice.
Time for a multiple-choice question: $NBISB 24h, up 11.5%, with the current price at 176.35.
A. Jump in now—the trend is king
B. Wait for a pullback—safety first
C. Start with a small position and add in stages
D. Stay away—if I don’t understand it, I don’t trade it
There’s no single right answer. Each choice reflects a different trading strategy. Pick one and tell us why. #NBISB
For discussion purposes only. This is not investment advice.
A. Jump in now—the trend is king
B. Wait for a pullback—safety first
C. Start with a small position and add in stages
D. Stay away—if I don’t understand it, I don’t trade it
There’s no single right answer. Each choice reflects a different trading strategy. Pick one and tell us why. #NBISB
For discussion purposes only. This is not investment advice.
1

·
--
🔥 ZEC, NBISB, SYN — Three mid-cap altcoins are catching serious bids right now. Different flavors, same energy: momentum is building and volume is screaming.
Why these three together? They are all in confirmed uptrends with surging volume, sitting in that sweet spot where smart money rotates after BTC consolidates. Mid-cap season is quietly brewing. 👀
🪙 ZEC — $1,297.79 (+6.0%)
The privacy OG is ripping. RSI 4H at 65 with room to run, MACD bullish crossover in play. Strong uptrend with price holding above SMA7 and SMA25 on both timeframes. Volume ratio at 0.81x means this move is built on steady accumulation, not just hype. L/S ratio at 0.64 — shorts are piling in, which is fuel for the next leg.
📊 NBISB — $171.43 (+11.75%)
This one is a beast today. 4H RSI at 62 with MACD histogram expanding positive — momentum is fresh. Price just reclaimed SMA7 (161.9) and is pushing toward SMA25 (158.9). Volume surging at 1.77x average. This is a breakout from consolidation, and the daily RSI at 42 means there is massive room overhead before overbought.
⚡ SYN — $0.179 (+9.24%)
Synapse waking up. RSI 4H at 58, MACD turning positive with histogram expanding. Uptrend confirmed with price above all key MAs on the 4H. Volume ratio at 2.19x — someone is accumulating hard. Daily RSI at 52 is dead neutral, meaning this rally has legs if volume holds.
📋 TRADE PLAN:
ZEC (Long):
• Entry: $1,280 – $1,315
• SL: $1,227
• TP: $1,350 / $1,402
NBISB (Long):
• Entry: $168 – $175
• SL: $159
• TP: $178 / $185
SYN (Long):
• Entry: $0.174 – $0.184
• SL: $0.159
• TP: $0.186 / $0.193
Which one are you most bullish on? Drop your pick below 👇
#ZEC #NBISB #SYN
🔥 ZEC, NBISB, SYN — Three mid-cap altcoins are catching serious bids right now. Different flavors, same energy: momentum is building and volume is screaming.
Why these three together? They are all in confirmed uptrends with surging volume, sitting in that sweet spot where smart money rotates after BTC consolidates. Mid-cap season is quietly brewing. 👀
🪙 ZEC — $1,297.79 (+6.0%)
The privacy OG is ripping. RSI 4H at 65 with room to run, MACD bullish crossover in play. Strong uptrend with price holding above SMA7 and SMA25 on both timeframes. Volume ratio at 0.81x means this move is built on steady accumulation, not just hype. L/S ratio at 0.64 — shorts are piling in, which is fuel for the next leg.
📊 NBISB — $171.43 (+11.75%)
This one is a beast today. 4H RSI at 62 with MACD histogram expanding positive — momentum is fresh. Price just reclaimed SMA7 (161.9) and is pushing toward SMA25 (158.9). Volume surging at 1.77x average. This is a breakout from consolidation, and the daily RSI at 42 means there is massive room overhead before overbought.
⚡ SYN — $0.179 (+9.24%)
Synapse waking up. RSI 4H at 58, MACD turning positive with histogram expanding. Uptrend confirmed with price above all key MAs on the 4H. Volume ratio at 2.19x — someone is accumulating hard. Daily RSI at 52 is dead neutral, meaning this rally has legs if volume holds.
📋 TRADE PLAN:
ZEC (Long):
• Entry: $1,280 – $1,315
• SL: $1,227
• TP: $1,350 / $1,402
NBISB (Long):
• Entry: $168 – $175
• SL: $159
• TP: $178 / $185
SYN (Long):
• Entry: $0.174 – $0.184
• SL: $0.159
• TP: $0.186 / $0.193
Which one are you most bullish on? Drop your pick below 👇
#ZEC #NBISB #SYN
Why these three together? They are all in confirmed uptrends with surging volume, sitting in that sweet spot where smart money rotates after BTC consolidates. Mid-cap season is quietly brewing. 👀
🪙 ZEC — $1,297.79 (+6.0%)
The privacy OG is ripping. RSI 4H at 65 with room to run, MACD bullish crossover in play. Strong uptrend with price holding above SMA7 and SMA25 on both timeframes. Volume ratio at 0.81x means this move is built on steady accumulation, not just hype. L/S ratio at 0.64 — shorts are piling in, which is fuel for the next leg.
📊 NBISB — $171.43 (+11.75%)
This one is a beast today. 4H RSI at 62 with MACD histogram expanding positive — momentum is fresh. Price just reclaimed SMA7 (161.9) and is pushing toward SMA25 (158.9). Volume surging at 1.77x average. This is a breakout from consolidation, and the daily RSI at 42 means there is massive room overhead before overbought.
⚡ SYN — $0.179 (+9.24%)
Synapse waking up. RSI 4H at 58, MACD turning positive with histogram expanding. Uptrend confirmed with price above all key MAs on the 4H. Volume ratio at 2.19x — someone is accumulating hard. Daily RSI at 52 is dead neutral, meaning this rally has legs if volume holds.
📋 TRADE PLAN:
ZEC (Long):
• Entry: $1,280 – $1,315
• SL: $1,227
• TP: $1,350 / $1,402
NBISB (Long):
• Entry: $168 – $175
• SL: $159
• TP: $178 / $185
SYN (Long):
• Entry: $0.174 – $0.184
• SL: $0.159
• TP: $0.186 / $0.193
Which one are you most bullish on? Drop your pick below 👇
#ZEC #NBISB #SYN
631
Log in to explore more content
Join global crypto users on Binance Square
⚡️ Get latest and useful information about crypto.
💬 Trusted by the world’s largest crypto exchange.
👍 Discover real insights from verified creators.
Email / Phone number
Trending Topics
1
#KeplrAdvisesSocialLoginUsersToTransferAssets
1,126 views
70 Discussing
2
#TetherPlans€28.8MForJuventusCapitalIncrease
1,051 views
66 Discussing
3
#JobsReportRaisesHikeOdds
634,055 views
3,917 Discussing
4
#CPITestsDecemberRateOutlook
216,264 views
1,517 Discussing
5
#US Data Center Rules May Constrain AI Expansion
89,717 views
247 Discussing
6
#ARKPlans14ThematicETFsCoveringAIAndTokenizedMarkets
5,646 views
81 Discussing
7
#WillAnthropicListOnTime
201,996 views
1,657 Discussing
8
#WillUS-IranTensionsBoostSafe-HavenDemand?
106,760 views
724 Discussing
9
#BitcoinETFsSee$412MNetOutflows
19,614 views
85 Discussing
10
#HKSFCPlansToRestrictCryptoAndExchangeTerms
84,298 views
695 Discussing