
#mroreoanalysis
mroreoanalysis
58 views
3 Discussing
Hot
Latest

·
--
Hello everyone! Let's analyze the $CVX price movement on the daily (1D) chart. Currently, the price is at a critical decision point with two potential movement scenarios:
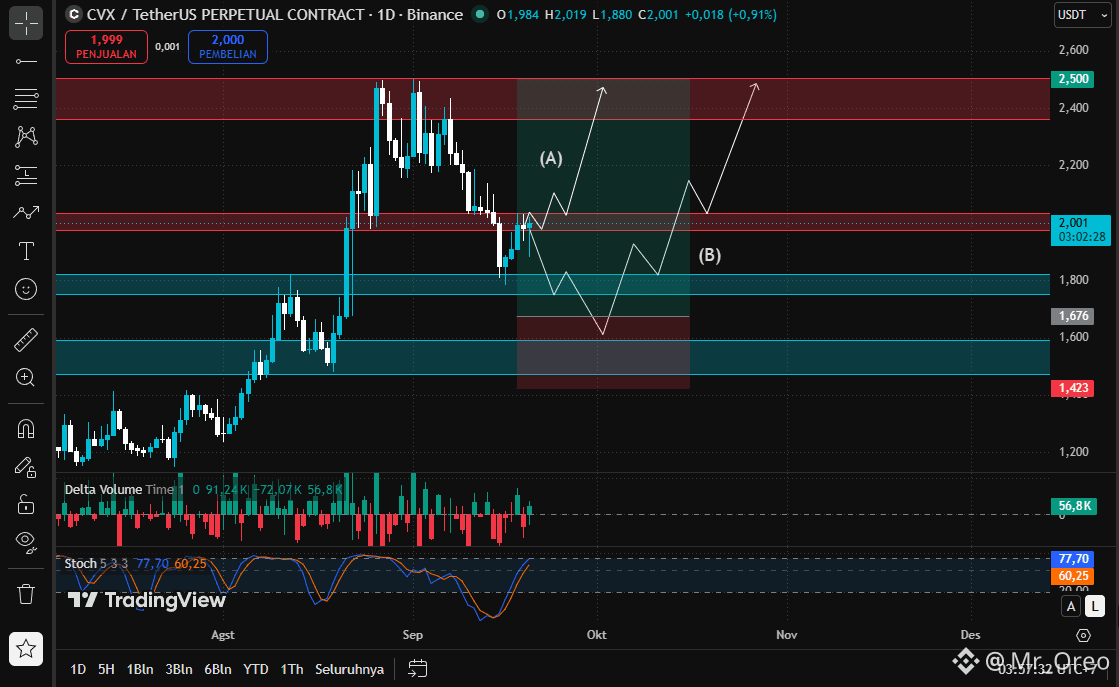
📈 Scenario (A): Immediate Rebound. The current price (around $2.001) is sitting at the first support area, marked by the blue zone ($1.800 – $2.000). Looking at the Stochastic indicator at the bottom, the lines are beginning to show an upward crossover from the oversold zone. If this support holds, CVX has a strong chance of rebounding immediately toward the resistance target in the upper red zone—specifically the $2.400 – $2.500 range.
📉 Scenario (B): Correction to Demand Area. If selling pressure remains strong and the price breaks below the current support, CVX will likely drop to test the second support area in the $1.423 – $1.676 range (lower red zone). This level could act as a strong demand zone, potentially allowing the price to establish a new foothold before eventually reversing and rising toward the $2.500 resistance target.
Conclusion: Overall, the market structure indicates a potential bullish move to retest the $2.400+ area; however, the short-term direction depends on whether the support at the $1.800 level holds.
Do you think CVX will follow path (A) or (B)? Share your thoughts in the comments!
Disclaimer: This content is purely technical analysis and not financial advice. Always practice risk management and Do Your Own Research (DYOR).
#MrOreoAnalysis #CVX #CVXUSDT #DYOR
Hello everyone! Let's analyze the $CVX price movement on the daily (1D) chart. Currently, the price is at a critical decision point with two potential movement scenarios:
📈 Scenario (A): Immediate Rebound. The current price (around $2.001) is sitting at the first support area, marked by the blue zone ($1.800 – $2.000). Looking at the Stochastic indicator at the bottom, the lines are beginning to show an upward crossover from the oversold zone. If this support holds, CVX has a strong chance of rebounding immediately toward the resistance target in the upper red zone—specifically the $2.400 – $2.500 range.
📉 Scenario (B): Correction to Demand Area. If selling pressure remains strong and the price breaks below the current support, CVX will likely drop to test the second support area in the $1.423 – $1.676 range (lower red zone). This level could act as a strong demand zone, potentially allowing the price to establish a new foothold before eventually reversing and rising toward the $2.500 resistance target.
Conclusion: Overall, the market structure indicates a potential bullish move to retest the $2.400+ area; however, the short-term direction depends on whether the support at the $1.800 level holds.
Do you think CVX will follow path (A) or (B)? Share your thoughts in the comments!
Disclaimer: This content is purely technical analysis and not financial advice. Always practice risk management and Do Your Own Research (DYOR).
#MrOreoAnalysis #CVX #CVXUSDT #DYOR
📈 Scenario (A): Immediate Rebound. The current price (around $2.001) is sitting at the first support area, marked by the blue zone ($1.800 – $2.000). Looking at the Stochastic indicator at the bottom, the lines are beginning to show an upward crossover from the oversold zone. If this support holds, CVX has a strong chance of rebounding immediately toward the resistance target in the upper red zone—specifically the $2.400 – $2.500 range.
📉 Scenario (B): Correction to Demand Area. If selling pressure remains strong and the price breaks below the current support, CVX will likely drop to test the second support area in the $1.423 – $1.676 range (lower red zone). This level could act as a strong demand zone, potentially allowing the price to establish a new foothold before eventually reversing and rising toward the $2.500 resistance target.
Conclusion: Overall, the market structure indicates a potential bullish move to retest the $2.400+ area; however, the short-term direction depends on whether the support at the $1.800 level holds.
Do you think CVX will follow path (A) or (B)? Share your thoughts in the comments!
Disclaimer: This content is purely technical analysis and not financial advice. Always practice risk management and Do Your Own Research (DYOR).
#MrOreoAnalysis #CVX #CVXUSDT #DYOR
1
67
·
--
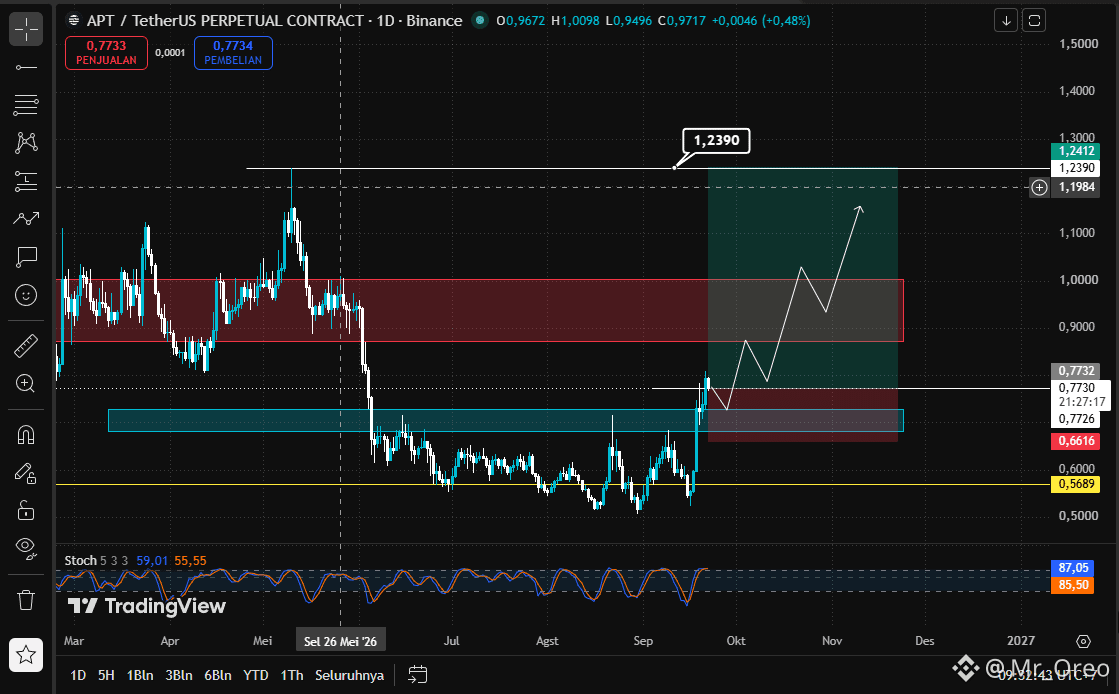
$APT starts showing recovery from the demand area 0,66–0,77 USDT after undergoing a sufficiently long accumulation phase.
Key levels to watch:
Support: 0,66–0,77
Resistance: 0,87–1,00
Major resistance: 1,19–1,24
The bullish scenario will become even more attractive if the price can break out and close above 1,00 with volume support. If that happens, the 1,19–1,24 area will become the next resistance level to watch.
On the other hand, if the price loses the 0,77 area again, the possibility of a retest to the lower demand area should be kept in mind.
Currently, momentum appears to be strengthening, but the stochastic is already in the high zone. Therefore, confirmation of the breakout and volume remain important before taking a position.
Watchlist: $APT
Disclaimer: This content is purely technical analysis and not financial advice. Always practice risk management and Do Your Own Research (DYOR).
#MrOreoAnalysis #APTUSDT #BinanceSquare #TechnicalAnalysis
$APT starts showing recovery from the demand area 0,66–0,77 USDT after undergoing a sufficiently long accumulation phase.
Key levels to watch:
Support: 0,66–0,77
Resistance: 0,87–1,00
Major resistance: 1,19–1,24
The bullish scenario will become even more attractive if the price can break out and close above 1,00 with volume support. If that happens, the 1,19–1,24 area will become the next resistance level to watch.
On the other hand, if the price loses the 0,77 area again, the possibility of a retest to the lower demand area should be kept in mind.
Currently, momentum appears to be strengthening, but the stochastic is already in the high zone. Therefore, confirmation of the breakout and volume remain important before taking a position.
Watchlist: $APT
Disclaimer: This content is purely technical analysis and not financial advice. Always practice risk management and Do Your Own Research (DYOR).
#MrOreoAnalysis #APTUSDT #BinanceSquare #TechnicalAnalysis
Key levels to watch:
Support: 0,66–0,77
Resistance: 0,87–1,00
Major resistance: 1,19–1,24
The bullish scenario will become even more attractive if the price can break out and close above 1,00 with volume support. If that happens, the 1,19–1,24 area will become the next resistance level to watch.
On the other hand, if the price loses the 0,77 area again, the possibility of a retest to the lower demand area should be kept in mind.
Currently, momentum appears to be strengthening, but the stochastic is already in the high zone. Therefore, confirmation of the breakout and volume remain important before taking a position.
Watchlist: $APT
Disclaimer: This content is purely technical analysis and not financial advice. Always practice risk management and Do Your Own Research (DYOR).
#MrOreoAnalysis #APTUSDT #BinanceSquare #TechnicalAnalysis
1
239
Log in to explore more content
Join global crypto users on Binance Square
⚡️ Get latest and useful information about crypto.
💬 Trusted by the world’s largest crypto exchange.
👍 Discover real insights from verified creators.
Email / Phone number
Trending Topics
1
#CardanoAddedToX402KitForADAPayments
1,932 views
154 Discussing
2
#XRPRises8%
10,011 views
491 Discussing
3
#AMDHits$1TrillionMarketCap
246 views
24 Discussing
4
#BitcoinSpotETFs$999MNetInflow
650 views
39 Discussing
5
#AppleGoogleSeekStablecoinTokenizedDepositTalent
6,549 views
363 Discussing
6
#NvidiaToBuyAnother$1.5BSBEnergySharesPreIPO
1,284 views
32 Discussing
7
#AgoraGetsPreliminaryOCCApprovalForTrustBank
3,937 views
183 Discussing
8
#NEARRisesNearly80%InAWeek
74,036 views
1,334 Discussing
9
#MultiversXPlansHardForkRecovery
58,222 views
1,009 Discussing
10
#CircleLaunchesInstitutionalBTCBackedBorrowing
50,903 views
991 Discussing