

Mr_Oreo
20 Posts

Mr_Oreo
Report
Block User
It's not how much profit you make in the market, but how strong you hold on in it.
Open Trade
High-Frequency Trader
3.8 Years
21 Following
3 Followers
25 Liked
Posts
Portfolio
All
Quotes
·
--
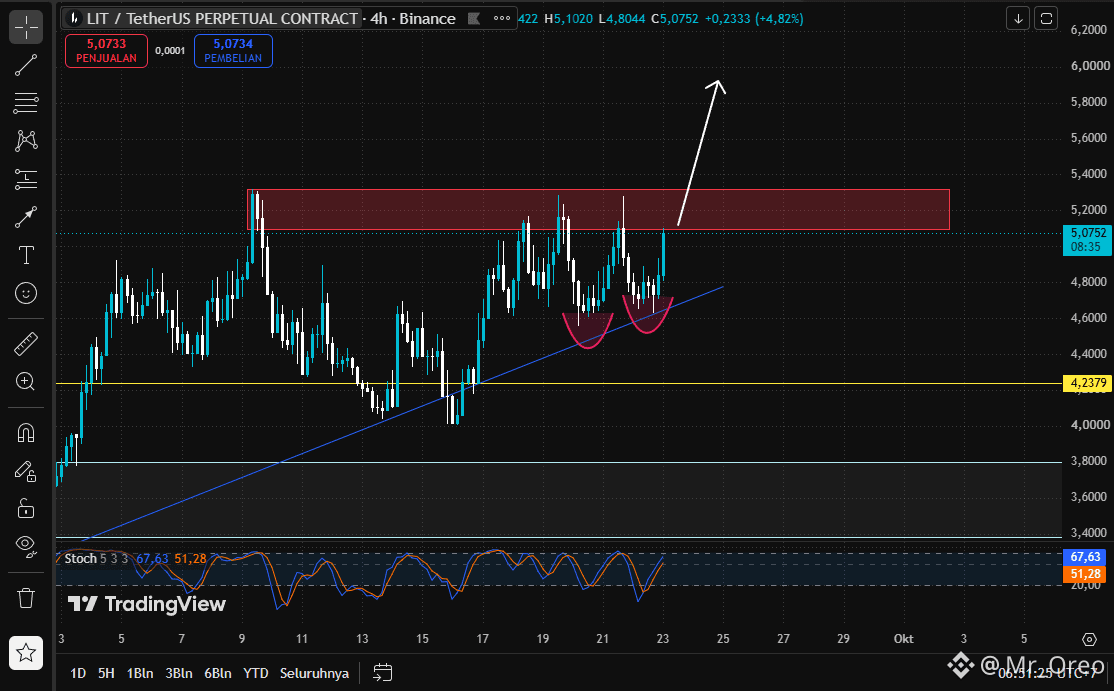
Hello everyone! Let’s analyze the price movement of $LIT on the 4-hour chart (4H). Currently, the price is at a crucial decision point with two potential movement scenarios:
📈 Scenario (A): Immediate Breakout. The current price (around $5.07) is testing the resistance area of the red zone ($5.10 – $5.30). The Stochastic indicator below shows an upward crossover from the support trend line. If the breakout succeeds, LIT has a strong chance to keep rising toward the next resistance target in the range of $5.80 – $6.00.
📉 Scenario (B): Correction / Rejection. If selling pressure in the resistance zone remains strong and the price gets rejected, LIT is likely to consolidate back to the support line area in the range of $4.60 – $4.80. This area can become a demand zone to form a new foundation before continuing the upward move.
Conclusion: Overall, the market structure shows a potentially bullish Double Bottom pattern, but the short-term direction strongly depends on whether the price can break through the $5.30 level.
What do you think—will LIT follow path (A) or (B)? Share your opinion in the comments!
Disclaimer: This content is purely technical analysis and not financial advice. Always use risk management and Do Your Own Research (DYOR).
#MrOreoAnalysis #LIT #LITUSDT #TechnicalAnalysis
Hello everyone! Let’s analyze the price movement of $LIT on the 4-hour chart (4H). Currently, the price is at a crucial decision point with two potential movement scenarios:
📈 Scenario (A): Immediate Breakout. The current price (around $5.07) is testing the resistance area of the red zone ($5.10 – $5.30). The Stochastic indicator below shows an upward crossover from the support trend line. If the breakout succeeds, LIT has a strong chance to keep rising toward the next resistance target in the range of $5.80 – $6.00.
📉 Scenario (B): Correction / Rejection. If selling pressure in the resistance zone remains strong and the price gets rejected, LIT is likely to consolidate back to the support line area in the range of $4.60 – $4.80. This area can become a demand zone to form a new foundation before continuing the upward move.
Conclusion: Overall, the market structure shows a potentially bullish Double Bottom pattern, but the short-term direction strongly depends on whether the price can break through the $5.30 level.
What do you think—will LIT follow path (A) or (B)? Share your opinion in the comments!
Disclaimer: This content is purely technical analysis and not financial advice. Always use risk management and Do Your Own Research (DYOR).
#MrOreoAnalysis #LIT #LITUSDT #TechnicalAnalysis
📈 Scenario (A): Immediate Breakout. The current price (around $5.07) is testing the resistance area of the red zone ($5.10 – $5.30). The Stochastic indicator below shows an upward crossover from the support trend line. If the breakout succeeds, LIT has a strong chance to keep rising toward the next resistance target in the range of $5.80 – $6.00.
📉 Scenario (B): Correction / Rejection. If selling pressure in the resistance zone remains strong and the price gets rejected, LIT is likely to consolidate back to the support line area in the range of $4.60 – $4.80. This area can become a demand zone to form a new foundation before continuing the upward move.
Conclusion: Overall, the market structure shows a potentially bullish Double Bottom pattern, but the short-term direction strongly depends on whether the price can break through the $5.30 level.
What do you think—will LIT follow path (A) or (B)? Share your opinion in the comments!
Disclaimer: This content is purely technical analysis and not financial advice. Always use risk management and Do Your Own Research (DYOR).
#MrOreoAnalysis #LIT #LITUSDT #TechnicalAnalysis
1
183
·
--
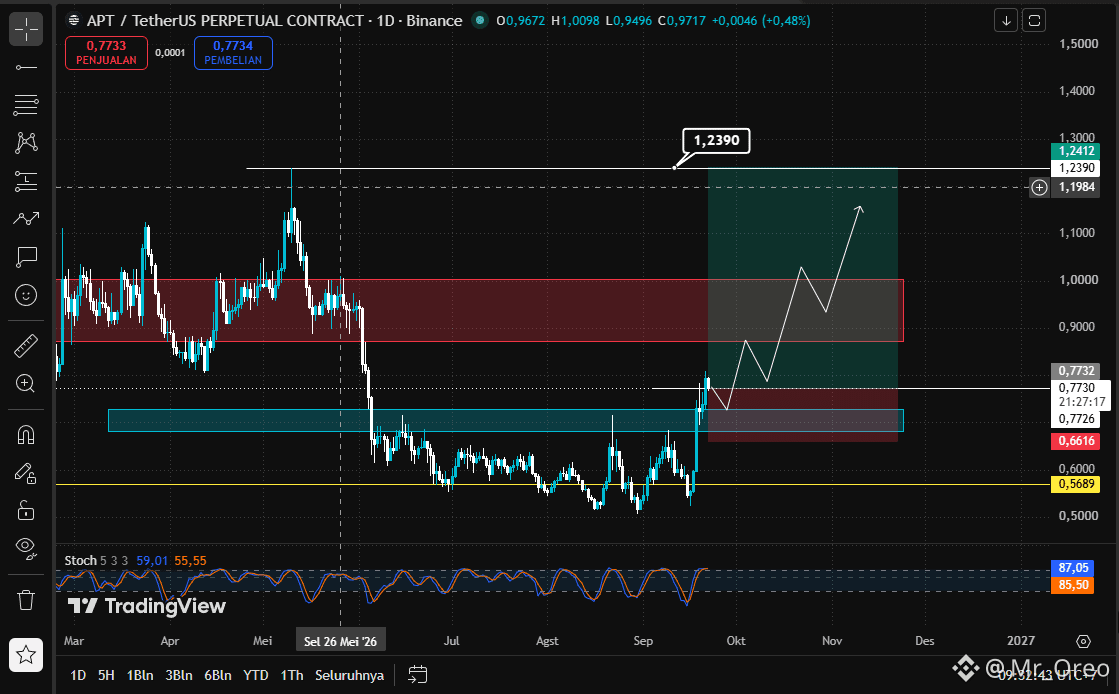
$APT starts showing recovery from the demand area 0,66–0,77 USDT after undergoing a sufficiently long accumulation phase.
Key levels to watch:
Support: 0,66–0,77
Resistance: 0,87–1,00
Major resistance: 1,19–1,24
The bullish scenario will become even more attractive if the price can break out and close above 1,00 with volume support. If that happens, the 1,19–1,24 area will become the next resistance level to watch.
On the other hand, if the price loses the 0,77 area again, the possibility of a retest to the lower demand area should be kept in mind.
Currently, momentum appears to be strengthening, but the stochastic is already in the high zone. Therefore, confirmation of the breakout and volume remain important before taking a position.
Watchlist: $APT
Disclaimer: This content is purely technical analysis and not financial advice. Always practice risk management and Do Your Own Research (DYOR).
#MrOreoAnalysis #APTUSDT #BinanceSquare #TechnicalAnalysis
$APT starts showing recovery from the demand area 0,66–0,77 USDT after undergoing a sufficiently long accumulation phase.
Key levels to watch:
Support: 0,66–0,77
Resistance: 0,87–1,00
Major resistance: 1,19–1,24
The bullish scenario will become even more attractive if the price can break out and close above 1,00 with volume support. If that happens, the 1,19–1,24 area will become the next resistance level to watch.
On the other hand, if the price loses the 0,77 area again, the possibility of a retest to the lower demand area should be kept in mind.
Currently, momentum appears to be strengthening, but the stochastic is already in the high zone. Therefore, confirmation of the breakout and volume remain important before taking a position.
Watchlist: $APT
Disclaimer: This content is purely technical analysis and not financial advice. Always practice risk management and Do Your Own Research (DYOR).
#MrOreoAnalysis #APTUSDT #BinanceSquare #TechnicalAnalysis
Key levels to watch:
Support: 0,66–0,77
Resistance: 0,87–1,00
Major resistance: 1,19–1,24
The bullish scenario will become even more attractive if the price can break out and close above 1,00 with volume support. If that happens, the 1,19–1,24 area will become the next resistance level to watch.
On the other hand, if the price loses the 0,77 area again, the possibility of a retest to the lower demand area should be kept in mind.
Currently, momentum appears to be strengthening, but the stochastic is already in the high zone. Therefore, confirmation of the breakout and volume remain important before taking a position.
Watchlist: $APT
Disclaimer: This content is purely technical analysis and not financial advice. Always practice risk management and Do Your Own Research (DYOR).
#MrOreoAnalysis #APTUSDT #BinanceSquare #TechnicalAnalysis
1
351
·
--
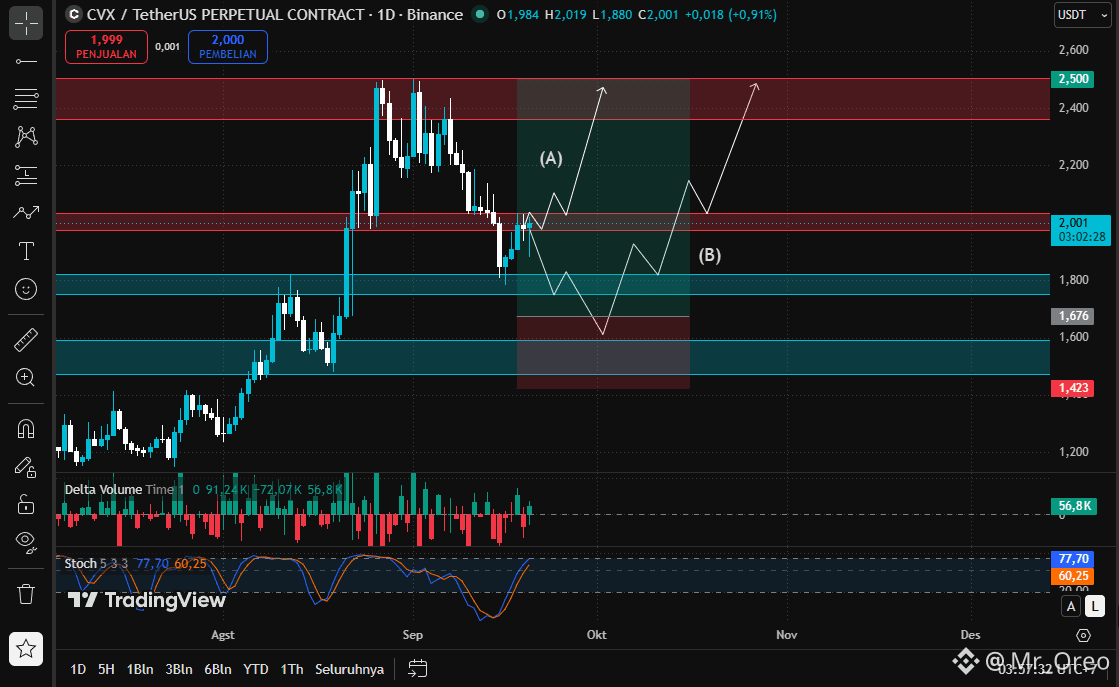
Hello everyone! Let's analyze the $CVX price movement on the daily (1D) chart. Currently, the price is at a critical decision point with two potential movement scenarios:
📈 Scenario (A): Immediate Rebound. The current price (around $2.001) is sitting at the first support area, marked by the blue zone ($1.800 – $2.000). Looking at the Stochastic indicator at the bottom, the lines are beginning to show an upward crossover from the oversold zone. If this support holds, CVX has a strong chance of rebounding immediately toward the resistance target in the upper red zone—specifically the $2.400 – $2.500 range.
📉 Scenario (B): Correction to Demand Area. If selling pressure remains strong and the price breaks below the current support, CVX will likely drop to test the second support area in the $1.423 – $1.676 range (lower red zone). This level could act as a strong demand zone, potentially allowing the price to establish a new foothold before eventually reversing and rising toward the $2.500 resistance target.
Conclusion: Overall, the market structure indicates a potential bullish move to retest the $2.400+ area; however, the short-term direction depends on whether the support at the $1.800 level holds.
Do you think CVX will follow path (A) or (B)? Share your thoughts in the comments!
Disclaimer: This content is purely technical analysis and not financial advice. Always practice risk management and Do Your Own Research (DYOR).
#MrOreoAnalysis #CVX #CVXUSDT #DYOR
Hello everyone! Let's analyze the $CVX price movement on the daily (1D) chart. Currently, the price is at a critical decision point with two potential movement scenarios:
📈 Scenario (A): Immediate Rebound. The current price (around $2.001) is sitting at the first support area, marked by the blue zone ($1.800 – $2.000). Looking at the Stochastic indicator at the bottom, the lines are beginning to show an upward crossover from the oversold zone. If this support holds, CVX has a strong chance of rebounding immediately toward the resistance target in the upper red zone—specifically the $2.400 – $2.500 range.
📉 Scenario (B): Correction to Demand Area. If selling pressure remains strong and the price breaks below the current support, CVX will likely drop to test the second support area in the $1.423 – $1.676 range (lower red zone). This level could act as a strong demand zone, potentially allowing the price to establish a new foothold before eventually reversing and rising toward the $2.500 resistance target.
Conclusion: Overall, the market structure indicates a potential bullish move to retest the $2.400+ area; however, the short-term direction depends on whether the support at the $1.800 level holds.
Do you think CVX will follow path (A) or (B)? Share your thoughts in the comments!
Disclaimer: This content is purely technical analysis and not financial advice. Always practice risk management and Do Your Own Research (DYOR).
#MrOreoAnalysis #CVX #CVXUSDT #DYOR
📈 Scenario (A): Immediate Rebound. The current price (around $2.001) is sitting at the first support area, marked by the blue zone ($1.800 – $2.000). Looking at the Stochastic indicator at the bottom, the lines are beginning to show an upward crossover from the oversold zone. If this support holds, CVX has a strong chance of rebounding immediately toward the resistance target in the upper red zone—specifically the $2.400 – $2.500 range.
📉 Scenario (B): Correction to Demand Area. If selling pressure remains strong and the price breaks below the current support, CVX will likely drop to test the second support area in the $1.423 – $1.676 range (lower red zone). This level could act as a strong demand zone, potentially allowing the price to establish a new foothold before eventually reversing and rising toward the $2.500 resistance target.
Conclusion: Overall, the market structure indicates a potential bullish move to retest the $2.400+ area; however, the short-term direction depends on whether the support at the $1.800 level holds.
Do you think CVX will follow path (A) or (B)? Share your thoughts in the comments!
Disclaimer: This content is purely technical analysis and not financial advice. Always practice risk management and Do Your Own Research (DYOR).
#MrOreoAnalysis #CVX #CVXUSDT #DYOR
1
73
·
--
2
208
·
--
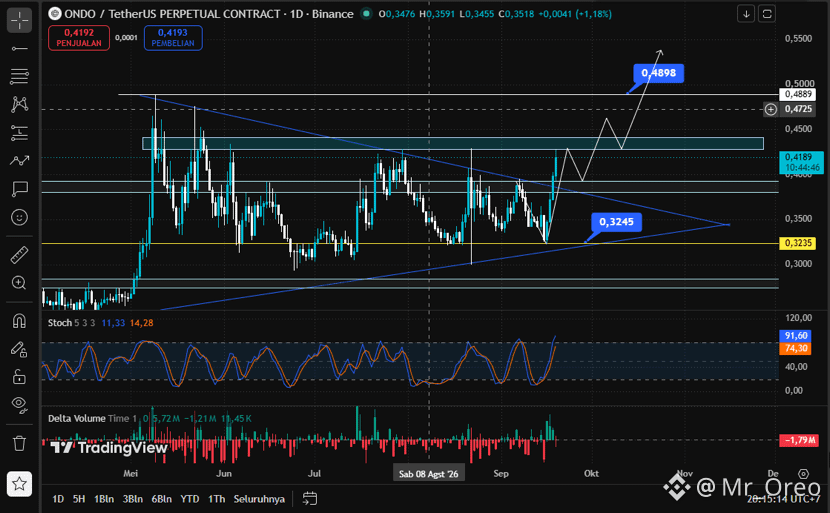
$ONDO rejection at the 0.3245 area with high buying volume, then continued to rise to 0.4280. interesting to watch
$ONDO rejection at the 0.3245 area with high buying volume, then continued to rise to 0.4280. interesting to watch
1
220
·
--
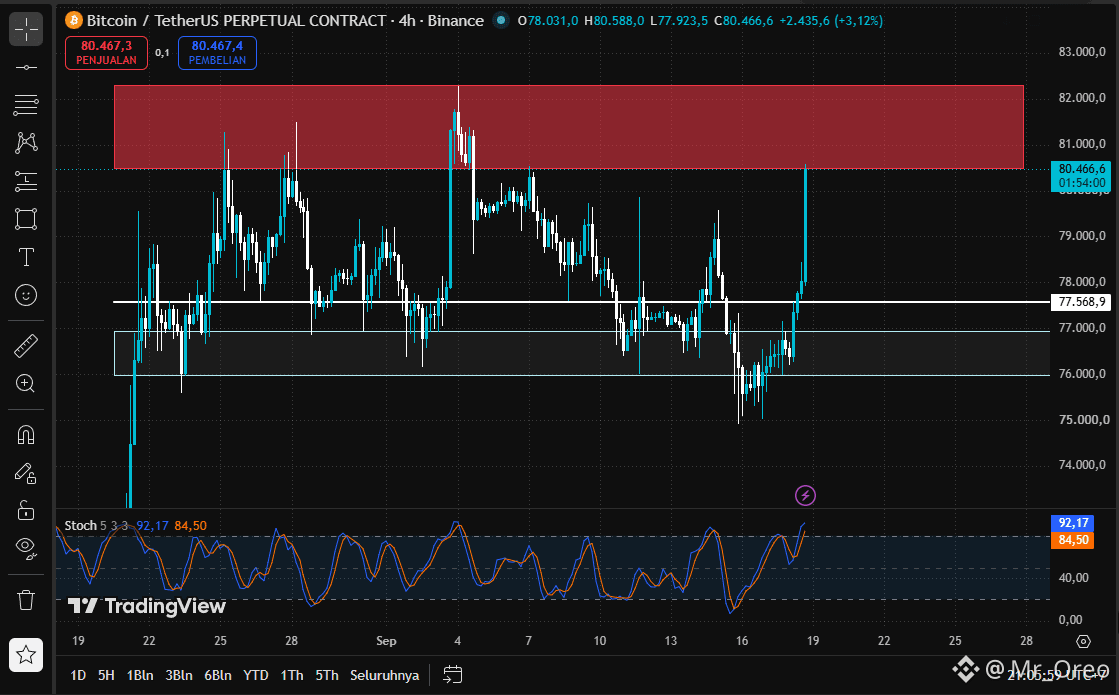
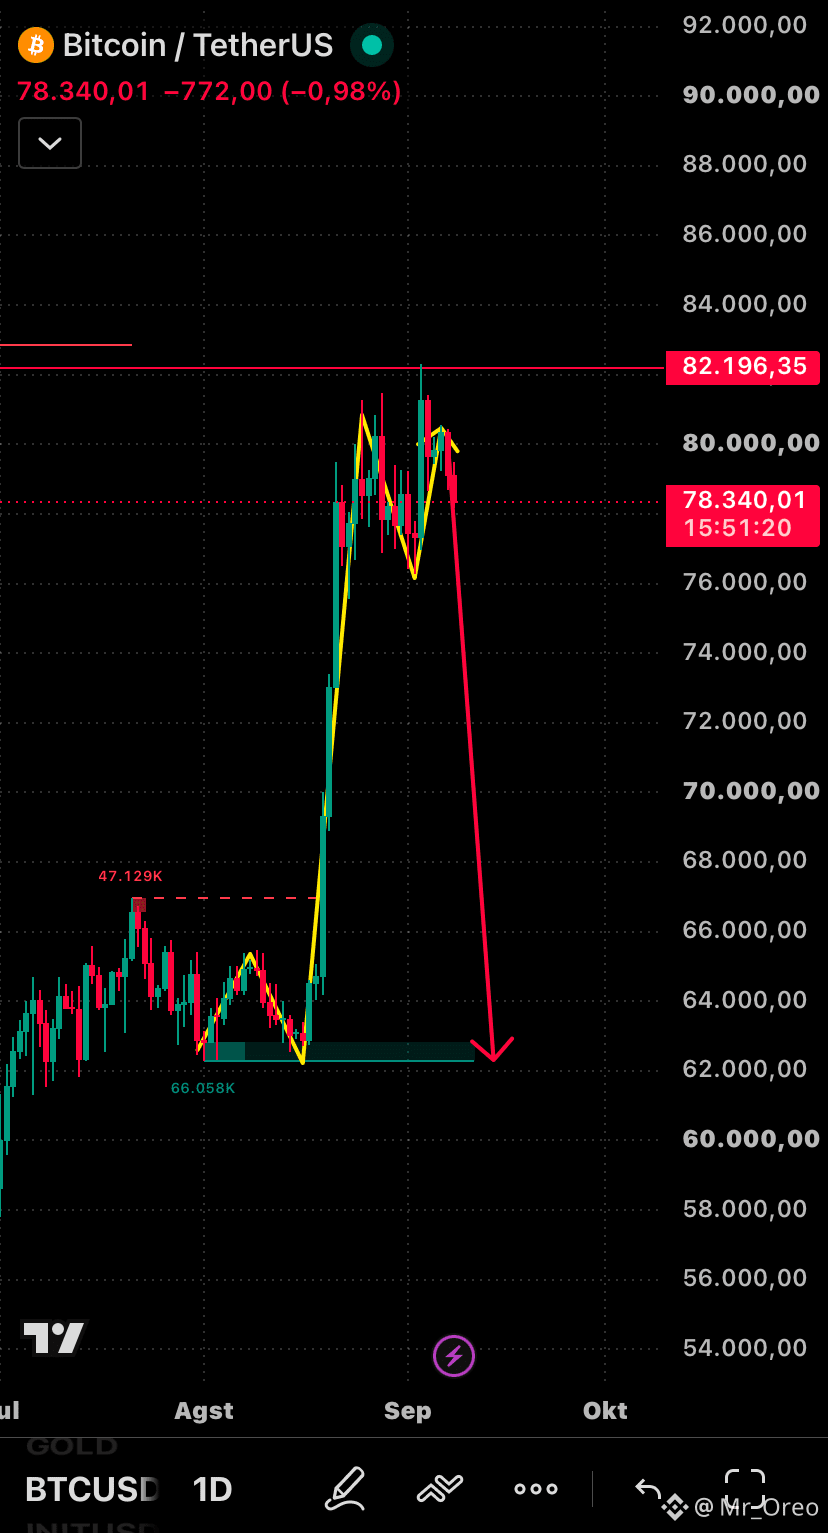
$BTC Even bad news can't stop a bull that's running.😁crazy
$BTC Even bad news can't stop a bull that's running.😁crazy
1
83
·
--
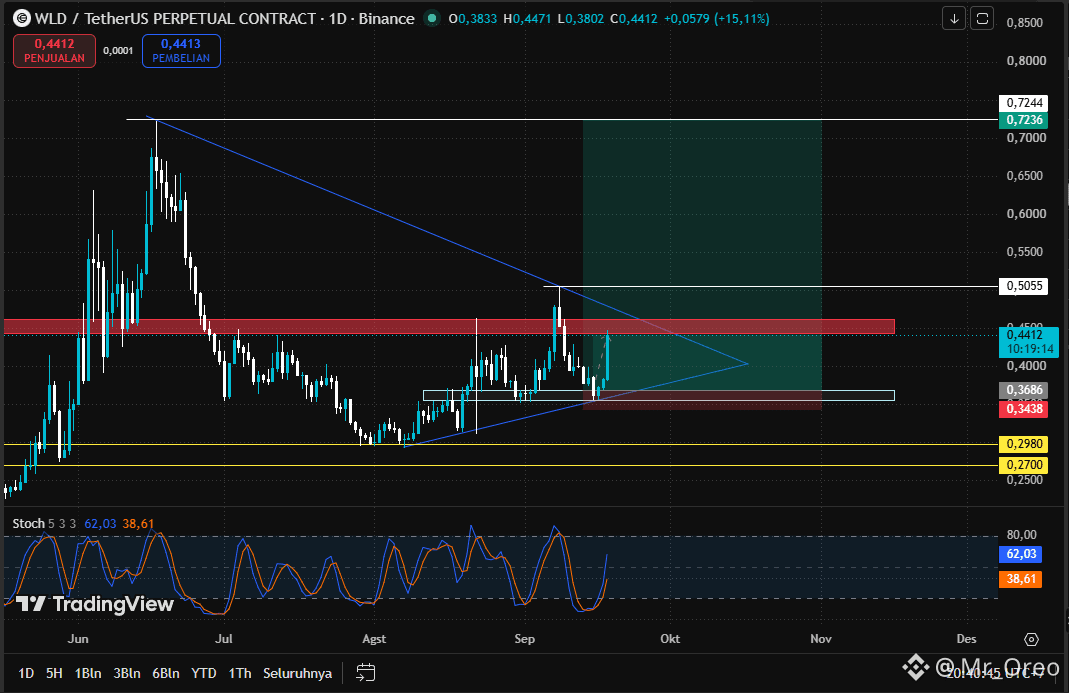
update $WLD I've already taken some of my profits and set BEP. if you want to open position, wait for it to break the resistance area and try to find the retest area
update $WLD I've already taken some of my profits and set BEP. if you want to open position, wait for it to break the resistance area and try to find the retest area
2
176
·
--
Bullish
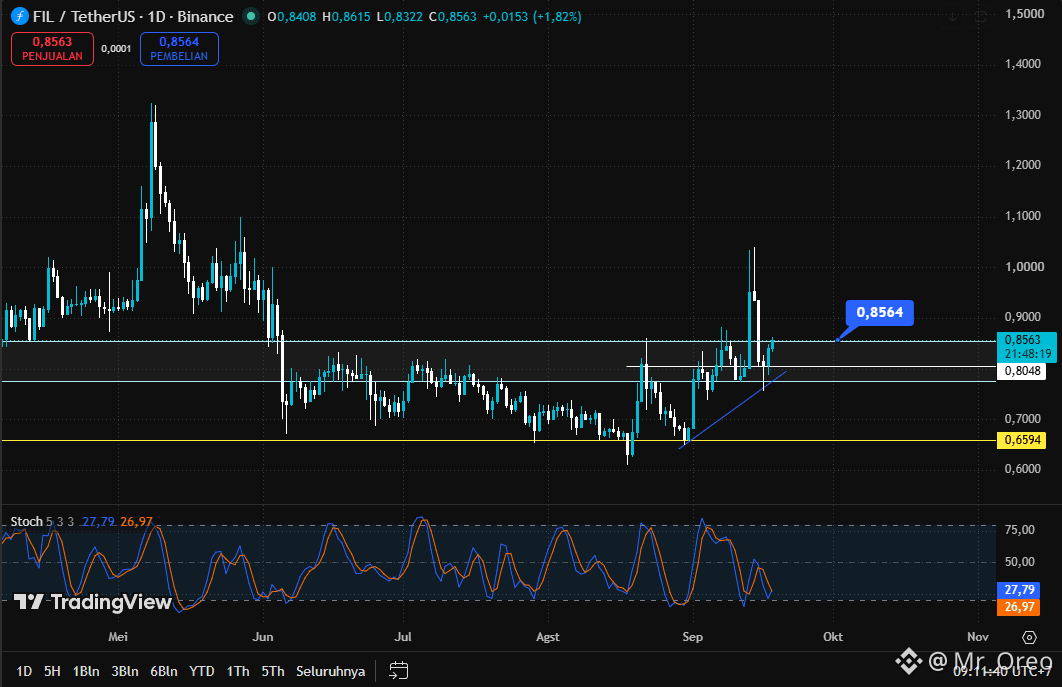
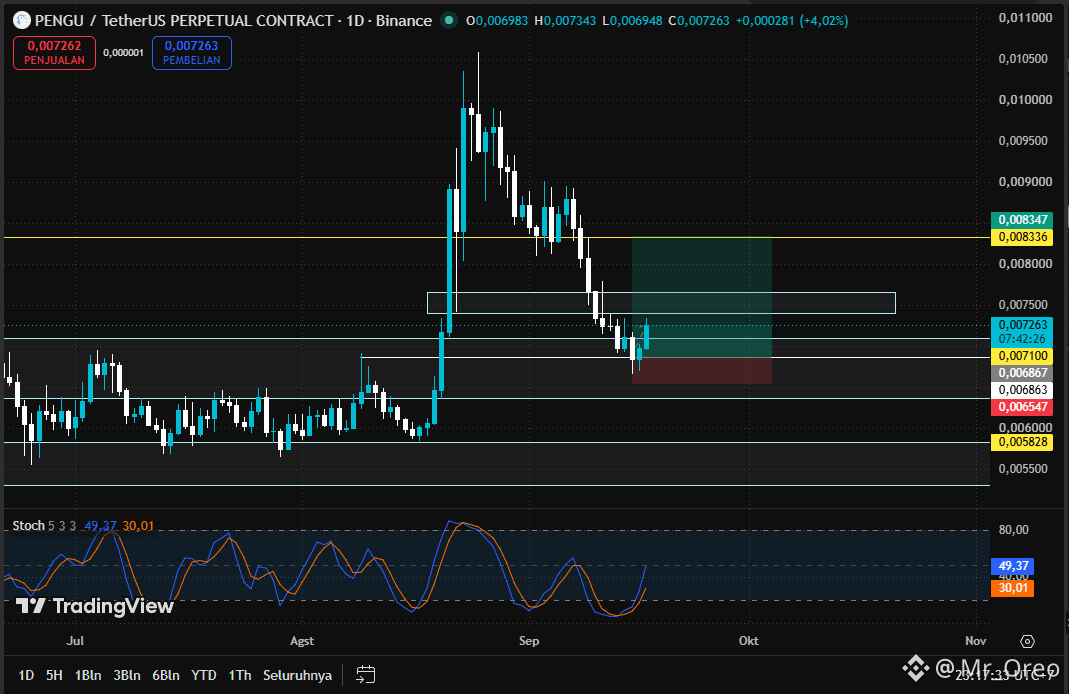
if $FIL manages to retake the 0.8564 area and stay there on the daily, I have no idea how high it could go. $1-$4? let's see where the market takes it😁
if $FIL manages to retake the 0.8564 area and stay there on the daily, I have no idea how high it could go. $1-$4? let's see where the market takes it😁
1
318
·
--
Bullish
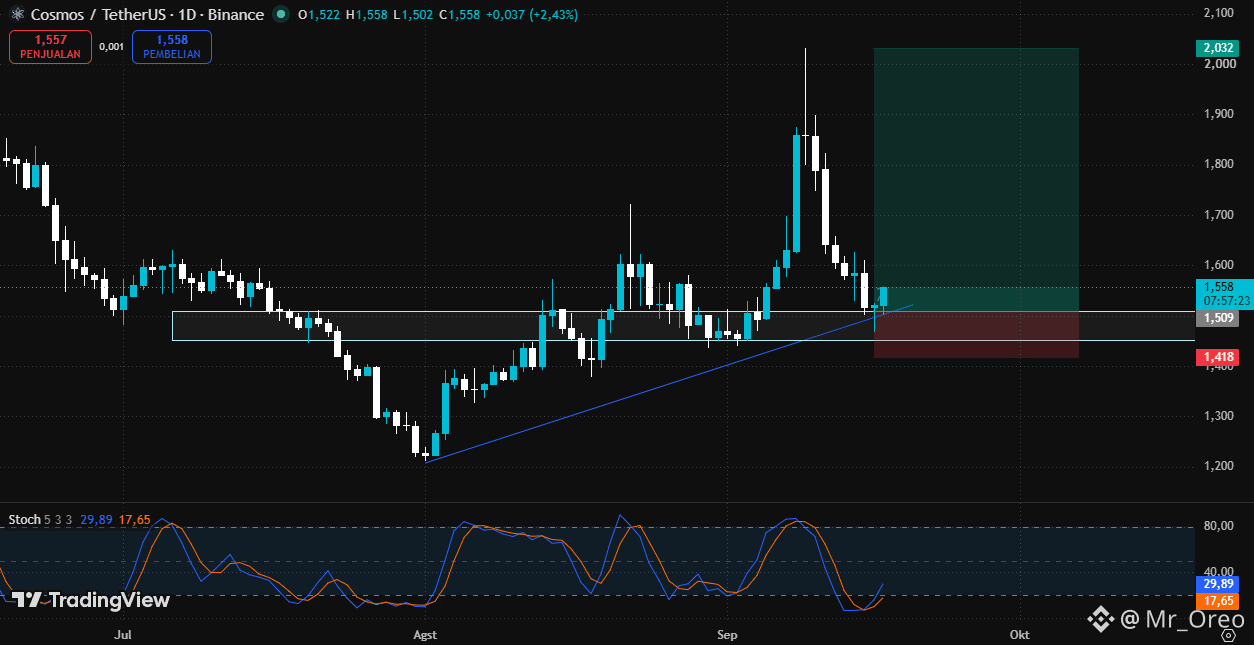
$ATOM goodluck!,don't forget to give me a tip😁
$ATOM goodluck!,don't forget to give me a tip😁
1
2
515
·
--
1
91
·
--
Bullish
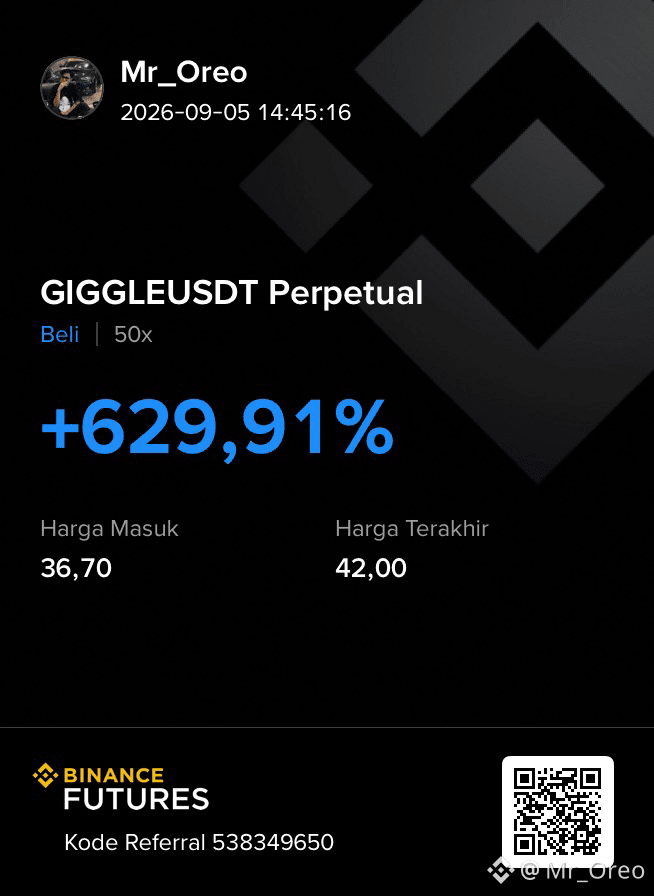
If $GIGGLE breaks through the 45.80 level and holds, the next target is 55.59.
If $GIGGLE breaks through the 45.80 level and holds, the next target is 55.59.
Mr_Oreo
·
--
Bullish$GIGGLE I will tell you, don't miss it!
1
125
·
--
85
·
--
Bullish
1
109
Log in to explore more content
Join global crypto users on Binance Square
⚡️ Get latest and useful information about crypto.
💬 Trusted by the world’s largest crypto exchange.
👍 Discover real insights from verified creators.
Email / Phone number