
#minimax
minimax
76,008 views
919 Discussing
Hot
Latest


·
--
Bullish
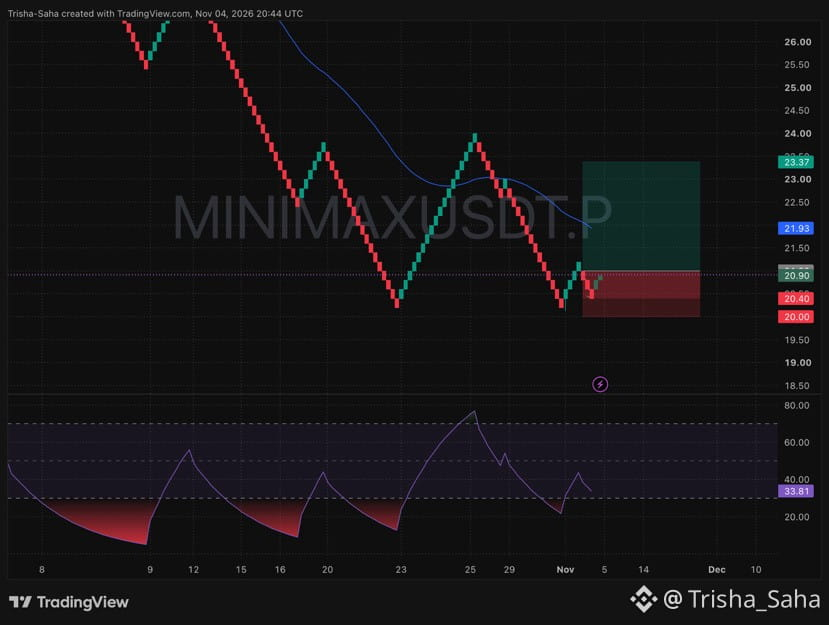
🌪️ $MINIMAX just formed a rock-solid double bottom and buyers are charging back in! 📈
📍 Trade Setup:
• Entry Zone: $20.50 – $20.90
• Stop Loss: $20.00
• Target: $23.37
🔥 Why This Move Is Primed:
• Sellers failed twice to break the $20.00 floor, and this latest dip held $20.40 before flipping right back into green candles.
• The bottom momentum line is sitting low at 33.81, giving bulls a completely reset tank to push this higher.
• Once we punch past the $21.93 blue line, the chart is wide open all the way up to $23.37.
🛡️ Smart money rule: Push your Stop Loss right to your entry price as soon as we hit +3% to +4% profit to lock in a zero-risk trade.
I'm already in on $MINIMAX and ready for the breakout. Are you riding this wave with me? Drop a comment below! 👇
#MINIMAX #MINIMAXUSDT #CryptoTrading #BinanceSquare
{future}(MINIMAXUSDT)
🌪️ $MINIMAX just formed a rock-solid double bottom and buyers are charging back in! 📈
📍 Trade Setup:
• Entry Zone: $20.50 – $20.90
• Stop Loss: $20.00
• Target: $23.37
🔥 Why This Move Is Primed:
• Sellers failed twice to break the $20.00 floor, and this latest dip held $20.40 before flipping right back into green candles.
• The bottom momentum line is sitting low at 33.81, giving bulls a completely reset tank to push this higher.
• Once we punch past the $21.93 blue line, the chart is wide open all the way up to $23.37.
🛡️ Smart money rule: Push your Stop Loss right to your entry price as soon as we hit +3% to +4% profit to lock in a zero-risk trade.
I'm already in on $MINIMAX and ready for the breakout. Are you riding this wave with me? Drop a comment below! 👇
#MINIMAX #MINIMAXUSDT #CryptoTrading #BinanceSquare
📍 Trade Setup:
• Entry Zone: $20.50 – $20.90
• Stop Loss: $20.00
• Target: $23.37
🔥 Why This Move Is Primed:
• Sellers failed twice to break the $20.00 floor, and this latest dip held $20.40 before flipping right back into green candles.
• The bottom momentum line is sitting low at 33.81, giving bulls a completely reset tank to push this higher.
• Once we punch past the $21.93 blue line, the chart is wide open all the way up to $23.37.
🛡️ Smart money rule: Push your Stop Loss right to your entry price as soon as we hit +3% to +4% profit to lock in a zero-risk trade.
I'm already in on $MINIMAX and ready for the breakout. Are you riding this wave with me? Drop a comment below! 👇
#MINIMAX #MINIMAXUSDT #CryptoTrading #BinanceSquare
192

·
--
⚡ $MINIMAX PRESSING HARD AGAINST 40.43 RESISTANCE AS BUYERS PREPARE FOR EXPLOSIVE BREAKOUT! 💥
Entry: 40.35 - 40.45 ⚡
Target: 40.80 - 41.50 🚀
Aggressive order flow is hammering the critical 40.43 supply zone, with persistent buyers constantly stepping up to absorb every minor dip. 📌 Sellers are visibly losing leverage as bid pressure builds right beneath resistance.
A single expansion spike in volume could flush remaining overhead liquidity and send prices tearing straight toward the 41.50 target zone. 📊 Momentum is coiling tight, leaving a very sharp execution window before breakout traders take full control. ⚡
💬 Are you positioning ahead of the break or waiting for a confirmed candle close above 40.43? 👇
⚠️ Not financial advice. Always manage your risk. 🛡️
🏷️ #MINIMAX #Breakout #Crypto #Trading #Momentum
🔥 💎
⚡ $MINIMAX PRESSING HARD AGAINST 40.43 RESISTANCE AS BUYERS PREPARE FOR EXPLOSIVE BREAKOUT! 💥
Entry: 40.35 - 40.45 ⚡
Target: 40.80 - 41.50 🚀
Aggressive order flow is hammering the critical 40.43 supply zone, with persistent buyers constantly stepping up to absorb every minor dip. 📌 Sellers are visibly losing leverage as bid pressure builds right beneath resistance.
A single expansion spike in volume could flush remaining overhead liquidity and send prices tearing straight toward the 41.50 target zone. 📊 Momentum is coiling tight, leaving a very sharp execution window before breakout traders take full control. ⚡
💬 Are you positioning ahead of the break or waiting for a confirmed candle close above 40.43? 👇
⚠️ Not financial advice. Always manage your risk. 🛡️
🏷️ #MINIMAX #Breakout #Crypto #Trading #Momentum
🔥 💎
Entry: 40.35 - 40.45 ⚡
Target: 40.80 - 41.50 🚀
Aggressive order flow is hammering the critical 40.43 supply zone, with persistent buyers constantly stepping up to absorb every minor dip. 📌 Sellers are visibly losing leverage as bid pressure builds right beneath resistance.
A single expansion spike in volume could flush remaining overhead liquidity and send prices tearing straight toward the 41.50 target zone. 📊 Momentum is coiling tight, leaving a very sharp execution window before breakout traders take full control. ⚡
💬 Are you positioning ahead of the break or waiting for a confirmed candle close above 40.43? 👇
⚠️ Not financial advice. Always manage your risk. 🛡️
🏷️ #MINIMAX #Breakout #Crypto #Trading #Momentum
🔥 💎
17

·
--
$MINIMAX COILING LIKE A TIGHT SPRING FOR AN EXPLOSIVE BREAKOUT ABOVE RESISTANCE! 💥⚡
Entry: 40.35 - 40.45 ⚡
Target: 40.80 - 41.50 🚀
Market makers have been quietly accumulating $MINIMAX inside a razor-tight range, compressing price action into a massive coiled spring. 📊 Aggressive market bids are absorbing every bit of seller liquidity right beneath key resistance.
This tight price consolidation is setting up a high-velocity momentum expansion before the breakout candles paint. ⚡ Front-running the volatility window now beats chasing green candles once resistance snaps.
💬 Are you positioning early in the accumulation pocket or waiting for the breakout confirmation? 👇
⚠️ Not financial advice. Always manage your risk. 🛡️
🏷️ #MINIMAX #Breakout #Crypto #Altcoins #Trading
🔥 ⚡
$MINIMAX COILING LIKE A TIGHT SPRING FOR AN EXPLOSIVE BREAKOUT ABOVE RESISTANCE! 💥⚡
Entry: 40.35 - 40.45 ⚡
Target: 40.80 - 41.50 🚀
Market makers have been quietly accumulating $MINIMAX inside a razor-tight range, compressing price action into a massive coiled spring. 📊 Aggressive market bids are absorbing every bit of seller liquidity right beneath key resistance.
This tight price consolidation is setting up a high-velocity momentum expansion before the breakout candles paint. ⚡ Front-running the volatility window now beats chasing green candles once resistance snaps.
💬 Are you positioning early in the accumulation pocket or waiting for the breakout confirmation? 👇
⚠️ Not financial advice. Always manage your risk. 🛡️
🏷️ #MINIMAX #Breakout #Crypto #Altcoins #Trading
🔥 ⚡
Entry: 40.35 - 40.45 ⚡
Target: 40.80 - 41.50 🚀
Market makers have been quietly accumulating $MINIMAX inside a razor-tight range, compressing price action into a massive coiled spring. 📊 Aggressive market bids are absorbing every bit of seller liquidity right beneath key resistance.
This tight price consolidation is setting up a high-velocity momentum expansion before the breakout candles paint. ⚡ Front-running the volatility window now beats chasing green candles once resistance snaps.
💬 Are you positioning early in the accumulation pocket or waiting for the breakout confirmation? 👇
⚠️ Not financial advice. Always manage your risk. 🛡️
🏷️ #MINIMAX #Breakout #Crypto #Altcoins #Trading
🔥 ⚡
13

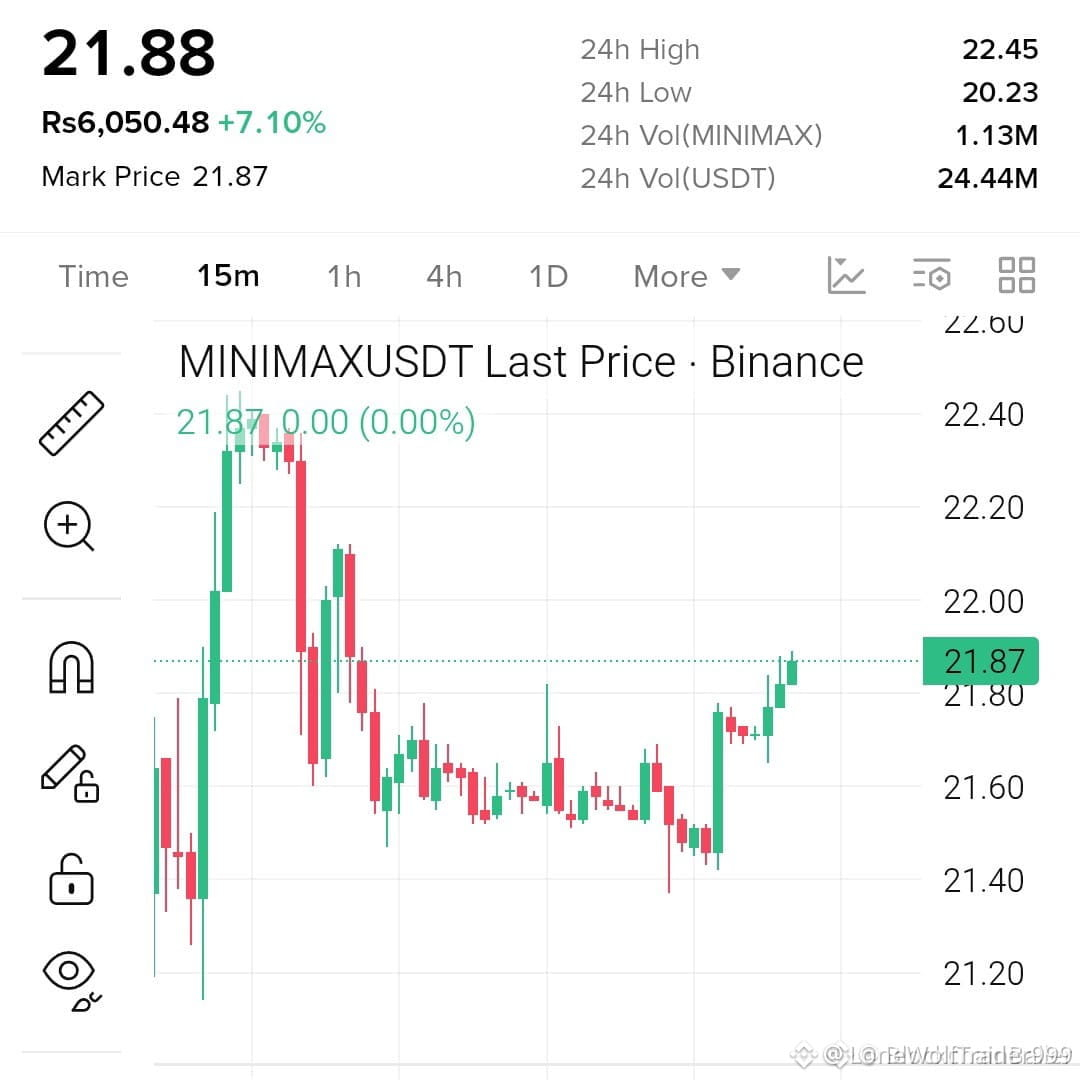
🚀 $MINIMAX SURGES POST CONSOLIDATION BREAKOUT! 💥
Entry: 21.60-21.88 ⚡
Target: 22.20/22.45/23.00 🚀
Stop Loss: 21.30 ⚠️
The 4‑hour chart just snapped a tight demand block, and smart‑money whales are sweeping the last lingering liquidity. 📊 Volume spiked as buyers reclaimed the 21.88 level, turning the consolidation into a launchpad. 🦈 A fresh bullish thrust is now feeding into the next resistance corridor, primed for a run toward the 22.20‑23.00 zone. 💡
💬 Are you riding this wave or waiting for the next liquidity dip? 👇
⚠️ Not financial advice. Always manage your risk. 🛡️
🏷️ #MINIMAX #LongSetup #Breakout #Crypto
🔥 🚀
🚀 $MINIMAX SURGES POST CONSOLIDATION BREAKOUT! 💥
Entry: 21.60-21.88 ⚡
Target: 22.20/22.45/23.00 🚀
Stop Loss: 21.30 ⚠️
The 4‑hour chart just snapped a tight demand block, and smart‑money whales are sweeping the last lingering liquidity. 📊 Volume spiked as buyers reclaimed the 21.88 level, turning the consolidation into a launchpad. 🦈 A fresh bullish thrust is now feeding into the next resistance corridor, primed for a run toward the 22.20‑23.00 zone. 💡
💬 Are you riding this wave or waiting for the next liquidity dip? 👇
⚠️ Not financial advice. Always manage your risk. 🛡️
🏷️ #MINIMAX #LongSetup #Breakout #Crypto
🔥 🚀
Entry: 21.60-21.88 ⚡
Target: 22.20/22.45/23.00 🚀
Stop Loss: 21.30 ⚠️
The 4‑hour chart just snapped a tight demand block, and smart‑money whales are sweeping the last lingering liquidity. 📊 Volume spiked as buyers reclaimed the 21.88 level, turning the consolidation into a launchpad. 🦈 A fresh bullish thrust is now feeding into the next resistance corridor, primed for a run toward the 22.20‑23.00 zone. 💡
💬 Are you riding this wave or waiting for the next liquidity dip? 👇
⚠️ Not financial advice. Always manage your risk. 🛡️
🏷️ #MINIMAX #LongSetup #Breakout #Crypto
🔥 🚀
2

·
--
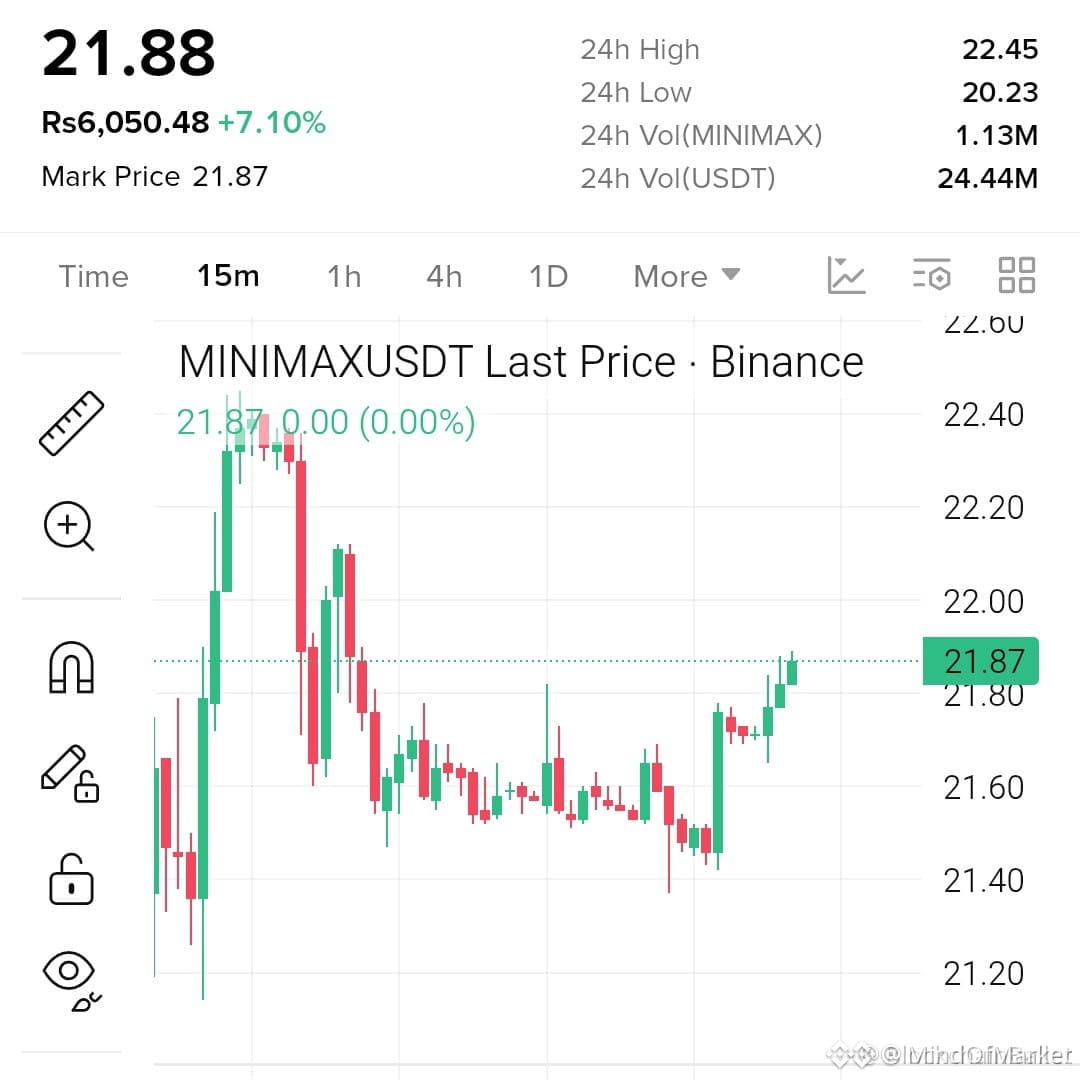
🚀 $MINIMAX BREAKS OUT FROM CONSOLIDATION AT 21.88! 📈
Entry: 21.60-21.88 ⚡
Target: 22.20 🚀
Stop Loss: 21.30 ⚠️
📊 The demand zone between 21.60‑21.88 has absorbed aggressive selling three times, signaling a smart‑money liquidity sweep. 🌊 Volume spikes on the 4H chart confirm that institutions are re‑staking their claim as price pierces the breakout threshold.
⚡ With a crisp 1:2.5 risk‑reward, the next resistance cluster sits near 22.20, aligning with the prior swing high. 📌 A clean retest could add further upside toward higher supply zones.
💬 Are you positioning alongside this institutional swing? 👇
⚠️ Not financial advice. Always manage your risk. 🛡️
🏷️ #MINIMAX #LongSetup #Breakout #Crypto
🔥 💎
🚀 $MINIMAX BREAKS OUT FROM CONSOLIDATION AT 21.88! 📈
Entry: 21.60-21.88 ⚡
Target: 22.20 🚀
Stop Loss: 21.30 ⚠️
📊 The demand zone between 21.60‑21.88 has absorbed aggressive selling three times, signaling a smart‑money liquidity sweep. 🌊 Volume spikes on the 4H chart confirm that institutions are re‑staking their claim as price pierces the breakout threshold.
⚡ With a crisp 1:2.5 risk‑reward, the next resistance cluster sits near 22.20, aligning with the prior swing high. 📌 A clean retest could add further upside toward higher supply zones.
💬 Are you positioning alongside this institutional swing? 👇
⚠️ Not financial advice. Always manage your risk. 🛡️
🏷️ #MINIMAX #LongSetup #Breakout #Crypto
🔥 💎
Entry: 21.60-21.88 ⚡
Target: 22.20 🚀
Stop Loss: 21.30 ⚠️
📊 The demand zone between 21.60‑21.88 has absorbed aggressive selling three times, signaling a smart‑money liquidity sweep. 🌊 Volume spikes on the 4H chart confirm that institutions are re‑staking their claim as price pierces the breakout threshold.
⚡ With a crisp 1:2.5 risk‑reward, the next resistance cluster sits near 22.20, aligning with the prior swing high. 📌 A clean retest could add further upside toward higher supply zones.
💬 Are you positioning alongside this institutional swing? 👇
⚠️ Not financial advice. Always manage your risk. 🛡️
🏷️ #MINIMAX #LongSetup #Breakout #Crypto
🔥 💎
1
·
--
$MINIMAX PINNED BELOW MA AS SELLING VOLUME EXPLODES 250% TOWARD CRITICAL SUPPORT! 🔴 📉
Entry: 39.65 - 39.80 ⚡
Target: 39.50 - 38.90 🎯
📊 Sellers just slammed the 1H timeframe with a violent 250% surge in volume, trapping overleveraged buyers beneath key moving averages. Market makers are keeping price compressed right above the critical 39.50 floor to force maximum capitulation.
💡 If this 39.50 support snaps, expect a fast liquidity wash down toward 38.90 with zero friction. 🔻 Momentum is leaning heavily to the downside as buyers lose control. 💬 Are you riding this breakdown or waiting for 39.50 to shatter first? 👇
⚠️ Not financial advice. Always manage your risk. 🛡️
🏷️ #MINIMAX #ShortSetup #Bearish #Crypto
🔴 📉
$MINIMAX PINNED BELOW MA AS SELLING VOLUME EXPLODES 250% TOWARD CRITICAL SUPPORT! 🔴 📉
Entry: 39.65 - 39.80 ⚡
Target: 39.50 - 38.90 🎯
📊 Sellers just slammed the 1H timeframe with a violent 250% surge in volume, trapping overleveraged buyers beneath key moving averages. Market makers are keeping price compressed right above the critical 39.50 floor to force maximum capitulation.
💡 If this 39.50 support snaps, expect a fast liquidity wash down toward 38.90 with zero friction. 🔻 Momentum is leaning heavily to the downside as buyers lose control. 💬 Are you riding this breakdown or waiting for 39.50 to shatter first? 👇
⚠️ Not financial advice. Always manage your risk. 🛡️
🏷️ #MINIMAX #ShortSetup #Bearish #Crypto
🔴 📉
Entry: 39.65 - 39.80 ⚡
Target: 39.50 - 38.90 🎯
📊 Sellers just slammed the 1H timeframe with a violent 250% surge in volume, trapping overleveraged buyers beneath key moving averages. Market makers are keeping price compressed right above the critical 39.50 floor to force maximum capitulation.
💡 If this 39.50 support snaps, expect a fast liquidity wash down toward 38.90 with zero friction. 🔻 Momentum is leaning heavily to the downside as buyers lose control. 💬 Are you riding this breakdown or waiting for 39.50 to shatter first? 👇
⚠️ Not financial advice. Always manage your risk. 🛡️
🏷️ #MINIMAX #ShortSetup #Bearish #Crypto
🔴 📉
6

·
--
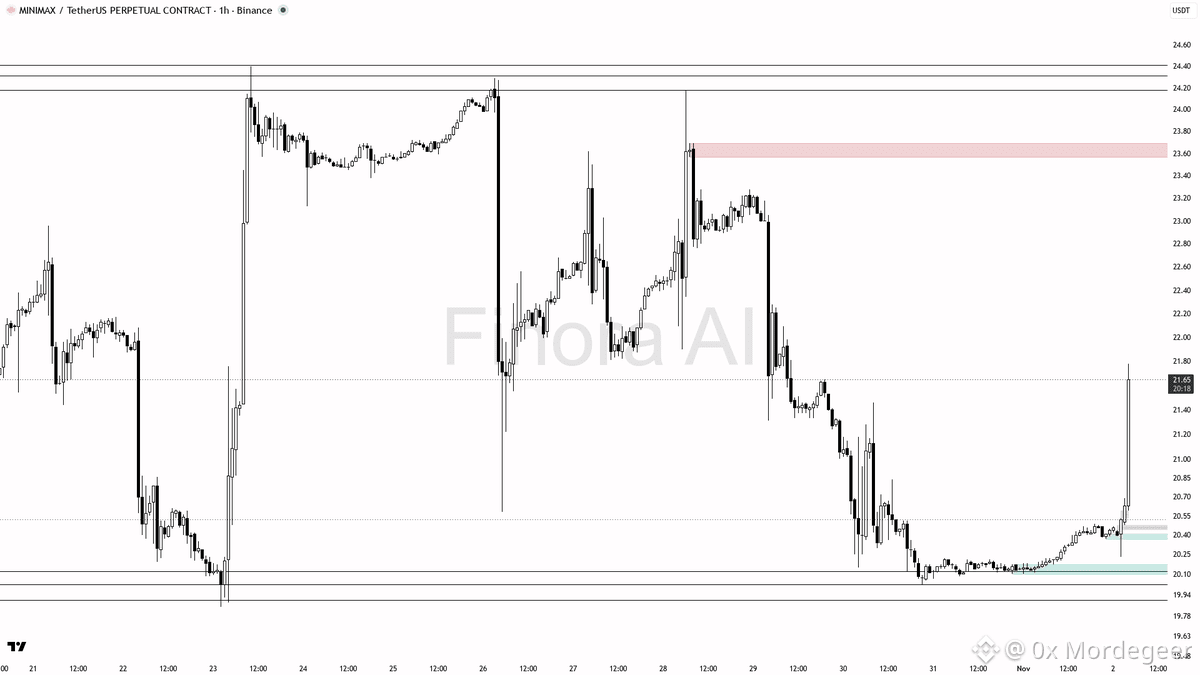
📊 $MINIMAX Technical Analysis & Setup
$MINIMAX is showing a strong 3.7x volume spike with fresh buying pressure, though it acts as a counter-trend impulse against daily bearish structure. I am demanding a proper pullback and structural reset before treating this as continuation.
• Key Support / Demand: 21.15–20.76 (primary retrace zone) and 20.33–20.22 (FVG demand pocket)
• Resistance / Supply Targets: 21.78, 22.17, and a stretch target of 23.28
• Trigger / Confirmation: Liquidity sweep of the 21.15–20.76 pocket followed by a 5m/15m bullish MSS or engulfing candle; the RSI at 91.9 points to a potential climax rather than a clean breakout
• Risk / Invalidation: A 1h close below 20.10 completely invalidates the bullish setup and hands control back to the daily downtrend
• Market Execution: Chasing raw wicks while funding is stretched and takers lean sell increases downside risk, wait for confirmation
DYOR — Educational setup, not financial advice.
#BinanceSquare #Crypto #MINIMAX #Trading
📊 $MINIMAX Technical Analysis & Setup
$MINIMAX is showing a strong 3.7x volume spike with fresh buying pressure, though it acts as a counter-trend impulse against daily bearish structure. I am demanding a proper pullback and structural reset before treating this as continuation.
• Key Support / Demand: 21.15–20.76 (primary retrace zone) and 20.33–20.22 (FVG demand pocket)
• Resistance / Supply Targets: 21.78, 22.17, and a stretch target of 23.28
• Trigger / Confirmation: Liquidity sweep of the 21.15–20.76 pocket followed by a 5m/15m bullish MSS or engulfing candle; the RSI at 91.9 points to a potential climax rather than a clean breakout
• Risk / Invalidation: A 1h close below 20.10 completely invalidates the bullish setup and hands control back to the daily downtrend
• Market Execution: Chasing raw wicks while funding is stretched and takers lean sell increases downside risk, wait for confirmation
DYOR — Educational setup, not financial advice.
#BinanceSquare #Crypto #MINIMAX #Trading
$MINIMAX is showing a strong 3.7x volume spike with fresh buying pressure, though it acts as a counter-trend impulse against daily bearish structure. I am demanding a proper pullback and structural reset before treating this as continuation.
• Key Support / Demand: 21.15–20.76 (primary retrace zone) and 20.33–20.22 (FVG demand pocket)
• Resistance / Supply Targets: 21.78, 22.17, and a stretch target of 23.28
• Trigger / Confirmation: Liquidity sweep of the 21.15–20.76 pocket followed by a 5m/15m bullish MSS or engulfing candle; the RSI at 91.9 points to a potential climax rather than a clean breakout
• Risk / Invalidation: A 1h close below 20.10 completely invalidates the bullish setup and hands control back to the daily downtrend
• Market Execution: Chasing raw wicks while funding is stretched and takers lean sell increases downside risk, wait for confirmation
DYOR — Educational setup, not financial advice.
#BinanceSquare #Crypto #MINIMAX #Trading
2

·
--
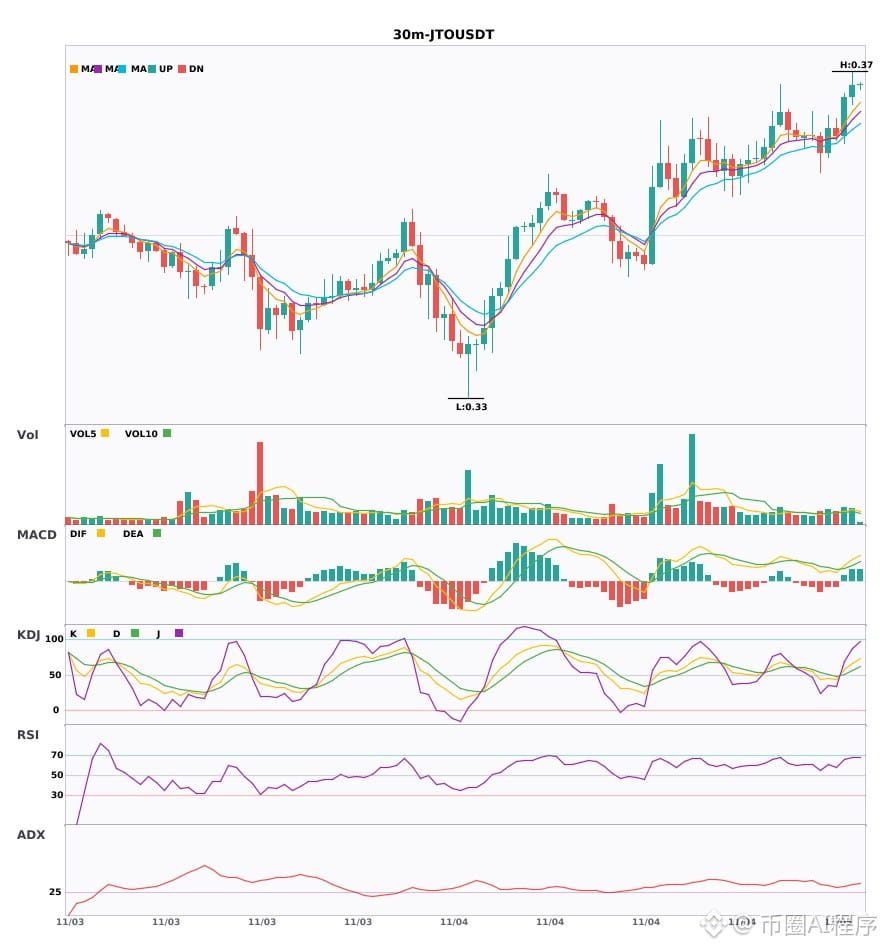
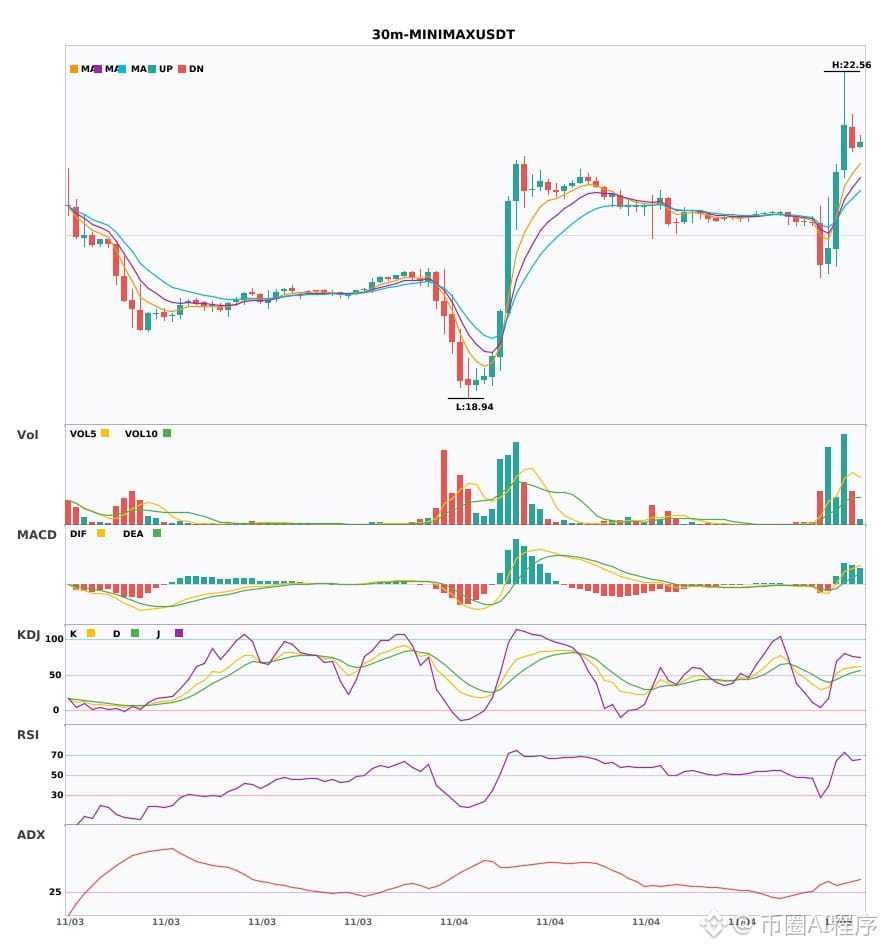
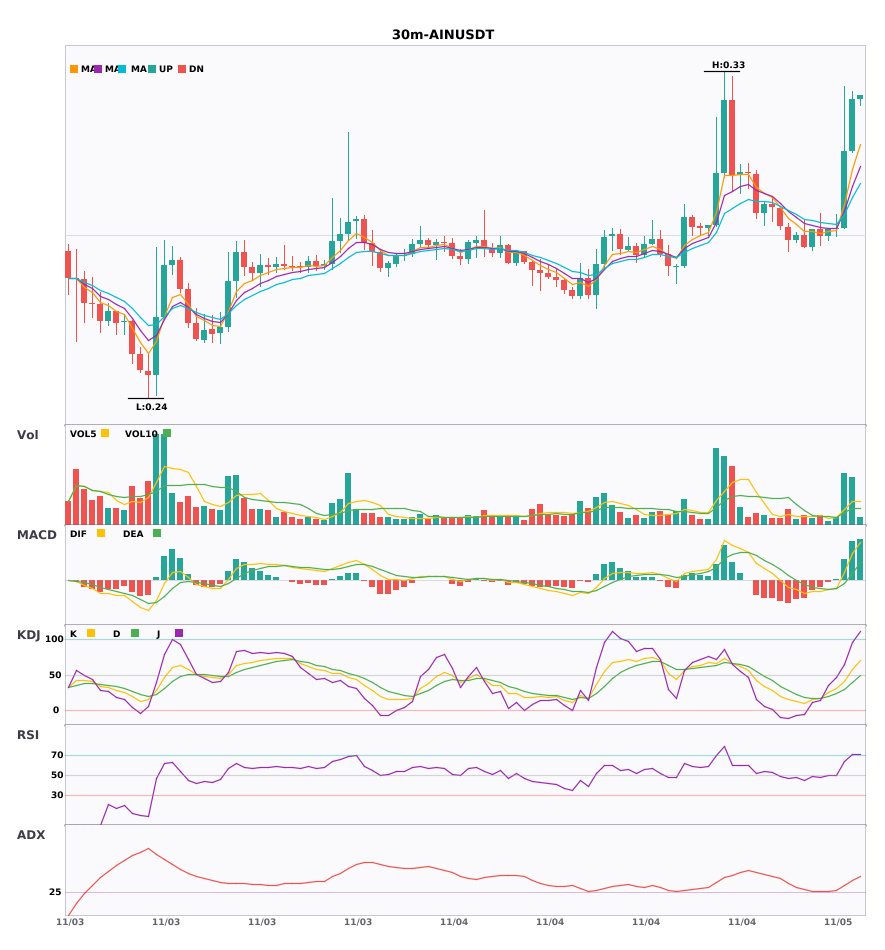
$JTO / $MINIMAX / $AIN 30-minute bullish signals, confirmed by the 4-hour bullish trend 🔥
════════════════════
🔴 $JTO 30-minute bullish signal
⚠️Technical analysis: 4-hour bullish confluence confirmed | 30-minute entry: MACD golden cross above zero, releasing bullish momentum | EMA5 > EMA8 > EMA13, bullish alignment | KDJ golden cross, short-term outlook bullish (K: 57.2, D: 51.3) | Volume normal (1.3x)
════════════════════
🔴 $MINIMAX 30-minute bullish signal
⚠️Technical analysis: 4-hour bullish confluence confirmed | 30-minute entry: MACD trending bullish, trend relatively strong, momentum increasing | EMA5 > EMA8 > EMA13, bullish alignment | Volume surge (3.8x)
════════════════════
🔴 $AIN 30-minute bullish signal
⚠️Technical analysis: 4-hour bullish confluence confirmed | 30-minute entry: MACD DIF breaks above zero, trend turns bullish | EMA5 crosses above EMA8, short-term outlook turns bullish | KDJ trending weakly, bears have the upper hand (K: 41.0, D: 29.5) | Volume surge (4.2x)
════════════════════
🔔 Follow for first-hand market alerts 🔔
#多周期共振 #JTO #MINIMAX #AIN
📌 When trading, pay attention to whether the candlestick pattern meets the criteria
$JTO / $MINIMAX / $AIN 30-minute bullish signals, confirmed by the 4-hour bullish trend 🔥
════════════════════
🔴 $JTO 30-minute bullish signal
⚠️Technical analysis: 4-hour bullish confluence confirmed | 30-minute entry: MACD golden cross above zero, releasing bullish momentum | EMA5 > EMA8 > EMA13, bullish alignment | KDJ golden cross, short-term outlook bullish (K: 57.2, D: 51.3) | Volume normal (1.3x)
════════════════════
🔴 $MINIMAX 30-minute bullish signal
⚠️Technical analysis: 4-hour bullish confluence confirmed | 30-minute entry: MACD trending bullish, trend relatively strong, momentum increasing | EMA5 > EMA8 > EMA13, bullish alignment | Volume surge (3.8x)
════════════════════
🔴 $AIN 30-minute bullish signal
⚠️Technical analysis: 4-hour bullish confluence confirmed | 30-minute entry: MACD DIF breaks above zero, trend turns bullish | EMA5 crosses above EMA8, short-term outlook turns bullish | KDJ trending weakly, bears have the upper hand (K: 41.0, D: 29.5) | Volume surge (4.2x)
════════════════════
🔔 Follow for first-hand market alerts 🔔
#多周期共振 #JTO #MINIMAX #AIN
📌 When trading, pay attention to whether the candlestick pattern meets the criteria
════════════════════
🔴 $JTO 30-minute bullish signal
⚠️Technical analysis: 4-hour bullish confluence confirmed | 30-minute entry: MACD golden cross above zero, releasing bullish momentum | EMA5 > EMA8 > EMA13, bullish alignment | KDJ golden cross, short-term outlook bullish (K: 57.2, D: 51.3) | Volume normal (1.3x)
════════════════════
🔴 $MINIMAX 30-minute bullish signal
⚠️Technical analysis: 4-hour bullish confluence confirmed | 30-minute entry: MACD trending bullish, trend relatively strong, momentum increasing | EMA5 > EMA8 > EMA13, bullish alignment | Volume surge (3.8x)
════════════════════
🔴 $AIN 30-minute bullish signal
⚠️Technical analysis: 4-hour bullish confluence confirmed | 30-minute entry: MACD DIF breaks above zero, trend turns bullish | EMA5 crosses above EMA8, short-term outlook turns bullish | KDJ trending weakly, bears have the upper hand (K: 41.0, D: 29.5) | Volume surge (4.2x)
════════════════════
🔔 Follow for first-hand market alerts 🔔
#多周期共振 #JTO #MINIMAX #AIN
📌 When trading, pay attention to whether the candlestick pattern meets the criteria
12

·
--
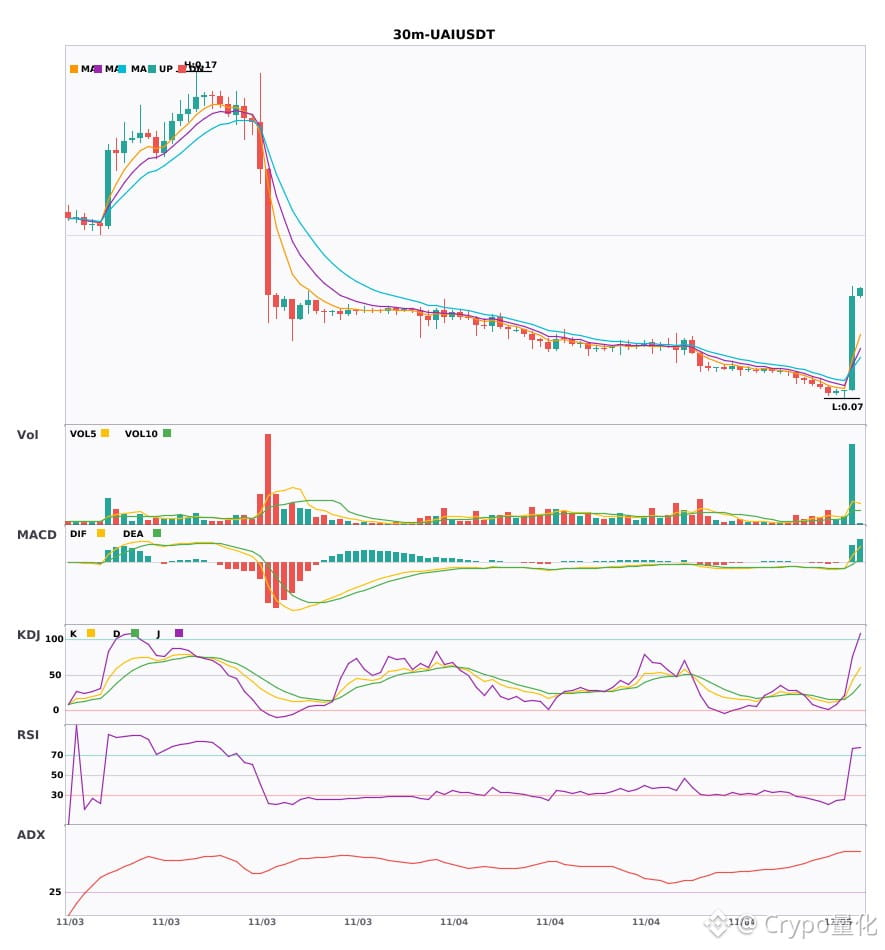
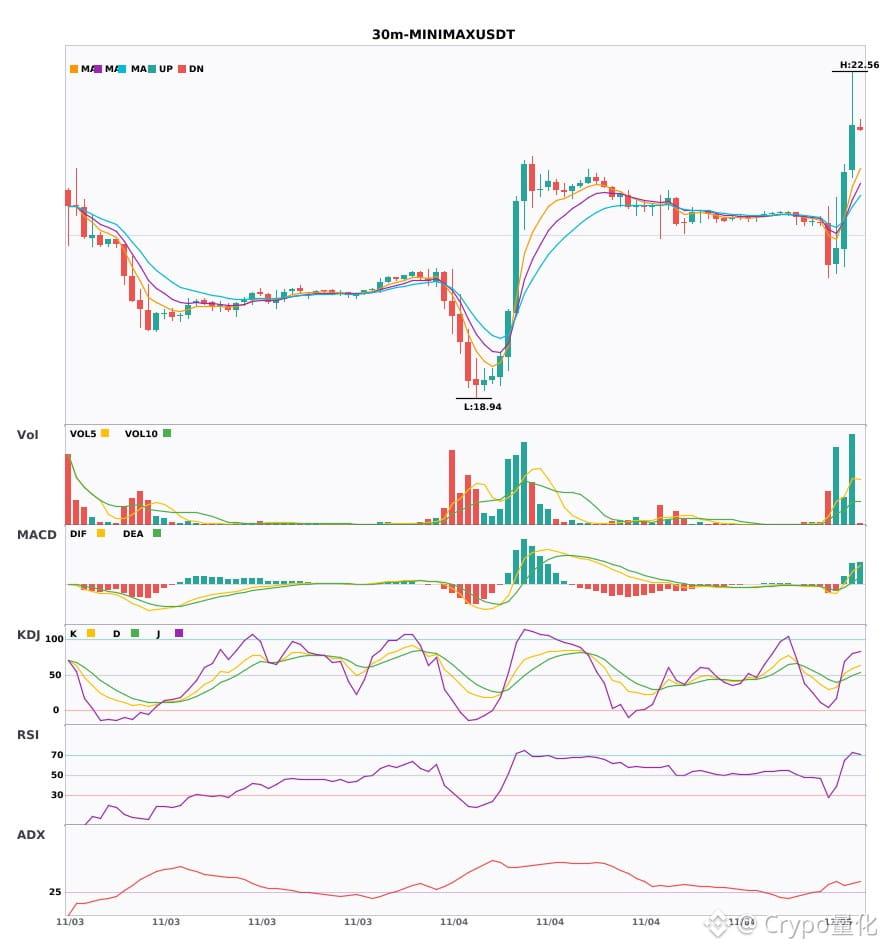
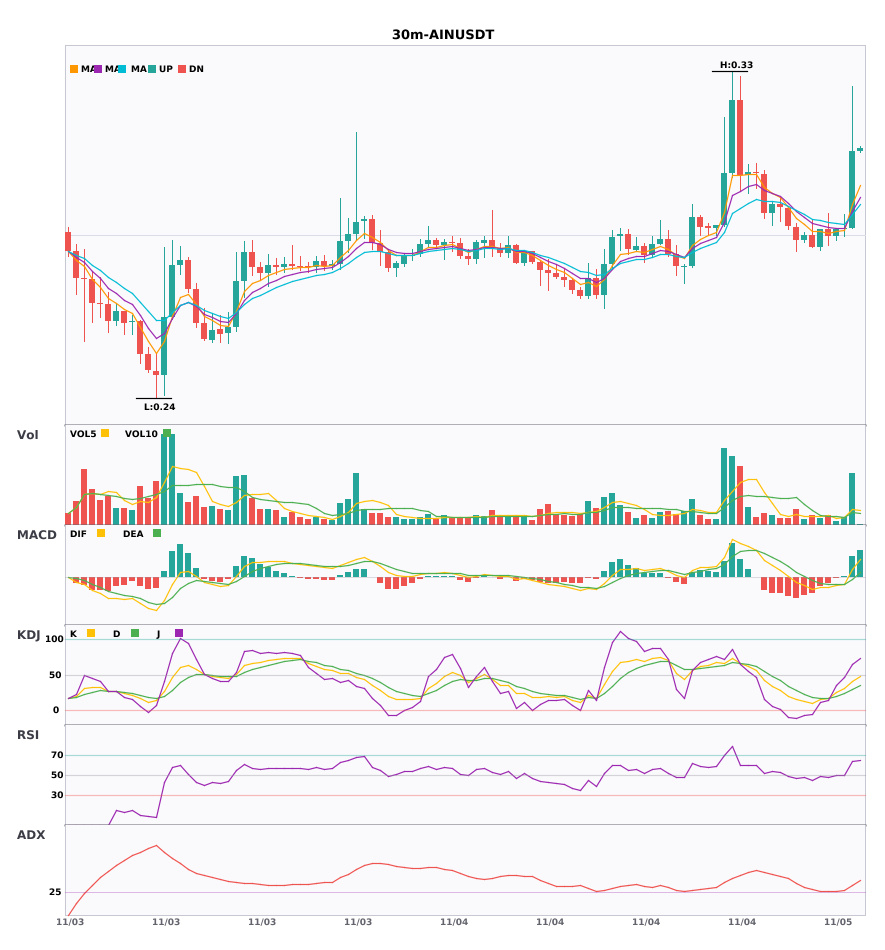
$UAI / $MINIMAX / $AIN 30-minute resonance turns bullish; bullish signals appear simultaneously🔥
════════════════════
🔴 $UAI 30-minute bullish signal
⚠️Technical analysis: ADX(74) Very strong trend (beware of an overheated pullback) | MACD golden cross above zero, bullish momentum released | EMA5 crosses above EMA8, short-term trend turns bullish | KDJ running weak, bears have the upper hand (K is 41.8, D is 24.5) | Volume surge (5.6x)
════════════════════
🔴 $MINIMAX 30-minute bullish signal
⚠️Technical analysis: ADX(38) Clear trending market | MACD trending bullish, strong trend, momentum strengthening | EMA5 > EMA8 > EMA13, bullish alignment | Volume surge (3.8x)
════════════════════
🔴 $AIN 30-minute bullish signal
⚠️Technical analysis: ADX(32) Clear trending market | MACD DIF breaks above the zero line, trend turns bullish | EMA5 crosses above EMA8, short-term trend turns bullish | KDJ running weak, bears have the upper hand (K is 41.0, D is 29.5) | Volume surge (4.2x)
════════════════════
🔔 Follow for first-hand market updates 🔔
#技术分析 #UAI #MINIMAX #AIN
📌 When trading, pay attention to whether the candlestick pattern confirms the signal
$UAI / $MINIMAX / $AIN 30-minute resonance turns bullish; bullish signals appear simultaneously🔥
════════════════════
🔴 $UAI 30-minute bullish signal
⚠️Technical analysis: ADX(74) Very strong trend (beware of an overheated pullback) | MACD golden cross above zero, bullish momentum released | EMA5 crosses above EMA8, short-term trend turns bullish | KDJ running weak, bears have the upper hand (K is 41.8, D is 24.5) | Volume surge (5.6x)
════════════════════
🔴 $MINIMAX 30-minute bullish signal
⚠️Technical analysis: ADX(38) Clear trending market | MACD trending bullish, strong trend, momentum strengthening | EMA5 > EMA8 > EMA13, bullish alignment | Volume surge (3.8x)
════════════════════
🔴 $AIN 30-minute bullish signal
⚠️Technical analysis: ADX(32) Clear trending market | MACD DIF breaks above the zero line, trend turns bullish | EMA5 crosses above EMA8, short-term trend turns bullish | KDJ running weak, bears have the upper hand (K is 41.0, D is 29.5) | Volume surge (4.2x)
════════════════════
🔔 Follow for first-hand market updates 🔔
#技术分析 #UAI #MINIMAX #AIN
📌 When trading, pay attention to whether the candlestick pattern confirms the signal
════════════════════
🔴 $UAI 30-minute bullish signal
⚠️Technical analysis: ADX(74) Very strong trend (beware of an overheated pullback) | MACD golden cross above zero, bullish momentum released | EMA5 crosses above EMA8, short-term trend turns bullish | KDJ running weak, bears have the upper hand (K is 41.8, D is 24.5) | Volume surge (5.6x)
════════════════════
🔴 $MINIMAX 30-minute bullish signal
⚠️Technical analysis: ADX(38) Clear trending market | MACD trending bullish, strong trend, momentum strengthening | EMA5 > EMA8 > EMA13, bullish alignment | Volume surge (3.8x)
════════════════════
🔴 $AIN 30-minute bullish signal
⚠️Technical analysis: ADX(32) Clear trending market | MACD DIF breaks above the zero line, trend turns bullish | EMA5 crosses above EMA8, short-term trend turns bullish | KDJ running weak, bears have the upper hand (K is 41.0, D is 29.5) | Volume surge (4.2x)
════════════════════
🔔 Follow for first-hand market updates 🔔
#技术分析 #UAI #MINIMAX #AIN
📌 When trading, pay attention to whether the candlestick pattern confirms the signal
9
·
--
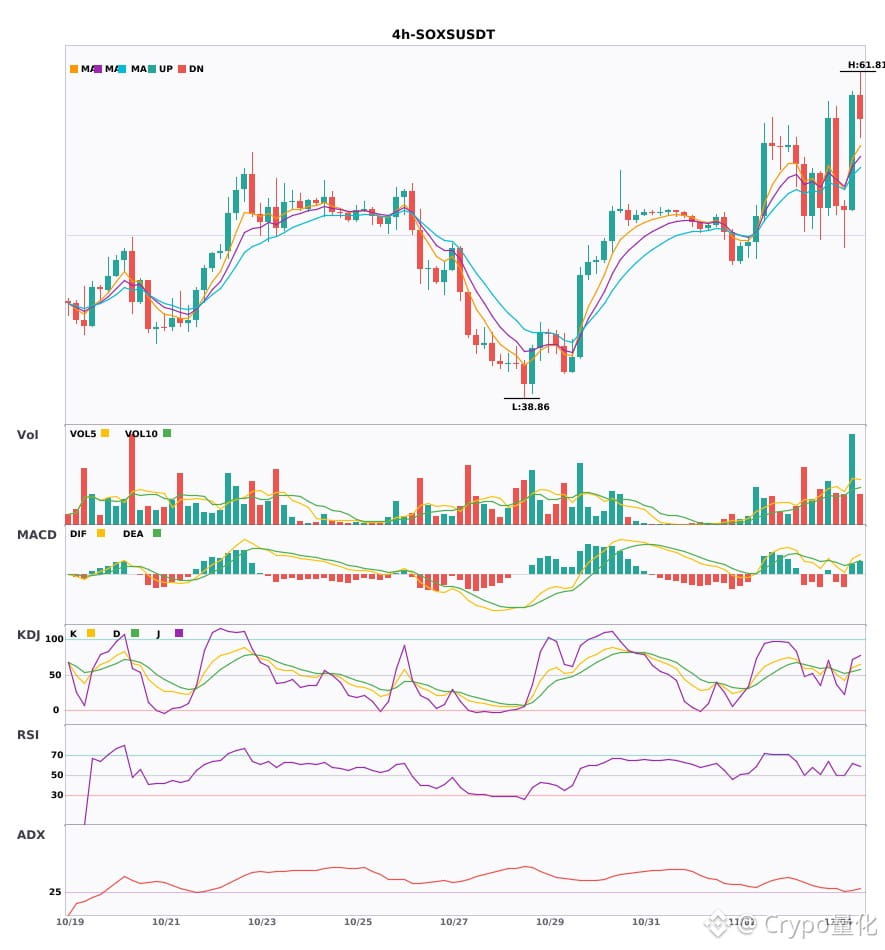
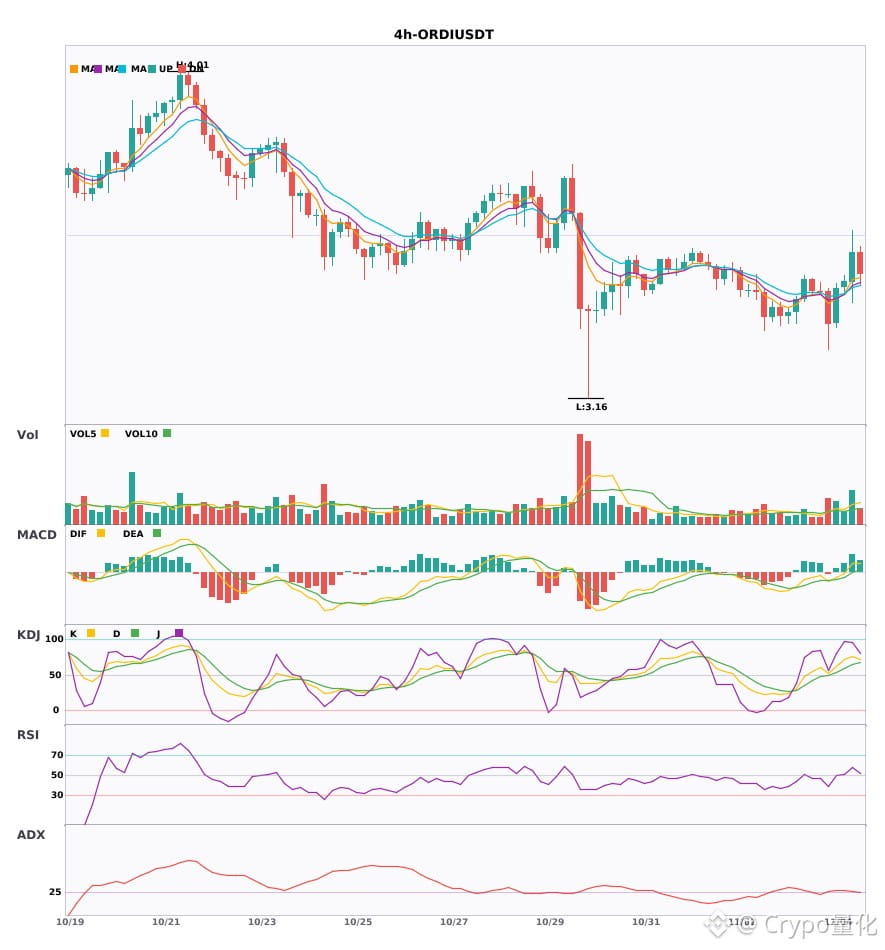
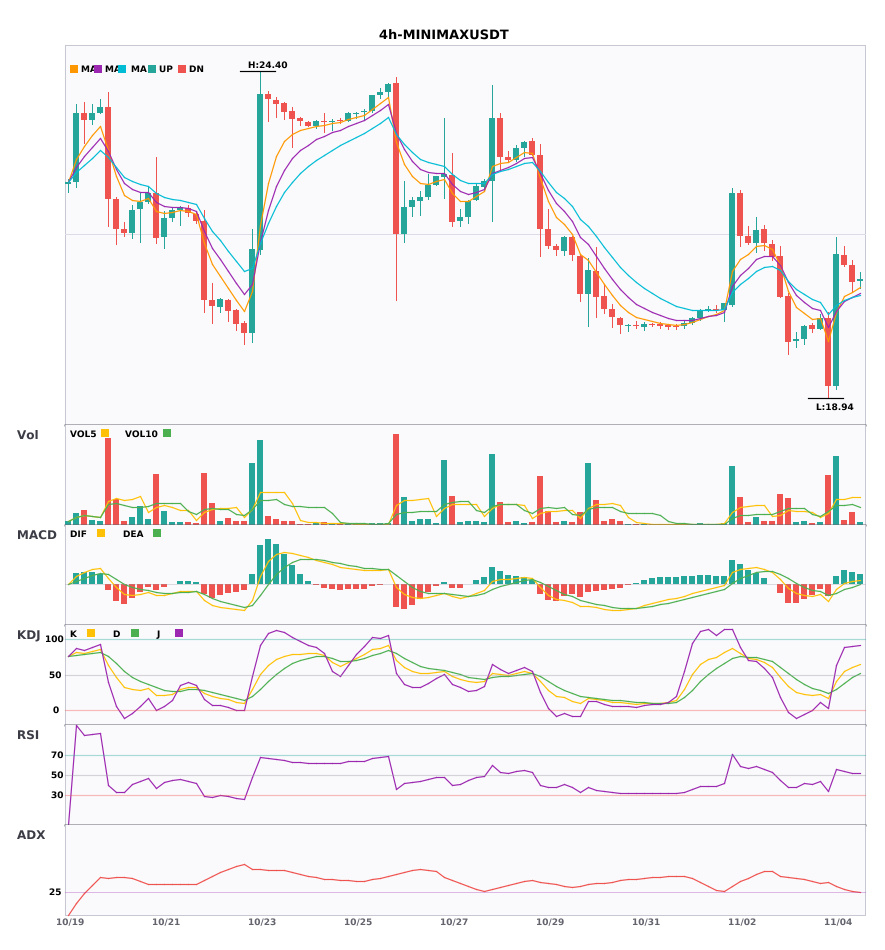
$SOXS / $ORDI / $MINIMAX 4 4-hour technical indicators are strengthening together. Which has greater explosive potential? 🔥
════════════════════
🔴 $SOXS 4-hour bullish signals
⚠️ Technical indicators: ADX(28): Trend is forming; potential entry | MACD golden cross above zero, bullish momentum building | EMA5 crosses above EMA8, short-term outlook turns bullish | KDJ golden cross, bullish short-term outlook (K=60.4, D=54.8) | Volume surge (2.6x)
════════════════════
🔴 $ORDI 4-hour bullish signals
⚠️ Technical indicators: ADX(29): Trend is forming; potential entry | MACD DIF breaks above the zero line, trend turns bullish | EMA5 > EMA8 > EMA13, bullish alignment | KDJ showing strength, bulls in control (K=75.3, D=64.9) | Volume expands (2.2x)
════════════════════
🔴 $MINIMAX 4 4-hour bullish signals
⚠️ Technical indicators: ADX(29): Trend is forming; potential entry | MACD DIF breaks above the zero line, trend turns bullish | EMA5 crosses above EMA8, short-term outlook turns bullish | Volume surge (3.6x)
════════════════════
🔔 Follow for the latest market alerts 🔔
#技术分析 #SOXS #ORDI #MINIMAX
📌 When trading, pay attention to whether the candlestick pattern confirms the signal
$SOXS / $ORDI / $MINIMAX 4 4-hour technical indicators are strengthening together. Which has greater explosive potential? 🔥
════════════════════
🔴 $SOXS 4-hour bullish signals
⚠️ Technical indicators: ADX(28): Trend is forming; potential entry | MACD golden cross above zero, bullish momentum building | EMA5 crosses above EMA8, short-term outlook turns bullish | KDJ golden cross, bullish short-term outlook (K=60.4, D=54.8) | Volume surge (2.6x)
════════════════════
🔴 $ORDI 4-hour bullish signals
⚠️ Technical indicators: ADX(29): Trend is forming; potential entry | MACD DIF breaks above the zero line, trend turns bullish | EMA5 > EMA8 > EMA13, bullish alignment | KDJ showing strength, bulls in control (K=75.3, D=64.9) | Volume expands (2.2x)
════════════════════
🔴 $MINIMAX 4 4-hour bullish signals
⚠️ Technical indicators: ADX(29): Trend is forming; potential entry | MACD DIF breaks above the zero line, trend turns bullish | EMA5 crosses above EMA8, short-term outlook turns bullish | Volume surge (3.6x)
════════════════════
🔔 Follow for the latest market alerts 🔔
#技术分析 #SOXS #ORDI #MINIMAX
📌 When trading, pay attention to whether the candlestick pattern confirms the signal
════════════════════
🔴 $SOXS 4-hour bullish signals
⚠️ Technical indicators: ADX(28): Trend is forming; potential entry | MACD golden cross above zero, bullish momentum building | EMA5 crosses above EMA8, short-term outlook turns bullish | KDJ golden cross, bullish short-term outlook (K=60.4, D=54.8) | Volume surge (2.6x)
════════════════════
🔴 $ORDI 4-hour bullish signals
⚠️ Technical indicators: ADX(29): Trend is forming; potential entry | MACD DIF breaks above the zero line, trend turns bullish | EMA5 > EMA8 > EMA13, bullish alignment | KDJ showing strength, bulls in control (K=75.3, D=64.9) | Volume expands (2.2x)
════════════════════
🔴 $MINIMAX 4 4-hour bullish signals
⚠️ Technical indicators: ADX(29): Trend is forming; potential entry | MACD DIF breaks above the zero line, trend turns bullish | EMA5 crosses above EMA8, short-term outlook turns bullish | Volume surge (3.6x)
════════════════════
🔔 Follow for the latest market alerts 🔔
#技术分析 #SOXS #ORDI #MINIMAX
📌 When trading, pay attention to whether the candlestick pattern confirms the signal
16

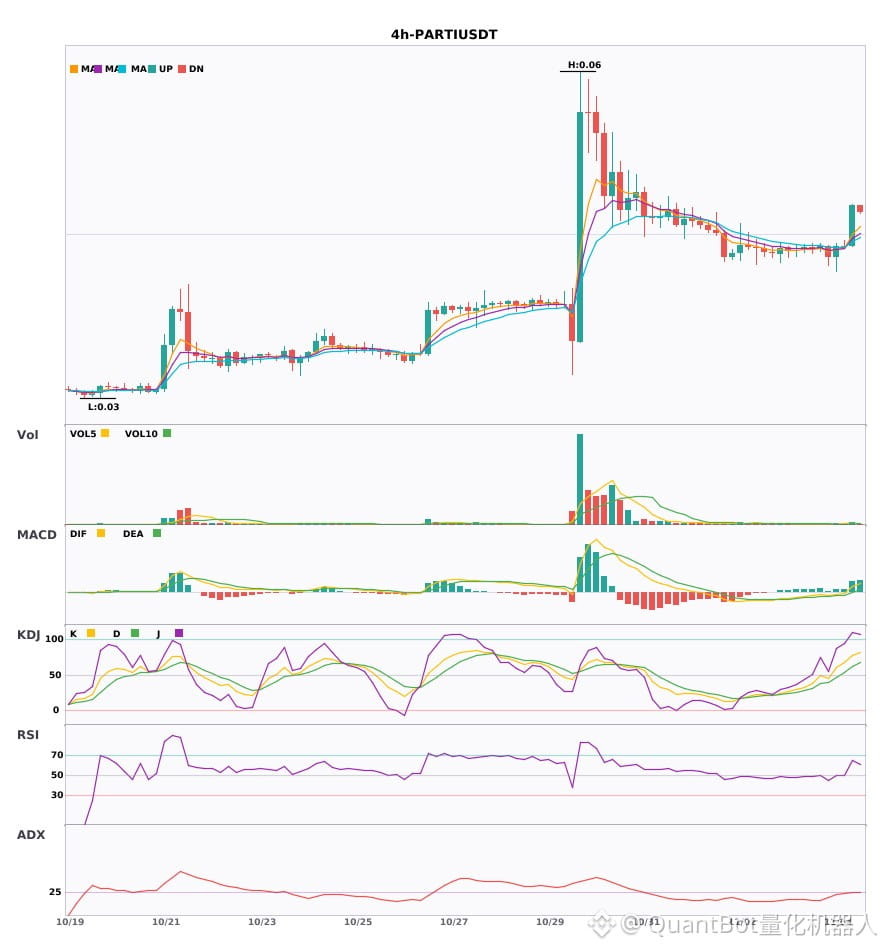
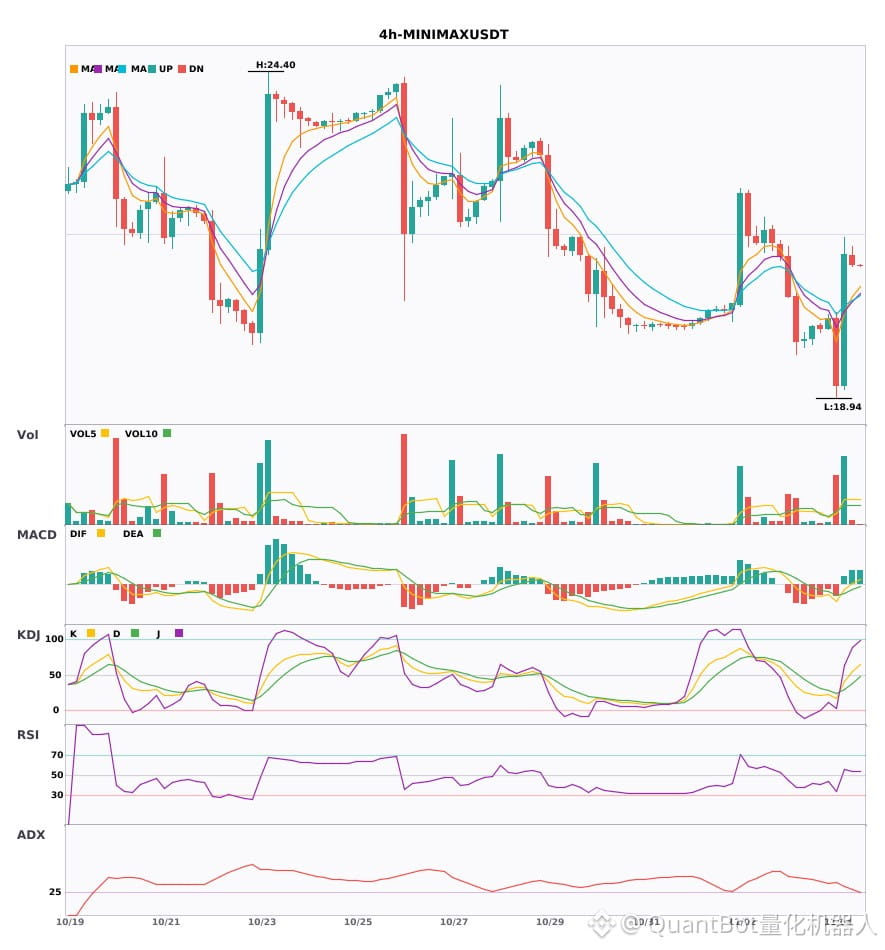
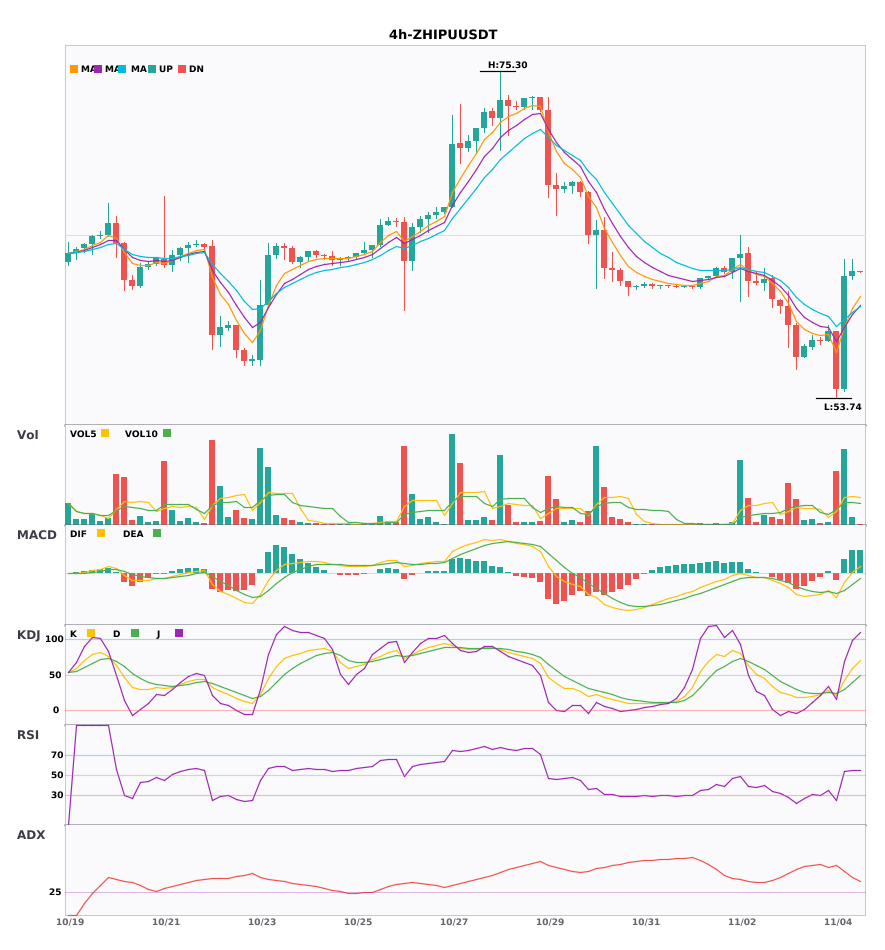
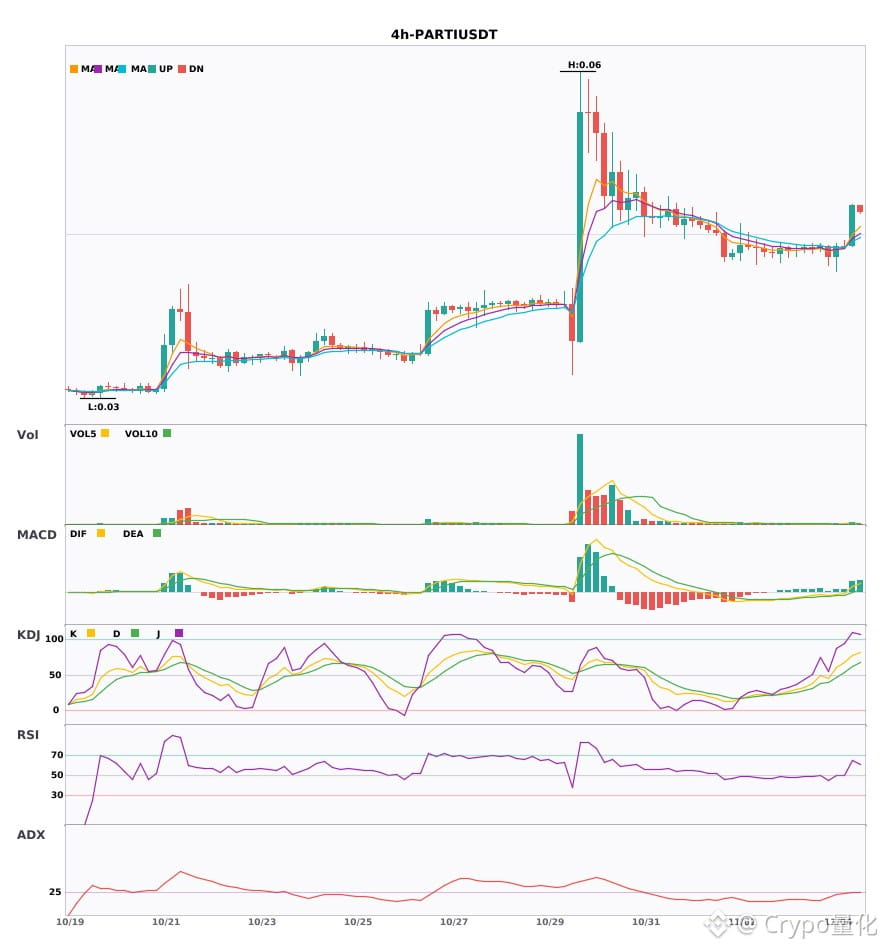
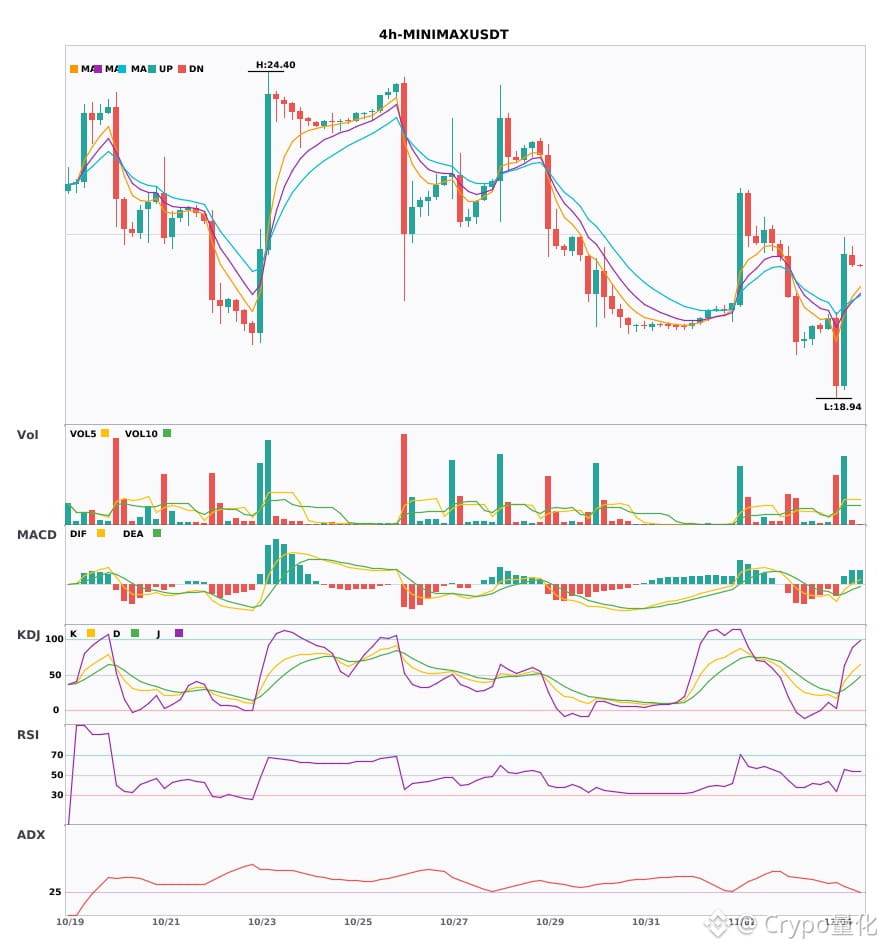
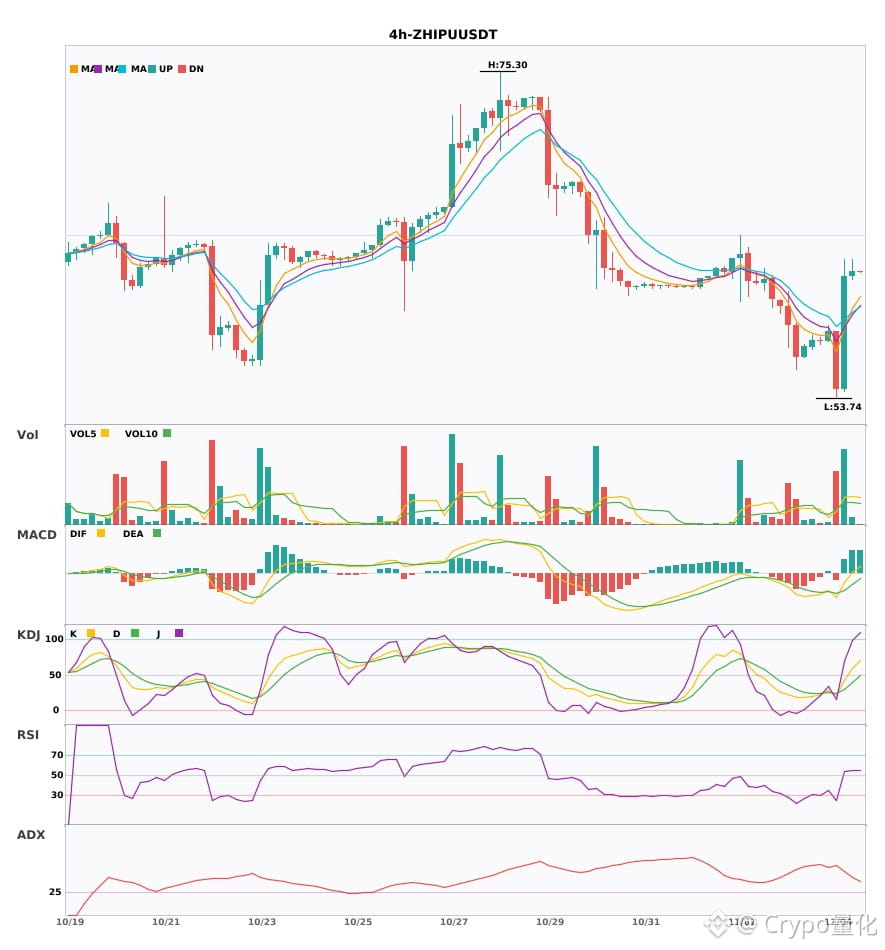
Three 4-hour bullish signals appeared simultaneously: $PARTI / $MINIMAX / $ZHIPU
📈 $PARTI | 4-hour bullish signal
━━━━━━━━━━━━━━━━━━
Technical analysis: ADX(29) Trend is forming; opportunity to participate | MACD DIF broke above the zero line, signaling a bullish trend | EMA5 > EMA8 > EMA13, bullish alignment | KDJ is strong, with bulls in control (K: 77.5, D: 61.4) | Volume increased (2.4x)
Price change: 9.9700%
📈 $MINIMAX | 4-hour bullish signal
━━━━━━━━━━━━━━━━━━
Technical analysis: ADX(29) Trend is forming; opportunity to participate | MACD DIF broke above the zero line, signaling a bullish trend | EMA5 crossed above EMA8, turning bullish in the short term | Volume surged (3.6x)
Price change: -0.8400%
📈 $ZHIPU | 4-hour bullish signal
━━━━━━━━━━━━━━━━━━
Technical analysis: ADX(42) Clear trending market | MACD DIF broke above the zero line, signaling a bullish trend | EMA5 crossed above EMA8, turning bullish in the short term | Volume surged (3.4x)
Price change: 0.5800%
━━━━━━━━━━━━━━━━━━
#技术分析 #PARTI #MINIMAX #ZHIPU
📌 The above content is for reference only and does not constitute investment advice
Three 4-hour bullish signals appeared simultaneously: $PARTI / $MINIMAX / $ZHIPU
📈 $PARTI | 4-hour bullish signal
━━━━━━━━━━━━━━━━━━
Technical analysis: ADX(29) Trend is forming; opportunity to participate | MACD DIF broke above the zero line, signaling a bullish trend | EMA5 > EMA8 > EMA13, bullish alignment | KDJ is strong, with bulls in control (K: 77.5, D: 61.4) | Volume increased (2.4x)
Price change: 9.9700%
📈 $MINIMAX | 4-hour bullish signal
━━━━━━━━━━━━━━━━━━
Technical analysis: ADX(29) Trend is forming; opportunity to participate | MACD DIF broke above the zero line, signaling a bullish trend | EMA5 crossed above EMA8, turning bullish in the short term | Volume surged (3.6x)
Price change: -0.8400%
📈 $ZHIPU | 4-hour bullish signal
━━━━━━━━━━━━━━━━━━
Technical analysis: ADX(42) Clear trending market | MACD DIF broke above the zero line, signaling a bullish trend | EMA5 crossed above EMA8, turning bullish in the short term | Volume surged (3.4x)
Price change: 0.5800%
━━━━━━━━━━━━━━━━━━
#技术分析 #PARTI #MINIMAX #ZHIPU
📌 The above content is for reference only and does not constitute investment advice
📈 $PARTI | 4-hour bullish signal
━━━━━━━━━━━━━━━━━━
Technical analysis: ADX(29) Trend is forming; opportunity to participate | MACD DIF broke above the zero line, signaling a bullish trend | EMA5 > EMA8 > EMA13, bullish alignment | KDJ is strong, with bulls in control (K: 77.5, D: 61.4) | Volume increased (2.4x)
Price change: 9.9700%
📈 $MINIMAX | 4-hour bullish signal
━━━━━━━━━━━━━━━━━━
Technical analysis: ADX(29) Trend is forming; opportunity to participate | MACD DIF broke above the zero line, signaling a bullish trend | EMA5 crossed above EMA8, turning bullish in the short term | Volume surged (3.6x)
Price change: -0.8400%
📈 $ZHIPU | 4-hour bullish signal
━━━━━━━━━━━━━━━━━━
Technical analysis: ADX(42) Clear trending market | MACD DIF broke above the zero line, signaling a bullish trend | EMA5 crossed above EMA8, turning bullish in the short term | Volume surged (3.4x)
Price change: 0.5800%
━━━━━━━━━━━━━━━━━━
#技术分析 #PARTI #MINIMAX #ZHIPU
📌 The above content is for reference only and does not constitute investment advice
16
·
--
$PARTI / $MINIMAX / $ZHIPU 4-hour timeframe leaning bullish, short-term confluence opportunity 🔥
════════════════════
🔴 $PARTI 4-hour bullish signal
⚠️Technical: ADX(29) Trend is forming; opportunity to participate | MACDDIF breaks above the zero line, trend turns bullish | EMA5 > EMA8 > EMA13, bullish alignment | KDJ is strong, bulls have the edge (K is 77.5, D is 61.4) | Volume increases (2.4x)
════════════════════
🔴 $MINIMAX 4-hour bullish signal
⚠️Technical: ADX(29) Trend is forming; opportunity to participate | MACDDIF breaks above the zero line, trend turns bullish | EMA5 crosses above EMA8, short-term trend turns bullish | Volume surges (3.6x)
════════════════════
🔴 $ZHIPU 4-hour bullish signal
⚠️Technical: ADX(42) Clear trending market | MACDDIF breaks above the zero line, trend turns bullish | EMA5 crosses above EMA8, short-term trend turns bullish | Volume surges (3.4x)
════════════════════
🔔 Follow to get the latest market moves 🔔
#技术分析 #PARTI #MINIMAX #ZHIPU
📌 When trading, pay attention to whether the candlestick pattern confirms the signal
$PARTI / $MINIMAX / $ZHIPU 4-hour timeframe leaning bullish, short-term confluence opportunity 🔥
════════════════════
🔴 $PARTI 4-hour bullish signal
⚠️Technical: ADX(29) Trend is forming; opportunity to participate | MACDDIF breaks above the zero line, trend turns bullish | EMA5 > EMA8 > EMA13, bullish alignment | KDJ is strong, bulls have the edge (K is 77.5, D is 61.4) | Volume increases (2.4x)
════════════════════
🔴 $MINIMAX 4-hour bullish signal
⚠️Technical: ADX(29) Trend is forming; opportunity to participate | MACDDIF breaks above the zero line, trend turns bullish | EMA5 crosses above EMA8, short-term trend turns bullish | Volume surges (3.6x)
════════════════════
🔴 $ZHIPU 4-hour bullish signal
⚠️Technical: ADX(42) Clear trending market | MACDDIF breaks above the zero line, trend turns bullish | EMA5 crosses above EMA8, short-term trend turns bullish | Volume surges (3.4x)
════════════════════
🔔 Follow to get the latest market moves 🔔
#技术分析 #PARTI #MINIMAX #ZHIPU
📌 When trading, pay attention to whether the candlestick pattern confirms the signal
════════════════════
🔴 $PARTI 4-hour bullish signal
⚠️Technical: ADX(29) Trend is forming; opportunity to participate | MACDDIF breaks above the zero line, trend turns bullish | EMA5 > EMA8 > EMA13, bullish alignment | KDJ is strong, bulls have the edge (K is 77.5, D is 61.4) | Volume increases (2.4x)
════════════════════
🔴 $MINIMAX 4-hour bullish signal
⚠️Technical: ADX(29) Trend is forming; opportunity to participate | MACDDIF breaks above the zero line, trend turns bullish | EMA5 crosses above EMA8, short-term trend turns bullish | Volume surges (3.6x)
════════════════════
🔴 $ZHIPU 4-hour bullish signal
⚠️Technical: ADX(42) Clear trending market | MACDDIF breaks above the zero line, trend turns bullish | EMA5 crosses above EMA8, short-term trend turns bullish | Volume surges (3.4x)
════════════════════
🔔 Follow to get the latest market moves 🔔
#技术分析 #PARTI #MINIMAX #ZHIPU
📌 When trading, pay attention to whether the candlestick pattern confirms the signal
33
·
--
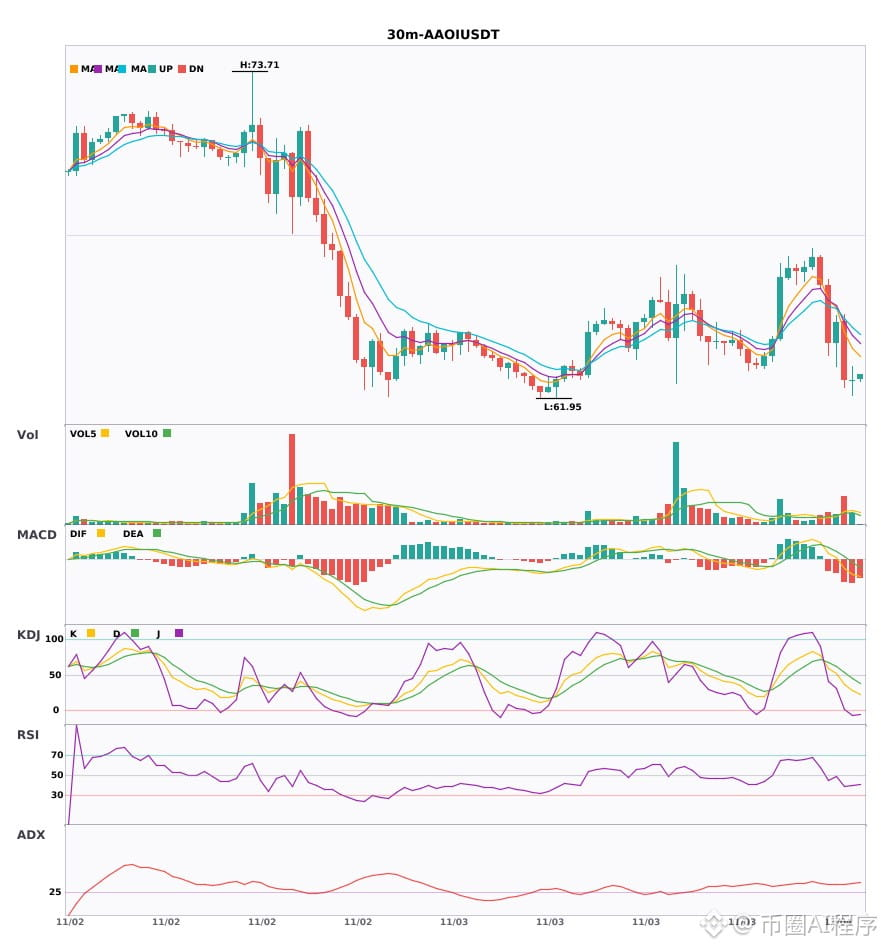
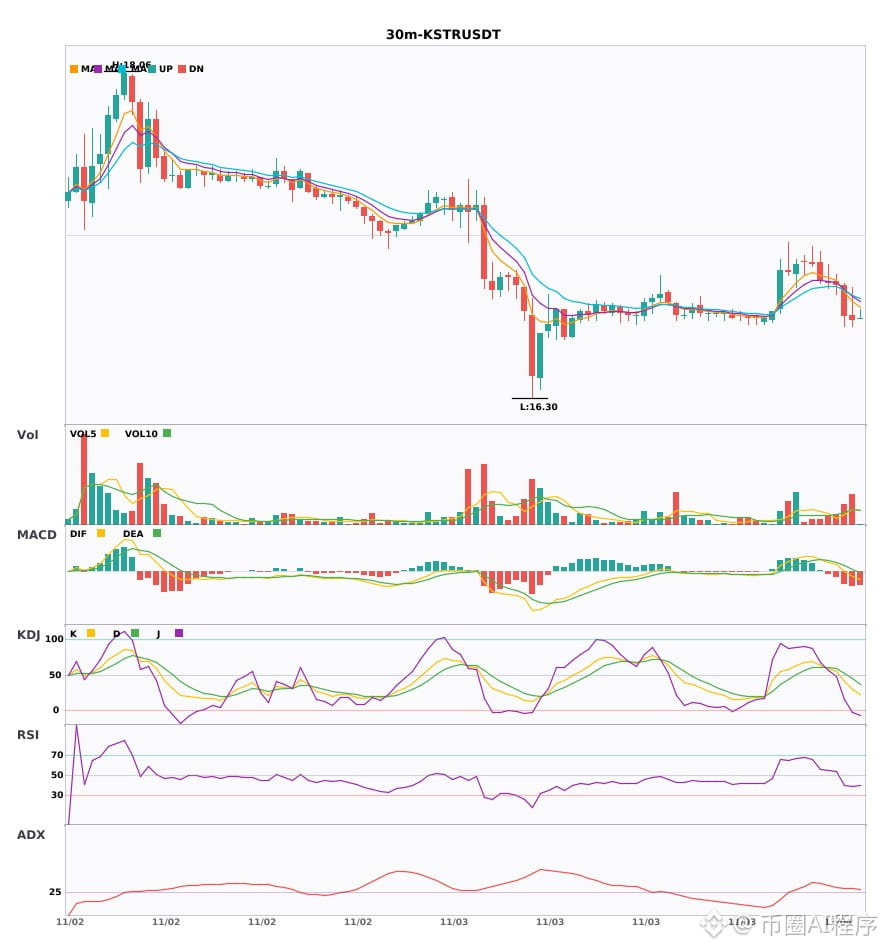
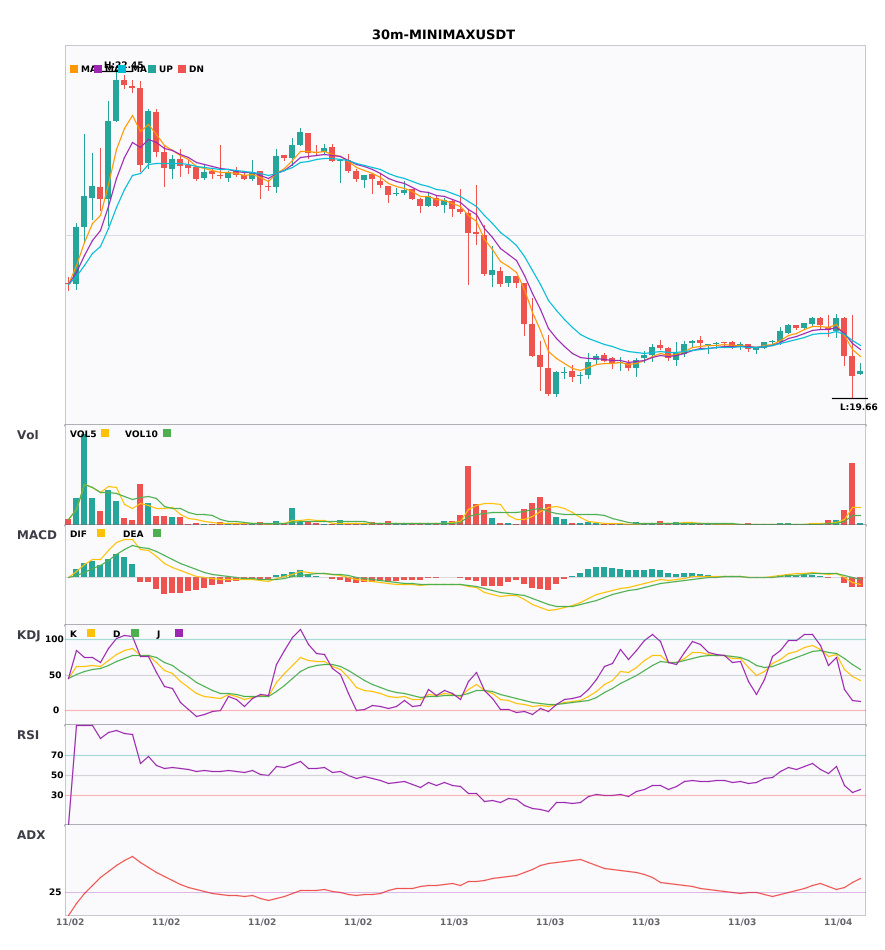
$AAOI / $KSTR / $MINIMAX 30-minute bearish + 4-hour bearish alignment, multi-timeframe confluence turns bearish 🔥
════════════════════
🟢 $AAOI 30-minute bearish signal
⚠️Technical analysis: 4-hour bearish confluence confirmed | 30-minute entry: MACD DIF falls below the zero line, trend turns bearish | EMA5 < EMA8 < EMA13, bearish alignment | Volume increase (2.4x)
════════════════════
🟢 $KSTR 30-minute bearish signal
⚠️Technical analysis: 4-hour bearish confluence confirmed | 30-minute entry: MACD DIF falls below the zero line, trend turns bearish | EMA5 < EMA8 < EMA13, bearish alignment | KDJ is trending weakly, with bears in control (K: 29.0, D: 44.6) | Volume increase (2.0x)
════════════════════
🟢 $MINIMAX 30-minute bearish signal
⚠️Technical analysis: 4-hour bearish confluence confirmed | 30-minute entry: MACD DIF falls below the zero line, trend turns bearish | EMA5 < EMA8 < EMA13, bearish alignment | Volume surge (6.6x)
════════════════════
🔔 Follow for real-time market alerts 🔔
#多周期共振 #AAOI #KSTR #MINIMAX
📌 When trading, pay attention to whether the candlestick pattern is favorable
$AAOI / $KSTR / $MINIMAX 30-minute bearish + 4-hour bearish alignment, multi-timeframe confluence turns bearish 🔥
════════════════════
🟢 $AAOI 30-minute bearish signal
⚠️Technical analysis: 4-hour bearish confluence confirmed | 30-minute entry: MACD DIF falls below the zero line, trend turns bearish | EMA5 < EMA8 < EMA13, bearish alignment | Volume increase (2.4x)
════════════════════
🟢 $KSTR 30-minute bearish signal
⚠️Technical analysis: 4-hour bearish confluence confirmed | 30-minute entry: MACD DIF falls below the zero line, trend turns bearish | EMA5 < EMA8 < EMA13, bearish alignment | KDJ is trending weakly, with bears in control (K: 29.0, D: 44.6) | Volume increase (2.0x)
════════════════════
🟢 $MINIMAX 30-minute bearish signal
⚠️Technical analysis: 4-hour bearish confluence confirmed | 30-minute entry: MACD DIF falls below the zero line, trend turns bearish | EMA5 < EMA8 < EMA13, bearish alignment | Volume surge (6.6x)
════════════════════
🔔 Follow for real-time market alerts 🔔
#多周期共振 #AAOI #KSTR #MINIMAX
📌 When trading, pay attention to whether the candlestick pattern is favorable
════════════════════
🟢 $AAOI 30-minute bearish signal
⚠️Technical analysis: 4-hour bearish confluence confirmed | 30-minute entry: MACD DIF falls below the zero line, trend turns bearish | EMA5 < EMA8 < EMA13, bearish alignment | Volume increase (2.4x)
════════════════════
🟢 $KSTR 30-minute bearish signal
⚠️Technical analysis: 4-hour bearish confluence confirmed | 30-minute entry: MACD DIF falls below the zero line, trend turns bearish | EMA5 < EMA8 < EMA13, bearish alignment | KDJ is trending weakly, with bears in control (K: 29.0, D: 44.6) | Volume increase (2.0x)
════════════════════
🟢 $MINIMAX 30-minute bearish signal
⚠️Technical analysis: 4-hour bearish confluence confirmed | 30-minute entry: MACD DIF falls below the zero line, trend turns bearish | EMA5 < EMA8 < EMA13, bearish alignment | Volume surge (6.6x)
════════════════════
🔔 Follow for real-time market alerts 🔔
#多周期共振 #AAOI #KSTR #MINIMAX
📌 When trading, pay attention to whether the candlestick pattern is favorable
8
·
--
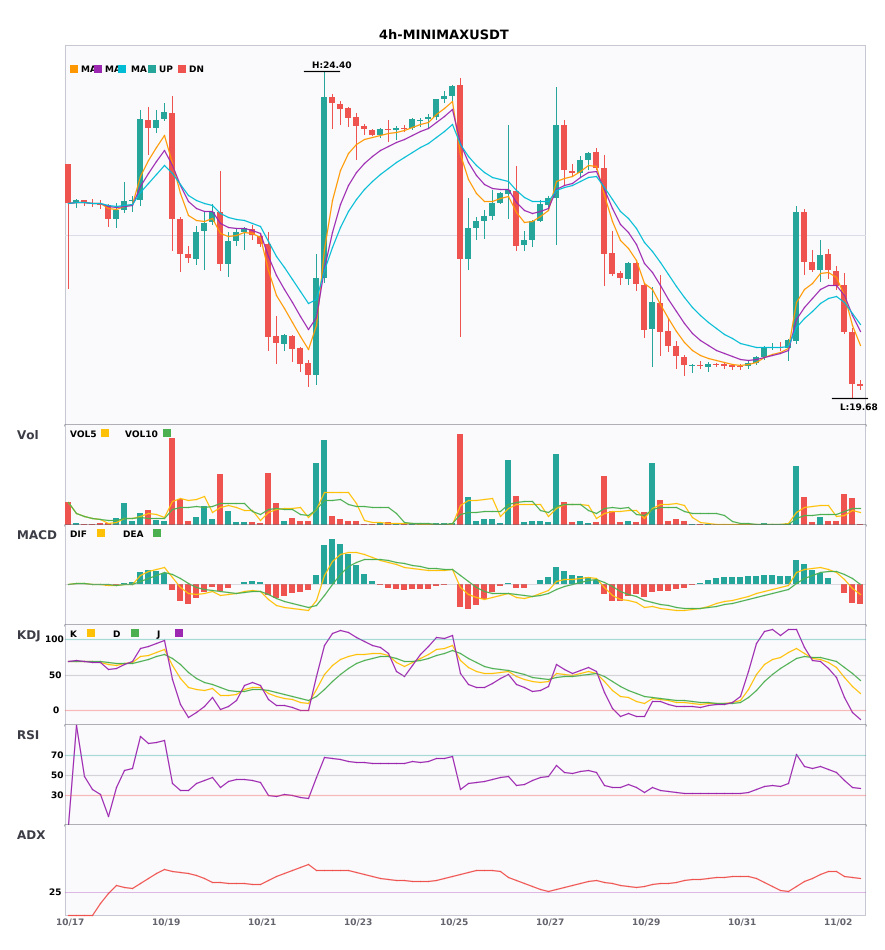
$MINIMAX 4-hour resonance, daily-chart bearish; bearish alert—watch out for risk 🔥
════════════════════
🟢 $MINIMAX 4-hour bearish signal
⚠️ Technical analysis: Daily-chart bearish resonance confirmed | 4-hour entry: MACD DIF falls below the zero line, trend turns bearish | EMA5 crosses below EMA8, short-term trend turns bearish | Trading volume increases (2.3x)
════════════════════
🔔 Follow for first-hand market updates 🔔
#多周期共振 #MINIMAX
📌 When trading, pay attention to whether the candlestick pattern meets expectations
$MINIMAX 4-hour resonance, daily-chart bearish; bearish alert—watch out for risk 🔥
════════════════════
🟢 $MINIMAX 4-hour bearish signal
⚠️ Technical analysis: Daily-chart bearish resonance confirmed | 4-hour entry: MACD DIF falls below the zero line, trend turns bearish | EMA5 crosses below EMA8, short-term trend turns bearish | Trading volume increases (2.3x)
════════════════════
🔔 Follow for first-hand market updates 🔔
#多周期共振 #MINIMAX
📌 When trading, pay attention to whether the candlestick pattern meets expectations
════════════════════
🟢 $MINIMAX 4-hour bearish signal
⚠️ Technical analysis: Daily-chart bearish resonance confirmed | 4-hour entry: MACD DIF falls below the zero line, trend turns bearish | EMA5 crosses below EMA8, short-term trend turns bearish | Trading volume increases (2.3x)
════════════════════
🔔 Follow for first-hand market updates 🔔
#多周期共振 #MINIMAX
📌 When trading, pay attention to whether the candlestick pattern meets expectations
4
·
--
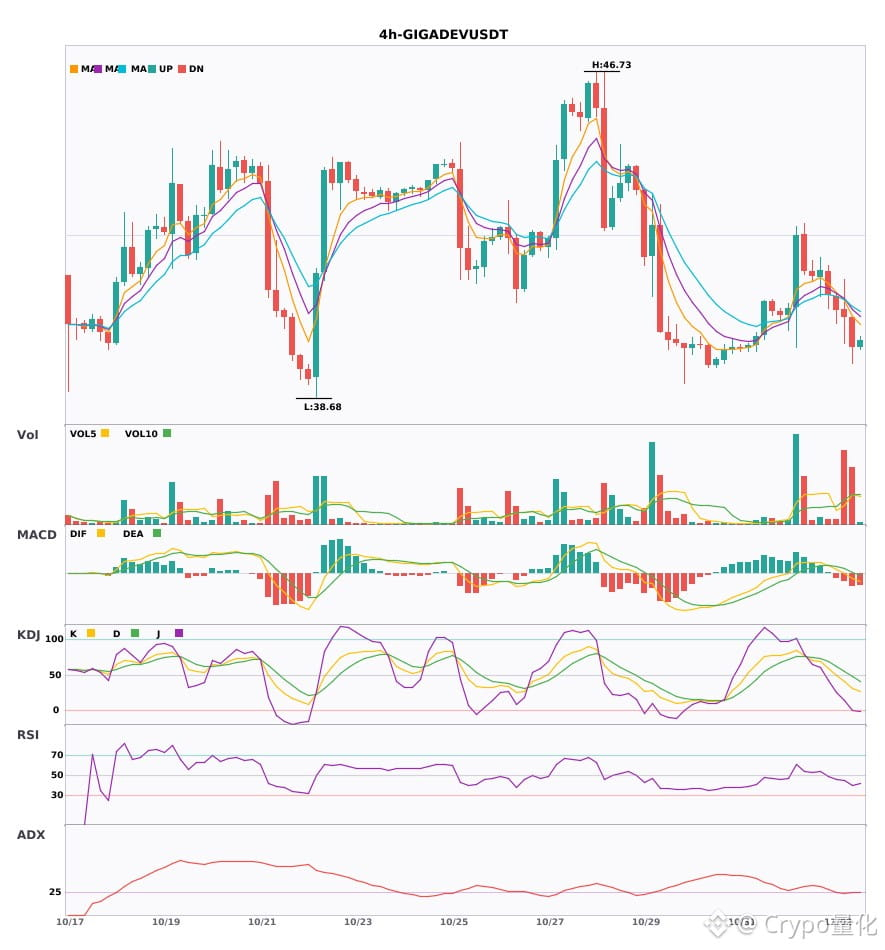
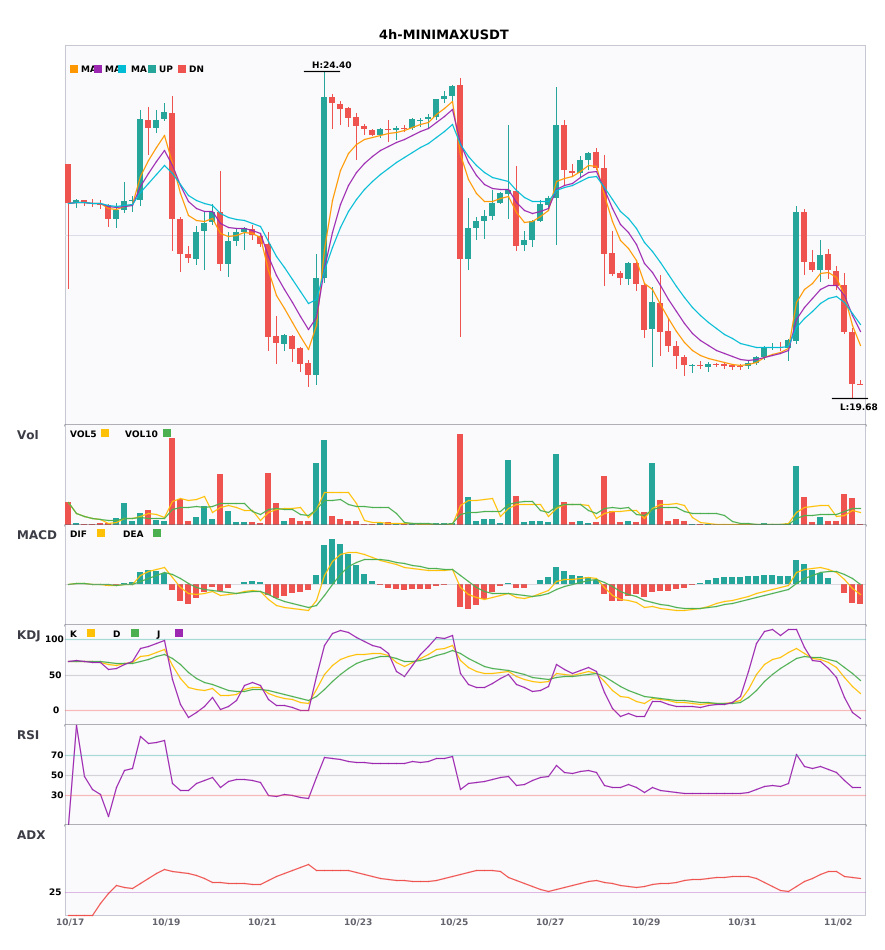
$GIGADEV / $MINIMAX / $HANA 4-hour bearish convergence, with bearish signals appearing simultaneously 🔥
════════════════════
🟢 $GIGADEV 4-hour bearish signal
⚠️Technical analysis: ADX(27) Trend is forming; opportunity to participate | MACDDIF falls below the zero line; trend turns bearish | EMA5 < EMA8 < EMA13; bearish alignment | KDJ is weak, with bears in control (K: 31.4, D: 47.3) | Volume surge (3.0x)
════════════════════
🟢 $MINIMAX 4-hour bearish signal
⚠️Technical analysis: ADX(45) Clear trending market | MACDDIF falls below the zero line; trend turns bearish | EMA5 crosses below EMA8; short-term outlook turns bearish | Volume increases (2.3x)
════════════════════
🟢 $HANA 4-hour bearish signal
⚠️Technical analysis: ADX(35) Clear trending market | MACDDIF falls below the zero line; trend turns bearish | EMA5 crosses below EMA8; short-term outlook turns bearish | KDJ is weak, with bears in control (K: 34.9, D: 42.3) | Volume surge (2.7x)
════════════════════
🔔 Follow us for real-time market movements 🔔
#技术分析 #GIGADEV #MINIMAX #HANA
📌 When trading, pay attention to whether the candlestick patterns confirm the signal
$GIGADEV / $MINIMAX / $HANA 4-hour bearish convergence, with bearish signals appearing simultaneously 🔥
════════════════════
🟢 $GIGADEV 4-hour bearish signal
⚠️Technical analysis: ADX(27) Trend is forming; opportunity to participate | MACDDIF falls below the zero line; trend turns bearish | EMA5 < EMA8 < EMA13; bearish alignment | KDJ is weak, with bears in control (K: 31.4, D: 47.3) | Volume surge (3.0x)
════════════════════
🟢 $MINIMAX 4-hour bearish signal
⚠️Technical analysis: ADX(45) Clear trending market | MACDDIF falls below the zero line; trend turns bearish | EMA5 crosses below EMA8; short-term outlook turns bearish | Volume increases (2.3x)
════════════════════
🟢 $HANA 4-hour bearish signal
⚠️Technical analysis: ADX(35) Clear trending market | MACDDIF falls below the zero line; trend turns bearish | EMA5 crosses below EMA8; short-term outlook turns bearish | KDJ is weak, with bears in control (K: 34.9, D: 42.3) | Volume surge (2.7x)
════════════════════
🔔 Follow us for real-time market movements 🔔
#技术分析 #GIGADEV #MINIMAX #HANA
📌 When trading, pay attention to whether the candlestick patterns confirm the signal
════════════════════
🟢 $GIGADEV 4-hour bearish signal
⚠️Technical analysis: ADX(27) Trend is forming; opportunity to participate | MACDDIF falls below the zero line; trend turns bearish | EMA5 < EMA8 < EMA13; bearish alignment | KDJ is weak, with bears in control (K: 31.4, D: 47.3) | Volume surge (3.0x)
════════════════════
🟢 $MINIMAX 4-hour bearish signal
⚠️Technical analysis: ADX(45) Clear trending market | MACDDIF falls below the zero line; trend turns bearish | EMA5 crosses below EMA8; short-term outlook turns bearish | Volume increases (2.3x)
════════════════════
🟢 $HANA 4-hour bearish signal
⚠️Technical analysis: ADX(35) Clear trending market | MACDDIF falls below the zero line; trend turns bearish | EMA5 crosses below EMA8; short-term outlook turns bearish | KDJ is weak, with bears in control (K: 34.9, D: 42.3) | Volume surge (2.7x)
════════════════════
🔔 Follow us for real-time market movements 🔔
#技术分析 #GIGADEV #MINIMAX #HANA
📌 When trading, pay attention to whether the candlestick patterns confirm the signal
23
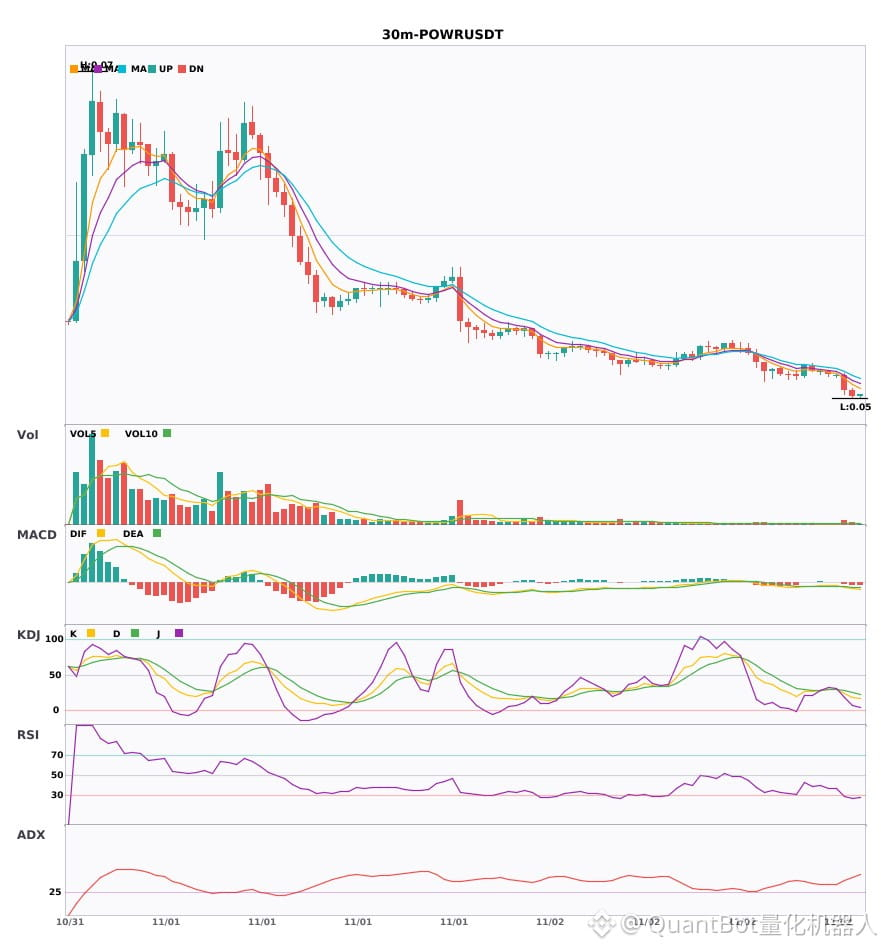
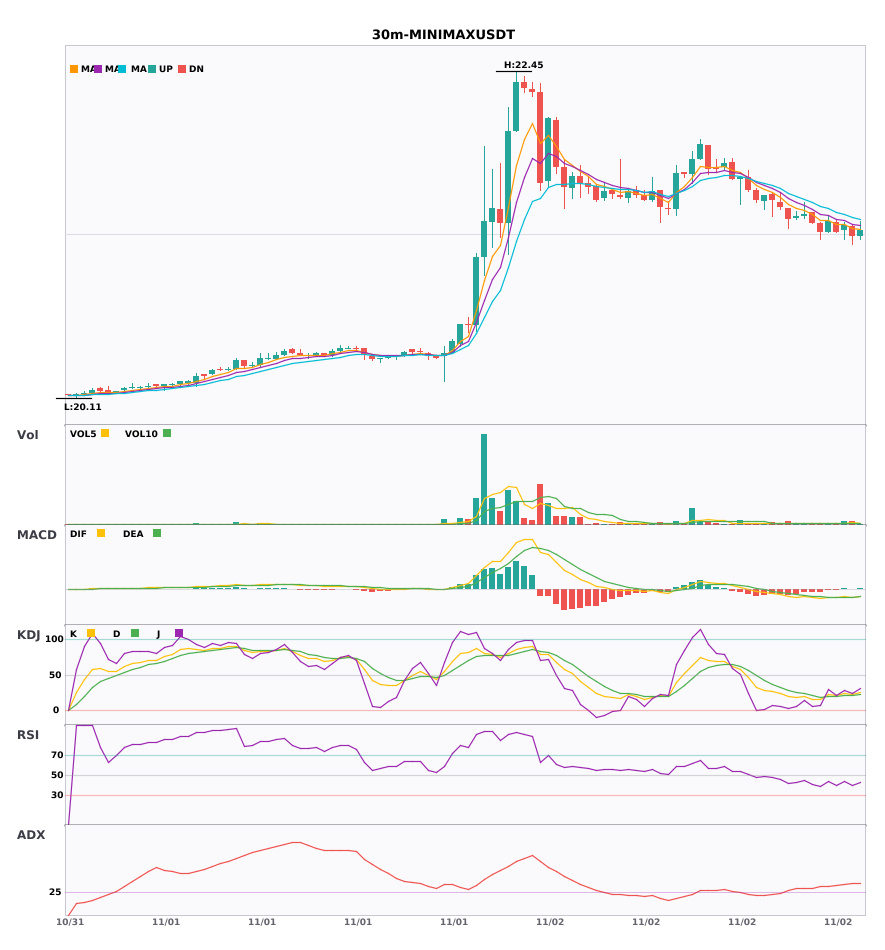
2 30-minute bearish alerts: $POWR / $MINIMAX
📉 $POWR | 30-minute bearish signal
━━━━━━━━━━━━━━━━━━
Technical analysis: ADX(40) indicates a clear trending market | MACD bearish crossover below zero, bearish momentum accelerating | EMA5 < EMA8 < EMA13, bearish alignment | KDJ bearish crossover, short-term outlook is bearish (K is 24.7, D is 27.9) | Volume spike (3.3x)
Price change: -1.6200%
📉 $MINIMAX | 30-minute bearish signal
━━━━━━━━━━━━━━━━━━
Technical analysis: ADX(39) indicates a clear trending market | MACD bearish crossover below zero, bearish momentum accelerating | EMA5 < EMA8 < EMA13, bearish alignment | KDJ trending weakly, bears have the upper hand (K is 22.6, D is 22.0) | Increased volume (1.9x)
Price change: -0.3700%
━━━━━━━━━━━━━━━━━━
#技术分析 #POWR #MINIMAX
📌 The above content is for reference only and does not constitute investment advice
2 30-minute bearish alerts: $POWR / $MINIMAX
📉 $POWR | 30-minute bearish signal
━━━━━━━━━━━━━━━━━━
Technical analysis: ADX(40) indicates a clear trending market | MACD bearish crossover below zero, bearish momentum accelerating | EMA5 < EMA8 < EMA13, bearish alignment | KDJ bearish crossover, short-term outlook is bearish (K is 24.7, D is 27.9) | Volume spike (3.3x)
Price change: -1.6200%
📉 $MINIMAX | 30-minute bearish signal
━━━━━━━━━━━━━━━━━━
Technical analysis: ADX(39) indicates a clear trending market | MACD bearish crossover below zero, bearish momentum accelerating | EMA5 < EMA8 < EMA13, bearish alignment | KDJ trending weakly, bears have the upper hand (K is 22.6, D is 22.0) | Increased volume (1.9x)
Price change: -0.3700%
━━━━━━━━━━━━━━━━━━
#技术分析 #POWR #MINIMAX
📌 The above content is for reference only and does not constitute investment advice
📉 $POWR | 30-minute bearish signal
━━━━━━━━━━━━━━━━━━
Technical analysis: ADX(40) indicates a clear trending market | MACD bearish crossover below zero, bearish momentum accelerating | EMA5 < EMA8 < EMA13, bearish alignment | KDJ bearish crossover, short-term outlook is bearish (K is 24.7, D is 27.9) | Volume spike (3.3x)
Price change: -1.6200%
📉 $MINIMAX | 30-minute bearish signal
━━━━━━━━━━━━━━━━━━
Technical analysis: ADX(39) indicates a clear trending market | MACD bearish crossover below zero, bearish momentum accelerating | EMA5 < EMA8 < EMA13, bearish alignment | KDJ trending weakly, bears have the upper hand (K is 22.6, D is 22.0) | Increased volume (1.9x)
Price change: -0.3700%
━━━━━━━━━━━━━━━━━━
#技术分析 #POWR #MINIMAX
📌 The above content is for reference only and does not constitute investment advice
40
·
--
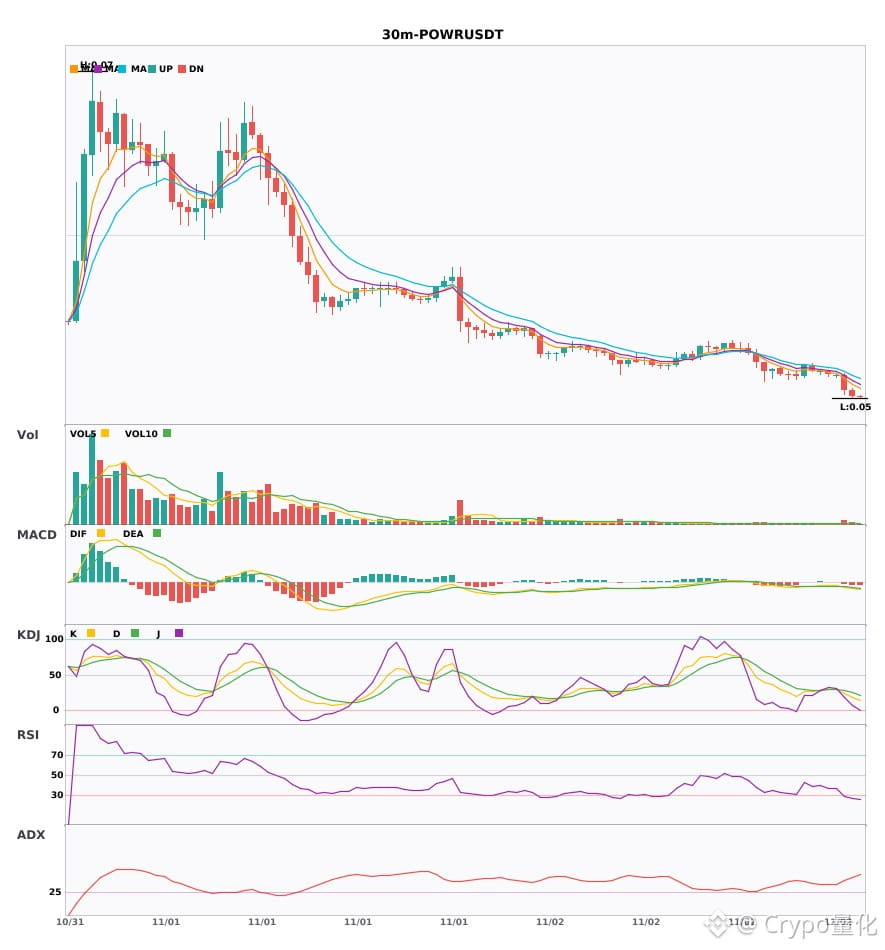
$POWR / $MINIMAX 30-minute confluence turns bearish, with bearish signals appearing simultaneously 🔥
════════════════════
🟢 $POWR 30-minute bearish signal
⚠️ Technical analysis: ADX(40) indicates a clear trend | MACD bearish crossover below zero, bearish momentum accelerating | EMA5 < EMA8 < EMA13, bearish alignment | KDJ bearish crossover, short-term outlook bearish (K: 24.7, D: 27.9) | Volume surge (3.3x)
════════════════════
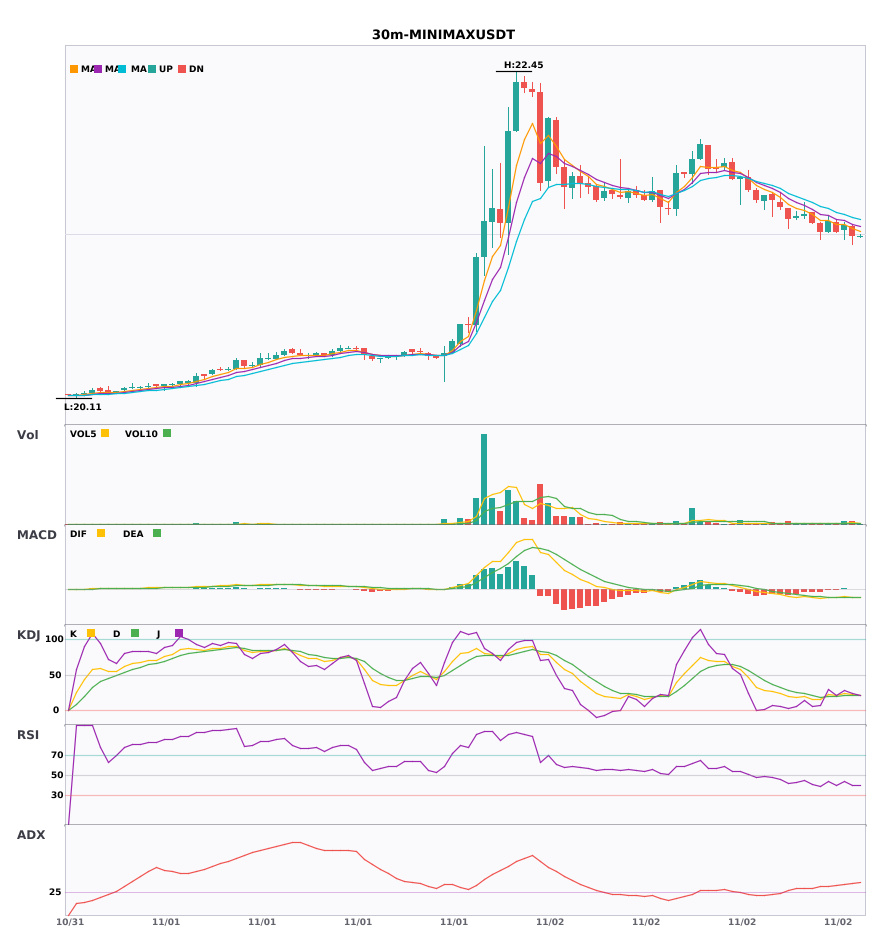
🟢 $MINIMAX 30-minute bearish signal
⚠️ Technical analysis: ADX(39) indicates a clear trend | MACD bearish crossover below zero, bearish momentum accelerating | EMA5 < EMA8 < EMA13, bearish alignment | KDJ trading weakly, bears have the upper hand (K: 22.6, D: 22.0) | Increased volume (1.9x)
════════════════════
🔔 Follow for first-hand market updates 🔔
#技术分析 #POWR #MINIMAX
📌 When trading, pay attention to whether the candlestick patterns confirm the setup
$POWR / $MINIMAX 30-minute confluence turns bearish, with bearish signals appearing simultaneously 🔥
════════════════════
🟢 $POWR 30-minute bearish signal
⚠️ Technical analysis: ADX(40) indicates a clear trend | MACD bearish crossover below zero, bearish momentum accelerating | EMA5 < EMA8 < EMA13, bearish alignment | KDJ bearish crossover, short-term outlook bearish (K: 24.7, D: 27.9) | Volume surge (3.3x)
════════════════════
🟢 $MINIMAX 30-minute bearish signal
⚠️ Technical analysis: ADX(39) indicates a clear trend | MACD bearish crossover below zero, bearish momentum accelerating | EMA5 < EMA8 < EMA13, bearish alignment | KDJ trading weakly, bears have the upper hand (K: 22.6, D: 22.0) | Increased volume (1.9x)
════════════════════
🔔 Follow for first-hand market updates 🔔
#技术分析 #POWR #MINIMAX
📌 When trading, pay attention to whether the candlestick patterns confirm the setup
════════════════════
🟢 $POWR 30-minute bearish signal
⚠️ Technical analysis: ADX(40) indicates a clear trend | MACD bearish crossover below zero, bearish momentum accelerating | EMA5 < EMA8 < EMA13, bearish alignment | KDJ bearish crossover, short-term outlook bearish (K: 24.7, D: 27.9) | Volume surge (3.3x)
════════════════════
🟢 $MINIMAX 30-minute bearish signal
⚠️ Technical analysis: ADX(39) indicates a clear trend | MACD bearish crossover below zero, bearish momentum accelerating | EMA5 < EMA8 < EMA13, bearish alignment | KDJ trading weakly, bears have the upper hand (K: 22.6, D: 22.0) | Increased volume (1.9x)
════════════════════
🔔 Follow for first-hand market updates 🔔
#技术分析 #POWR #MINIMAX
📌 When trading, pay attention to whether the candlestick patterns confirm the setup
40
·
--
$AXTI / $MINIMAX 4-hour technical indicators are strengthening in tandem—which has greater breakout potential? 🔥
════════════════════
🔴 $AXTI 4-hour bullish signals
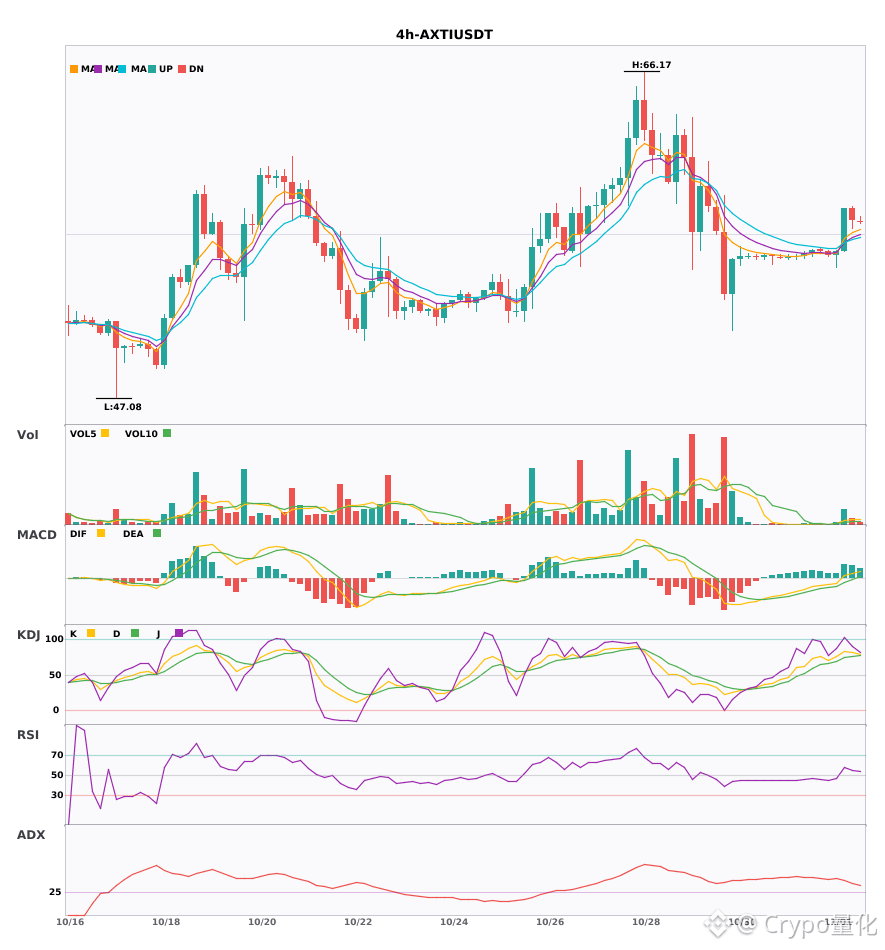
⚠️ Technicals: ADX(40) indicates a clear trend | MACD DIF breaks above the zero line, signaling a bullish trend | EMA5 crosses above EMA8, signaling a short-term bullish trend | KDJ is strong, with bulls in control (K: 83.5, D: 74.0) | Volume surge (6.2x)
════════════════════
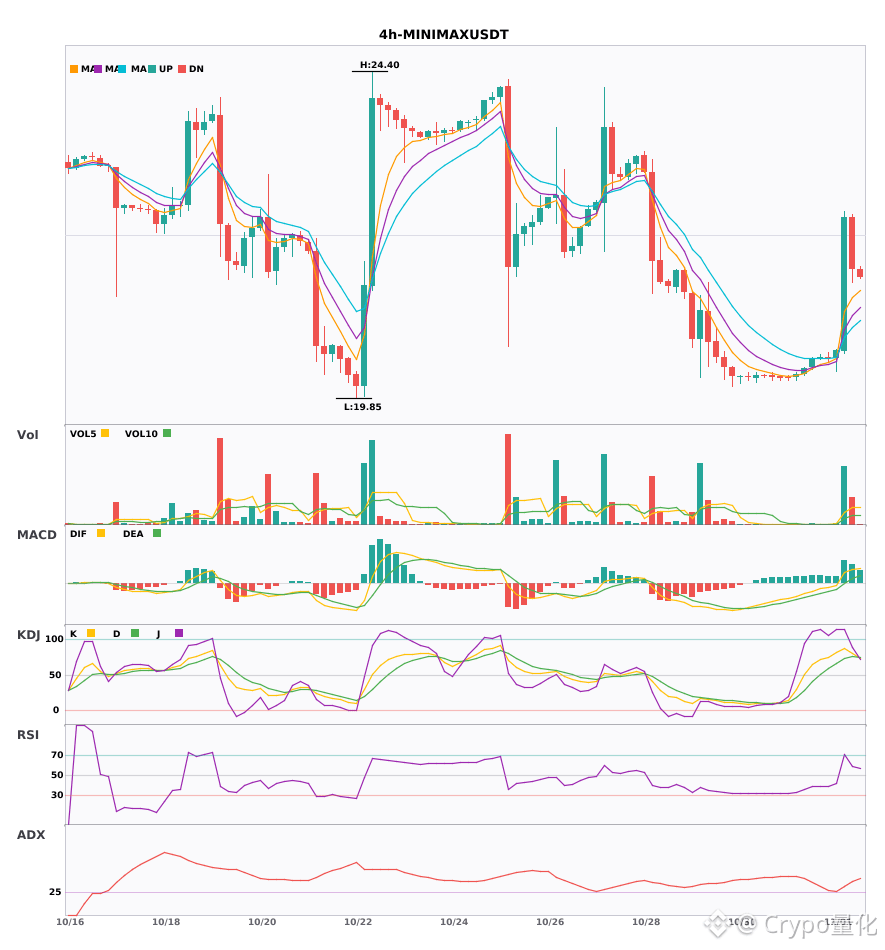
🔴 $MINIMAX 4-hour bullish signals
⚠️ Technicals: ADX(35) indicates a clear trend | MACD DIF breaks above the zero line, signaling a bullish trend | EMA5 > EMA8 > EMA13, a bullish alignment | KDJ is strong, with bulls in control (K: 87.0, D: 73.4) | Volume surge (8.9x)
════════════════════
🔔 Follow for the latest market alerts 🔔
#技术分析 #AXTI #MINIMAX
📌 Pay attention to whether the candlestick pattern aligns.
$AXTI / $MINIMAX 4-hour technical indicators are strengthening in tandem—which has greater breakout potential? 🔥
════════════════════
🔴 $AXTI 4-hour bullish signals
⚠️ Technicals: ADX(40) indicates a clear trend | MACD DIF breaks above the zero line, signaling a bullish trend | EMA5 crosses above EMA8, signaling a short-term bullish trend | KDJ is strong, with bulls in control (K: 83.5, D: 74.0) | Volume surge (6.2x)
════════════════════
🔴 $MINIMAX 4-hour bullish signals
⚠️ Technicals: ADX(35) indicates a clear trend | MACD DIF breaks above the zero line, signaling a bullish trend | EMA5 > EMA8 > EMA13, a bullish alignment | KDJ is strong, with bulls in control (K: 87.0, D: 73.4) | Volume surge (8.9x)
════════════════════
🔔 Follow for the latest market alerts 🔔
#技术分析 #AXTI #MINIMAX
📌 Pay attention to whether the candlestick pattern aligns.
════════════════════
🔴 $AXTI 4-hour bullish signals
⚠️ Technicals: ADX(40) indicates a clear trend | MACD DIF breaks above the zero line, signaling a bullish trend | EMA5 crosses above EMA8, signaling a short-term bullish trend | KDJ is strong, with bulls in control (K: 83.5, D: 74.0) | Volume surge (6.2x)
════════════════════
🔴 $MINIMAX 4-hour bullish signals
⚠️ Technicals: ADX(35) indicates a clear trend | MACD DIF breaks above the zero line, signaling a bullish trend | EMA5 > EMA8 > EMA13, a bullish alignment | KDJ is strong, with bulls in control (K: 87.0, D: 73.4) | Volume surge (8.9x)
════════════════════
🔔 Follow for the latest market alerts 🔔
#技术分析 #AXTI #MINIMAX
📌 Pay attention to whether the candlestick pattern aligns.
8

·
--
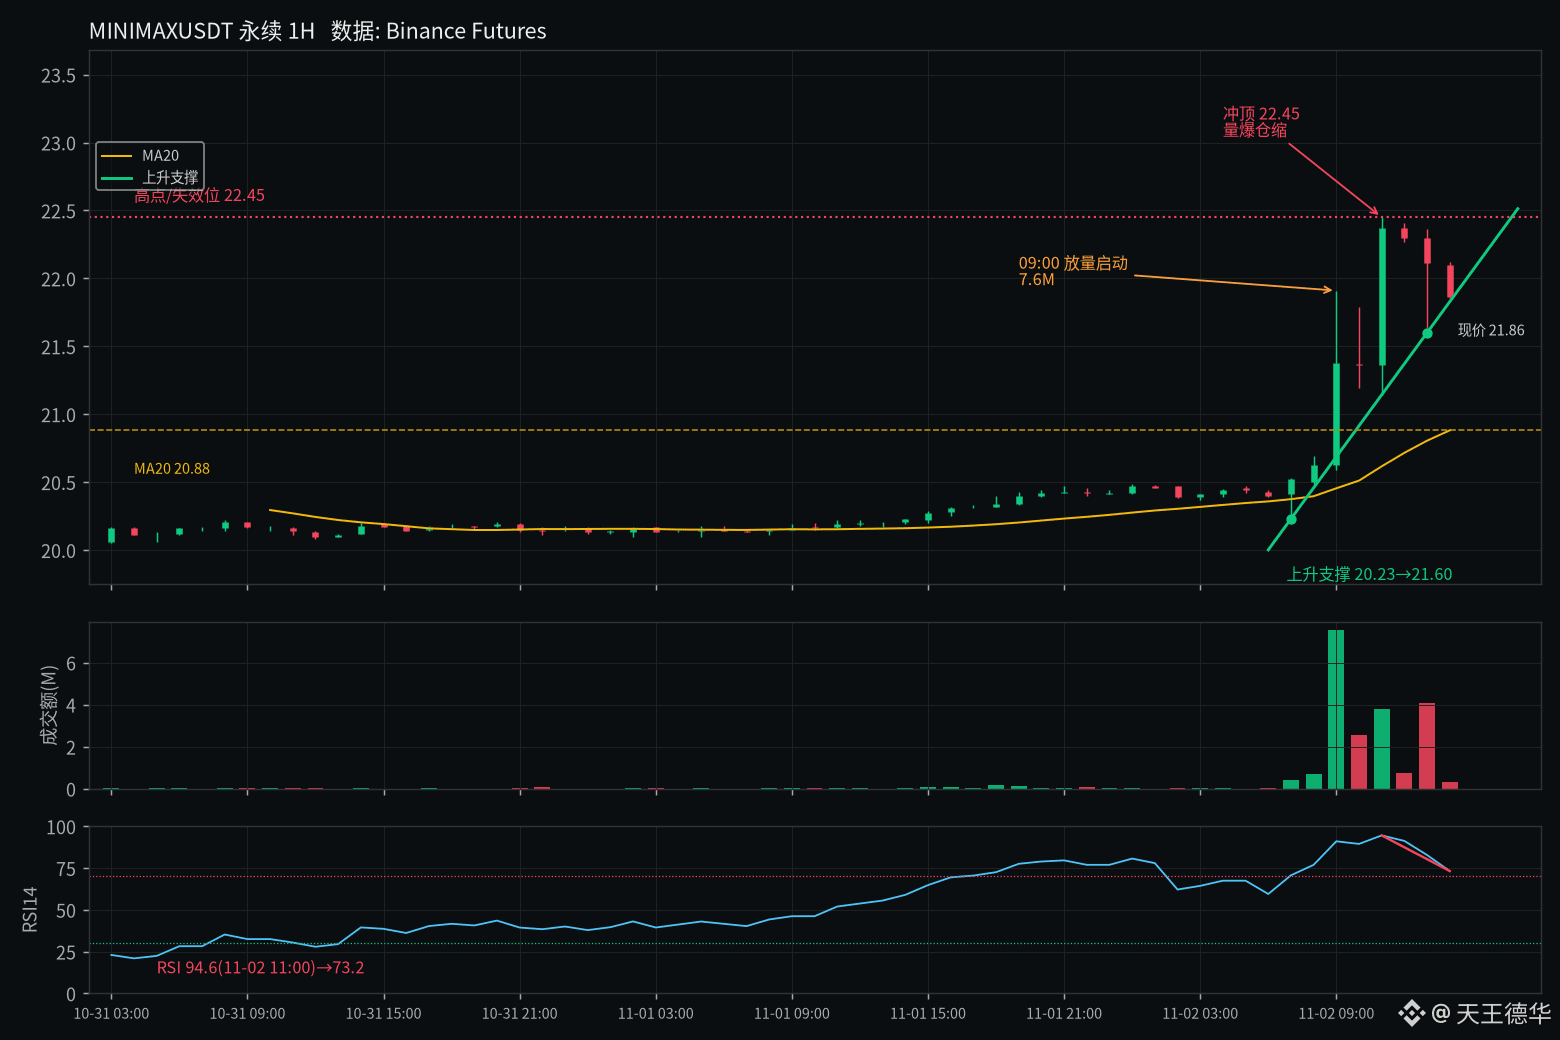
$MINIMAX The price shot straight up from around 20.2 early in the session. Turnover was only around 800,000 in the previous 12 hours, then exploded to around 20 million in the next 12. RSI briefly hit 94, while contract positions were actually shrinking—this looks more like a short squeeze than a surge driven by aggressive positioning. It failed to hold above 22.45, and the current price is pulling back toward rising support. If that breaks, watch MA20 at 20.88. Let’s see it get back above 22.45 first.
#MINIMAX #MarketAnalysis
Not investment advice
$MINIMAX The price shot straight up from around 20.2 early in the session. Turnover was only around 800,000 in the previous 12 hours, then exploded to around 20 million in the next 12. RSI briefly hit 94, while contract positions were actually shrinking—this looks more like a short squeeze than a surge driven by aggressive positioning. It failed to hold above 22.45, and the current price is pulling back toward rising support. If that breaks, watch MA20 at 20.88. Let’s see it get back above 22.45 first.
#MINIMAX #MarketAnalysis
Not investment advice
#MINIMAX #MarketAnalysis
Not investment advice
281
·
--
3 4-hour bullish signals appeared simultaneously: $MINIMAX / $UNITREE / $T🔥
════════════════════
🔴 $MINIMAX 4-hour bullish signal
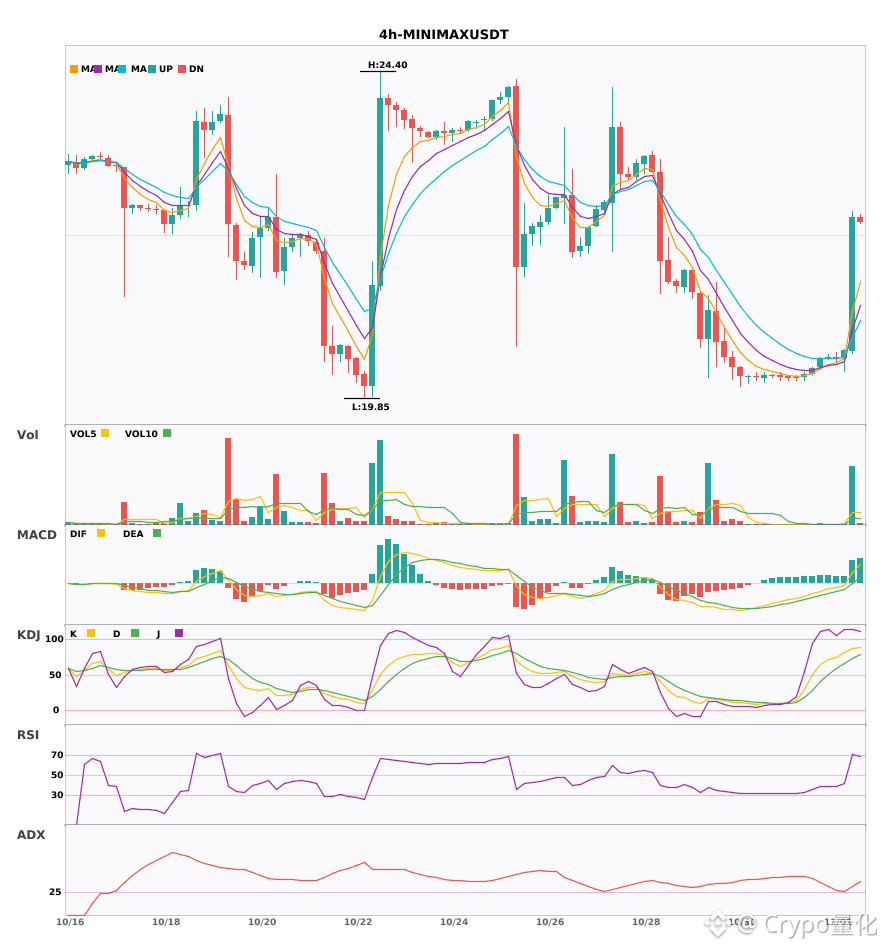
⚠️Technical analysis: ADX(35) indicates a clear trend | MACD DIF broke above zero, turning the trend bullish | EMA5 > EMA8 > EMA13, bullish alignment | KDJ is strong, with bulls in control (K: 87.0, D: 73.4) | Volume surge (8.9x)
════════════════════
🔴 $UNITREE 4-hour bullish signal
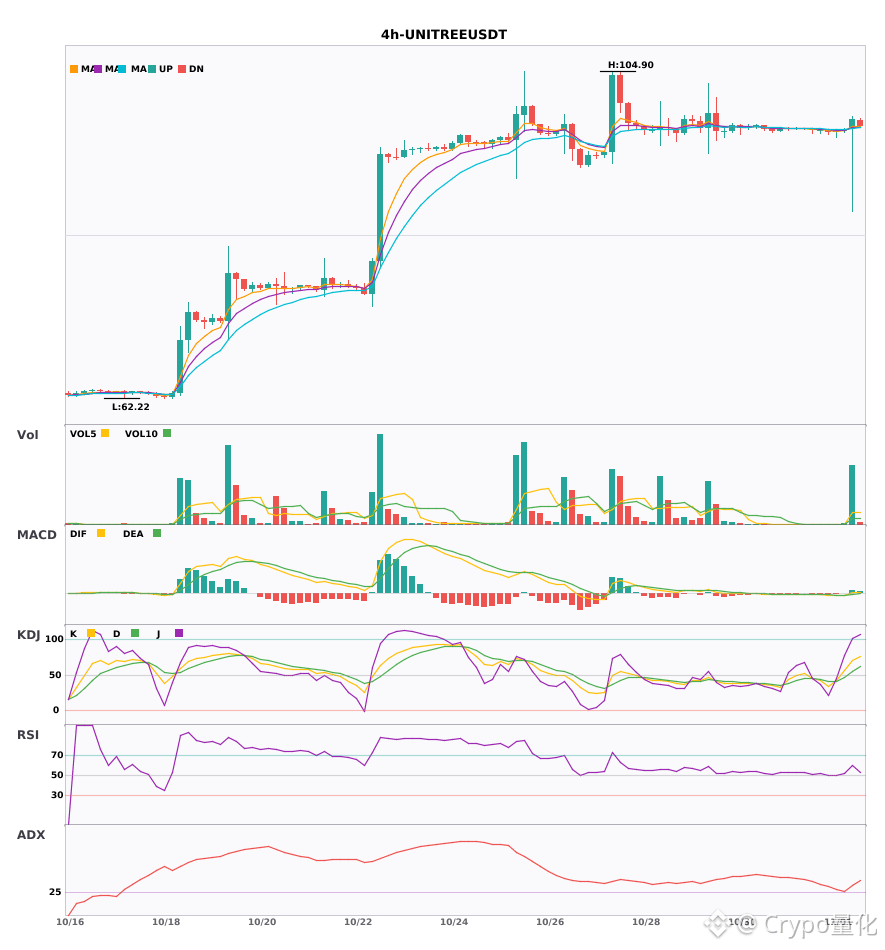
⚠️Technical analysis: ADX(31) indicates a clear trend | MACD DIF broke above zero, turning the trend bullish | EMA5 crossed above EMA8, short-term outlook turns bullish | KDJ is strong, with bulls in control (K: 70.2, D: 54.4) | Volume surge (9.1x)
════════════════════
🔴 $T 4-hour bullish signal
⚠️Technical analysis: ADX(29) trend is forming; participation is possible | MACD bullish crossover above zero, releasing bullish momentum | EMA5 > EMA8 > EMA13, bullish alignment | Volume increase (2.4x)
════════════════════
🔔 Follow for first-hand market alerts 🔔
#技术分析 #MINIMAX #UNITREE #T
📌 When trading, watch whether the candlestick patterns align
3 4-hour bullish signals appeared simultaneously: $MINIMAX / $UNITREE / $T 🔥
════════════════════
🔴 $MINIMAX 4-hour bullish signal
⚠️Technical analysis: ADX(35) indicates a clear trend | MACD DIF broke above zero, turning the trend bullish | EMA5 > EMA8 > EMA13, bullish alignment | KDJ is strong, with bulls in control (K: 87.0, D: 73.4) | Volume surge (8.9x)
════════════════════
🔴 $UNITREE 4-hour bullish signal
⚠️Technical analysis: ADX(31) indicates a clear trend | MACD DIF broke above zero, turning the trend bullish | EMA5 crossed above EMA8, short-term outlook turns bullish | KDJ is strong, with bulls in control (K: 70.2, D: 54.4) | Volume surge (9.1x)
════════════════════
🔴 $T 4-hour bullish signal
⚠️Technical analysis: ADX(29) trend is forming; participation is possible | MACD bullish crossover above zero, releasing bullish momentum | EMA5 > EMA8 > EMA13, bullish alignment | Volume increase (2.4x)
════════════════════
🔔 Follow for first-hand market alerts 🔔
#技术分析 #MINIMAX #UNITREE #T
📌 When trading, watch whether the candlestick patterns align
════════════════════
🔴 $MINIMAX 4-hour bullish signal
⚠️Technical analysis: ADX(35) indicates a clear trend | MACD DIF broke above zero, turning the trend bullish | EMA5 > EMA8 > EMA13, bullish alignment | KDJ is strong, with bulls in control (K: 87.0, D: 73.4) | Volume surge (8.9x)
════════════════════
🔴 $UNITREE 4-hour bullish signal
⚠️Technical analysis: ADX(31) indicates a clear trend | MACD DIF broke above zero, turning the trend bullish | EMA5 crossed above EMA8, short-term outlook turns bullish | KDJ is strong, with bulls in control (K: 70.2, D: 54.4) | Volume surge (9.1x)
════════════════════
🔴 $T 4-hour bullish signal
⚠️Technical analysis: ADX(29) trend is forming; participation is possible | MACD bullish crossover above zero, releasing bullish momentum | EMA5 > EMA8 > EMA13, bullish alignment | Volume increase (2.4x)
════════════════════
🔔 Follow for first-hand market alerts 🔔
#技术分析 #MINIMAX #UNITREE #T
📌 When trading, watch whether the candlestick patterns align
9
Log in to explore more content
Join global crypto users on Binance Square
⚡️ Get latest and useful information about crypto.
💬 Trusted by the world’s largest crypto exchange.
👍 Discover real insights from verified creators.
Email / Phone number
Trending Topics
1
#BinanceReopensWithdrawalsForMoreAssets
623,357 views
3,023 Discussing
2
#BTCRebounds80K
136,520 views
1,322 Discussing
3
#Binance98PercentReplenished
70,889 views
916 Discussing
4
#ADPUSPrivateEmployersAdd86000JobsInOctober
8,280 views
149 Discussing
5
#USMidterms-WhatAreMarketsExpecting?
447,997 views
2,397 Discussing
6
#US10YearTreasuryYieldFallsTo4.845%
95 views
24 Discussing
7
#ZcashExpectsNU7ToMake$16MSproutZECInaccessible
17 views
4 Discussing
8
#AsianChipStocksRetreat
688 views
30 Discussing
9
#USOctoberNFP-AreRateCutsStillPossible
445,859 views
3,066 Discussing
10
#TRUMPFalls18.1%In24HoursToRecordLow
7,606 views
74 Discussing