
#jto
jto
5.5M views
11,363 Discussing
Hot
Latest

🚨 $JTO BRACING FOR A LIQUIDITY BREAKDOWN AS SELLER PRESSURE MOUNTS 🔻
Entry: 0.5627 - 0.5651 ⚡
Target: 0.4951 🎯
Stop Loss: 0.5821 ⚠️
Sellers are quietly stacking supply at resistance, preparing for a sharp downside expansion toward lower demand shelves. 📉 While the short timeframe structure looks primed for a clean liquidity sweep, macro market momentum is keeping downside confirmation tightly guarded. 📊
📌 Discipline separates the top traders from late chasers—this setup stays strictly on the radar until structural breakdown confirms. 🔍 Are you positioning for this short swing or waiting for broader market alignment first? 👇
⚠️ Not financial advice. Always manage your risk. 🛡️
🏷️ #JTO #ShortSetup #Crypto #Trading #Bearish
📉 🐻
🚨 $JTO BRACING FOR A LIQUIDITY BREAKDOWN AS SELLER PRESSURE MOUNTS 🔻
Entry: 0.5627 - 0.5651 ⚡
Target: 0.4951 🎯
Stop Loss: 0.5821 ⚠️
Sellers are quietly stacking supply at resistance, preparing for a sharp downside expansion toward lower demand shelves. 📉 While the short timeframe structure looks primed for a clean liquidity sweep, macro market momentum is keeping downside confirmation tightly guarded. 📊
📌 Discipline separates the top traders from late chasers—this setup stays strictly on the radar until structural breakdown confirms. 🔍 Are you positioning for this short swing or waiting for broader market alignment first? 👇
⚠️ Not financial advice. Always manage your risk. 🛡️
🏷️ #JTO #ShortSetup #Crypto #Trading #Bearish
📉 🐻
Entry: 0.5627 - 0.5651 ⚡
Target: 0.4951 🎯
Stop Loss: 0.5821 ⚠️
Sellers are quietly stacking supply at resistance, preparing for a sharp downside expansion toward lower demand shelves. 📉 While the short timeframe structure looks primed for a clean liquidity sweep, macro market momentum is keeping downside confirmation tightly guarded. 📊
📌 Discipline separates the top traders from late chasers—this setup stays strictly on the radar until structural breakdown confirms. 🔍 Are you positioning for this short swing or waiting for broader market alignment first? 👇
⚠️ Not financial advice. Always manage your risk. 🛡️
🏷️ #JTO #ShortSetup #Crypto #Trading #Bearish
📉 🐻
21

🚨 $JTO FLASHING BEARISH CONTINUATION STRUCTURE WHILE REJECTING HIGHER LIQUIDITY ZONES! 📉
Entry: 0.5627 - 0.5651 ⚡
Target: 0.4951 🎯
Stop Loss: 0.5821 ⚠️
The 1H timeframe on $JTO is painting a clean downtrend continuation model right into the supply layer between 0.5627 and 0.5651. 📉 Sellers continue to absorb upside attempts, but macro market context demands disciplined patience here.
Because this directional bias currently conflicts with the 4H $BTC trend filter and carries a negative expected value of -0.22R, this setup remains strictly on our tracking radar. 📊 Disciplined execution means awaiting definitive confirmation before committing capital to a short position.
Are you waiting for trigger confirmation here or letting the macro market trend dictate your move? 👇
⚠️ Not financial advice. Always manage your risk. 🛡️
🏷️ #JTO #ShortSetup #Trading #Bearish #Crypto
🔻 🐻
🚨 $JTO FLASHING BEARISH CONTINUATION STRUCTURE WHILE REJECTING HIGHER LIQUIDITY ZONES! 📉
Entry: 0.5627 - 0.5651 ⚡
Target: 0.4951 🎯
Stop Loss: 0.5821 ⚠️
The 1H timeframe on $JTO is painting a clean downtrend continuation model right into the supply layer between 0.5627 and 0.5651. 📉 Sellers continue to absorb upside attempts, but macro market context demands disciplined patience here.
Because this directional bias currently conflicts with the 4H $BTC trend filter and carries a negative expected value of -0.22R, this setup remains strictly on our tracking radar. 📊 Disciplined execution means awaiting definitive confirmation before committing capital to a short position.
Are you waiting for trigger confirmation here or letting the macro market trend dictate your move? 👇
⚠️ Not financial advice. Always manage your risk. 🛡️
🏷️ #JTO #ShortSetup #Trading #Bearish #Crypto
🔻 🐻
Entry: 0.5627 - 0.5651 ⚡
Target: 0.4951 🎯
Stop Loss: 0.5821 ⚠️
The 1H timeframe on $JTO is painting a clean downtrend continuation model right into the supply layer between 0.5627 and 0.5651. 📉 Sellers continue to absorb upside attempts, but macro market context demands disciplined patience here.
Because this directional bias currently conflicts with the 4H $BTC trend filter and carries a negative expected value of -0.22R, this setup remains strictly on our tracking radar. 📊 Disciplined execution means awaiting definitive confirmation before committing capital to a short position.
Are you waiting for trigger confirmation here or letting the macro market trend dictate your move? 👇
⚠️ Not financial advice. Always manage your risk. 🛡️
🏷️ #JTO #ShortSetup #Trading #Bearish #Crypto
🔻 🐻
20



·
--
Bullish
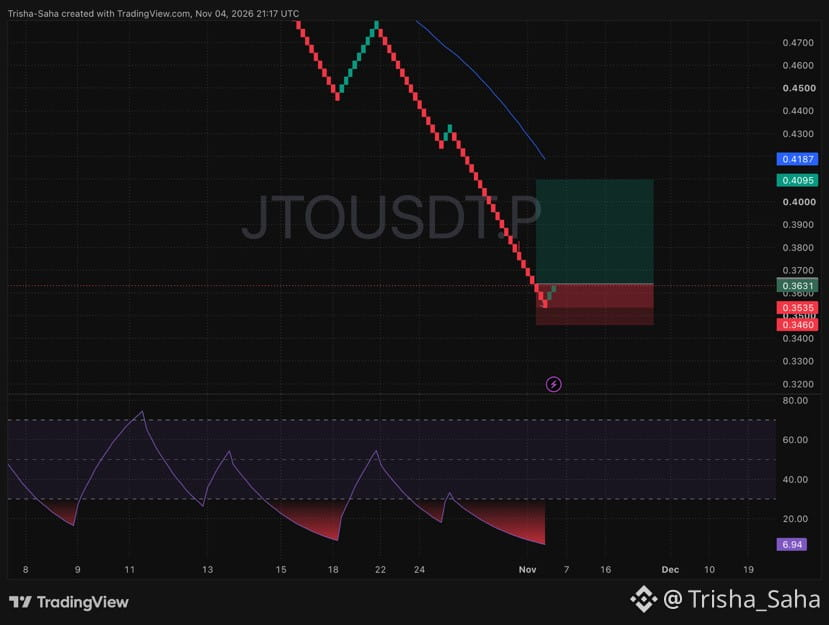
🔱 $JTO SELLERS ARE COMPLETELY DRAINED! MASSIVE REBOUND STARTING! 📈💥
📍 Trade Setup:
• Entry Zone: $0.3555 – $0.3631
• Stop Loss: $0.3460
• Target: $0.4095
📌 Chart Analysis:
• The heavy sell-off finally hit a hard floor at $0.3535 where sellers ran out of ammo and failed to push lower.
• Three straight green candles are firing off the bottom right now, proving strong buyers have stepped in to flip the momentum back up.
• The lower strength indicator is crushed all the way down at 6.94, flashing an extreme bargain signal before a sharp snap-back toward the $0.4187 blue line.
🔐 Make this trade 100% risk-free by sliding your Stop Loss straight to your entry price the moment we hit +3% to +4% profit!
My bags are packed and I'm already in. Who is riding this $JTO bounce to $0.4095 with me? Drop a 🚀 in the comments! 👇
#JTO #JTOUSDT #SolanaEcosystem #BinanceSquare
{future}(JTOUSDT)
🔱 $JTO SELLERS ARE COMPLETELY DRAINED! MASSIVE REBOUND STARTING! 📈💥
📍 Trade Setup:
• Entry Zone: $0.3555 – $0.3631
• Stop Loss: $0.3460
• Target: $0.4095
📌 Chart Analysis:
• The heavy sell-off finally hit a hard floor at $0.3535 where sellers ran out of ammo and failed to push lower.
• Three straight green candles are firing off the bottom right now, proving strong buyers have stepped in to flip the momentum back up.
• The lower strength indicator is crushed all the way down at 6.94, flashing an extreme bargain signal before a sharp snap-back toward the $0.4187 blue line.
🔐 Make this trade 100% risk-free by sliding your Stop Loss straight to your entry price the moment we hit +3% to +4% profit!
My bags are packed and I'm already in. Who is riding this $JTO bounce to $0.4095 with me? Drop a 🚀 in the comments! 👇
#JTO #JTOUSDT #SolanaEcosystem #BinanceSquare
📍 Trade Setup:
• Entry Zone: $0.3555 – $0.3631
• Stop Loss: $0.3460
• Target: $0.4095
📌 Chart Analysis:
• The heavy sell-off finally hit a hard floor at $0.3535 where sellers ran out of ammo and failed to push lower.
• Three straight green candles are firing off the bottom right now, proving strong buyers have stepped in to flip the momentum back up.
• The lower strength indicator is crushed all the way down at 6.94, flashing an extreme bargain signal before a sharp snap-back toward the $0.4187 blue line.
🔐 Make this trade 100% risk-free by sliding your Stop Loss straight to your entry price the moment we hit +3% to +4% profit!
My bags are packed and I'm already in. Who is riding this $JTO bounce to $0.4095 with me? Drop a 🚀 in the comments! 👇
#JTO #JTOUSDT #SolanaEcosystem #BinanceSquare
176
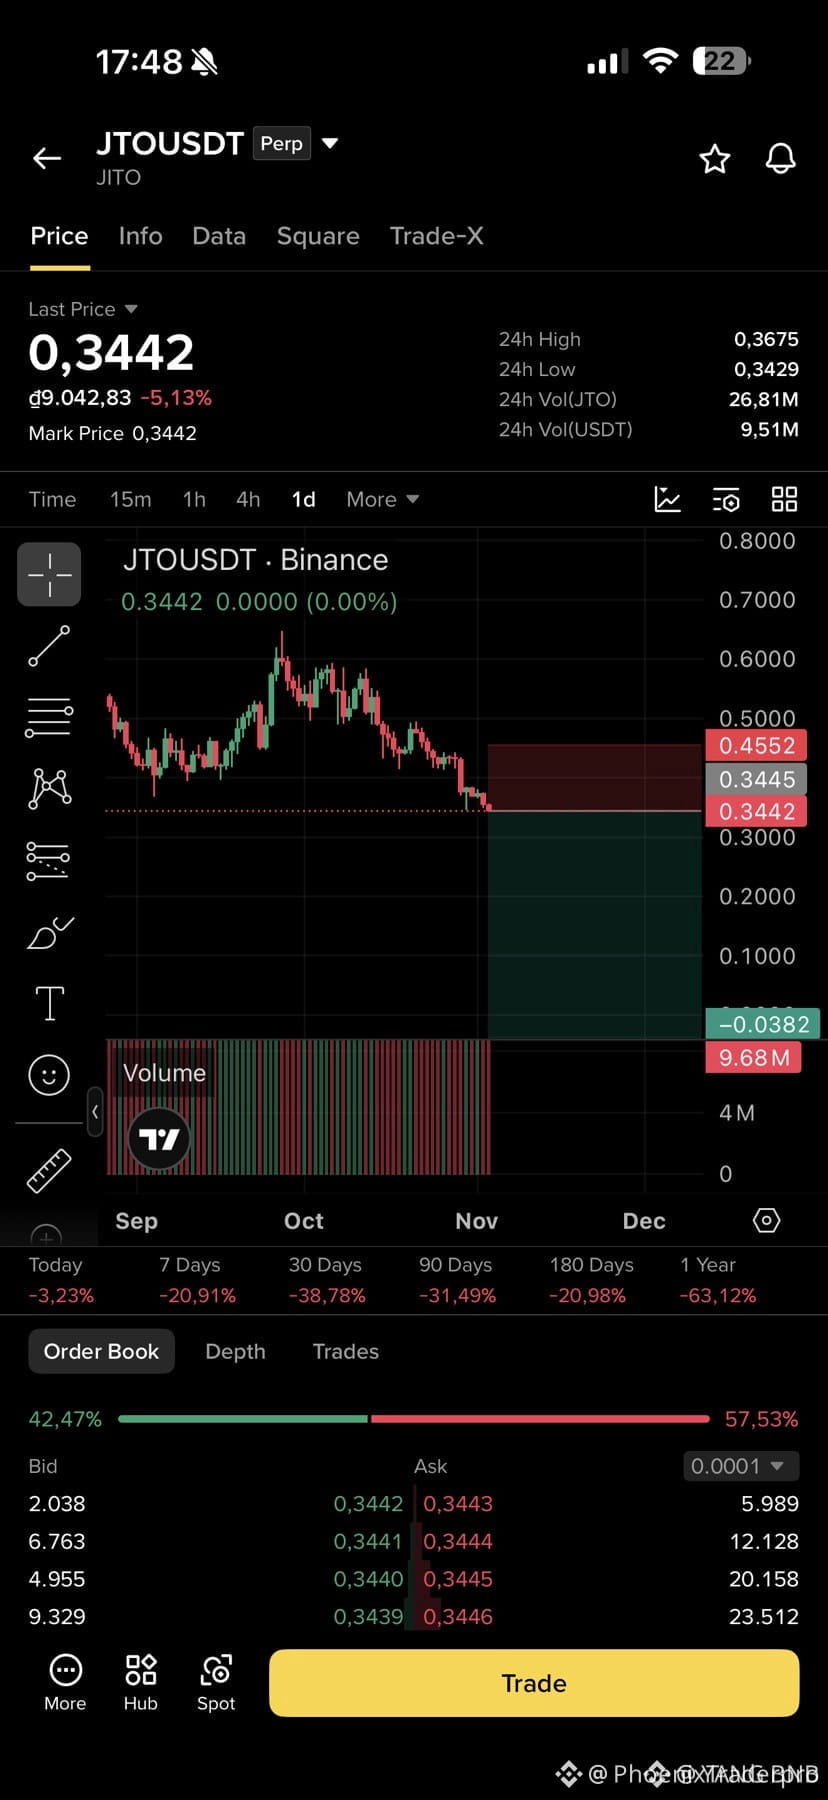
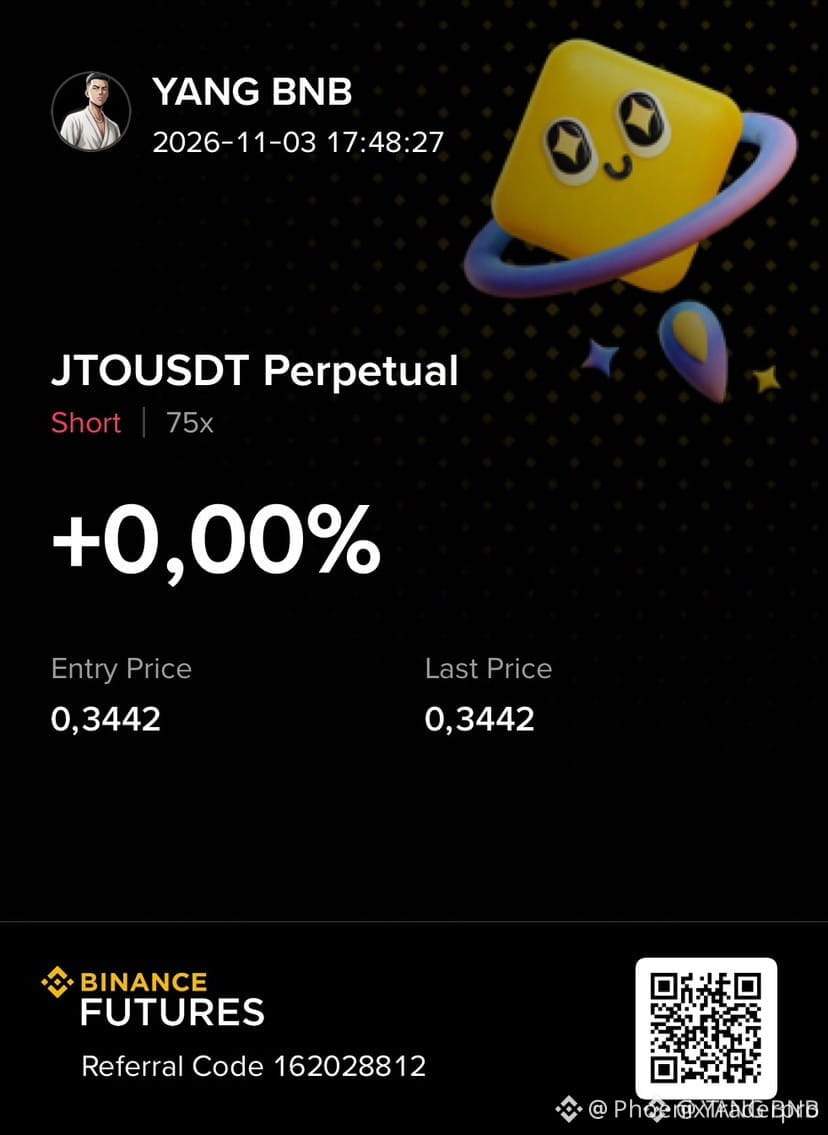
🔴 $JTO PLUNGING DEEPER INTO BEAR ZONE – SHORT ALERT! 📉
Entry: 0.3440‑0.3550 ⚡
Target: 0.3000 🚀
Target: 0.2000 🚀
Target: 0.1000 🚀
Stop Loss: 0.4552 ⚠️
📊 The chart’s lower‑high/low pattern is tightening like a vice, confirming sellers own the narrative. 🦈 Smart‑money is sweeping liquidity above the 0.45 barrier, leaving a clean path for bears to drive the token toward the 0.10 floor. ⚡ Volume spikes on each rejection amplify the downside thrust, making every pullback a trap for longs. 💡 With three aggressive targets, the risk‑reward matrix screams “play the short.” 💬 How deep do you think the bears can push $JTO before the next liquidity hunt?
⚠️ Not financial advice. Always manage your risk. 🛡️
🏷️ #JTO #ShortSetup #Bearish #Crypto
🔥 💎
🔴 $JTO PLUNGING DEEPER INTO BEAR ZONE – SHORT ALERT! 📉
Entry: 0.3440‑0.3550 ⚡
Target: 0.3000 🚀
Target: 0.2000 🚀
Target: 0.1000 🚀
Stop Loss: 0.4552 ⚠️
📊 The chart’s lower‑high/low pattern is tightening like a vice, confirming sellers own the narrative. 🦈 Smart‑money is sweeping liquidity above the 0.45 barrier, leaving a clean path for bears to drive the token toward the 0.10 floor. ⚡ Volume spikes on each rejection amplify the downside thrust, making every pullback a trap for longs. 💡 With three aggressive targets, the risk‑reward matrix screams “play the short.” 💬 How deep do you think the bears can push $JTO before the next liquidity hunt?
⚠️ Not financial advice. Always manage your risk. 🛡️
🏷️ #JTO #ShortSetup #Bearish #Crypto
🔥 💎
Entry: 0.3440‑0.3550 ⚡
Target: 0.3000 🚀
Target: 0.2000 🚀
Target: 0.1000 🚀
Stop Loss: 0.4552 ⚠️
📊 The chart’s lower‑high/low pattern is tightening like a vice, confirming sellers own the narrative. 🦈 Smart‑money is sweeping liquidity above the 0.45 barrier, leaving a clean path for bears to drive the token toward the 0.10 floor. ⚡ Volume spikes on each rejection amplify the downside thrust, making every pullback a trap for longs. 💡 With three aggressive targets, the risk‑reward matrix screams “play the short.” 💬 How deep do you think the bears can push $JTO before the next liquidity hunt?
⚠️ Not financial advice. Always manage your risk. 🛡️
🏷️ #JTO #ShortSetup #Bearish #Crypto
🔥 💎
10

·
--
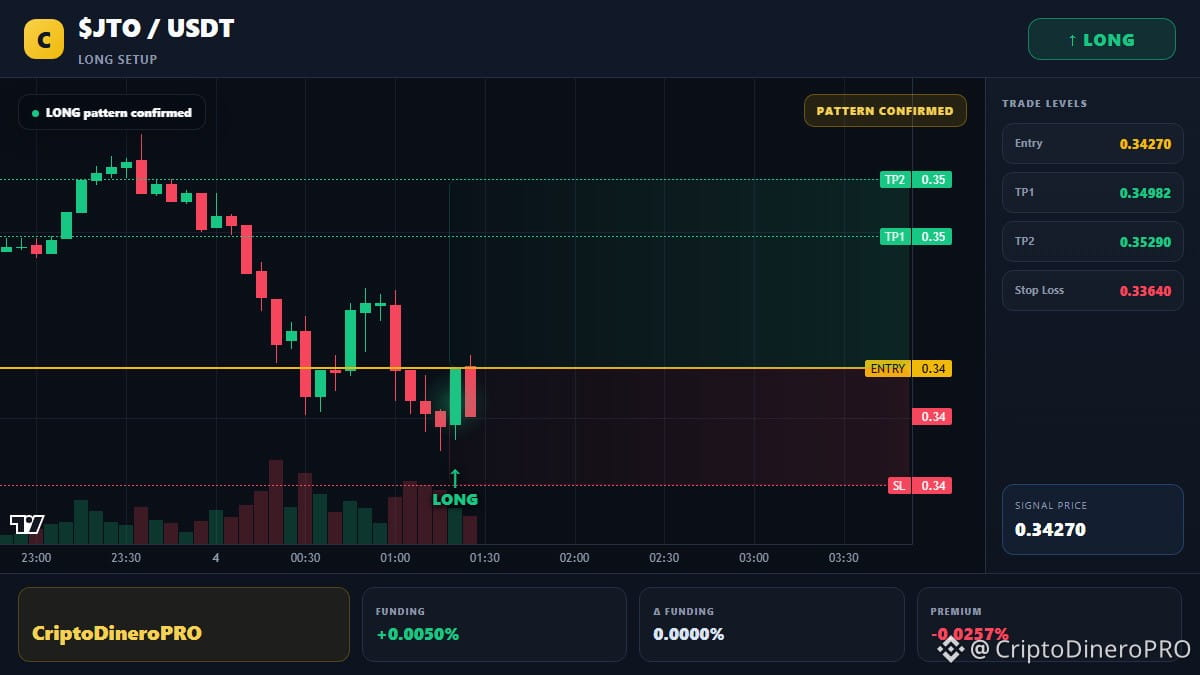
$JTO is down 6.0 percent today and I am passing on it completely
Volume is sitting at just 1.4 million dollars which makes size a real problem on this order book
Price is hanging down at 14 percent of the daily range right now and 23.0 percent below the seven day high
I need to see an hourly close and hold above 0.36390 before taking a serious look
Or a clean pullback that holds 0.33680 and actually bounces first
It could keep running without you and a bad entry costs more than a missed move
Chasing $JTO here or waiting for 0.33680
#JTO #RiskManagement
$JTO is down 6.0 percent today and I am passing on it completely
Volume is sitting at just 1.4 million dollars which makes size a real problem on this order book
Price is hanging down at 14 percent of the daily range right now and 23.0 percent below the seven day high
I need to see an hourly close and hold above 0.36390 before taking a serious look
Or a clean pullback that holds 0.33680 and actually bounces first
It could keep running without you and a bad entry costs more than a missed move
Chasing $JTO here or waiting for 0.33680
#JTO #RiskManagement
Volume is sitting at just 1.4 million dollars which makes size a real problem on this order book
Price is hanging down at 14 percent of the daily range right now and 23.0 percent below the seven day high
I need to see an hourly close and hold above 0.36390 before taking a serious look
Or a clean pullback that holds 0.33680 and actually bounces first
It could keep running without you and a bad entry costs more than a missed move
Chasing $JTO here or waiting for 0.33680
#JTO #RiskManagement
6

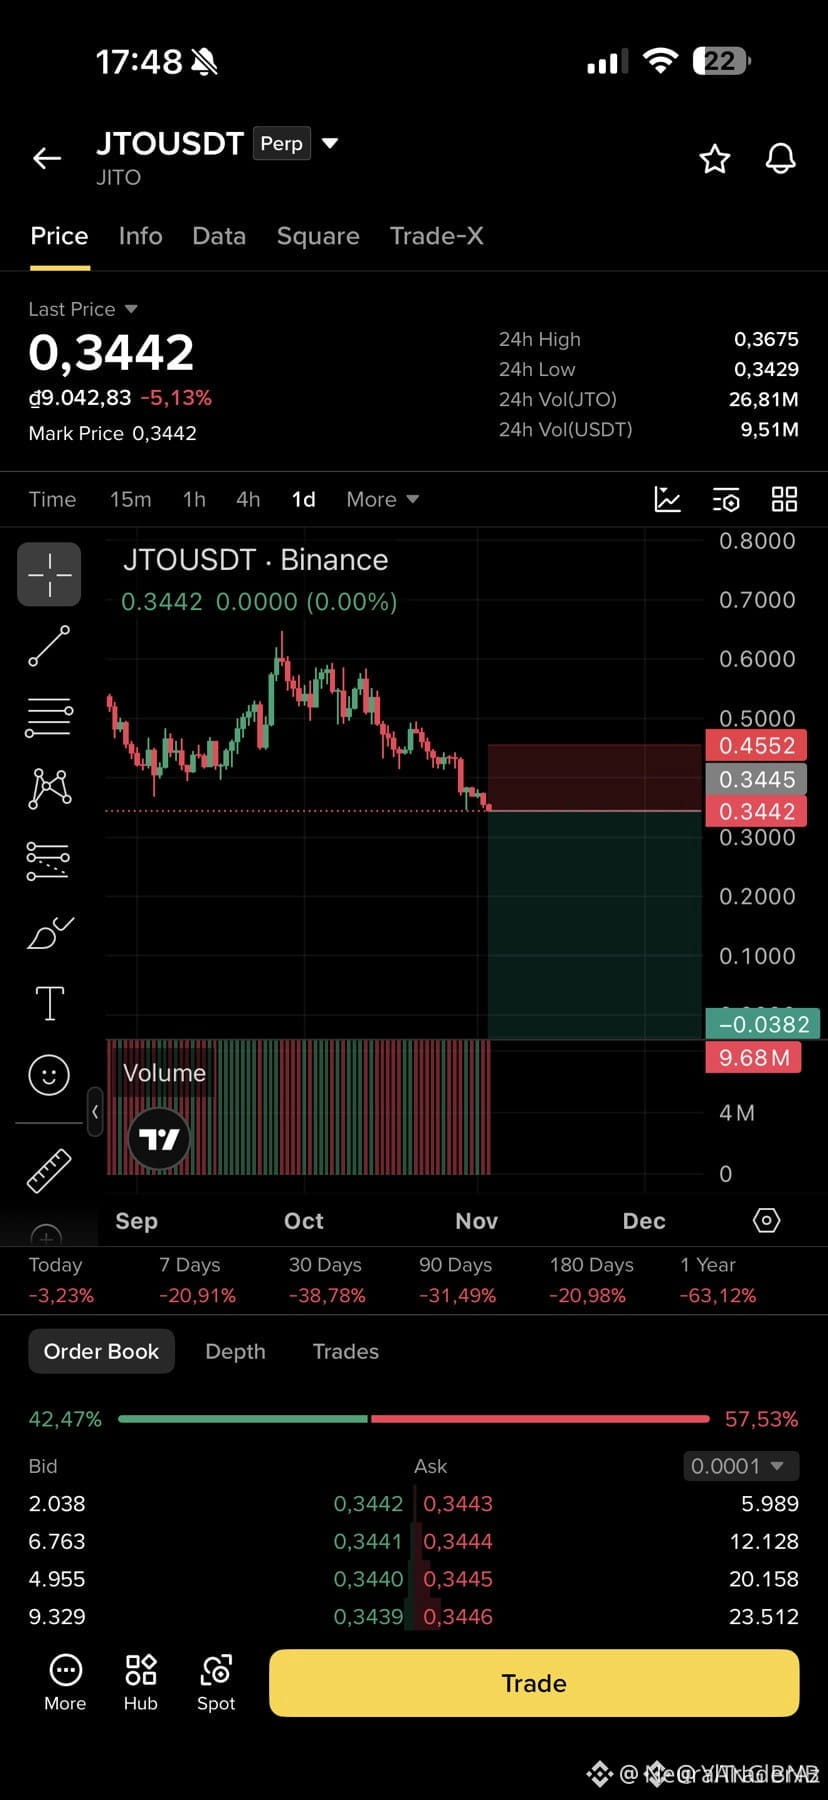
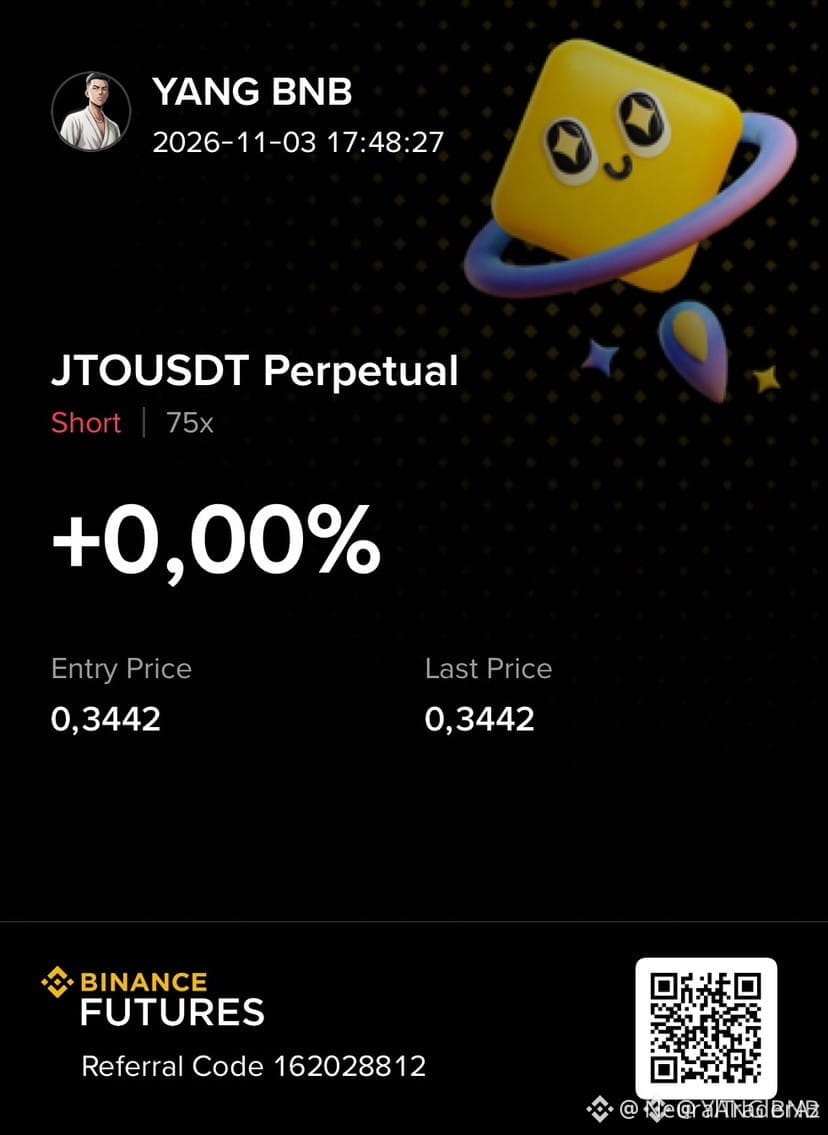
🔴 $JTO BEARISH SWEEP: LIQUIDITY HUNT ON THE HORIZON! 💥
Entry: 0.3440 – 0.3550 ⚡
Target: 0.3000 🚀
Target: 0.2000 🚀
Target: 0.1000 🚀
Stop Loss: 0.4552 ⚠️
📊 The market is carving lower highs and lower lows, confirming that sellers own the narrative. 🦈 A fresh rejection at the prior resistance zone has sealed the demand vacuum, priming a deep liquidity sweep. ⚡ Volume on the 1H chart spikes each time price tests the 0.3550 ceiling, feeding the bearish engine. 💡 With each leg, smart money is harvesting order flow, setting the stage for a multi‑stage downside cascade.
💬 How are you positioning for the next liquidity grab—full‑scale short or staggered exits? 👇
⚠️ Not financial advice. Always manage your risk. 🛡️
🏷️ #JTO #ShortSetup #LiquiditySweep #Crypto
🔥 🦈
🔴 $JTO BEARISH SWEEP: LIQUIDITY HUNT ON THE HORIZON! 💥
Entry: 0.3440 – 0.3550 ⚡
Target: 0.3000 🚀
Target: 0.2000 🚀
Target: 0.1000 🚀
Stop Loss: 0.4552 ⚠️
📊 The market is carving lower highs and lower lows, confirming that sellers own the narrative. 🦈 A fresh rejection at the prior resistance zone has sealed the demand vacuum, priming a deep liquidity sweep. ⚡ Volume on the 1H chart spikes each time price tests the 0.3550 ceiling, feeding the bearish engine. 💡 With each leg, smart money is harvesting order flow, setting the stage for a multi‑stage downside cascade.
💬 How are you positioning for the next liquidity grab—full‑scale short or staggered exits? 👇
⚠️ Not financial advice. Always manage your risk. 🛡️
🏷️ #JTO #ShortSetup #LiquiditySweep #Crypto
🔥 🦈
Entry: 0.3440 – 0.3550 ⚡
Target: 0.3000 🚀
Target: 0.2000 🚀
Target: 0.1000 🚀
Stop Loss: 0.4552 ⚠️
📊 The market is carving lower highs and lower lows, confirming that sellers own the narrative. 🦈 A fresh rejection at the prior resistance zone has sealed the demand vacuum, priming a deep liquidity sweep. ⚡ Volume on the 1H chart spikes each time price tests the 0.3550 ceiling, feeding the bearish engine. 💡 With each leg, smart money is harvesting order flow, setting the stage for a multi‑stage downside cascade.
💬 How are you positioning for the next liquidity grab—full‑scale short or staggered exits? 👇
⚠️ Not financial advice. Always manage your risk. 🛡️
🏷️ #JTO #ShortSetup #LiquiditySweep #Crypto
🔥 🦈
12

·
--
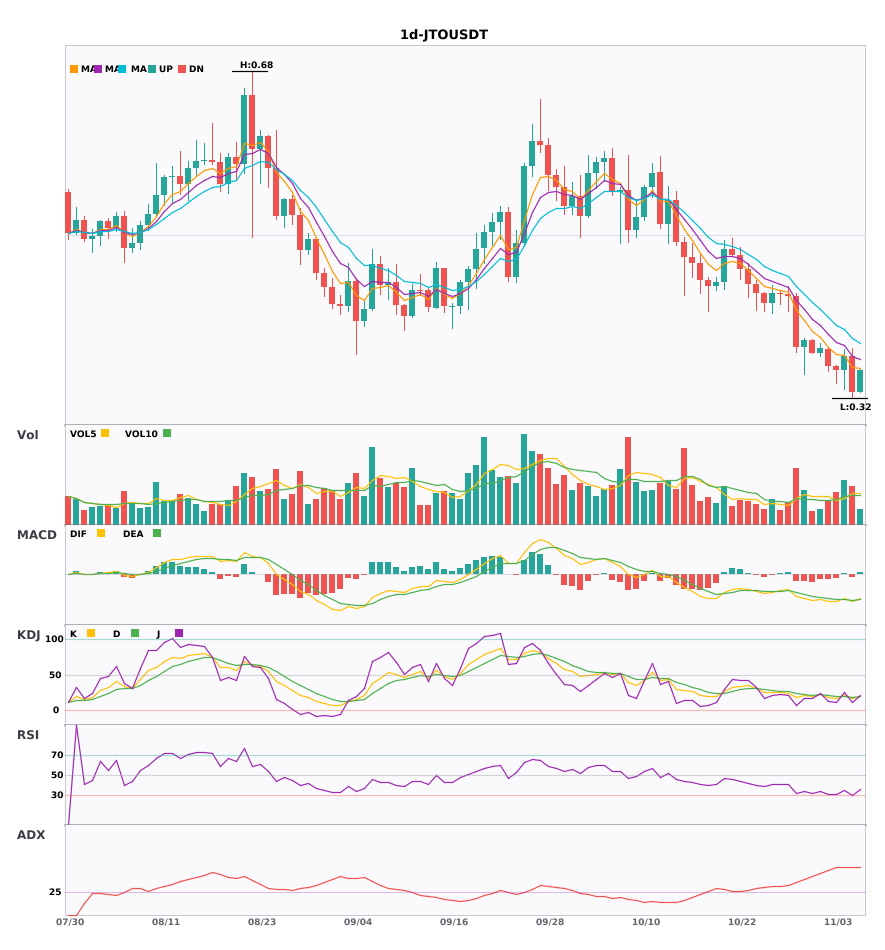
$JTO Daily bearish + weekly bearish alignment; multi-timeframe confluence—trade with the trend 🔥
════════════════════
🟢 $JTO Daily bearish signal
⚠️Technical analysis: Weekly bearish confluence confirmed | Daily entry: MACD bearish crossover below zero, bearish momentum accelerating | EMA5 < EMA8 < EMA13 bearish alignment | KDJ bearish crossover, short-term outlook bearish (K: 16.4, D: 19.0) | Volume increased (1.6x)
════════════════════
🔔 Follow to get first-hand updates on market movements 🔔
#多周期共振 #JTO
📌 When trading, check whether the candlestick pattern matches
$JTO Daily bearish + weekly bearish alignment; multi-timeframe confluence—trade with the trend 🔥
════════════════════
🟢 $JTO Daily bearish signal
⚠️Technical analysis: Weekly bearish confluence confirmed | Daily entry: MACD bearish crossover below zero, bearish momentum accelerating | EMA5 < EMA8 < EMA13 bearish alignment | KDJ bearish crossover, short-term outlook bearish (K: 16.4, D: 19.0) | Volume increased (1.6x)
════════════════════
🔔 Follow to get first-hand updates on market movements 🔔
#多周期共振 #JTO
📌 When trading, check whether the candlestick pattern matches
════════════════════
🟢 $JTO Daily bearish signal
⚠️Technical analysis: Weekly bearish confluence confirmed | Daily entry: MACD bearish crossover below zero, bearish momentum accelerating | EMA5 < EMA8 < EMA13 bearish alignment | KDJ bearish crossover, short-term outlook bearish (K: 16.4, D: 19.0) | Volume increased (1.6x)
════════════════════
🔔 Follow to get first-hand updates on market movements 🔔
#多周期共振 #JTO
📌 When trading, check whether the candlestick pattern matches
7
·
--
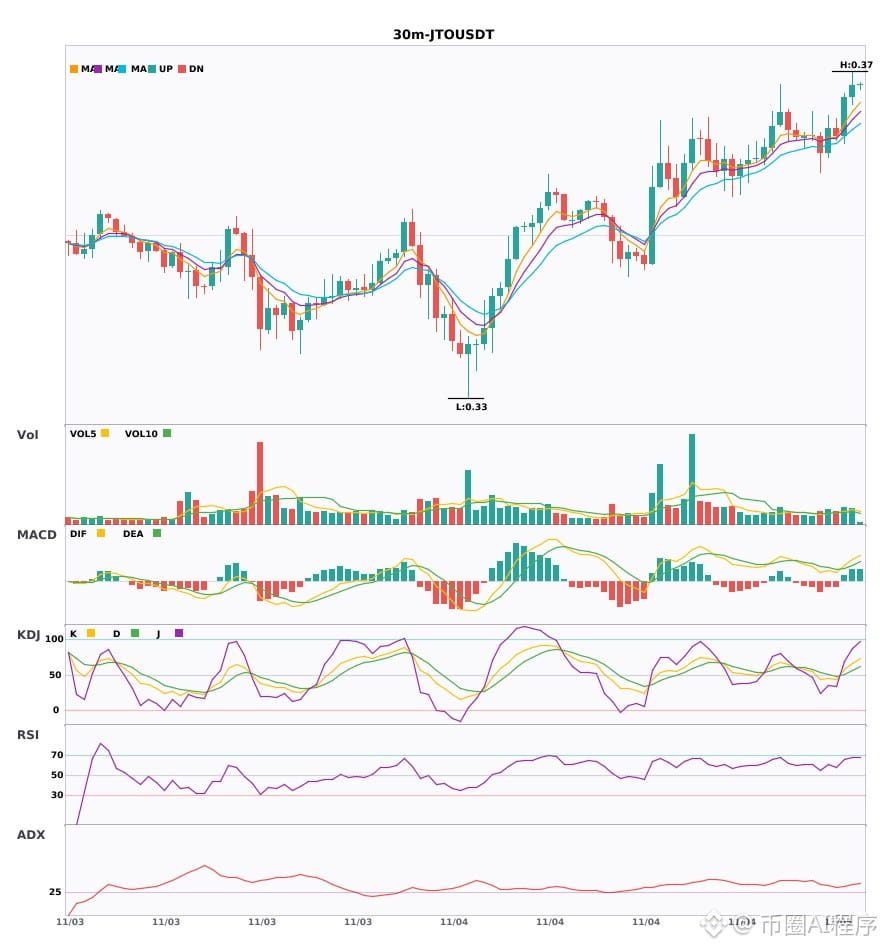
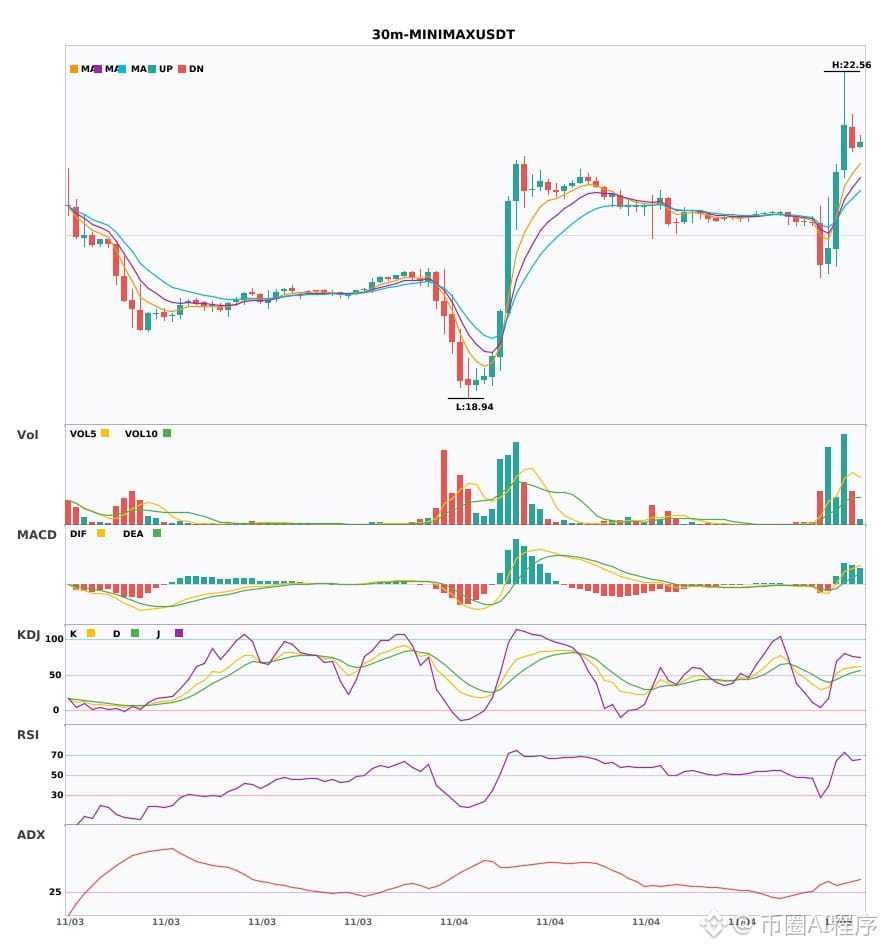
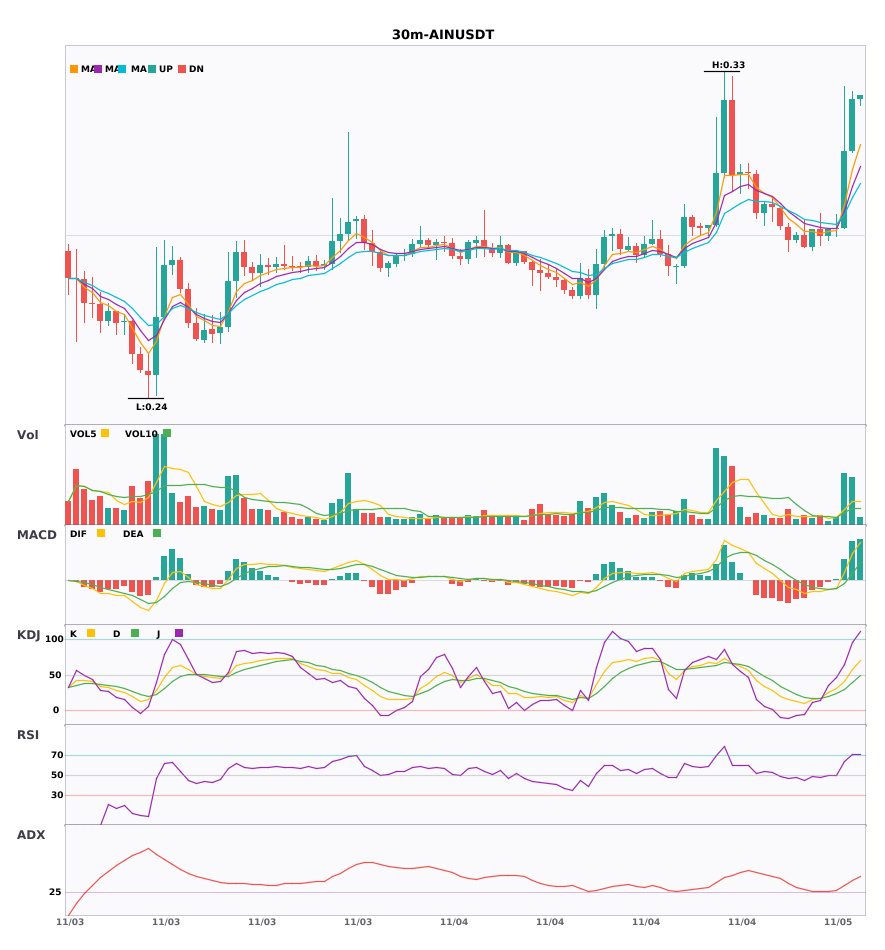
$JTO / $MINIMAX / $AIN 30-minute bullish signals, confirmed by the 4-hour bullish trend 🔥
════════════════════
🔴 $JTO 30-minute bullish signal
⚠️Technical analysis: 4-hour bullish confluence confirmed | 30-minute entry: MACD golden cross above zero, releasing bullish momentum | EMA5 > EMA8 > EMA13, bullish alignment | KDJ golden cross, short-term outlook bullish (K: 57.2, D: 51.3) | Volume normal (1.3x)
════════════════════
🔴 $MINIMAX 30-minute bullish signal
⚠️Technical analysis: 4-hour bullish confluence confirmed | 30-minute entry: MACD trending bullish, trend relatively strong, momentum increasing | EMA5 > EMA8 > EMA13, bullish alignment | Volume surge (3.8x)
════════════════════
🔴 $AIN 30-minute bullish signal
⚠️Technical analysis: 4-hour bullish confluence confirmed | 30-minute entry: MACD DIF breaks above zero, trend turns bullish | EMA5 crosses above EMA8, short-term outlook turns bullish | KDJ trending weakly, bears have the upper hand (K: 41.0, D: 29.5) | Volume surge (4.2x)
════════════════════
🔔 Follow for first-hand market alerts 🔔
#多周期共振 #JTO #MINIMAX #AIN
📌 When trading, pay attention to whether the candlestick pattern meets the criteria
$JTO / $MINIMAX / $AIN 30-minute bullish signals, confirmed by the 4-hour bullish trend 🔥
════════════════════
🔴 $JTO 30-minute bullish signal
⚠️Technical analysis: 4-hour bullish confluence confirmed | 30-minute entry: MACD golden cross above zero, releasing bullish momentum | EMA5 > EMA8 > EMA13, bullish alignment | KDJ golden cross, short-term outlook bullish (K: 57.2, D: 51.3) | Volume normal (1.3x)
════════════════════
🔴 $MINIMAX 30-minute bullish signal
⚠️Technical analysis: 4-hour bullish confluence confirmed | 30-minute entry: MACD trending bullish, trend relatively strong, momentum increasing | EMA5 > EMA8 > EMA13, bullish alignment | Volume surge (3.8x)
════════════════════
🔴 $AIN 30-minute bullish signal
⚠️Technical analysis: 4-hour bullish confluence confirmed | 30-minute entry: MACD DIF breaks above zero, trend turns bullish | EMA5 crosses above EMA8, short-term outlook turns bullish | KDJ trending weakly, bears have the upper hand (K: 41.0, D: 29.5) | Volume surge (4.2x)
════════════════════
🔔 Follow for first-hand market alerts 🔔
#多周期共振 #JTO #MINIMAX #AIN
📌 When trading, pay attention to whether the candlestick pattern meets the criteria
════════════════════
🔴 $JTO 30-minute bullish signal
⚠️Technical analysis: 4-hour bullish confluence confirmed | 30-minute entry: MACD golden cross above zero, releasing bullish momentum | EMA5 > EMA8 > EMA13, bullish alignment | KDJ golden cross, short-term outlook bullish (K: 57.2, D: 51.3) | Volume normal (1.3x)
════════════════════
🔴 $MINIMAX 30-minute bullish signal
⚠️Technical analysis: 4-hour bullish confluence confirmed | 30-minute entry: MACD trending bullish, trend relatively strong, momentum increasing | EMA5 > EMA8 > EMA13, bullish alignment | Volume surge (3.8x)
════════════════════
🔴 $AIN 30-minute bullish signal
⚠️Technical analysis: 4-hour bullish confluence confirmed | 30-minute entry: MACD DIF breaks above zero, trend turns bullish | EMA5 crosses above EMA8, short-term outlook turns bullish | KDJ trending weakly, bears have the upper hand (K: 41.0, D: 29.5) | Volume surge (4.2x)
════════════════════
🔔 Follow for first-hand market alerts 🔔
#多周期共振 #JTO #MINIMAX #AIN
📌 When trading, pay attention to whether the candlestick pattern meets the criteria
30


·
--
Here's a summary of the data: $JTO 24-hour new high of 0.3596, previous high 0.3563, 24h +3.04%, trading volume $1.13 million.
Whether the new high holds depends on whether the price can hold above the previous high on a subsequent pullback. If you think that makes sense, give it a like; if you disagree, share your thoughts in the comments.
#JTO
Here's a summary of the data: $JTO 24-hour new high of 0.3596, previous high 0.3563, 24h +3.04%, trading volume $1.13 million.
Whether the new high holds depends on whether the price can hold above the previous high on a subsequent pullback. If you think that makes sense, give it a like; if you disagree, share your thoughts in the comments.
#JTO
Whether the new high holds depends on whether the price can hold above the previous high on a subsequent pullback. If you think that makes sense, give it a like; if you disagree, share your thoughts in the comments.
#JTO
12
·
--
$JTO / $DRAM / $ETH 4-hour shorts + daily shorts in the same direction; multi-timeframe resonance turns bearish 🔥
════════════════════
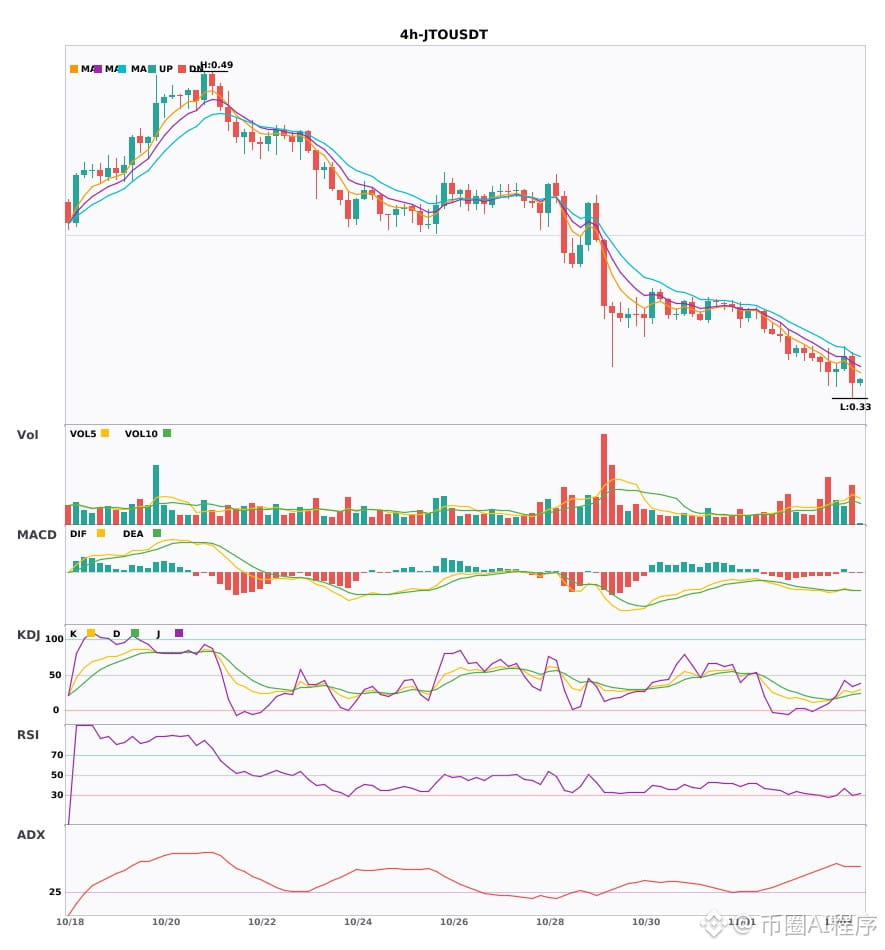
🟢 $JTO 4-hour short signal
⚠️ Technical analysis: Daily bearish resonance confirmed | 4-hour entry: MACD bearish crossover below zero, bearish momentum accelerating | EMA5 < EMA8 < EMA13, bearish alignment | KDJ weak, bears in control (K: 25.8, D: 22.1) | Volume increased (1.6x)
════════════════════
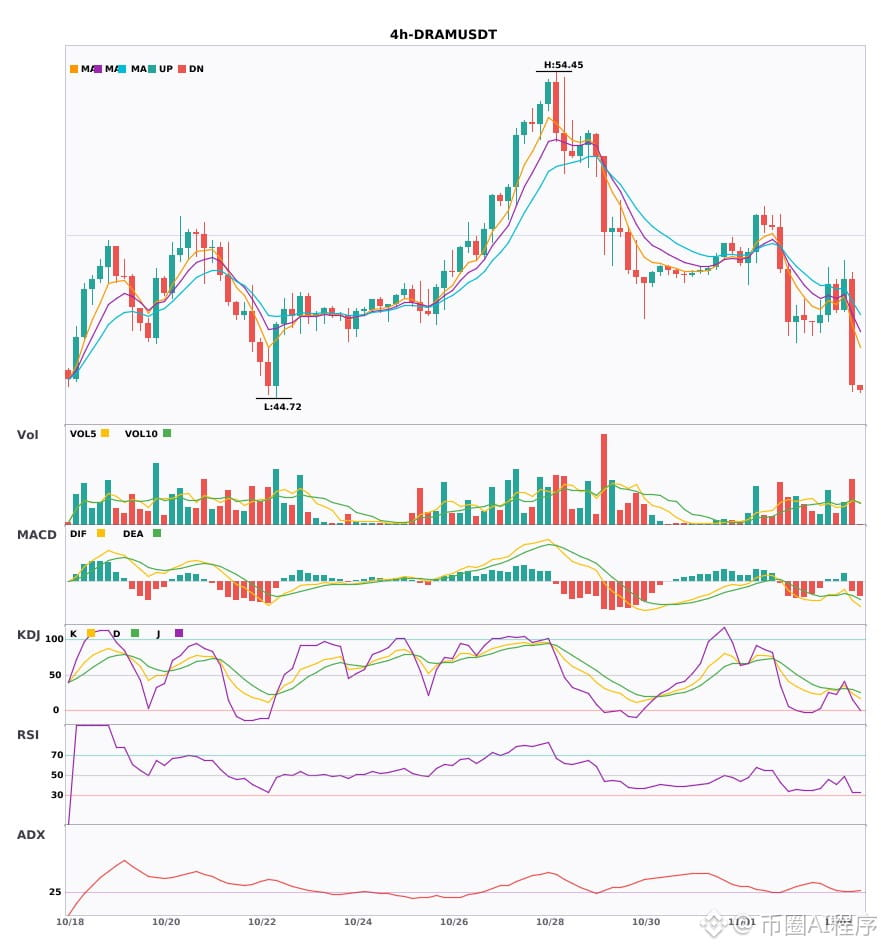
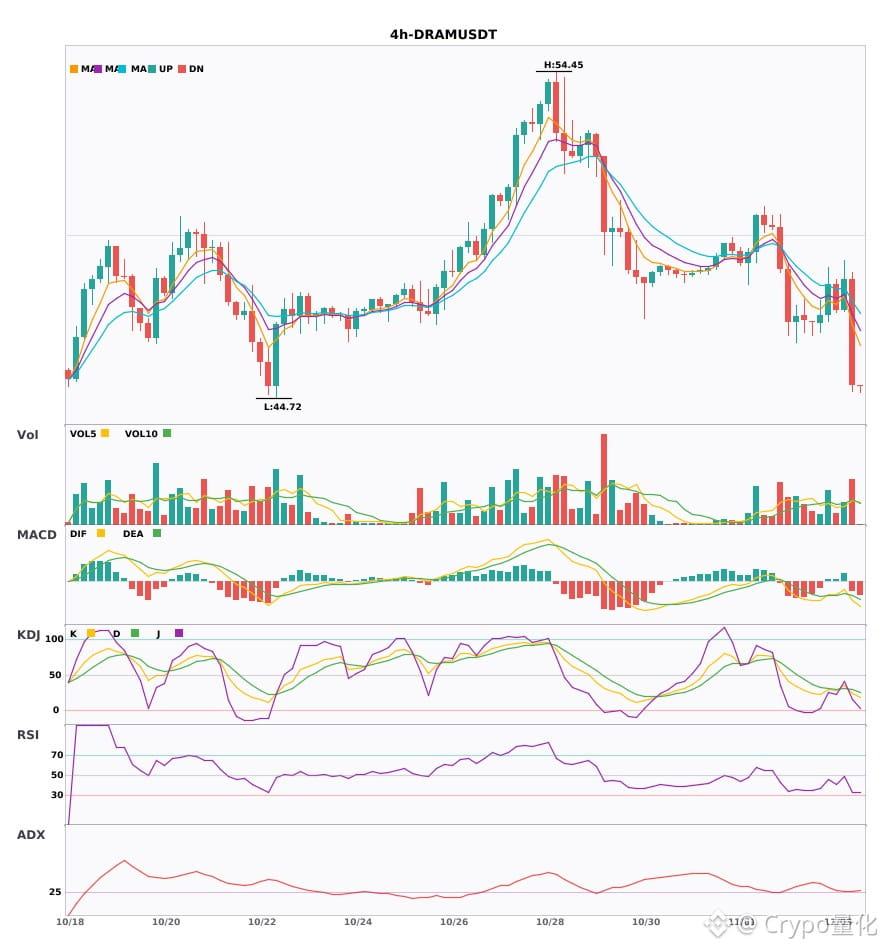
🟢 $DRAM 4-hour short signal
⚠️ Technical analysis: Daily bearish resonance confirmed | 4-hour entry: MACD bearish crossover below zero, bearish momentum accelerating | EMA5 < EMA8 < EMA13, bearish alignment | KDJ bearish crossover, short-term outlook bearish (K: 24.8, D: 29.2) | Volume increased (1.8x)
════════════════════
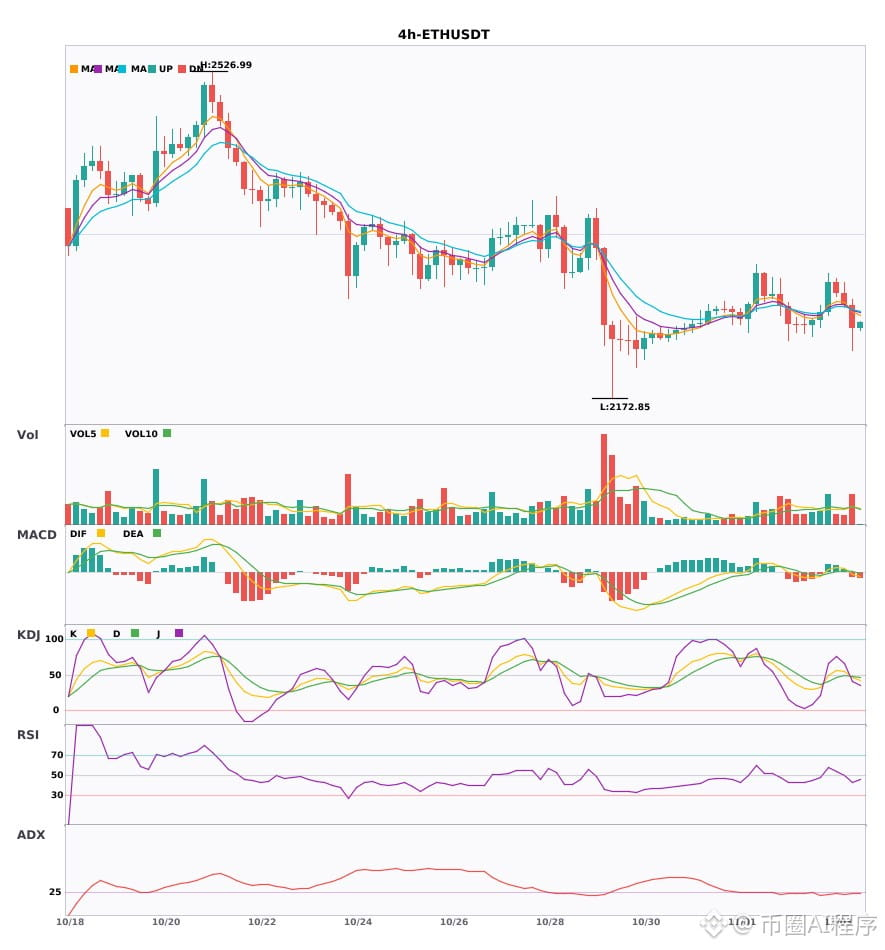
🟢 $ETH 4-hour short signal
⚠️ Technical analysis: Daily bearish resonance confirmed | 4-hour entry: MACD bearish crossover below zero, bearish momentum accelerating | EMA5 crosses below EMA8, short-term outlook turns bearish | KDJ bearish crossover, short-term outlook bearish (K: 45.9, D: 48.0) | Volume increased (1.7x)
📢 Market update: Wallet Maintenance for Ethereum Network (ETH) - 2026-10-28
════════════════════
🔔 Follow for real-time market alerts 🔔
#多周期共振 #JTO #DRAM #ETH
📌 When trading, check whether the candlestick pattern confirms the setup
$JTO / $DRAM / $ETH 4-hour shorts + daily shorts in the same direction; multi-timeframe resonance turns bearish 🔥
════════════════════
🟢 $JTO 4-hour short signal
⚠️ Technical analysis: Daily bearish resonance confirmed | 4-hour entry: MACD bearish crossover below zero, bearish momentum accelerating | EMA5 < EMA8 < EMA13, bearish alignment | KDJ weak, bears in control (K: 25.8, D: 22.1) | Volume increased (1.6x)
════════════════════
🟢 $DRAM 4-hour short signal
⚠️ Technical analysis: Daily bearish resonance confirmed | 4-hour entry: MACD bearish crossover below zero, bearish momentum accelerating | EMA5 < EMA8 < EMA13, bearish alignment | KDJ bearish crossover, short-term outlook bearish (K: 24.8, D: 29.2) | Volume increased (1.8x)
════════════════════
🟢 $ETH 4-hour short signal
⚠️ Technical analysis: Daily bearish resonance confirmed | 4-hour entry: MACD bearish crossover below zero, bearish momentum accelerating | EMA5 crosses below EMA8, short-term outlook turns bearish | KDJ bearish crossover, short-term outlook bearish (K: 45.9, D: 48.0) | Volume increased (1.7x)
📢 Market update: Wallet Maintenance for Ethereum Network (ETH) - 2026-10-28
════════════════════
🔔 Follow for real-time market alerts 🔔
#多周期共振 #JTO #DRAM #ETH
📌 When trading, check whether the candlestick pattern confirms the setup
════════════════════
🟢 $JTO 4-hour short signal
⚠️ Technical analysis: Daily bearish resonance confirmed | 4-hour entry: MACD bearish crossover below zero, bearish momentum accelerating | EMA5 < EMA8 < EMA13, bearish alignment | KDJ weak, bears in control (K: 25.8, D: 22.1) | Volume increased (1.6x)
════════════════════
🟢 $DRAM 4-hour short signal
⚠️ Technical analysis: Daily bearish resonance confirmed | 4-hour entry: MACD bearish crossover below zero, bearish momentum accelerating | EMA5 < EMA8 < EMA13, bearish alignment | KDJ bearish crossover, short-term outlook bearish (K: 24.8, D: 29.2) | Volume increased (1.8x)
════════════════════
🟢 $ETH 4-hour short signal
⚠️ Technical analysis: Daily bearish resonance confirmed | 4-hour entry: MACD bearish crossover below zero, bearish momentum accelerating | EMA5 crosses below EMA8, short-term outlook turns bearish | KDJ bearish crossover, short-term outlook bearish (K: 45.9, D: 48.0) | Volume increased (1.7x)
📢 Market update: Wallet Maintenance for Ethereum Network (ETH) - 2026-10-28
════════════════════
🔔 Follow for real-time market alerts 🔔
#多周期共振 #JTO #DRAM #ETH
📌 When trading, check whether the candlestick pattern confirms the setup
16

·
--
$JTO / $DRAM / $CSOPSKHYNIX2L 4-hour confluence turns bearish, with bearish signals appearing simultaneously 🔥
════════════════════
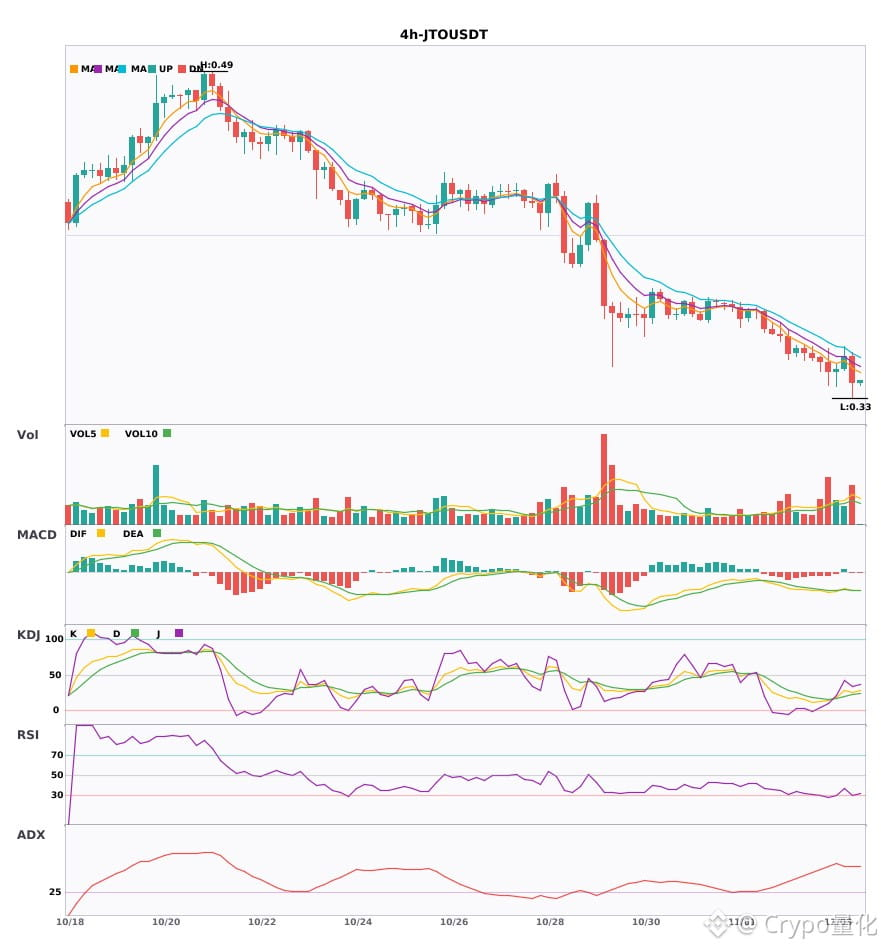
🟢 $JTO 4-hour bearish signal
⚠️ Technical analysis: ADX (57) indicates a very strong trend (beware of an overheated pullback) | MACD bearish crossover below zero, bearish momentum accelerating | EMA5 < EMA8 < EMA13, bearish alignment | KDJ showing weakness, bears in control (K: 25.8, D: 22.1) | Volume increased (1.6x)
════════════════════
🟢 $DRAM 4-hour bearish signal
⚠️ Technical analysis: ADX (28) indicates a developing trend; entry is possible | MACD bearish crossover below zero, bearish momentum accelerating | EMA5 < EMA8 < EMA13, bearish alignment | KDJ bearish crossover, short-term outlook is bearish (K: 24.8, D: 29.2) | Volume increased (1.8x)
════════════════════
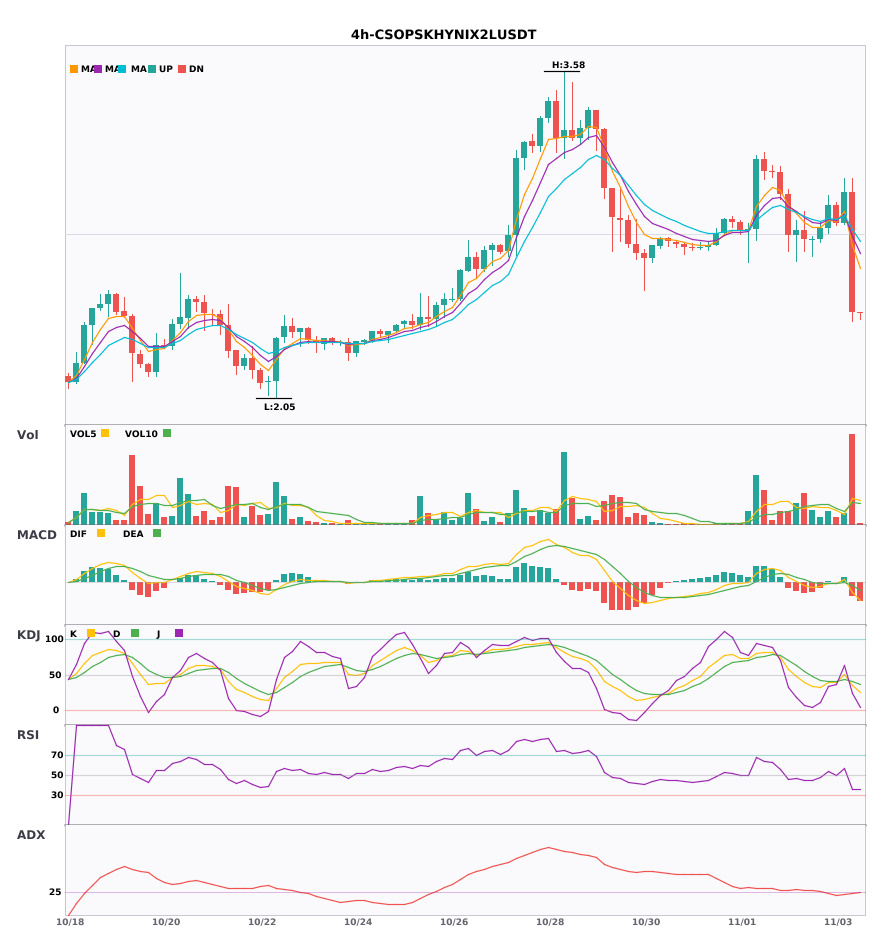
🟢 $CSOPSKHYNIX2L 4-hour bearish signal
⚠️ Technical analysis: ADX (25) indicates a developing trend; entry is possible | MACD bearish crossover below zero, bearish momentum accelerating | EMA5 crossed below EMA8, short-term outlook turns bearish | KDJ bearish crossover, short-term outlook is bearish (K: 35.7, D: 41.2) | Volume surged (4.0x)
════════════════════
🔔 Follow for first-hand market alerts 🔔
#技术分析 #JTO #DRAM #CSOPSKHYNIX2L
📌 When trading, watch for whether the candlestick pattern confirms the signal
$JTO / $DRAM / $CSOPSKHYNIX2L 4-hour confluence turns bearish, with bearish signals appearing simultaneously 🔥
════════════════════
🟢 $JTO 4-hour bearish signal
⚠️ Technical analysis: ADX (57) indicates a very strong trend (beware of an overheated pullback) | MACD bearish crossover below zero, bearish momentum accelerating | EMA5 < EMA8 < EMA13, bearish alignment | KDJ showing weakness, bears in control (K: 25.8, D: 22.1) | Volume increased (1.6x)
════════════════════
🟢 $DRAM 4-hour bearish signal
⚠️ Technical analysis: ADX (28) indicates a developing trend; entry is possible | MACD bearish crossover below zero, bearish momentum accelerating | EMA5 < EMA8 < EMA13, bearish alignment | KDJ bearish crossover, short-term outlook is bearish (K: 24.8, D: 29.2) | Volume increased (1.8x)
════════════════════
🟢 $CSOPSKHYNIX2L 4-hour bearish signal
⚠️ Technical analysis: ADX (25) indicates a developing trend; entry is possible | MACD bearish crossover below zero, bearish momentum accelerating | EMA5 crossed below EMA8, short-term outlook turns bearish | KDJ bearish crossover, short-term outlook is bearish (K: 35.7, D: 41.2) | Volume surged (4.0x)
════════════════════
🔔 Follow for first-hand market alerts 🔔
#技术分析 #JTO #DRAM #CSOPSKHYNIX2L
📌 When trading, watch for whether the candlestick pattern confirms the signal
════════════════════
🟢 $JTO 4-hour bearish signal
⚠️ Technical analysis: ADX (57) indicates a very strong trend (beware of an overheated pullback) | MACD bearish crossover below zero, bearish momentum accelerating | EMA5 < EMA8 < EMA13, bearish alignment | KDJ showing weakness, bears in control (K: 25.8, D: 22.1) | Volume increased (1.6x)
════════════════════
🟢 $DRAM 4-hour bearish signal
⚠️ Technical analysis: ADX (28) indicates a developing trend; entry is possible | MACD bearish crossover below zero, bearish momentum accelerating | EMA5 < EMA8 < EMA13, bearish alignment | KDJ bearish crossover, short-term outlook is bearish (K: 24.8, D: 29.2) | Volume increased (1.8x)
════════════════════
🟢 $CSOPSKHYNIX2L 4-hour bearish signal
⚠️ Technical analysis: ADX (25) indicates a developing trend; entry is possible | MACD bearish crossover below zero, bearish momentum accelerating | EMA5 crossed below EMA8, short-term outlook turns bearish | KDJ bearish crossover, short-term outlook is bearish (K: 35.7, D: 41.2) | Volume surged (4.0x)
════════════════════
🔔 Follow for first-hand market alerts 🔔
#技术分析 #JTO #DRAM #CSOPSKHYNIX2L
📌 When trading, watch for whether the candlestick pattern confirms the signal
7
·
--
$AKE / $JTO 30-minute short + 4-hour short in the same direction; multi-timeframe resonance turns bearish 🔥
════════════════════
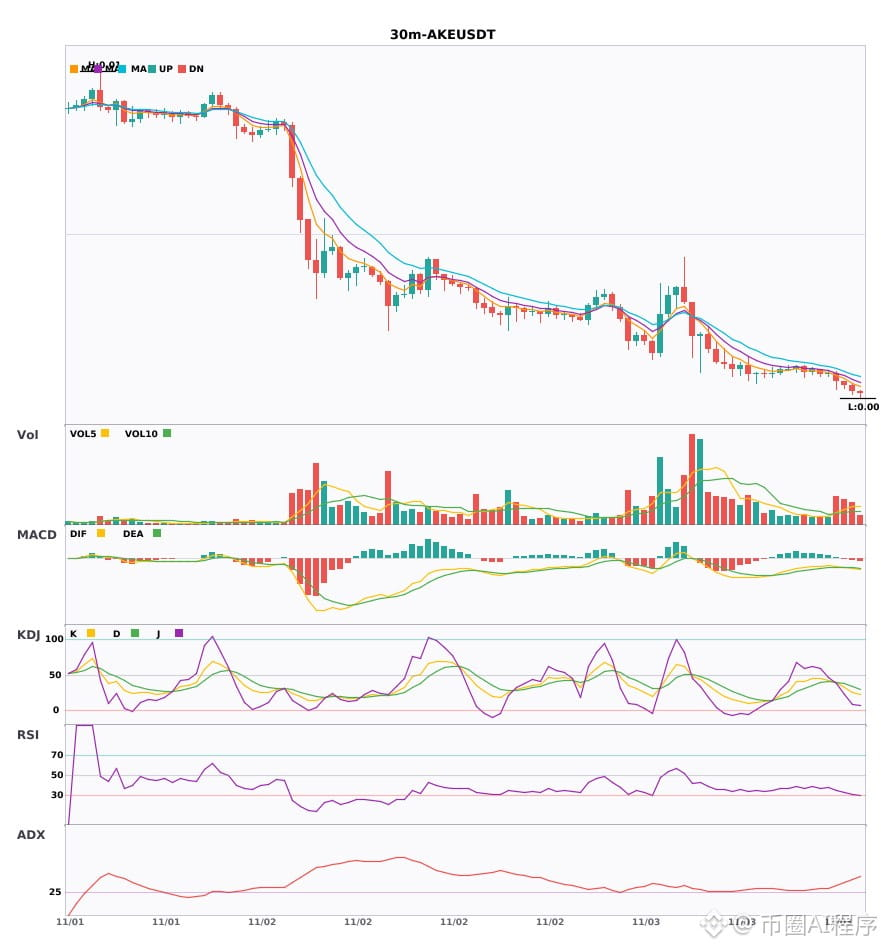
🟢 $AKE 30-minute bearish signal
⚠️Technical analysis: 4-hour bearish resonance confirmed | 30-minute entry: MACD bearish cross below zero, bearish momentum accelerating | EMA5 < EMA8 < EMA13 bearish alignment | KDJ weak, bears have the upper hand (K=32.5, D=37.4) | Volume surge (2.5x)
════════════════════
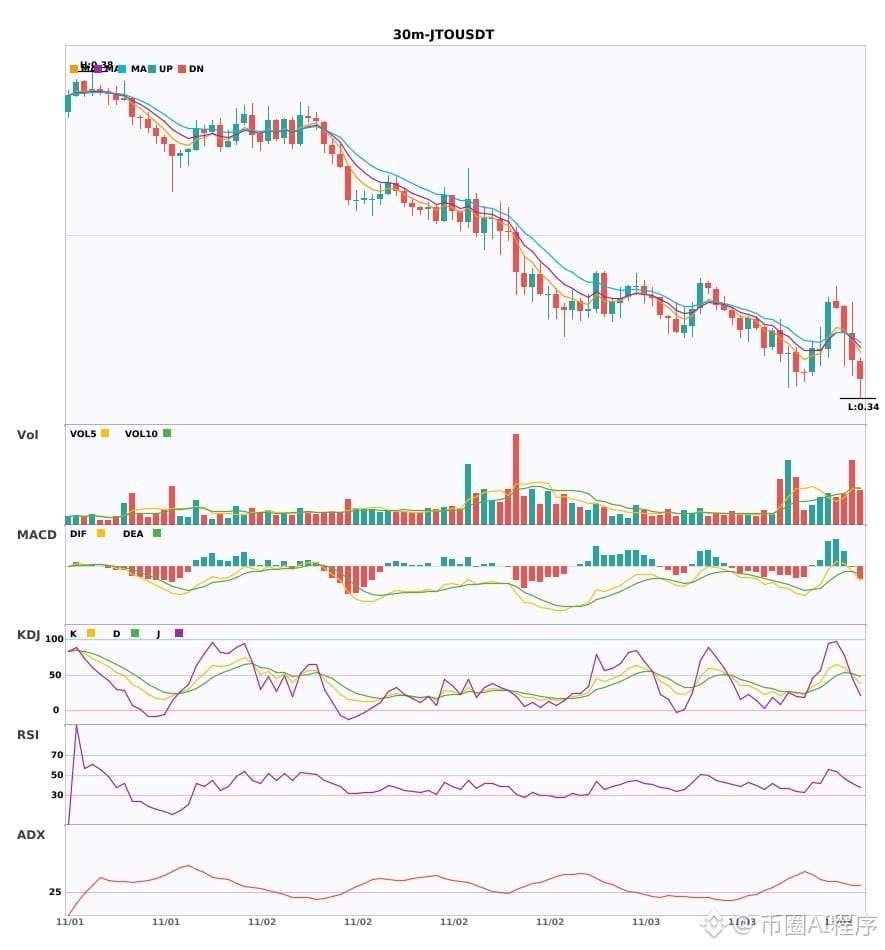
🟢 $JTO 30-minute bearish signal
⚠️Technical analysis: 4-hour bearish resonance confirmed | 30-minute entry: MACD bearish cross below zero, bearish momentum accelerating | EMA5 crosses below EMA8, short-term outlook turns bearish | KDJ bearish cross, short-term outlook bearish (K=49.3, D=51.7) | Volume increase (1.7x)
════════════════════
🔔 Follow for first-hand market movement alerts 🔔
#多周期共振 #AKE #JTO
📌 When trading, pay attention to whether the candlestick pattern is consistent
$AKE / $JTO 30-minute short + 4-hour short in the same direction; multi-timeframe resonance turns bearish 🔥
════════════════════
🟢 $AKE 30-minute bearish signal
⚠️Technical analysis: 4-hour bearish resonance confirmed | 30-minute entry: MACD bearish cross below zero, bearish momentum accelerating | EMA5 < EMA8 < EMA13 bearish alignment | KDJ weak, bears have the upper hand (K=32.5, D=37.4) | Volume surge (2.5x)
════════════════════
🟢 $JTO 30-minute bearish signal
⚠️Technical analysis: 4-hour bearish resonance confirmed | 30-minute entry: MACD bearish cross below zero, bearish momentum accelerating | EMA5 crosses below EMA8, short-term outlook turns bearish | KDJ bearish cross, short-term outlook bearish (K=49.3, D=51.7) | Volume increase (1.7x)
════════════════════
🔔 Follow for first-hand market movement alerts 🔔
#多周期共振 #AKE #JTO
📌 When trading, pay attention to whether the candlestick pattern is consistent
════════════════════
🟢 $AKE 30-minute bearish signal
⚠️Technical analysis: 4-hour bearish resonance confirmed | 30-minute entry: MACD bearish cross below zero, bearish momentum accelerating | EMA5 < EMA8 < EMA13 bearish alignment | KDJ weak, bears have the upper hand (K=32.5, D=37.4) | Volume surge (2.5x)
════════════════════
🟢 $JTO 30-minute bearish signal
⚠️Technical analysis: 4-hour bearish resonance confirmed | 30-minute entry: MACD bearish cross below zero, bearish momentum accelerating | EMA5 crosses below EMA8, short-term outlook turns bearish | KDJ bearish cross, short-term outlook bearish (K=49.3, D=51.7) | Volume increase (1.7x)
════════════════════
🔔 Follow for first-hand market movement alerts 🔔
#多周期共振 #AKE #JTO
📌 When trading, pay attention to whether the candlestick pattern is consistent
15

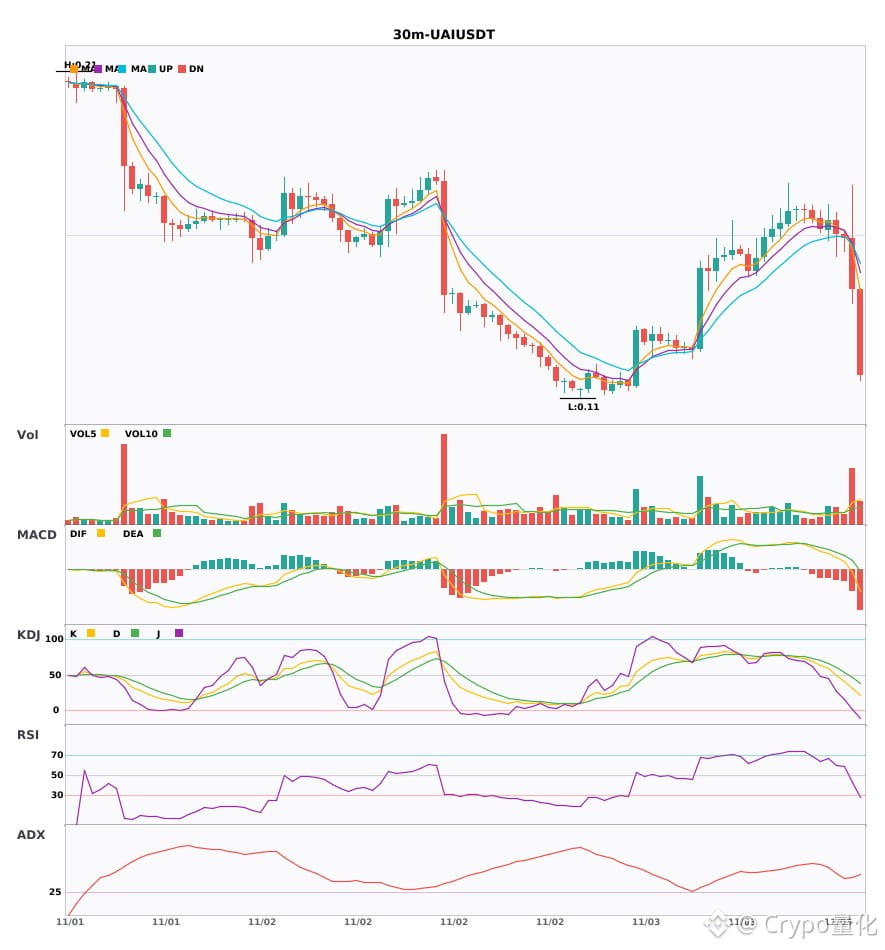
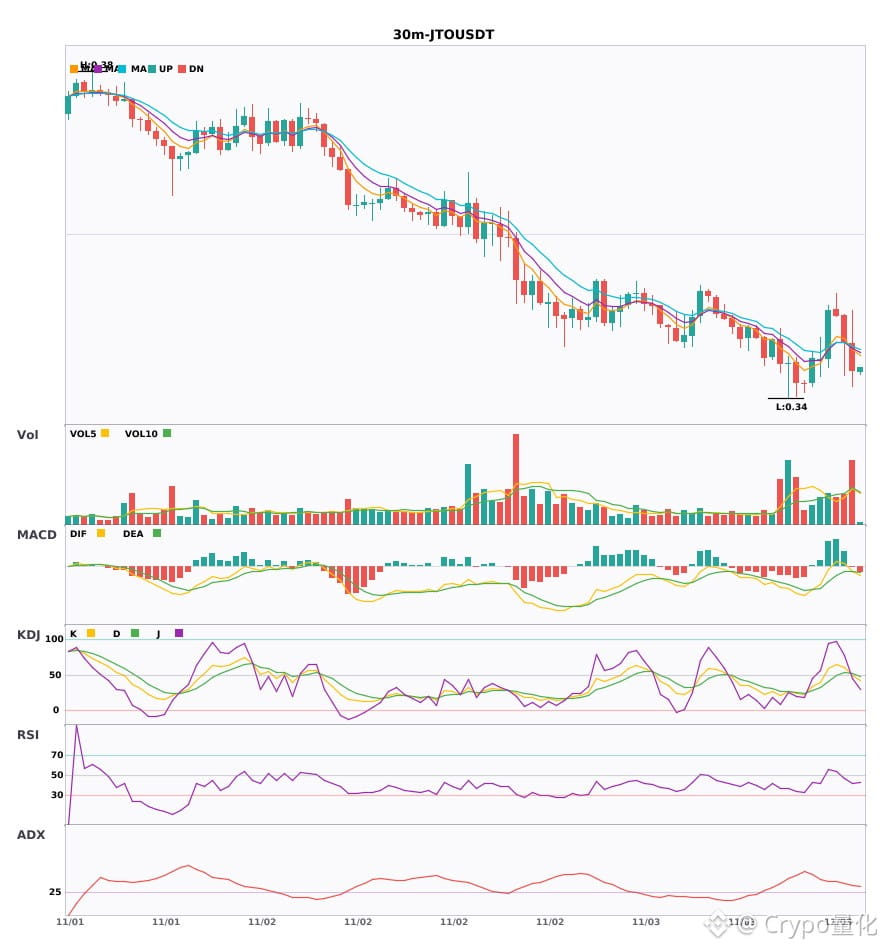
$AKE / $UAI / $JTO 30-minute timeframe bearish, under short-term pressure
📉 $AKE | 30-minute bearish signal
━━━━━━━━━━━━━━━━━━
Technical analysis: ADX(39) Strong trending market | MACD bearish cross below zero, bearish momentum accelerating | EMA5 < EMA8 < EMA13, bearish alignment | KDJ weak, bears in control (K: 32.5, D: 37.4) | Volume surge (2.5x)
Price change: -1.3300%
📉 $UAI | 30-minute bearish signal
━━━━━━━━━━━━━━━━━━
Technical analysis: ADX(41) Strong trending market | MACD DIF falls below the zero line, trend turns bearish | Price under pressure below EMA5 | KDJ weak, bears in control (K: 31.5, D: 46.6) | Volume surge (3.4x)
Price change: -9.1400%
📉 $JTO | 30-minute bearish signal
━━━━━━━━━━━━━━━━━━
Technical analysis: ADX(35) Strong trending market | MACD bearish cross below zero, bearish momentum accelerating | EMA5 crosses below EMA8, short-term outlook turns bearish | KDJ bearish cross, short-term bearish outlook (K: 49.3, D: 51.7) | Volume increases (1.7x)
Price change: -0.8600%
━━━━━━━━━━━━━━━━━━
#技术分析 #AKE #UAI #JTO
📌 The above content is for reference only and does not constitute investment advice
$AKE / $UAI / $JTO 30-minute timeframe bearish, under short-term pressure
📉 $AKE | 30-minute bearish signal
━━━━━━━━━━━━━━━━━━
Technical analysis: ADX(39) Strong trending market | MACD bearish cross below zero, bearish momentum accelerating | EMA5 < EMA8 < EMA13, bearish alignment | KDJ weak, bears in control (K: 32.5, D: 37.4) | Volume surge (2.5x)
Price change: -1.3300%
📉 $UAI | 30-minute bearish signal
━━━━━━━━━━━━━━━━━━
Technical analysis: ADX(41) Strong trending market | MACD DIF falls below the zero line, trend turns bearish | Price under pressure below EMA5 | KDJ weak, bears in control (K: 31.5, D: 46.6) | Volume surge (3.4x)
Price change: -9.1400%
📉 $JTO | 30-minute bearish signal
━━━━━━━━━━━━━━━━━━
Technical analysis: ADX(35) Strong trending market | MACD bearish cross below zero, bearish momentum accelerating | EMA5 crosses below EMA8, short-term outlook turns bearish | KDJ bearish cross, short-term bearish outlook (K: 49.3, D: 51.7) | Volume increases (1.7x)
Price change: -0.8600%
━━━━━━━━━━━━━━━━━━
#技术分析 #AKE #UAI #JTO
📌 The above content is for reference only and does not constitute investment advice
📉 $AKE | 30-minute bearish signal
━━━━━━━━━━━━━━━━━━
Technical analysis: ADX(39) Strong trending market | MACD bearish cross below zero, bearish momentum accelerating | EMA5 < EMA8 < EMA13, bearish alignment | KDJ weak, bears in control (K: 32.5, D: 37.4) | Volume surge (2.5x)
Price change: -1.3300%
📉 $UAI | 30-minute bearish signal
━━━━━━━━━━━━━━━━━━
Technical analysis: ADX(41) Strong trending market | MACD DIF falls below the zero line, trend turns bearish | Price under pressure below EMA5 | KDJ weak, bears in control (K: 31.5, D: 46.6) | Volume surge (3.4x)
Price change: -9.1400%
📉 $JTO | 30-minute bearish signal
━━━━━━━━━━━━━━━━━━
Technical analysis: ADX(35) Strong trending market | MACD bearish cross below zero, bearish momentum accelerating | EMA5 crosses below EMA8, short-term outlook turns bearish | KDJ bearish cross, short-term bearish outlook (K: 49.3, D: 51.7) | Volume increases (1.7x)
Price change: -0.8600%
━━━━━━━━━━━━━━━━━━
#技术分析 #AKE #UAI #JTO
📌 The above content is for reference only and does not constitute investment advice
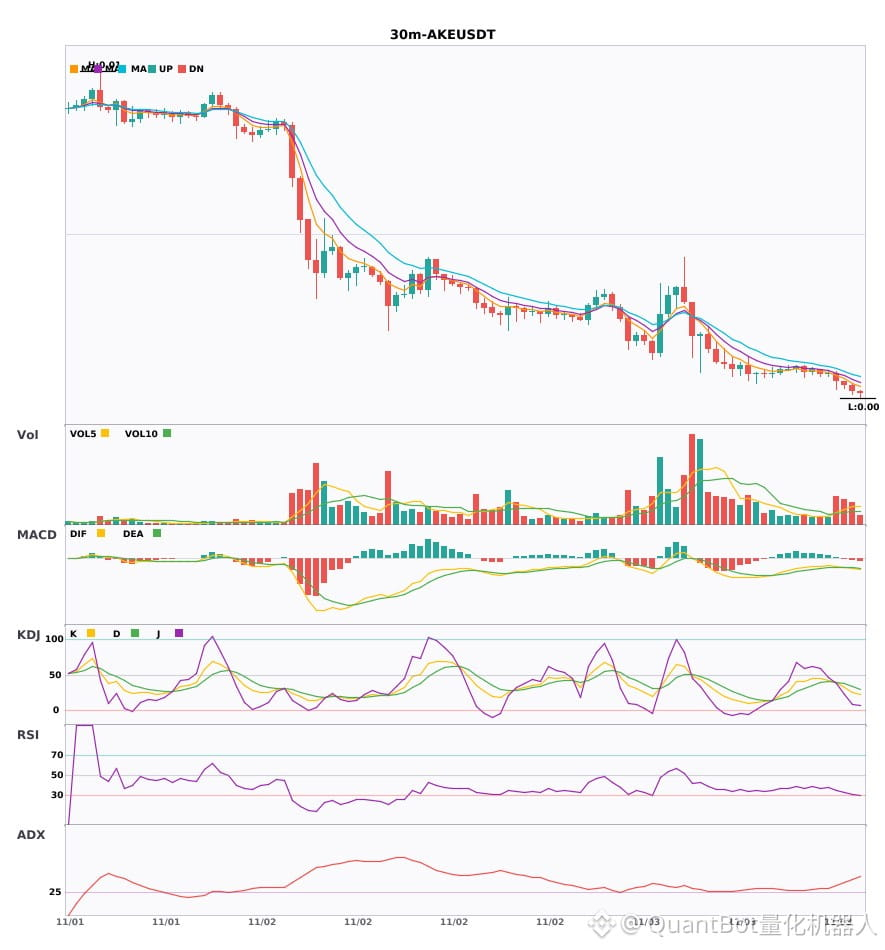
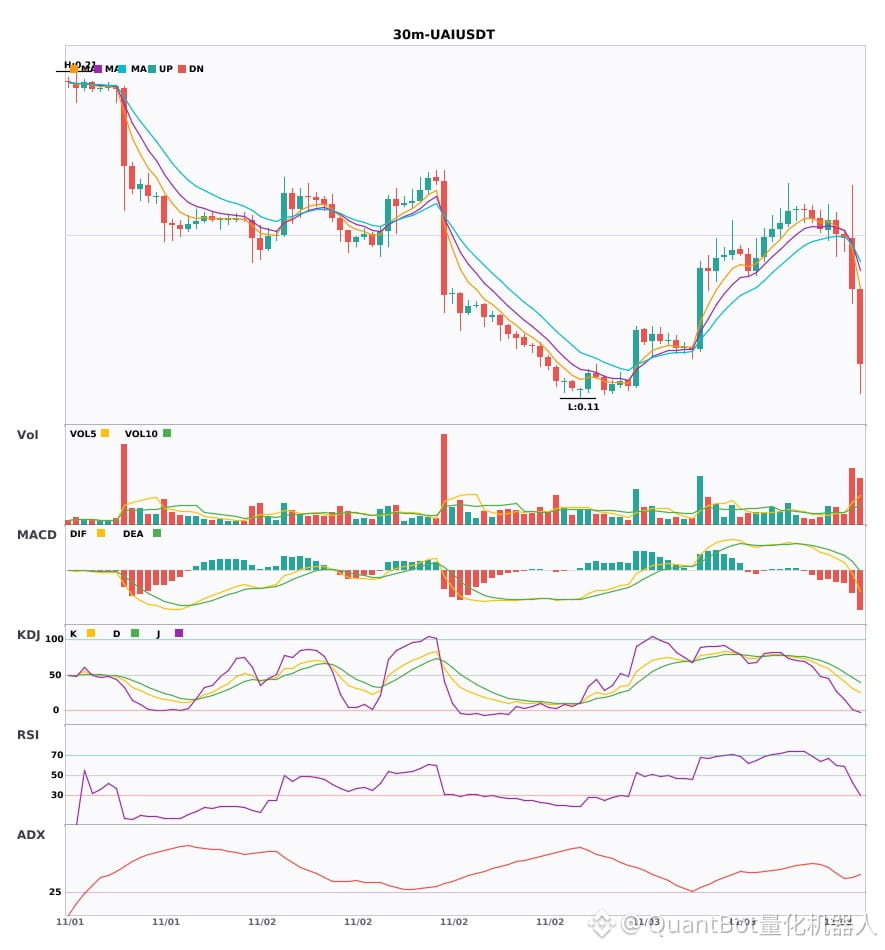
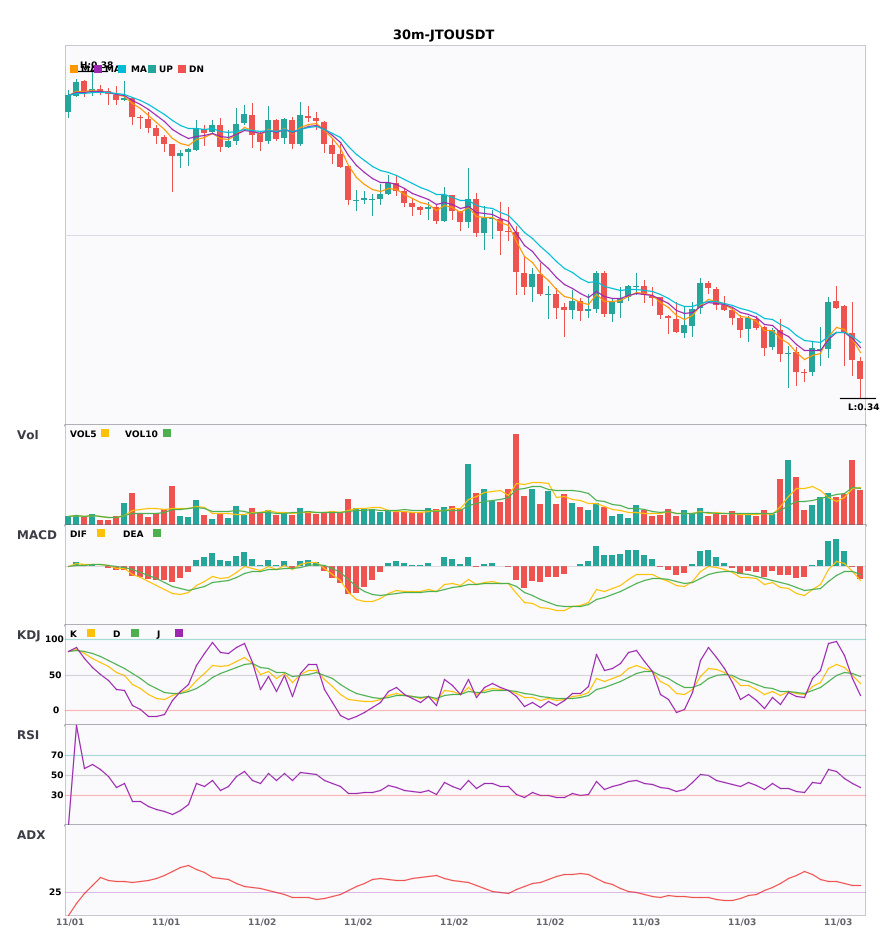
4
·
--
3 30-minute bearish alerts: $AKE / $UAI / $JTO🔥
════════════════════
🟢 $AKE 30-minute bearish signal
⚠️Technical analysis: ADX (39): clear trend | MACD bearish crossover below zero, bearish momentum accelerating | EMA5 < EMA8 < EMA13, bearish alignment | KDJ trending weakly, bears in control (K: 32.5, D: 37.4) | Volume surge (2.5x)
════════════════════
🟢 $UAI 30-minute bearish signal
⚠️Technical analysis: ADX (41): clear trend | MACD DIF breaks below the zero line, trend turns bearish | Price remains under pressure below EMA5 | KDJ trending weakly, bears in control (K: 31.5, D: 46.6) | Volume surge (3.4x)
════════════════════
🟢 $JTO 30-minute bearish signal
⚠️Technical analysis: ADX (35): clear trend | MACD bearish crossover below zero, bearish momentum accelerating | EMA5 crosses below EMA8, short-term outlook turns bearish | KDJ bearish crossover, short-term bearish outlook (K: 49.3, D: 51.7) | Volume increase (1.7x)
════════════════════
🔔 Follow for real-time market alerts 🔔
#技术分析 #AKE #UAI #JTO
📌 When trading, watch for whether the candlestick pattern confirms the signal
3 30-minute bearish alerts: $AKE / $UAI / $JTO 🔥
════════════════════
🟢 $AKE 30-minute bearish signal
⚠️Technical analysis: ADX (39): clear trend | MACD bearish crossover below zero, bearish momentum accelerating | EMA5 < EMA8 < EMA13, bearish alignment | KDJ trending weakly, bears in control (K: 32.5, D: 37.4) | Volume surge (2.5x)
════════════════════
🟢 $UAI 30-minute bearish signal
⚠️Technical analysis: ADX (41): clear trend | MACD DIF breaks below the zero line, trend turns bearish | Price remains under pressure below EMA5 | KDJ trending weakly, bears in control (K: 31.5, D: 46.6) | Volume surge (3.4x)
════════════════════
🟢 $JTO 30-minute bearish signal
⚠️Technical analysis: ADX (35): clear trend | MACD bearish crossover below zero, bearish momentum accelerating | EMA5 crosses below EMA8, short-term outlook turns bearish | KDJ bearish crossover, short-term bearish outlook (K: 49.3, D: 51.7) | Volume increase (1.7x)
════════════════════
🔔 Follow for real-time market alerts 🔔
#技术分析 #AKE #UAI #JTO
📌 When trading, watch for whether the candlestick pattern confirms the signal
════════════════════
🟢 $AKE 30-minute bearish signal
⚠️Technical analysis: ADX (39): clear trend | MACD bearish crossover below zero, bearish momentum accelerating | EMA5 < EMA8 < EMA13, bearish alignment | KDJ trending weakly, bears in control (K: 32.5, D: 37.4) | Volume surge (2.5x)
════════════════════
🟢 $UAI 30-minute bearish signal
⚠️Technical analysis: ADX (41): clear trend | MACD DIF breaks below the zero line, trend turns bearish | Price remains under pressure below EMA5 | KDJ trending weakly, bears in control (K: 31.5, D: 46.6) | Volume surge (3.4x)
════════════════════
🟢 $JTO 30-minute bearish signal
⚠️Technical analysis: ADX (35): clear trend | MACD bearish crossover below zero, bearish momentum accelerating | EMA5 crosses below EMA8, short-term outlook turns bearish | KDJ bearish crossover, short-term bearish outlook (K: 49.3, D: 51.7) | Volume increase (1.7x)
════════════════════
🔔 Follow for real-time market alerts 🔔
#技术分析 #AKE #UAI #JTO
📌 When trading, watch for whether the candlestick pattern confirms the signal
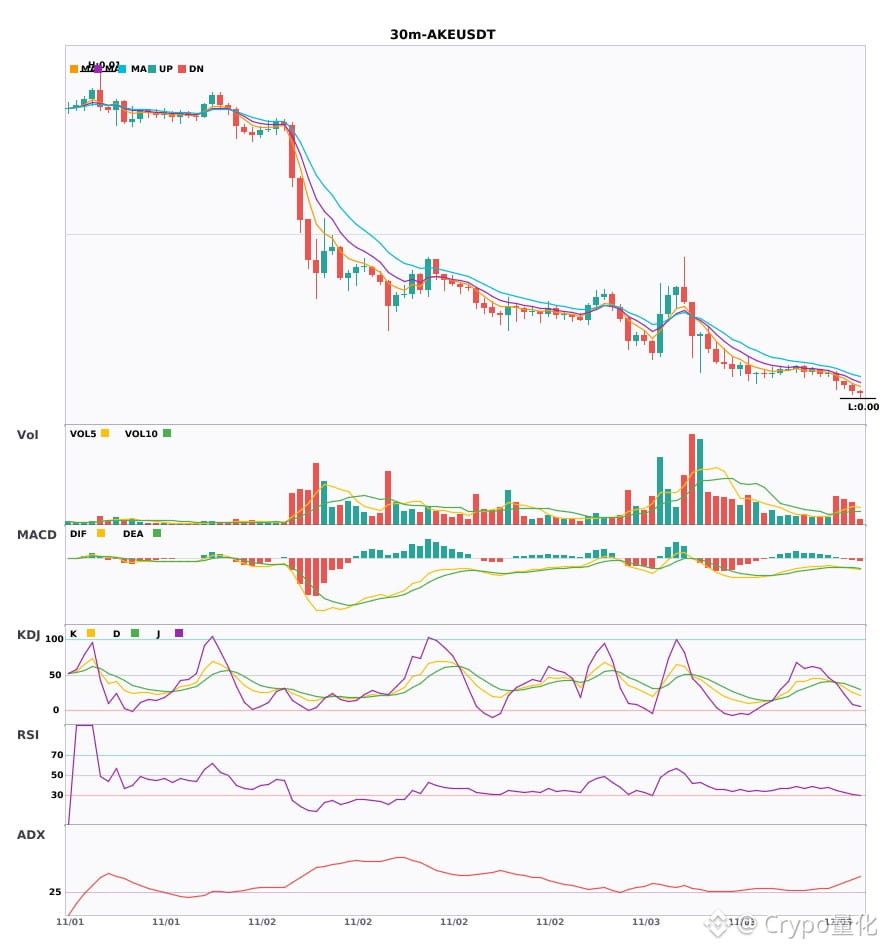
7

Verified
Jito says it has “decentralized block building.” I took a look, and in reality Jito personally selected three firms: Triton One, Bitwise, and SOL Strategies.
Jito picked the participants, Jito set the entry requirements, and Jito is still running all the BAM nodes on mainnet itself (in The Defiant’s own words). The three firms are only entering the testnet for now, with a limited mainnet launch before year-end. Opening it to all validators won’t happen until Q1 2027.
So the accurate headline for this news should be: Jito sent out three whitelist invitations.
BAM decides which transactions get onto Solana and in what order. That’s the most valuable position on the entire chain: control over ordering = MEV. Before, one firm called all the shots. Now, one firm still calls all the shots, but has invited three friends along for the ride. The power structure hasn’t changed; there are just three more chairs at the table. One more thing: transactions are ordered inside “sealed hardware,” shifting trust from Jito to the chip manufacturer and the TEE implementation. Almost nobody is discussing this part.
The most absurd part is the parroting on X: a bunch of “JUST IN 🚨 Jito decentralizes block building” posts, with the JTO contract address tacked on right after. An asset management firm’s official account posts “proud,” someone from the third firm posts “good company,” and people in the same circle like each other’s posts—and suddenly it’s “Solana is more decentralized.”
I’m not saying the direction is wrong. It only counts when any validator can genuinely join and the ordering rules can be externally verified. Until then, don’t treat the three testnet names as a bullish signal. Keep an eye on whether that Q1 2027 date gets pushed back again.
#Solana #JTO
Jito says it has “decentralized block building.” I took a look, and in reality Jito personally selected three firms: Triton One, Bitwise, and SOL Strategies.
Jito picked the participants, Jito set the entry requirements, and Jito is still running all the BAM nodes on mainnet itself (in The Defiant’s own words). The three firms are only entering the testnet for now, with a limited mainnet launch before year-end. Opening it to all validators won’t happen until Q1 2027.
So the accurate headline for this news should be: Jito sent out three whitelist invitations.
BAM decides which transactions get onto Solana and in what order. That’s the most valuable position on the entire chain: control over ordering = MEV. Before, one firm called all the shots. Now, one firm still calls all the shots, but has invited three friends along for the ride. The power structure hasn’t changed; there are just three more chairs at the table. One more thing: transactions are ordered inside “sealed hardware,” shifting trust from Jito to the chip manufacturer and the TEE implementation. Almost nobody is discussing this part.
The most absurd part is the parroting on X: a bunch of “JUST IN 🚨 Jito decentralizes block building” posts, with the JTO contract address tacked on right after. An asset management firm’s official account posts “proud,” someone from the third firm posts “good company,” and people in the same circle like each other’s posts—and suddenly it’s “Solana is more decentralized.”
I’m not saying the direction is wrong. It only counts when any validator can genuinely join and the ordering rules can be externally verified. Until then, don’t treat the three testnet names as a bullish signal. Keep an eye on whether that Q1 2027 date gets pushed back again.
#Solana #JTO
Jito picked the participants, Jito set the entry requirements, and Jito is still running all the BAM nodes on mainnet itself (in The Defiant’s own words). The three firms are only entering the testnet for now, with a limited mainnet launch before year-end. Opening it to all validators won’t happen until Q1 2027.
So the accurate headline for this news should be: Jito sent out three whitelist invitations.
BAM decides which transactions get onto Solana and in what order. That’s the most valuable position on the entire chain: control over ordering = MEV. Before, one firm called all the shots. Now, one firm still calls all the shots, but has invited three friends along for the ride. The power structure hasn’t changed; there are just three more chairs at the table. One more thing: transactions are ordered inside “sealed hardware,” shifting trust from Jito to the chip manufacturer and the TEE implementation. Almost nobody is discussing this part.
The most absurd part is the parroting on X: a bunch of “JUST IN 🚨 Jito decentralizes block building” posts, with the JTO contract address tacked on right after. An asset management firm’s official account posts “proud,” someone from the third firm posts “good company,” and people in the same circle like each other’s posts—and suddenly it’s “Solana is more decentralized.”
I’m not saying the direction is wrong. It only counts when any validator can genuinely join and the ordering rules can be externally verified. Until then, don’t treat the three testnet names as a bullish signal. Keep an eye on whether that Q1 2027 date gets pushed back again.
#Solana #JTO
697

Solana Ecosystem Tokens on the Move ($JTO)
Solana-based assets like $JTO are printing solid green candles today, up more than 15% amid strong network transaction activity. High liquidity and whale interest are fueling this upward push. Is $JTO on your radar today?
#JTO #SolanaEcosystem #BinanceSquare
Solana Ecosystem Tokens on the Move ($JTO )
Solana-based assets like $JTO are printing solid green candles today, up more than 15% amid strong network transaction activity. High liquidity and whale interest are fueling this upward push. Is $JTO on your radar today?
#JTO #SolanaEcosystem #BinanceSquare
Solana-based assets like $JTO are printing solid green candles today, up more than 15% amid strong network transaction activity. High liquidity and whale interest are fueling this upward push. Is $JTO on your radar today?
#JTO #SolanaEcosystem #BinanceSquare
2
260

·
--
JTO is currently at 0.4028, down 6.06% over 24 hours and still down 13.11% over 7 days. Its intraday range is 0.3955–0.4421, with an amplitude of 11.8%.
【Market】
There’s been an interesting pattern lately: JTO was down 6.06% in a single day, but the 0.3955 level is often what really determines its direction.
Everyone is watching the short-term ups and downs, but the 0.3955–0.4421 range has already said it all for JTO.
JTO trended lower throughout the day within the 0.3955–0.4421 range, with rebounds clearly lacking volume.
There are still no signs of a reversal in the short-term weakness, and selling pressure continues to unwind.
Put BTC’s -1.76% alongside it, and JTO’s performance is clearly weaker.
【Macro】 U.S. stocks rose overnight: Nasdaq +0.82%, S&P 500 +0.70% (close on 2026-10-27). BTC ETFs have seen net outflows of about $45.2 billion this month. U.S. CPI came in at 3.7% year over year, above expectations. The probability of a rate hike at the 2026-10-27/28 meeting is about 47%. Spot BTC ETFs have seen net outflows of about $45.2 billion this month as institutional buying wanes.
The short-term outlook leans bearish.
【Bearish reasons】
When it comes to making a judgment, ultimately you have to figure it out for yourself—consensus is often the one that lags behind.
Selling pressure around 0.4421 has yet to be fully absorbed, and each rebound has been weaker than the last.
What you should really be watching isn’t the size of the drop itself, but whether the 0.3955 level holds.
$JTO #JTO
JTO is currently at 0.4028, down 6.06% over 24 hours and still down 13.11% over 7 days. Its intraday range is 0.3955–0.4421, with an amplitude of 11.8%.
【Market】
There’s been an interesting pattern lately: JTO was down 6.06% in a single day, but the 0.3955 level is often what really determines its direction.
Everyone is watching the short-term ups and downs, but the 0.3955–0.4421 range has already said it all for JTO.
JTO trended lower throughout the day within the 0.3955–0.4421 range, with rebounds clearly lacking volume.
There are still no signs of a reversal in the short-term weakness, and selling pressure continues to unwind.
Put BTC’s -1.76% alongside it, and JTO’s performance is clearly weaker.
【Macro】 U.S. stocks rose overnight: Nasdaq +0.82%, S&P 500 +0.70% (close on 2026-10-27). BTC ETFs have seen net outflows of about $45.2 billion this month. U.S. CPI came in at 3.7% year over year, above expectations. The probability of a rate hike at the 2026-10-27/28 meeting is about 47%. Spot BTC ETFs have seen net outflows of about $45.2 billion this month as institutional buying wanes.
The short-term outlook leans bearish.
【Bearish reasons】
When it comes to making a judgment, ultimately you have to figure it out for yourself—consensus is often the one that lags behind.
Selling pressure around 0.4421 has yet to be fully absorbed, and each rebound has been weaker than the last.
What you should really be watching isn’t the size of the drop itself, but whether the 0.3955 level holds.
$JTO #JTO
【Market】
There’s been an interesting pattern lately: JTO was down 6.06% in a single day, but the 0.3955 level is often what really determines its direction.
Everyone is watching the short-term ups and downs, but the 0.3955–0.4421 range has already said it all for JTO.
JTO trended lower throughout the day within the 0.3955–0.4421 range, with rebounds clearly lacking volume.
There are still no signs of a reversal in the short-term weakness, and selling pressure continues to unwind.
Put BTC’s -1.76% alongside it, and JTO’s performance is clearly weaker.
【Macro】 U.S. stocks rose overnight: Nasdaq +0.82%, S&P 500 +0.70% (close on 2026-10-27). BTC ETFs have seen net outflows of about $45.2 billion this month. U.S. CPI came in at 3.7% year over year, above expectations. The probability of a rate hike at the 2026-10-27/28 meeting is about 47%. Spot BTC ETFs have seen net outflows of about $45.2 billion this month as institutional buying wanes.
The short-term outlook leans bearish.
【Bearish reasons】
When it comes to making a judgment, ultimately you have to figure it out for yourself—consensus is often the one that lags behind.
Selling pressure around 0.4421 has yet to be fully absorbed, and each rebound has been weaker than the last.
What you should really be watching isn’t the size of the drop itself, but whether the 0.3955 level holds.
$JTO #JTO
4
Log in to explore more content
Join global crypto users on Binance Square
⚡️ Get latest and useful information about crypto.
💬 Trusted by the world’s largest crypto exchange.
👍 Discover real insights from verified creators.
Email / Phone number
Trending Topics
1
#BitcoinRebounds$75KAsChipsLead
425 views
22 Discussing
2
#JobsReportRaisesHikeOdds
33,033 views
525 Discussing
3
#US Data Center Rules May Constrain AI Expansion
4,838 views
61 Discussing
4
#$2TWipedOutHedgeFundsFaceLiquidation
8,528 views
71 Discussing
5
#WillAnthropicListOnTime
485 views
53 Discussing
6
#USNovemberMichiganExpectationsIndexPrelimAt50.9
5,222 views
165 Discussing
7
#OilPlungesBelow$100
8,015 views
29 Discussing
8
#TradFiForBeginners
1,732 views
83 Discussing
9
#USMidtermsCouldShakeUpUS-IranTies
20,683 views
353 Discussing
10
#RussianCentralBankNamesBTCETHUSDTForNonQualifiedInvestors
316 views
3 Discussing