
#metrics
metrics
46,666 views
44 Discussing
Hot
Latest

#CryptoMarkets #metrics
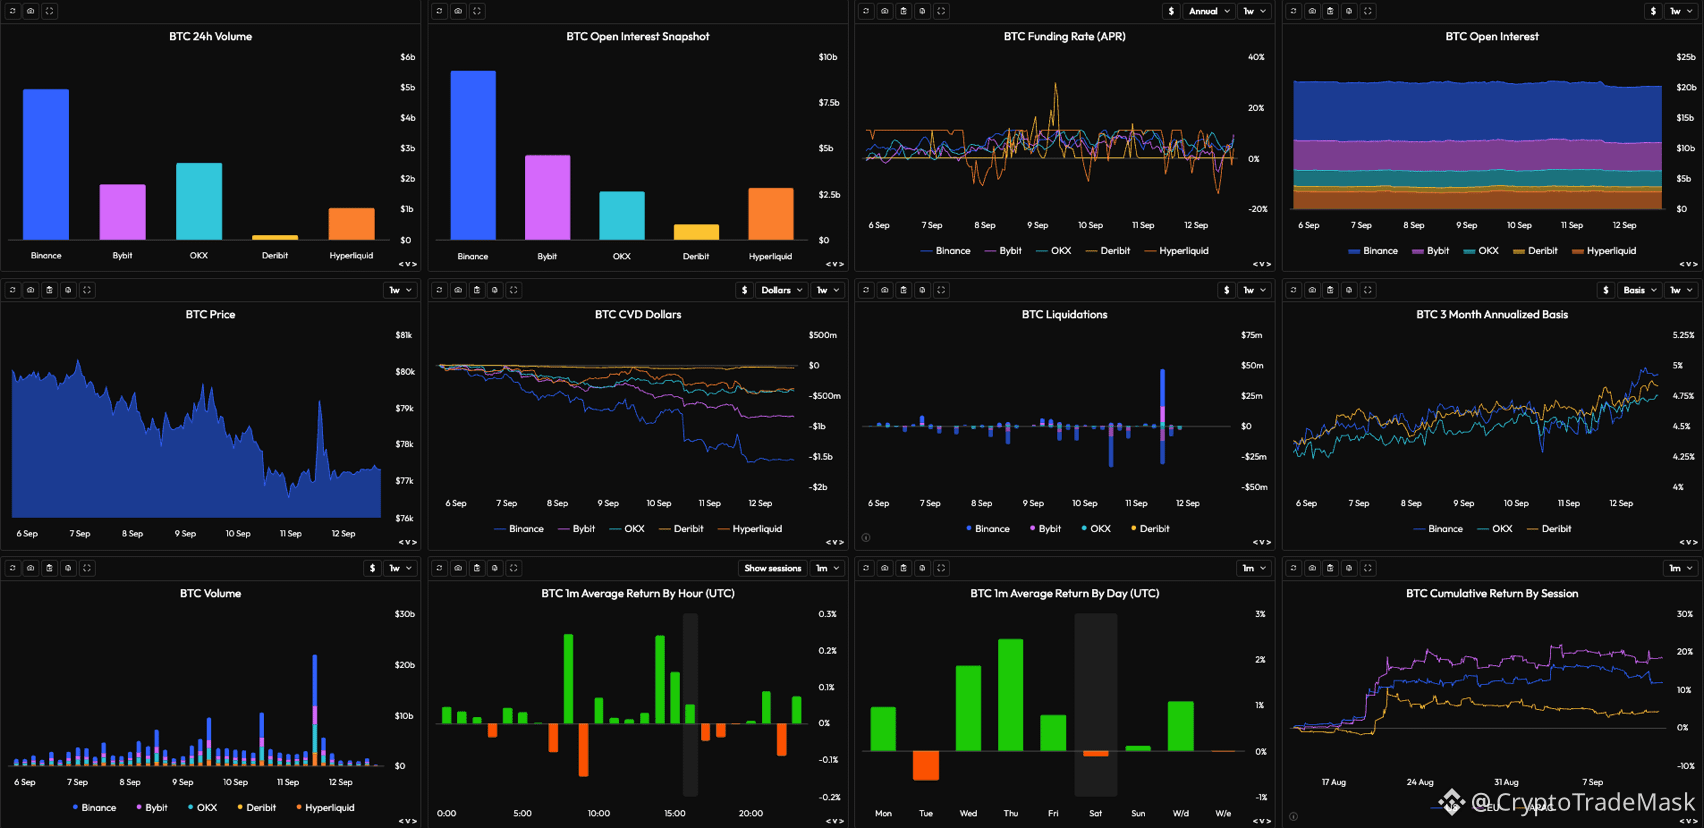
📊 Bitcoin: Market Reset Before the Next Surge
The localized price drop, followed by a lightning-fast V-shaped rebound, was a classic example of "shaking out weak hands." The market effectively purged excessive speculative leverage: a cascade of over $50 million in long liquidations brought overheated funding rates down from 20–30% APR to a healthy 0–5%.
📊 Key Metrics:
➡️ Limit Order Defense vs. Market Sellers: A sustained drop in CVD (down to -$3B) indicates systematic market selling. However, the price is holding firm thanks to dense limit-order demand from major players.
➡️ Western Driver: The bulk of gains is generated during US and European trading sessions (US/EU +20%). Buying activity traditionally peaks at the US market open (14:00–15:00 UTC).
➡️ Coiled Spring: Open Interest remains above $20B. Large capital is staying in positions, setting the stage for a powerful impulse move.
⚠️ Conclusion:
Relieving local overheating paves the way for the trend to continue. The only missing piece for a decisive upward breakout is a shift of the CVD back into positive territory. The key level to defend is the "buy-the-dip" low; losing this could trigger another wave of liquidations.
{future}(BTCUSDT)
{future}(ETHUSDT)
{future}(SUIUSDT)
#CryptoMarkets #metrics
📊 Bitcoin: Market Reset Before the Next Surge
The localized price drop, followed by a lightning-fast V-shaped rebound, was a classic example of "shaking out weak hands." The market effectively purged excessive speculative leverage: a cascade of over $50 million in long liquidations brought overheated funding rates down from 20–30% APR to a healthy 0–5%.
📊 Key Metrics:
➡️ Limit Order Defense vs. Market Sellers: A sustained drop in CVD (down to -$3B) indicates systematic market selling. However, the price is holding firm thanks to dense limit-order demand from major players.
➡️ Western Driver: The bulk of gains is generated during US and European trading sessions (US/EU +20%). Buying activity traditionally peaks at the US market open (14:00–15:00 UTC).
➡️ Coiled Spring: Open Interest remains above $20B. Large capital is staying in positions, setting the stage for a powerful impulse move.
⚠️ Conclusion:
Relieving local overheating paves the way for the trend to continue. The only missing piece for a decisive upward breakout is a shift of the CVD back into positive territory. The key level to defend is the "buy-the-dip" low; losing this could trigger another wave of liquidations.
📊 Bitcoin: Market Reset Before the Next Surge
The localized price drop, followed by a lightning-fast V-shaped rebound, was a classic example of "shaking out weak hands." The market effectively purged excessive speculative leverage: a cascade of over $50 million in long liquidations brought overheated funding rates down from 20–30% APR to a healthy 0–5%.
📊 Key Metrics:
➡️ Limit Order Defense vs. Market Sellers: A sustained drop in CVD (down to -$3B) indicates systematic market selling. However, the price is holding firm thanks to dense limit-order demand from major players.
➡️ Western Driver: The bulk of gains is generated during US and European trading sessions (US/EU +20%). Buying activity traditionally peaks at the US market open (14:00–15:00 UTC).
➡️ Coiled Spring: Open Interest remains above $20B. Large capital is staying in positions, setting the stage for a powerful impulse move.
⚠️ Conclusion:
Relieving local overheating paves the way for the trend to continue. The only missing piece for a decisive upward breakout is a shift of the CVD back into positive territory. The key level to defend is the "buy-the-dip" low; losing this could trigger another wave of liquidations.
63
#cryptotradingpro #metrics #BTC
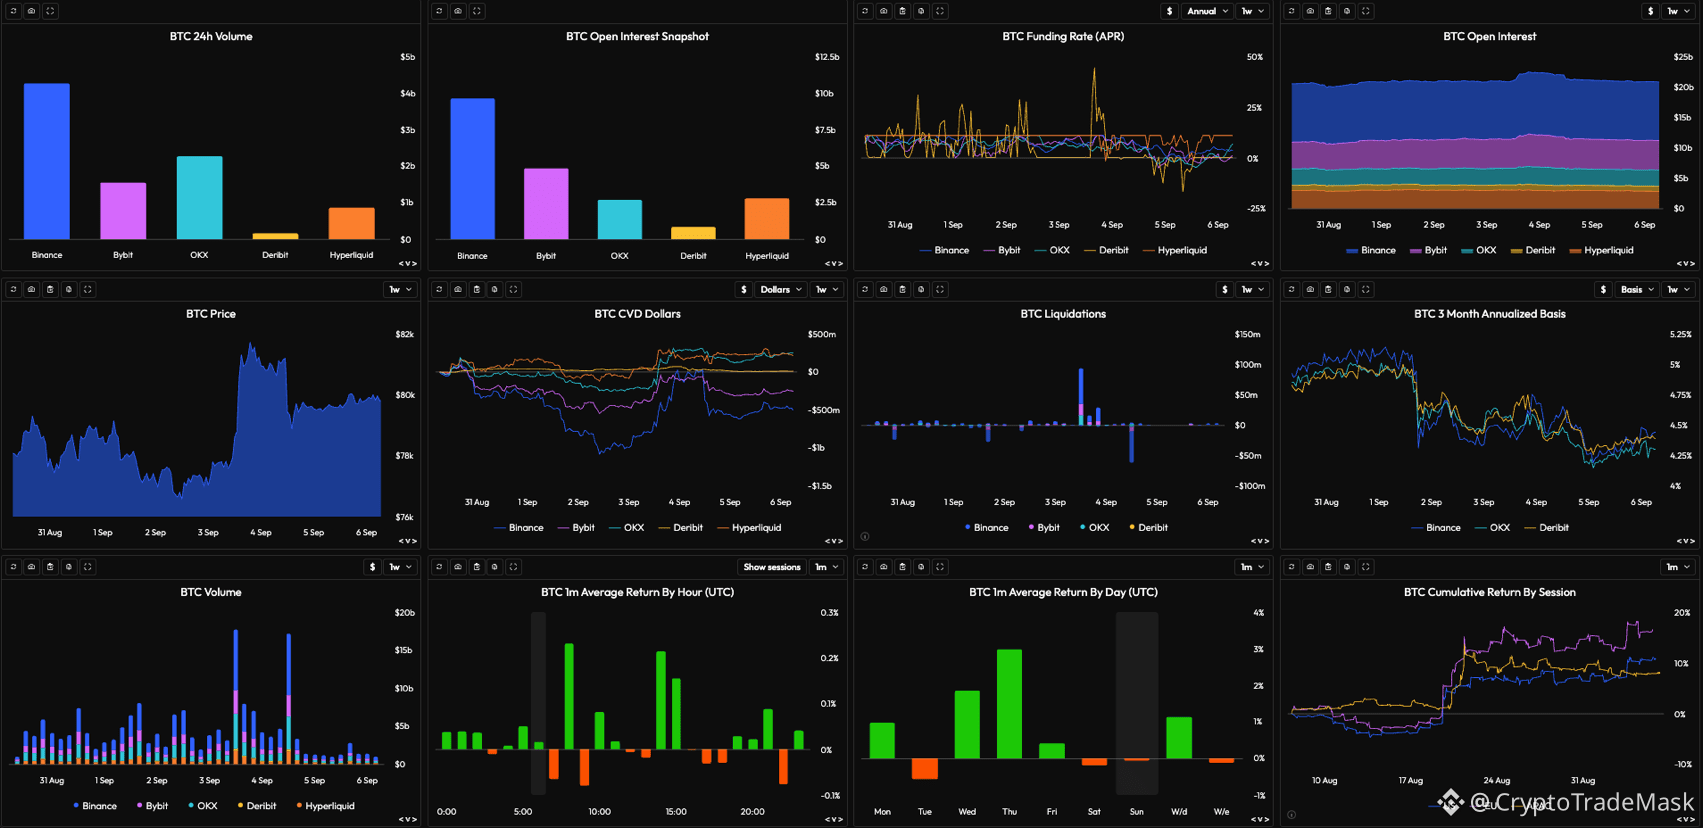
$BTC : Market Analysis and Key Metrics 📊
After a strong momentum on September 3-4, Bitcoin entered a consolidation phase at the achieved highs. Let's analyze what is happening in the market right now:
➡️ Price and Volumes: The explosive growth was supported by high volumes (the main volume passed through Binance and Bybit). Now the volumes have fallen to average values, which indicates a pause before the next movement.
➡️ Liquidations and CVD: The main fuel for the growth was a large-scale cascade of short liquidations. There is an interesting difference in CVD - Binance and Bybit have fixed in growth, while other platforms hold neutral-positive cumulative volume.
➡️ Derivatives: Open interest (OI) remains high ($20B+), but the funding rate (Funding Rate) has already returned to the neutral zone. The market has cooled down from overheating, which creates a healthy foundation for further developments.
➡️ Sessions: The main driver of buyers is the American session (US), followed by Europe (EU). Asia is currently showing the least activity.
⚠️ Conclusion:
The market is in the accumulation phase after the short squeeze. The lack of overheating in funding at high OI indicates readiness for a new directional movement, possibly after the liquidity pool is removed below. The key trigger for the continuation of the uptrend is to maintain the current range and connect a spot buyer.
{future}(BTCUSDT)
#cryptotradingpro #metrics #BTC
$BTC : Market Analysis and Key Metrics 📊
After a strong momentum on September 3-4, Bitcoin entered a consolidation phase at the achieved highs. Let's analyze what is happening in the market right now:
➡️ Price and Volumes: The explosive growth was supported by high volumes (the main volume passed through Binance and Bybit). Now the volumes have fallen to average values, which indicates a pause before the next movement.
➡️ Liquidations and CVD: The main fuel for the growth was a large-scale cascade of short liquidations. There is an interesting difference in CVD - Binance and Bybit have fixed in growth, while other platforms hold neutral-positive cumulative volume.
➡️ Derivatives: Open interest (OI) remains high ($20B+), but the funding rate (Funding Rate) has already returned to the neutral zone. The market has cooled down from overheating, which creates a healthy foundation for further developments.
➡️ Sessions: The main driver of buyers is the American session (US), followed by Europe (EU). Asia is currently showing the least activity.
⚠️ Conclusion:
The market is in the accumulation phase after the short squeeze. The lack of overheating in funding at high OI indicates readiness for a new directional movement, possibly after the liquidity pool is removed below. The key trigger for the continuation of the uptrend is to maintain the current range and connect a spot buyer.
$BTC : Market Analysis and Key Metrics 📊
After a strong momentum on September 3-4, Bitcoin entered a consolidation phase at the achieved highs. Let's analyze what is happening in the market right now:
➡️ Price and Volumes: The explosive growth was supported by high volumes (the main volume passed through Binance and Bybit). Now the volumes have fallen to average values, which indicates a pause before the next movement.
➡️ Liquidations and CVD: The main fuel for the growth was a large-scale cascade of short liquidations. There is an interesting difference in CVD - Binance and Bybit have fixed in growth, while other platforms hold neutral-positive cumulative volume.
➡️ Derivatives: Open interest (OI) remains high ($20B+), but the funding rate (Funding Rate) has already returned to the neutral zone. The market has cooled down from overheating, which creates a healthy foundation for further developments.
➡️ Sessions: The main driver of buyers is the American session (US), followed by Europe (EU). Asia is currently showing the least activity.
⚠️ Conclusion:
The market is in the accumulation phase after the short squeeze. The lack of overheating in funding at high OI indicates readiness for a new directional movement, possibly after the liquidity pool is removed below. The key trigger for the continuation of the uptrend is to maintain the current range and connect a spot buyer.
1
92
#cryptotradingpro #metrics #BTC
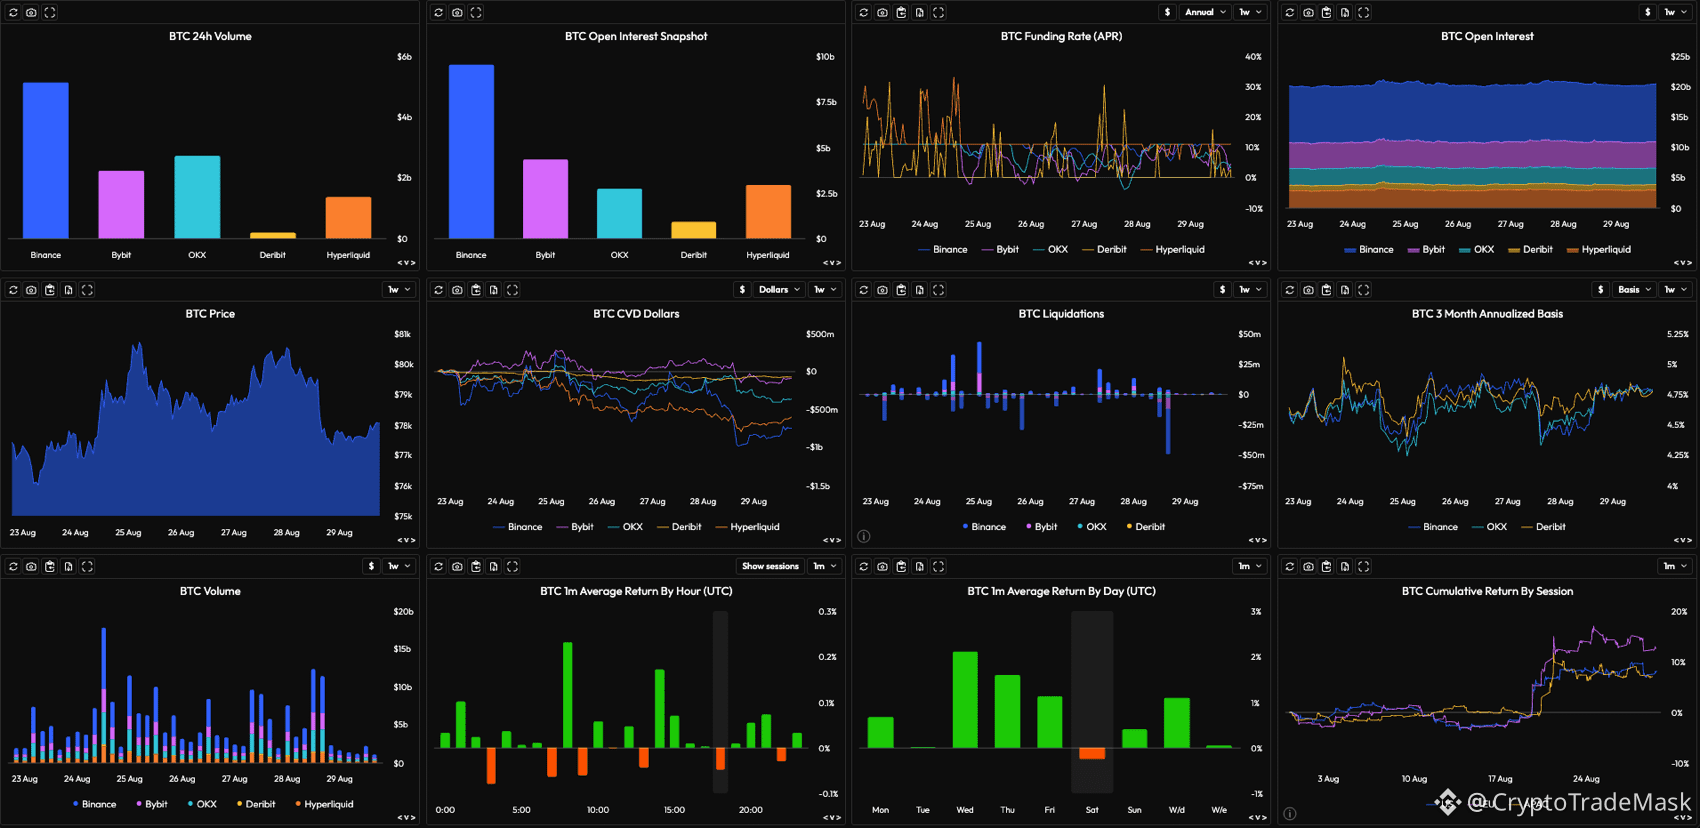
📊 $BTC / USD: Market Analysis and Key Metrics
After attempting an impulse breakout to levels of ~$81,000, Bitcoin has entered a phase of local consolidation and is currently trading in the range of $78,000 - $79,000.
Let's analyze what is happening in the market and what to watch closely:
➡️ Volumes and CVD (Cumulative Volume Delta):
After the peak surge in volumes on August 25-26, activity has subsided. The decrease in CVD (especially on Binance and Bybit) indicates the dominance of aggressive market sellers during the pullback, but the price holds key levels.
➡️ Open Interest (OI) and Funding:
Open interest remains high (~$20B), but the Funding Rate has smoothed out to neutral values. This is a great signal: the market has unloaded itself from excessive leverage and risky longs (which is also confirmed by the wave of liquidations of $25M–$45M during the spill).
➡️ Cumulative Return:
The main driver of the current movement is the EU and US sessions — that’s where the main growth momentum took place. The Asian region (APAC) is still showing passivity.
🚦 Conclusion and scenarios:
The market is in a healthy cumulative pause. Big players are holding the price back without the risk of a panic dump.
🟢 Bullish Case: Holding the support zone of $77,500 – $78,000 paves the way for a retest of $81,000+ with the potential for a new high.
🔴 Bearish Case: A loss of $77,000 will send the price to withdraw liquidity to the $75,500 area.
⚠️ We are following the reaction to the discovery of the Americans! 🧠📈
{future}(BTCUSDT)
#cryptotradingpro #metrics #BTC
📊 $BTC / USD: Market Analysis and Key Metrics
After attempting an impulse breakout to levels of ~$81,000, Bitcoin has entered a phase of local consolidation and is currently trading in the range of $78,000 - $79,000.
Let's analyze what is happening in the market and what to watch closely:
➡️ Volumes and CVD (Cumulative Volume Delta):
After the peak surge in volumes on August 25-26, activity has subsided. The decrease in CVD (especially on Binance and Bybit) indicates the dominance of aggressive market sellers during the pullback, but the price holds key levels.
➡️ Open Interest (OI) and Funding:
Open interest remains high (~$20B), but the Funding Rate has smoothed out to neutral values. This is a great signal: the market has unloaded itself from excessive leverage and risky longs (which is also confirmed by the wave of liquidations of $25M–$45M during the spill).
➡️ Cumulative Return:
The main driver of the current movement is the EU and US sessions — that’s where the main growth momentum took place. The Asian region (APAC) is still showing passivity.
🚦 Conclusion and scenarios:
The market is in a healthy cumulative pause. Big players are holding the price back without the risk of a panic dump.
🟢 Bullish Case: Holding the support zone of $77,500 – $78,000 paves the way for a retest of $81,000+ with the potential for a new high.
🔴 Bearish Case: A loss of $77,000 will send the price to withdraw liquidity to the $75,500 area.
⚠️ We are following the reaction to the discovery of the Americans! 🧠📈
📊 $BTC / USD: Market Analysis and Key Metrics
After attempting an impulse breakout to levels of ~$81,000, Bitcoin has entered a phase of local consolidation and is currently trading in the range of $78,000 - $79,000.
Let's analyze what is happening in the market and what to watch closely:
➡️ Volumes and CVD (Cumulative Volume Delta):
After the peak surge in volumes on August 25-26, activity has subsided. The decrease in CVD (especially on Binance and Bybit) indicates the dominance of aggressive market sellers during the pullback, but the price holds key levels.
➡️ Open Interest (OI) and Funding:
Open interest remains high (~$20B), but the Funding Rate has smoothed out to neutral values. This is a great signal: the market has unloaded itself from excessive leverage and risky longs (which is also confirmed by the wave of liquidations of $25M–$45M during the spill).
➡️ Cumulative Return:
The main driver of the current movement is the EU and US sessions — that’s where the main growth momentum took place. The Asian region (APAC) is still showing passivity.
🚦 Conclusion and scenarios:
The market is in a healthy cumulative pause. Big players are holding the price back without the risk of a panic dump.
🟢 Bullish Case: Holding the support zone of $77,500 – $78,000 paves the way for a retest of $81,000+ with the potential for a new high.
🔴 Bearish Case: A loss of $77,000 will send the price to withdraw liquidity to the $75,500 area.
⚠️ We are following the reaction to the discovery of the Americans! 🧠📈
1
49
#cryptotradingpro #metrics
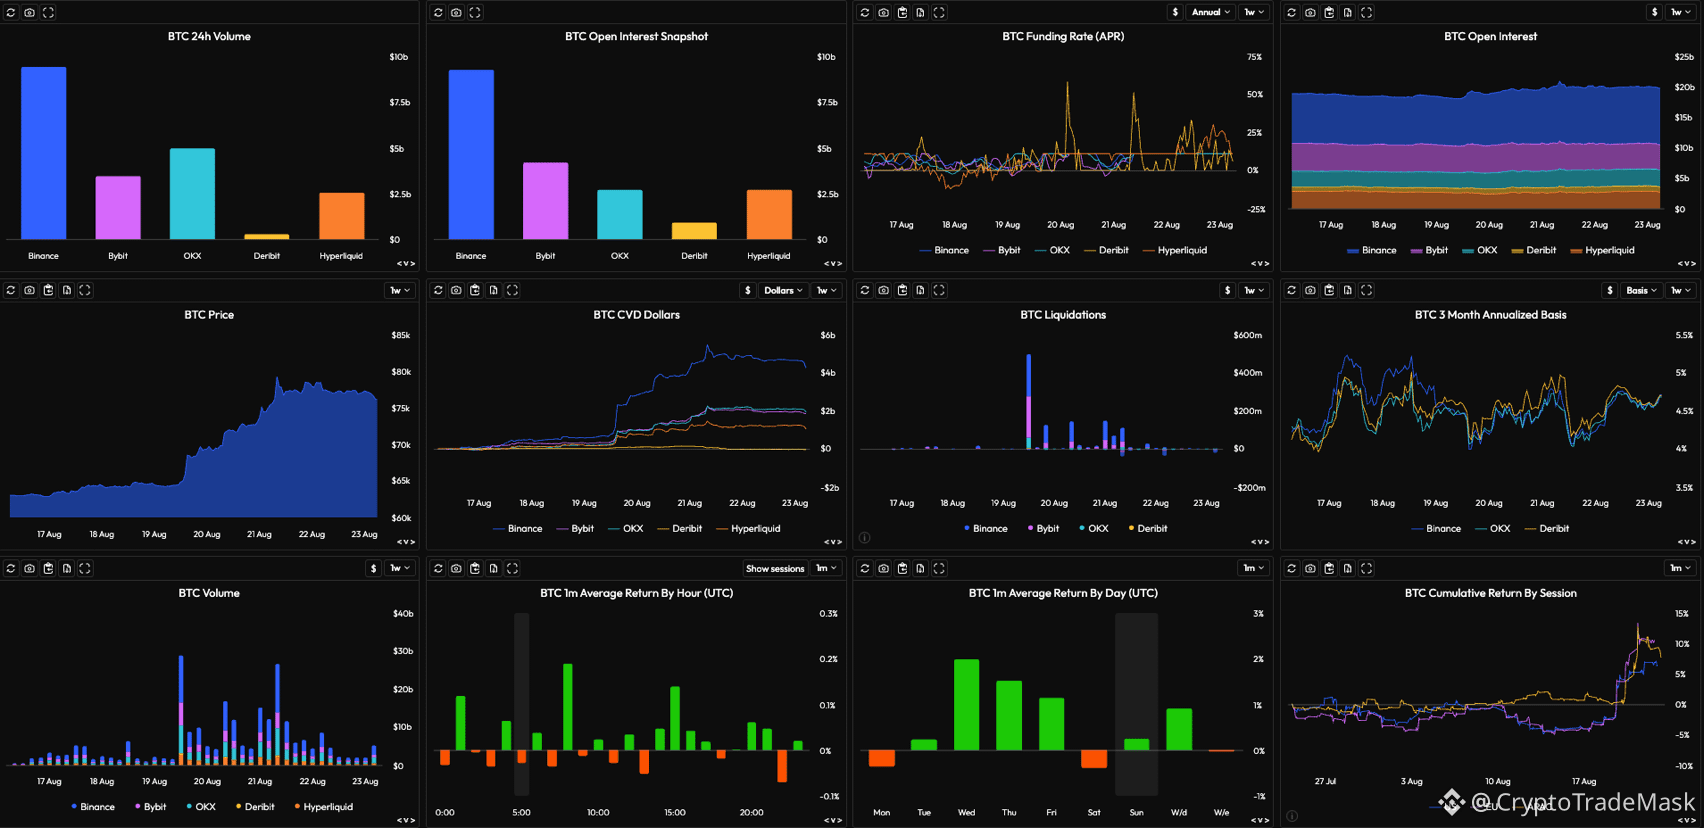
🚀 Bitcoin ($BTC ): Analysis of the $62k - $80k Momentum and What the Market Expects Next
Bitcoin demonstrated a powerful bullish rally, confidently renewing local highs. Let's analyze what was really happening behind the scenes of the chart and what to prepare for.
📊 What do the metrics say?
➡️ Growth Driver — Spot and Delta: The CVD chart clearly shows explosive market buying (especially on Binance and OKX). This was not just passive growth, but aggressive buying of supply.
➡️ Short squeeze at $500M+: The breakout was accompanied by a massive liquidation of short positions in the range of August 19–20, which additionally “pushed” the price to the $80,000 mark.
➡️ No overheating: The Funding Rate quickly stabilized in the normal range after a short-term surge. The 3-month Basis is holding at ~4.5%–5%. This means that the market is not overloaded with panicked longs with leverage.
➡️ Consolidation: The price is currently stuck in the $77k–$79k range, and open interest (OI) remains high (~$18b–$20b). Capital is not leaving the market.
🚦 Conclusions and scenarios
We see a healthy bullish trend due to the accumulation phase. The market is digesting the previous growth before choosing the next direction.
🟢 Priority (Bullish): Holding the support zone of $75k–$76k leaves a high probability of a retest of $80k and further movement to new ATHs.
🟡 Alternative (Cool-off): A break of $75k may trigger local profit-taking and a cascade closure of longs with a capitulation to the $70k–$72k zone to collect liquidity.
{future}(BTCUSDT)
#cryptotradingpro #metrics
🚀 Bitcoin ($BTC ): Analysis of the $62k - $80k Momentum and What the Market Expects Next
Bitcoin demonstrated a powerful bullish rally, confidently renewing local highs. Let's analyze what was really happening behind the scenes of the chart and what to prepare for.
📊 What do the metrics say?
➡️ Growth Driver — Spot and Delta: The CVD chart clearly shows explosive market buying (especially on Binance and OKX). This was not just passive growth, but aggressive buying of supply.
➡️ Short squeeze at $500M+: The breakout was accompanied by a massive liquidation of short positions in the range of August 19–20, which additionally “pushed” the price to the $80,000 mark.
➡️ No overheating: The Funding Rate quickly stabilized in the normal range after a short-term surge. The 3-month Basis is holding at ~4.5%–5%. This means that the market is not overloaded with panicked longs with leverage.
➡️ Consolidation: The price is currently stuck in the $77k–$79k range, and open interest (OI) remains high (~$18b–$20b). Capital is not leaving the market.
🚦 Conclusions and scenarios
We see a healthy bullish trend due to the accumulation phase. The market is digesting the previous growth before choosing the next direction.
🟢 Priority (Bullish): Holding the support zone of $75k–$76k leaves a high probability of a retest of $80k and further movement to new ATHs.
🟡 Alternative (Cool-off): A break of $75k may trigger local profit-taking and a cascade closure of longs with a capitulation to the $70k–$72k zone to collect liquidity.
🚀 Bitcoin ($BTC ): Analysis of the $62k - $80k Momentum and What the Market Expects Next
Bitcoin demonstrated a powerful bullish rally, confidently renewing local highs. Let's analyze what was really happening behind the scenes of the chart and what to prepare for.
📊 What do the metrics say?
➡️ Growth Driver — Spot and Delta: The CVD chart clearly shows explosive market buying (especially on Binance and OKX). This was not just passive growth, but aggressive buying of supply.
➡️ Short squeeze at $500M+: The breakout was accompanied by a massive liquidation of short positions in the range of August 19–20, which additionally “pushed” the price to the $80,000 mark.
➡️ No overheating: The Funding Rate quickly stabilized in the normal range after a short-term surge. The 3-month Basis is holding at ~4.5%–5%. This means that the market is not overloaded with panicked longs with leverage.
➡️ Consolidation: The price is currently stuck in the $77k–$79k range, and open interest (OI) remains high (~$18b–$20b). Capital is not leaving the market.
🚦 Conclusions and scenarios
We see a healthy bullish trend due to the accumulation phase. The market is digesting the previous growth before choosing the next direction.
🟢 Priority (Bullish): Holding the support zone of $75k–$76k leaves a high probability of a retest of $80k and further movement to new ATHs.
🟡 Alternative (Cool-off): A break of $75k may trigger local profit-taking and a cascade closure of longs with a capitulation to the $70k–$72k zone to collect liquidity.
2
119
#metrics #bitcoin #CryptoTrading.
📊 $BTC : Market Analysis and Key Metrics
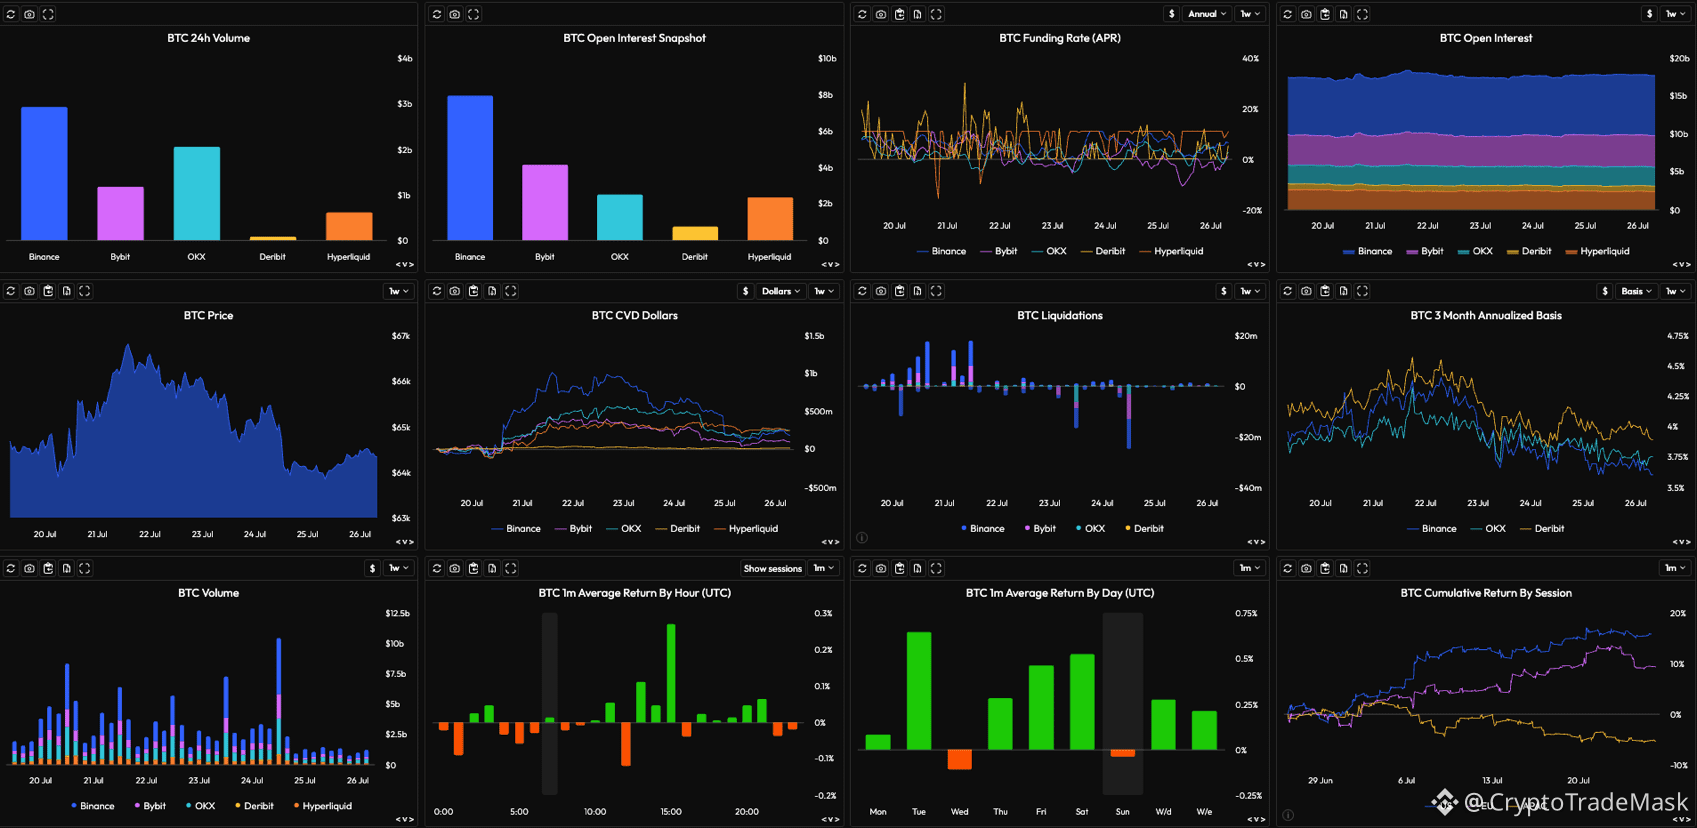
After local liquidity withdrawal and pullback to $64,000, Bitcoin enters a consolidation phase. Let's analyze what is happening "under the hood" of the market according to derivatives and volumes:
🔍 Key metrics:
➡️ Price and Spot (CVD): After a peak near $67,000, we saw longs unloaded and a dip to $64,000. Currently, the cumulative delta (CVD) has leveled off in the $200M–$400M range - aggressive selling has subsided, the market is moving into a waiting state.
➡️ Open Interest (OI) & Funding: Total OI remains high ($15B–$17B), indicating that large players are maintaining positions. Funding remains moderately positive (10–20% APR), and the 3-month base rate has dropped to 3.5–3.75% — the market has cleared from excessive overheating.
➡️ Liquidations: The spill on July 24–25 washed away leveraged buyers (over $20M+ of longs were liquidated), fixing a local bottom.
➡️ Sessionality: The main growth driver remains the US session (+15–20% for the month), while Asia (APAC) continues to moderately pressure the price downward.
📊 Conclusion and scenario:
The clearing of excess leverage has occurred. As the US session continues to actively buy back the decline, the baseline scenario is accumulation in the range of $64,200 – $66,000 with a potential attempt to retest $67,000 upon a CVD reversal towards purchases.
🎯 Key Levels:
Support: $63,800 – $64,200
Resistance: $66,200 / $67,100
{future}(BTCUSDT)
#metrics #bitcoin #CryptoTrading.
📊 $BTC : Market Analysis and Key Metrics
After local liquidity withdrawal and pullback to $64,000, Bitcoin enters a consolidation phase. Let's analyze what is happening "under the hood" of the market according to derivatives and volumes:
🔍 Key metrics:
➡️ Price and Spot (CVD): After a peak near $67,000, we saw longs unloaded and a dip to $64,000. Currently, the cumulative delta (CVD) has leveled off in the $200M–$400M range - aggressive selling has subsided, the market is moving into a waiting state.
➡️ Open Interest (OI) & Funding: Total OI remains high ($15B–$17B), indicating that large players are maintaining positions. Funding remains moderately positive (10–20% APR), and the 3-month base rate has dropped to 3.5–3.75% — the market has cleared from excessive overheating.
➡️ Liquidations: The spill on July 24–25 washed away leveraged buyers (over $20M+ of longs were liquidated), fixing a local bottom.
➡️ Sessionality: The main growth driver remains the US session (+15–20% for the month), while Asia (APAC) continues to moderately pressure the price downward.
📊 Conclusion and scenario:
The clearing of excess leverage has occurred. As the US session continues to actively buy back the decline, the baseline scenario is accumulation in the range of $64,200 – $66,000 with a potential attempt to retest $67,000 upon a CVD reversal towards purchases.
🎯 Key Levels:
Support: $63,800 – $64,200
Resistance: $66,200 / $67,100
📊 $BTC : Market Analysis and Key Metrics
After local liquidity withdrawal and pullback to $64,000, Bitcoin enters a consolidation phase. Let's analyze what is happening "under the hood" of the market according to derivatives and volumes:
🔍 Key metrics:
➡️ Price and Spot (CVD): After a peak near $67,000, we saw longs unloaded and a dip to $64,000. Currently, the cumulative delta (CVD) has leveled off in the $200M–$400M range - aggressive selling has subsided, the market is moving into a waiting state.
➡️ Open Interest (OI) & Funding: Total OI remains high ($15B–$17B), indicating that large players are maintaining positions. Funding remains moderately positive (10–20% APR), and the 3-month base rate has dropped to 3.5–3.75% — the market has cleared from excessive overheating.
➡️ Liquidations: The spill on July 24–25 washed away leveraged buyers (over $20M+ of longs were liquidated), fixing a local bottom.
➡️ Sessionality: The main growth driver remains the US session (+15–20% for the month), while Asia (APAC) continues to moderately pressure the price downward.
📊 Conclusion and scenario:
The clearing of excess leverage has occurred. As the US session continues to actively buy back the decline, the baseline scenario is accumulation in the range of $64,200 – $66,000 with a potential attempt to retest $67,000 upon a CVD reversal towards purchases.
🎯 Key Levels:
Support: $63,800 – $64,200
Resistance: $66,200 / $67,100
1
96
#bitcoin #metrics
📊 BTC: Big long washout and bottom search. What do the metrics say?
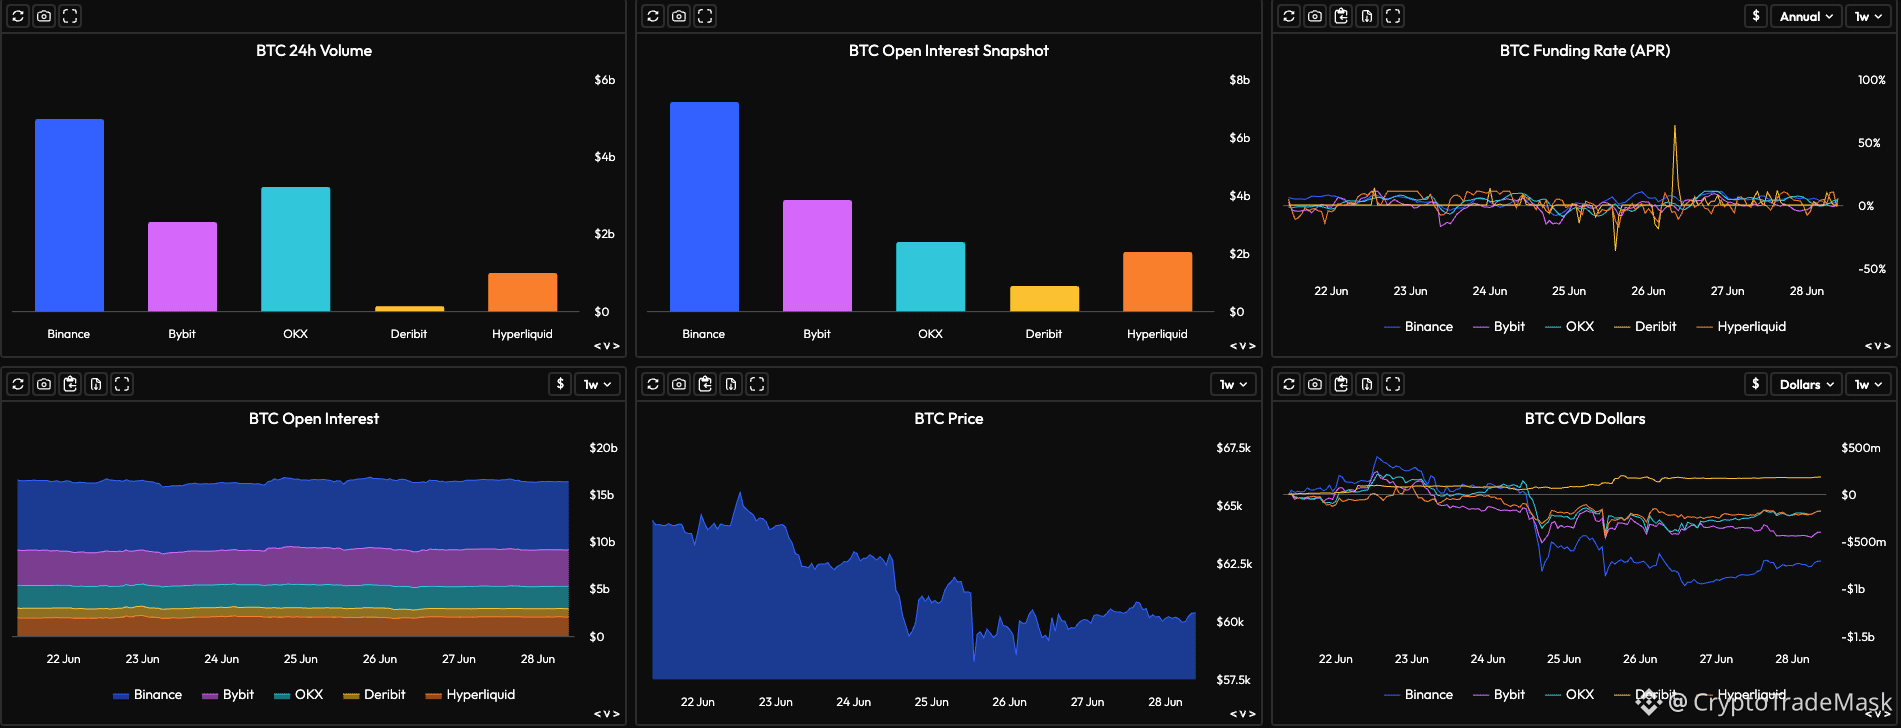
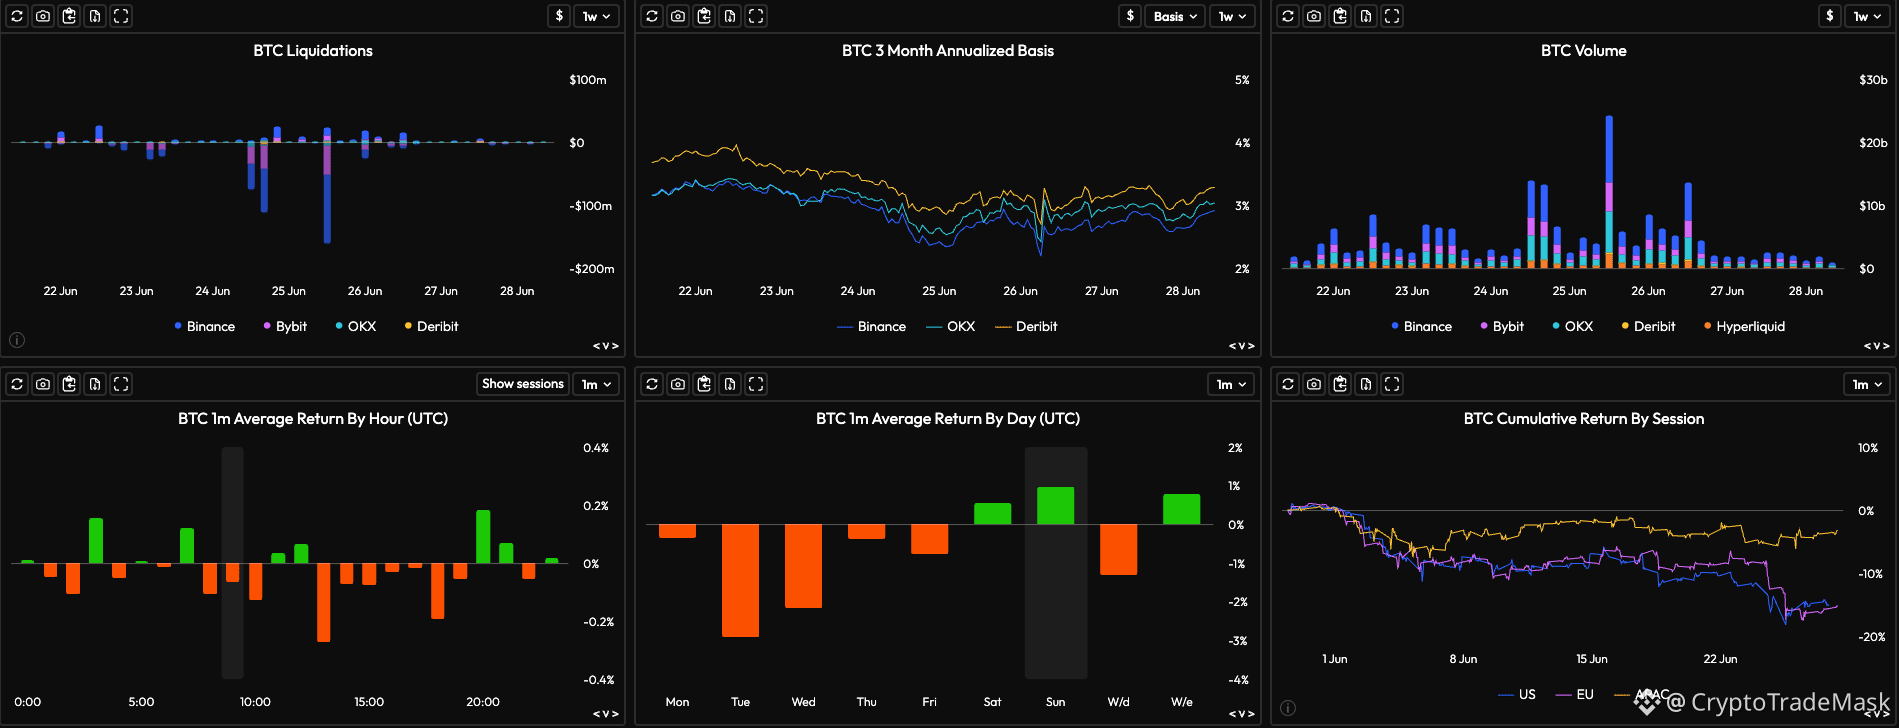
The last week of June turned out to be a hot one. We saw a classic retail capitulation, liquidity withdrawal "under the floor" and a further transition to consolidation. Let's analyze what happened behind the $BTC price movement from June 22 to 28.
📉 Key facts of the fall
Capitulation and volumes: After a flat in the $64k–$65k area, the price was pushed down to a local bottom near $58k–$59k. The fall was accompanied by a strong surge in trading volumes (over $20b on Binance), which indicates active buyout of the strait by large players.
Liquidation cascade: Massive washout of long positions amounted to over $150m per day.
🔍 What about derivatives and sentiment?
Open Interest (OI) holds the blow: Despite the liquidation, open interest remained high (about $15b). Instead of the liquidated longs, new positions were immediately opened, with Binance leading the way (over $6b).
Sentiment cooling: The Funding Rate fell to zero during the spill (and even into the negative on some exchanges), and the 3-month basis sank from 4.5% to 2-3%. The market has completely cleared of overheating.
Market sales stop: Cumulative delta (CVD) after aggressive sales finally fell into a horizontal flat. Sales "by market" subsided, and limit orders began to hold the price.
Who was pressuring the market? The main initiators of the fall during the month were the American (US) and European (EU) sessions. Asia (APAC) behaved neutrally.
📌 Conclusion and scenario
The market has undergone a qualitative cleansing from excessive margin leverage. Panic stops have been collected, funding has cooled.
1️⃣ Baseline scenario: As market selling has stopped, we expect accumulation in the range of $60,000 - $62,500 in the coming days to test the upper limit of the decline.
2️⃣ Alternative: Until we see clear market buying (CVD), high Open Interest leaves the risk of a repeated withdrawal of liquidity below if buyers turn out to be passive.
{future}(BTCUSDT)
#bitcoin #metrics
📊 BTC: Big long washout and bottom search. What do the metrics say?
The last week of June turned out to be a hot one. We saw a classic retail capitulation, liquidity withdrawal "under the floor" and a further transition to consolidation. Let's analyze what happened behind the $BTC price movement from June 22 to 28.
📉 Key facts of the fall
Capitulation and volumes: After a flat in the $64k–$65k area, the price was pushed down to a local bottom near $58k–$59k. The fall was accompanied by a strong surge in trading volumes (over $20b on Binance), which indicates active buyout of the strait by large players.
Liquidation cascade: Massive washout of long positions amounted to over $150m per day.
🔍 What about derivatives and sentiment?
Open Interest (OI) holds the blow: Despite the liquidation, open interest remained high (about $15b). Instead of the liquidated longs, new positions were immediately opened, with Binance leading the way (over $6b).
Sentiment cooling: The Funding Rate fell to zero during the spill (and even into the negative on some exchanges), and the 3-month basis sank from 4.5% to 2-3%. The market has completely cleared of overheating.
Market sales stop: Cumulative delta (CVD) after aggressive sales finally fell into a horizontal flat. Sales "by market" subsided, and limit orders began to hold the price.
Who was pressuring the market? The main initiators of the fall during the month were the American (US) and European (EU) sessions. Asia (APAC) behaved neutrally.
📌 Conclusion and scenario
The market has undergone a qualitative cleansing from excessive margin leverage. Panic stops have been collected, funding has cooled.
1️⃣ Baseline scenario: As market selling has stopped, we expect accumulation in the range of $60,000 - $62,500 in the coming days to test the upper limit of the decline.
2️⃣ Alternative: Until we see clear market buying (CVD), high Open Interest leaves the risk of a repeated withdrawal of liquidity below if buyers turn out to be passive.
📊 BTC: Big long washout and bottom search. What do the metrics say?
The last week of June turned out to be a hot one. We saw a classic retail capitulation, liquidity withdrawal "under the floor" and a further transition to consolidation. Let's analyze what happened behind the $BTC price movement from June 22 to 28.
📉 Key facts of the fall
Capitulation and volumes: After a flat in the $64k–$65k area, the price was pushed down to a local bottom near $58k–$59k. The fall was accompanied by a strong surge in trading volumes (over $20b on Binance), which indicates active buyout of the strait by large players.
Liquidation cascade: Massive washout of long positions amounted to over $150m per day.
🔍 What about derivatives and sentiment?
Open Interest (OI) holds the blow: Despite the liquidation, open interest remained high (about $15b). Instead of the liquidated longs, new positions were immediately opened, with Binance leading the way (over $6b).
Sentiment cooling: The Funding Rate fell to zero during the spill (and even into the negative on some exchanges), and the 3-month basis sank from 4.5% to 2-3%. The market has completely cleared of overheating.
Market sales stop: Cumulative delta (CVD) after aggressive sales finally fell into a horizontal flat. Sales "by market" subsided, and limit orders began to hold the price.
Who was pressuring the market? The main initiators of the fall during the month were the American (US) and European (EU) sessions. Asia (APAC) behaved neutrally.
📌 Conclusion and scenario
The market has undergone a qualitative cleansing from excessive margin leverage. Panic stops have been collected, funding has cooled.
1️⃣ Baseline scenario: As market selling has stopped, we expect accumulation in the range of $60,000 - $62,500 in the coming days to test the upper limit of the decline.
2️⃣ Alternative: Until we see clear market buying (CVD), high Open Interest leaves the risk of a repeated withdrawal of liquidity below if buyers turn out to be passive.
1
77
·
--
Bullish
#cryptotradingpro #metrics
📊 $BTC : The market has gathered strength for a breakout. Analysis of derivatives and metrics 🚀
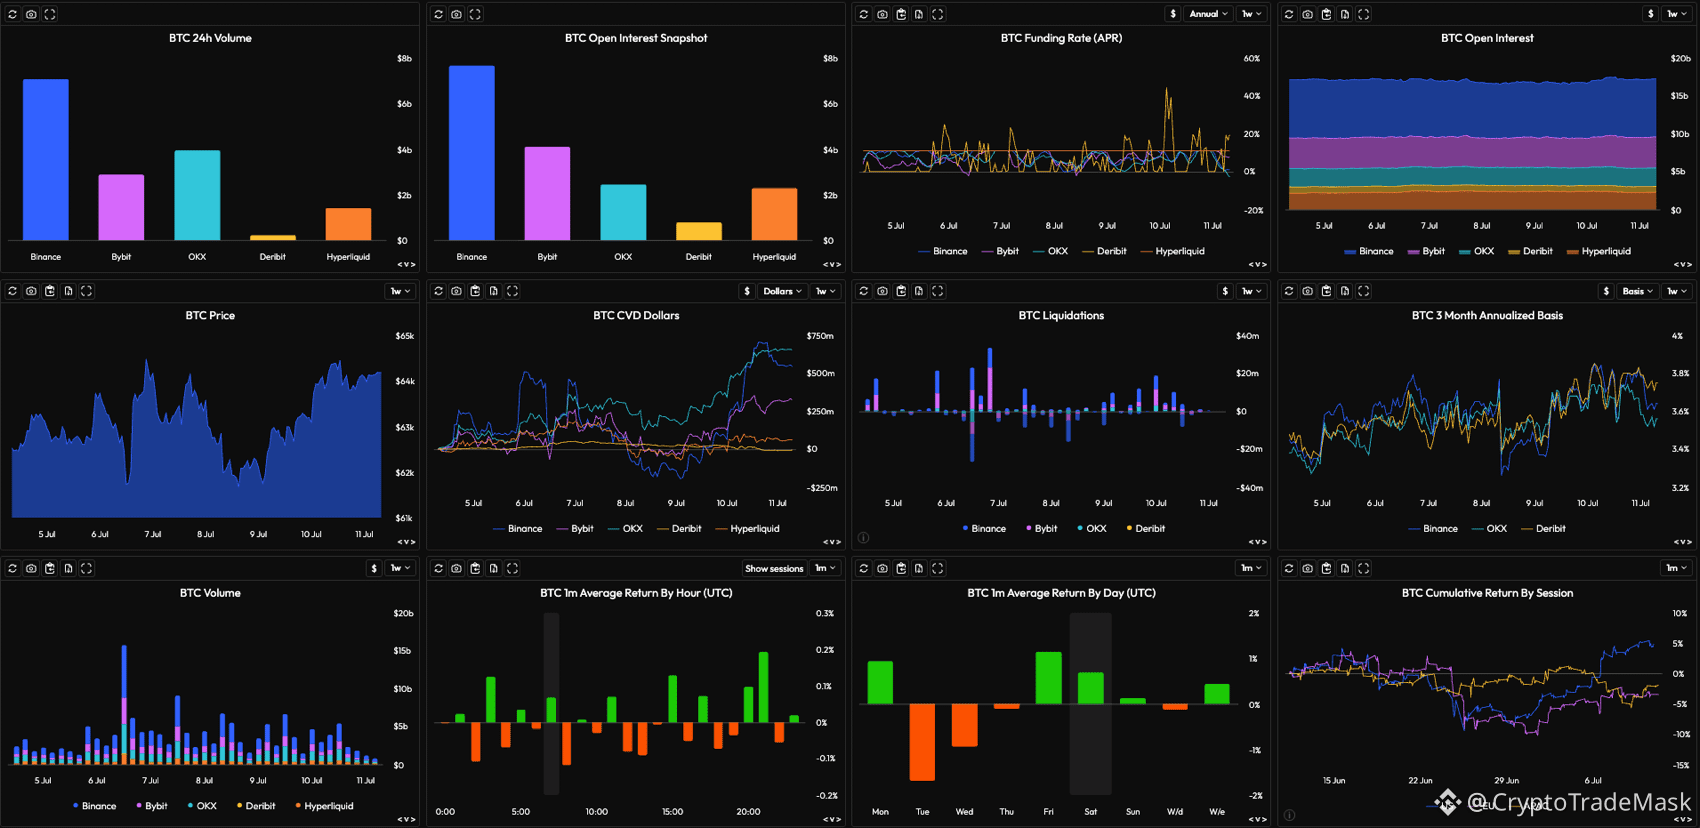
Friends, let's analyze the latest analytics on BTC. After a local spill at the beginning of the week, the market is demonstrating a classic V-shaped reversal. Metrics signal a strong bullish momentum.
Let's break down why the current growth is not just a "dead cat bounce":
➡️💥 Market clearing of passengers: On July 7, a powerful cascade of liquidations took place (both overly bold longs and early shorts were shaved off). The market shed excess margin, receiving the necessary fuel for an upward movement.
➡️🛒 Aggressive market purchases (CVD): The most important signal! Starting from July 9, the cumulative volume delta (CVD) on top exchanges (Binance, OKX, Bybit) has rapidly gone up. This means that the price is being driven not just by passive limits, but by active market buyers.
➡️🇺🇸 Who is buying? The cumulative profit chart by sessions clearly shows: the main driver is the American session (US). While Asia and Europe are hesitant, American capital (presumably due to the inflow into spot ETFs) is confidently buying the market.
📈 Futures optimism: 3-month basis has increased from ~3.3% to almost 3.8%. Traders are willing to pay a premium for futures, as they are betting on a higher price in the future. At the same time, the Funding Rate remains within normal limits - there is no market overheating, and therefore there is room for growth.
⚠️ Summary and expectations
The $BTC price has confidently consolidated above $64k and is testing local highs of the week. Since the growth is supported by real spot demand and strong purchases on derivatives, the priority remains upward.
{future}(BTCUSDT)
#cryptotradingpro #metrics
📊 $BTC : The market has gathered strength for a breakout. Analysis of derivatives and metrics 🚀
Friends, let's analyze the latest analytics on BTC. After a local spill at the beginning of the week, the market is demonstrating a classic V-shaped reversal. Metrics signal a strong bullish momentum.
Let's break down why the current growth is not just a "dead cat bounce":
➡️💥 Market clearing of passengers: On July 7, a powerful cascade of liquidations took place (both overly bold longs and early shorts were shaved off). The market shed excess margin, receiving the necessary fuel for an upward movement.
➡️🛒 Aggressive market purchases (CVD): The most important signal! Starting from July 9, the cumulative volume delta (CVD) on top exchanges (Binance, OKX, Bybit) has rapidly gone up. This means that the price is being driven not just by passive limits, but by active market buyers.
➡️🇺🇸 Who is buying? The cumulative profit chart by sessions clearly shows: the main driver is the American session (US). While Asia and Europe are hesitant, American capital (presumably due to the inflow into spot ETFs) is confidently buying the market.
📈 Futures optimism: 3-month basis has increased from ~3.3% to almost 3.8%. Traders are willing to pay a premium for futures, as they are betting on a higher price in the future. At the same time, the Funding Rate remains within normal limits - there is no market overheating, and therefore there is room for growth.
⚠️ Summary and expectations
The $BTC price has confidently consolidated above $64k and is testing local highs of the week. Since the growth is supported by real spot demand and strong purchases on derivatives, the priority remains upward.
📊 $BTC : The market has gathered strength for a breakout. Analysis of derivatives and metrics 🚀
Friends, let's analyze the latest analytics on BTC. After a local spill at the beginning of the week, the market is demonstrating a classic V-shaped reversal. Metrics signal a strong bullish momentum.
Let's break down why the current growth is not just a "dead cat bounce":
➡️💥 Market clearing of passengers: On July 7, a powerful cascade of liquidations took place (both overly bold longs and early shorts were shaved off). The market shed excess margin, receiving the necessary fuel for an upward movement.
➡️🛒 Aggressive market purchases (CVD): The most important signal! Starting from July 9, the cumulative volume delta (CVD) on top exchanges (Binance, OKX, Bybit) has rapidly gone up. This means that the price is being driven not just by passive limits, but by active market buyers.
➡️🇺🇸 Who is buying? The cumulative profit chart by sessions clearly shows: the main driver is the American session (US). While Asia and Europe are hesitant, American capital (presumably due to the inflow into spot ETFs) is confidently buying the market.
📈 Futures optimism: 3-month basis has increased from ~3.3% to almost 3.8%. Traders are willing to pay a premium for futures, as they are betting on a higher price in the future. At the same time, the Funding Rate remains within normal limits - there is no market overheating, and therefore there is room for growth.
⚠️ Summary and expectations
The $BTC price has confidently consolidated above $64k and is testing local highs of the week. Since the growth is supported by real spot demand and strong purchases on derivatives, the priority remains upward.
1
2
299
#metrics
🚀 $BTC Market Analysis: Strong Momentum or a Long Trap?
Bitcoin has surged sharply, breaking past the ~$81,000 mark. Here’s a breakdown of the market situation:
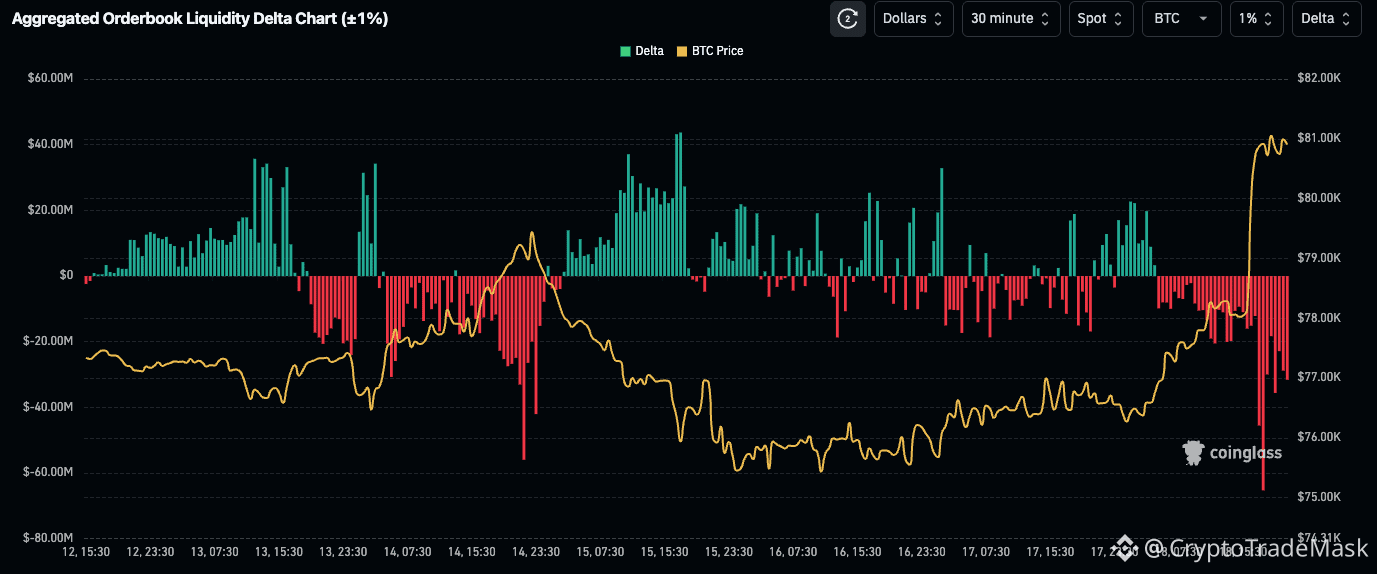
➡️ Aggressive Buying (Orderbook Liquidity Delta): The price spike was accompanied by a sharp drop in liquidity delta into the red zone (down to -$80M). This indicates that sell limit orders within a 1% range were aggressively swept up by market buyers.
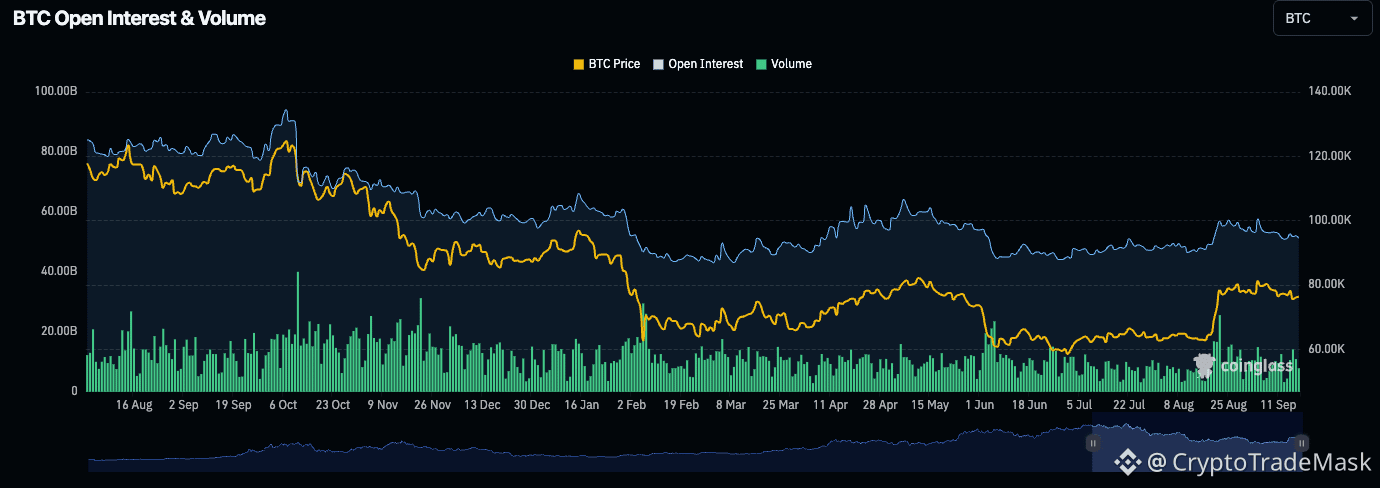
➡️ Rising Interest (Open Interest): Open Interest (OI) is rising steadily alongside the price, confirming an influx of new capital into the trend.
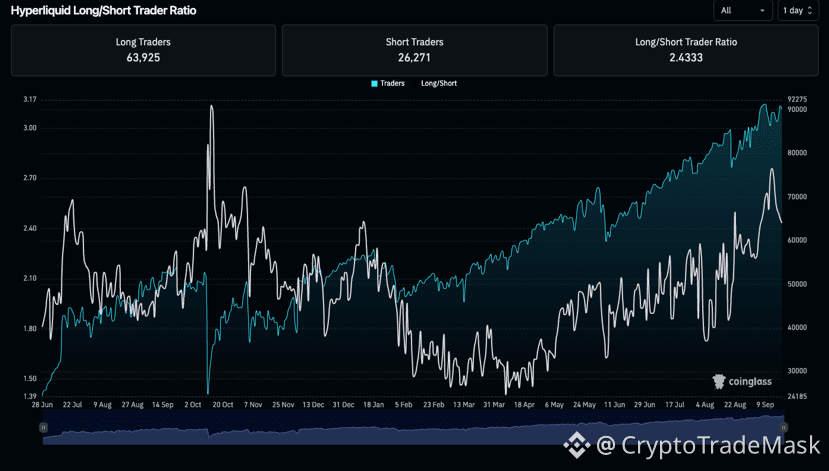
Longs Overheated (Long/Short Ratio): The position ratio on Hyperliquid has reached 2.43 (with over 70% of traders holding long positions: 63.9k vs. 26.2k).
⚠️ Conclusion:
Strong bullish momentum prevails; however, the significant dominance of long positions creates a risk of a "long squeeze." Exercise caution with leverage—a short-term volatile correction to sweep liquidity is possible before the next move! ⚡️
{future}(BTCUSDT)
#metrics
🚀 $BTC Market Analysis: Strong Momentum or a Long Trap?
Bitcoin has surged sharply, breaking past the ~$81,000 mark. Here’s a breakdown of the market situation:
➡️ Aggressive Buying (Orderbook Liquidity Delta): The price spike was accompanied by a sharp drop in liquidity delta into the red zone (down to -$80M). This indicates that sell limit orders within a 1% range were aggressively swept up by market buyers.
➡️ Rising Interest (Open Interest): Open Interest (OI) is rising steadily alongside the price, confirming an influx of new capital into the trend.
Longs Overheated (Long/Short Ratio): The position ratio on Hyperliquid has reached 2.43 (with over 70% of traders holding long positions: 63.9k vs. 26.2k).
⚠️ Conclusion:
Strong bullish momentum prevails; however, the significant dominance of long positions creates a risk of a "long squeeze." Exercise caution with leverage—a short-term volatile correction to sweep liquidity is possible before the next move! ⚡️
🚀 $BTC Market Analysis: Strong Momentum or a Long Trap?
Bitcoin has surged sharply, breaking past the ~$81,000 mark. Here’s a breakdown of the market situation:
➡️ Aggressive Buying (Orderbook Liquidity Delta): The price spike was accompanied by a sharp drop in liquidity delta into the red zone (down to -$80M). This indicates that sell limit orders within a 1% range were aggressively swept up by market buyers.
➡️ Rising Interest (Open Interest): Open Interest (OI) is rising steadily alongside the price, confirming an influx of new capital into the trend.
Longs Overheated (Long/Short Ratio): The position ratio on Hyperliquid has reached 2.43 (with over 70% of traders holding long positions: 63.9k vs. 26.2k).
⚠️ Conclusion:
Strong bullish momentum prevails; however, the significant dominance of long positions creates a risk of a "long squeeze." Exercise caution with leverage—a short-term volatile correction to sweep liquidity is possible before the next move! ⚡️
1
1
90
#bitcoin #metrics
🔥 $BTC Near Key Levels: Analysis of Derivatives, ETF Flows, and Political Context
Bitcoin continues to exhibit high volatility. After attempts to test the upper bounds of the range, the market has entered a consolidation phase. Current dynamics are driven by a combination of technical derivatives metrics, spot ETF flows, and the political backdrop in the US.
1️⃣ Derivatives and On-Chain (Dashboard Analysis):
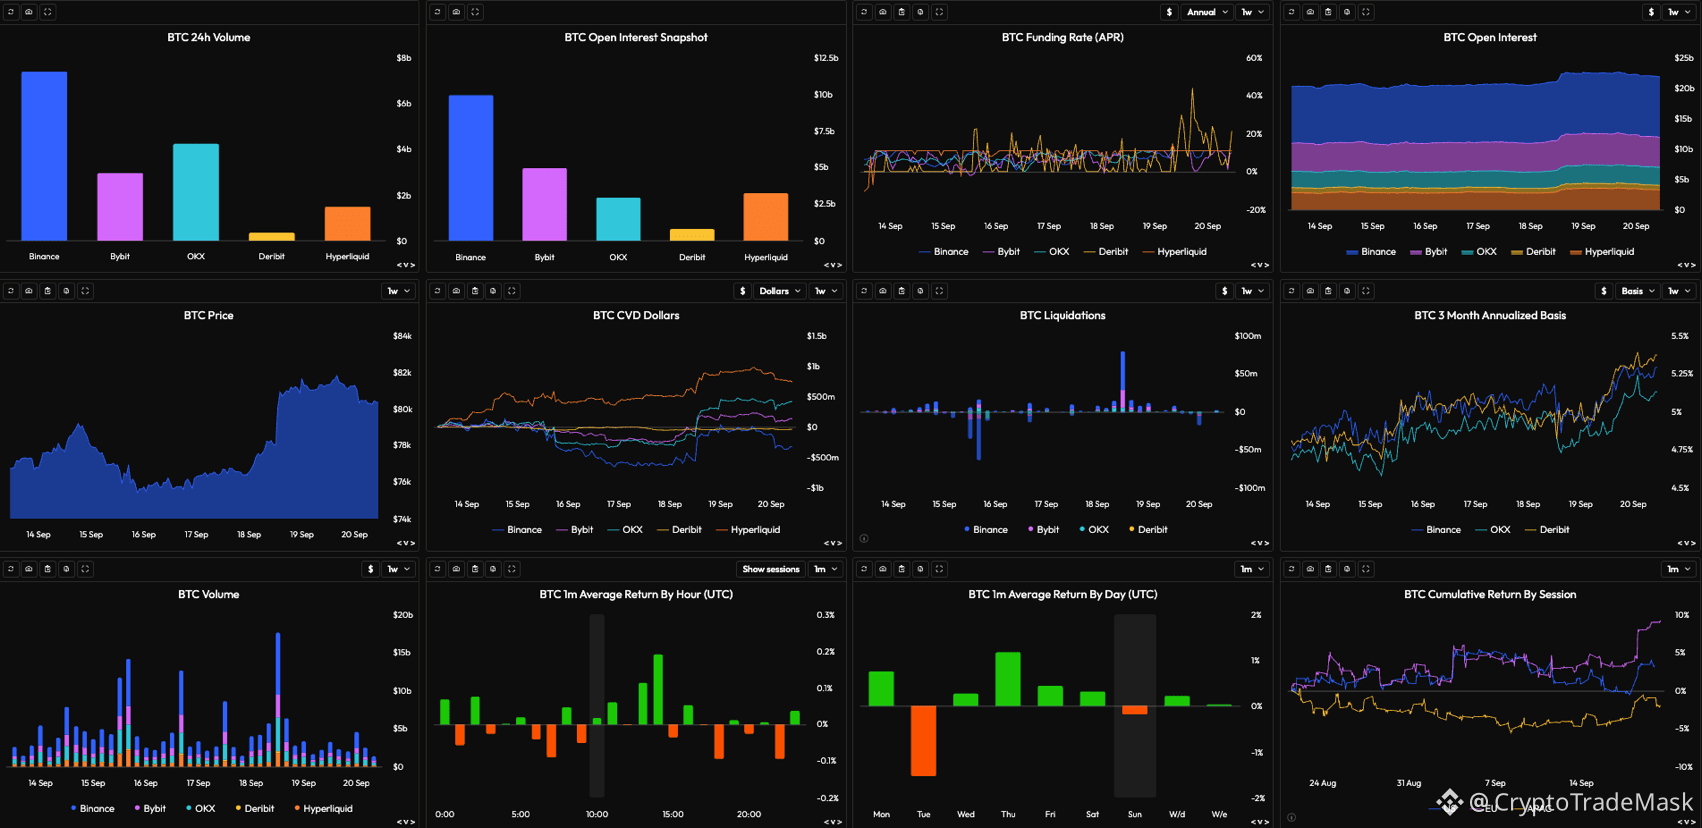
Funding Rate & Basis: The funding rate shows periodic spikes to 20–40% APR, while the 3-month basis holds steady around 5.25%–5.5%. This indicates an accumulation of high-leverage long positions and a risk of local deleveraging.
Open Interest & Liquidations: Open interest remains near peak levels (>$20 billion). Following a series of cascading short liquidations (exceeding $70M–$80M), momentum has slowed, and spot demand (CVD) requires further confirmation.
2️⃣ Political and Macroeconomic Context:
CLARITY Act in the US Senate: The failure of the procedural vote on the Digital Asset Market CLARITY Act (49–50) removed a major positive regulatory catalyst, creating short-term uncertainty for institutional investors.
US Federal Reserve Decision: The Fed's tight monetary policy and high yields on 10-year US Treasury bonds continue to curb aggressive growth in risk assets.
3️⃣ Institutional Demand (Spot ETFs):
Following significant outflows triggered by news from the Senate, spot Bitcoin ETFs are showing signs of stabilization (notably, a return of inflows to BlackRock’s IBIT). A decisive break above market resistance requires sustained net inflows exceeding $200 million per day.
🚦 Key Levels and Scenarios:
🟢 Support: $75,000 – $76,000 (a demand zone; losing this level risks opening the path to $71,000 due to a long squeeze).
🔴 Resistance: $81,000 – $82,500 (the primary barrier to resuming the macro uptrend).
⚠️ Conclusion: The current phase is one of accumulation, albeit with an elevated risk of a local correction to cool down funding rates.
{future}(BTCUSDT)
#bitcoin #metrics
🔥 $BTC Near Key Levels: Analysis of Derivatives, ETF Flows, and Political Context
Bitcoin continues to exhibit high volatility. After attempts to test the upper bounds of the range, the market has entered a consolidation phase. Current dynamics are driven by a combination of technical derivatives metrics, spot ETF flows, and the political backdrop in the US.
1️⃣ Derivatives and On-Chain (Dashboard Analysis):
Funding Rate & Basis: The funding rate shows periodic spikes to 20–40% APR, while the 3-month basis holds steady around 5.25%–5.5%. This indicates an accumulation of high-leverage long positions and a risk of local deleveraging.
Open Interest & Liquidations: Open interest remains near peak levels (>$20 billion). Following a series of cascading short liquidations (exceeding $70M–$80M), momentum has slowed, and spot demand (CVD) requires further confirmation.
2️⃣ Political and Macroeconomic Context:
CLARITY Act in the US Senate: The failure of the procedural vote on the Digital Asset Market CLARITY Act (49–50) removed a major positive regulatory catalyst, creating short-term uncertainty for institutional investors.
US Federal Reserve Decision: The Fed's tight monetary policy and high yields on 10-year US Treasury bonds continue to curb aggressive growth in risk assets.
3️⃣ Institutional Demand (Spot ETFs):
Following significant outflows triggered by news from the Senate, spot Bitcoin ETFs are showing signs of stabilization (notably, a return of inflows to BlackRock’s IBIT). A decisive break above market resistance requires sustained net inflows exceeding $200 million per day.
🚦 Key Levels and Scenarios:
🟢 Support: $75,000 – $76,000 (a demand zone; losing this level risks opening the path to $71,000 due to a long squeeze).
🔴 Resistance: $81,000 – $82,500 (the primary barrier to resuming the macro uptrend).
⚠️ Conclusion: The current phase is one of accumulation, albeit with an elevated risk of a local correction to cool down funding rates.
🔥 $BTC Near Key Levels: Analysis of Derivatives, ETF Flows, and Political Context
Bitcoin continues to exhibit high volatility. After attempts to test the upper bounds of the range, the market has entered a consolidation phase. Current dynamics are driven by a combination of technical derivatives metrics, spot ETF flows, and the political backdrop in the US.
1️⃣ Derivatives and On-Chain (Dashboard Analysis):
Funding Rate & Basis: The funding rate shows periodic spikes to 20–40% APR, while the 3-month basis holds steady around 5.25%–5.5%. This indicates an accumulation of high-leverage long positions and a risk of local deleveraging.
Open Interest & Liquidations: Open interest remains near peak levels (>$20 billion). Following a series of cascading short liquidations (exceeding $70M–$80M), momentum has slowed, and spot demand (CVD) requires further confirmation.
2️⃣ Political and Macroeconomic Context:
CLARITY Act in the US Senate: The failure of the procedural vote on the Digital Asset Market CLARITY Act (49–50) removed a major positive regulatory catalyst, creating short-term uncertainty for institutional investors.
US Federal Reserve Decision: The Fed's tight monetary policy and high yields on 10-year US Treasury bonds continue to curb aggressive growth in risk assets.
3️⃣ Institutional Demand (Spot ETFs):
Following significant outflows triggered by news from the Senate, spot Bitcoin ETFs are showing signs of stabilization (notably, a return of inflows to BlackRock’s IBIT). A decisive break above market resistance requires sustained net inflows exceeding $200 million per day.
🚦 Key Levels and Scenarios:
🟢 Support: $75,000 – $76,000 (a demand zone; losing this level risks opening the path to $71,000 due to a long squeeze).
🔴 Resistance: $81,000 – $82,500 (the primary barrier to resuming the macro uptrend).
⚠️ Conclusion: The current phase is one of accumulation, albeit with an elevated risk of a local correction to cool down funding rates.
1
28

📊 THORChain launches a public dashboard to track revenue and business metrics
The THORChain decentralized liquidity platform announced the launch of a new public dashboard. This tool aims to provide transparency around protocol revenue and trading metrics, enabling users and participants to monitor the platform's performance and operational data directly.
━━━━━━━━━━━━━━
📊 Impact: 📈 High
🏷️ DEFI
#THORChain #DeFi #Transparency #Blockchain #Metrics
📰 Source: cryptobriefing.com
📊 THORChain launches a public dashboard to track revenue and business metrics
The THORChain decentralized liquidity platform announced the launch of a new public dashboard. This tool aims to provide transparency around protocol revenue and trading metrics, enabling users and participants to monitor the platform's performance and operational data directly.
━━━━━━━━━━━━━━
📊 Impact: 📈 High
🏷️ DEFI
#THORChain #DeFi #Transparency #Blockchain #Metrics
📰 Source: cryptobriefing.com
The THORChain decentralized liquidity platform announced the launch of a new public dashboard. This tool aims to provide transparency around protocol revenue and trading metrics, enabling users and participants to monitor the platform's performance and operational data directly.
━━━━━━━━━━━━━━
📊 Impact: 📈 High
🏷️ DEFI
#THORChain #DeFi #Transparency #Blockchain #Metrics
📰 Source: cryptobriefing.com
55

📚 Understanding Total Value Locked: A key metric for evaluating DeFi protocol health
On July 20, 2026, understanding Total Value Locked $TVL becomes essential for navigating DeFi markets. TVL measures the total value of assets deposited in a protocol's smart contracts — essentially, how much capital users have committed to lending, staking, liquidity pools, or yield farming strategies. Higher $TVL generally indicates greater user trust and liquidity depth.
TVL is not a perfect metric. It can be inflated through token price appreciation, double-counting across layers, or liquidity mining incentives. Savvy users look beyond raw $TVL to metrics like revenue-to-TVL ratio, unique depositors, and underlying asset quality to assess protocol health.
📌 Key Takeaway:
TVL tells you how much capital a protocol manages — but revenue, sustainability, and unique users tell you if it will last.
#DeFi #TVL #CryptoEducation #Metrics
#BinanceAlphaAlert
📚 Understanding Total Value Locked: A key metric for evaluating DeFi protocol health
On July 20, 2026, understanding Total Value Locked $TVL becomes essential for navigating DeFi markets. TVL measures the total value of assets deposited in a protocol's smart contracts — essentially, how much capital users have committed to lending, staking, liquidity pools, or yield farming strategies. Higher $TVL generally indicates greater user trust and liquidity depth.
TVL is not a perfect metric. It can be inflated through token price appreciation, double-counting across layers, or liquidity mining incentives. Savvy users look beyond raw $TVL to metrics like revenue-to-TVL ratio, unique depositors, and underlying asset quality to assess protocol health.
📌 Key Takeaway:
TVL tells you how much capital a protocol manages — but revenue, sustainability, and unique users tell you if it will last.
#DeFi #TVL #CryptoEducation #Metrics
#BinanceAlphaAlert
On July 20, 2026, understanding Total Value Locked $TVL becomes essential for navigating DeFi markets. TVL measures the total value of assets deposited in a protocol's smart contracts — essentially, how much capital users have committed to lending, staking, liquidity pools, or yield farming strategies. Higher $TVL generally indicates greater user trust and liquidity depth.
TVL is not a perfect metric. It can be inflated through token price appreciation, double-counting across layers, or liquidity mining incentives. Savvy users look beyond raw $TVL to metrics like revenue-to-TVL ratio, unique depositors, and underlying asset quality to assess protocol health.
📌 Key Takeaway:
TVL tells you how much capital a protocol manages — but revenue, sustainability, and unique users tell you if it will last.
#DeFi #TVL #CryptoEducation #Metrics
#BinanceAlphaAlert
4
#bitcoin #metrics
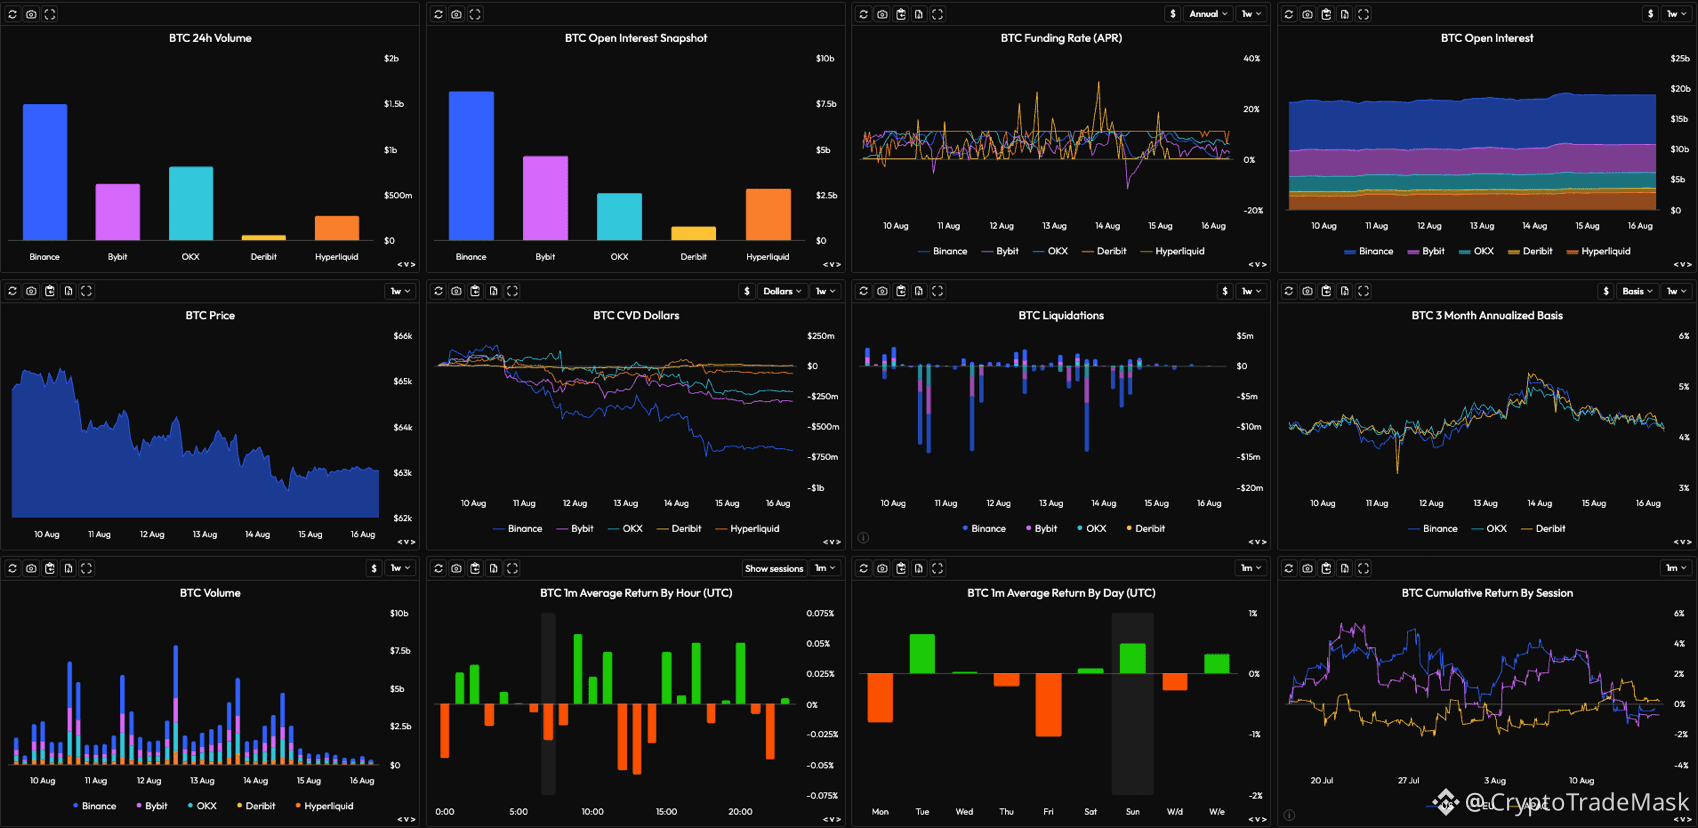
🔥$BTC /USD: Bearish pressure remains, but the market is close to a local fading of momentum
Analysis of current market metrics indicates a continuation of the downward movement with the attraction of large capital for selling.
🔑 Key factors and market metrics
➡️ Price dynamics: BTC is moving in a clear downtrend, having fallen from $66,000 to current levels around $62,500 - $63,000.
➡️ CVD (Aggressive Selling): Cumulative delta shows a steady outflow of capital on market orders. The main source of pressure is the Binance exchange (CVD dropped to -$1B).
➡️ Liquidation cascade: The decline was accompanied by a series of significant long liquidations on August 11, 12 and 14 ($10M–$15M per session).
➡️ Futures market: Open interest (OI) is holding at ~$17B–$18B, but Annualized Basis fell from 5% to 4%, indicating cooling optimism among traders.
➡️ Sessionality: The most negative dynamics are observed during the American and European sessions, while the main attempts at local rebounds fall on the middle hours of UTC (10:00–12:00 and 16:00).
📊 Summary and scenario
The advantage is completely on the side of sellers. Currently, the drop in volumes at the end of the week may provide temporary consolidation, but for a reversal, the price needs to be fixed above $64,000–$64,500 and the CVD delta needs to change towards purchases.
Priority scenario — continued testing of lower support zones in the $61,500–$62,000 area.
{future}(BTCUSDT)
#bitcoin #metrics
🔥$BTC /USD: Bearish pressure remains, but the market is close to a local fading of momentum
Analysis of current market metrics indicates a continuation of the downward movement with the attraction of large capital for selling.
🔑 Key factors and market metrics
➡️ Price dynamics: BTC is moving in a clear downtrend, having fallen from $66,000 to current levels around $62,500 - $63,000.
➡️ CVD (Aggressive Selling): Cumulative delta shows a steady outflow of capital on market orders. The main source of pressure is the Binance exchange (CVD dropped to -$1B).
➡️ Liquidation cascade: The decline was accompanied by a series of significant long liquidations on August 11, 12 and 14 ($10M–$15M per session).
➡️ Futures market: Open interest (OI) is holding at ~$17B–$18B, but Annualized Basis fell from 5% to 4%, indicating cooling optimism among traders.
➡️ Sessionality: The most negative dynamics are observed during the American and European sessions, while the main attempts at local rebounds fall on the middle hours of UTC (10:00–12:00 and 16:00).
📊 Summary and scenario
The advantage is completely on the side of sellers. Currently, the drop in volumes at the end of the week may provide temporary consolidation, but for a reversal, the price needs to be fixed above $64,000–$64,500 and the CVD delta needs to change towards purchases.
Priority scenario — continued testing of lower support zones in the $61,500–$62,000 area.
🔥$BTC /USD: Bearish pressure remains, but the market is close to a local fading of momentum
Analysis of current market metrics indicates a continuation of the downward movement with the attraction of large capital for selling.
🔑 Key factors and market metrics
➡️ Price dynamics: BTC is moving in a clear downtrend, having fallen from $66,000 to current levels around $62,500 - $63,000.
➡️ CVD (Aggressive Selling): Cumulative delta shows a steady outflow of capital on market orders. The main source of pressure is the Binance exchange (CVD dropped to -$1B).
➡️ Liquidation cascade: The decline was accompanied by a series of significant long liquidations on August 11, 12 and 14 ($10M–$15M per session).
➡️ Futures market: Open interest (OI) is holding at ~$17B–$18B, but Annualized Basis fell from 5% to 4%, indicating cooling optimism among traders.
➡️ Sessionality: The most negative dynamics are observed during the American and European sessions, while the main attempts at local rebounds fall on the middle hours of UTC (10:00–12:00 and 16:00).
📊 Summary and scenario
The advantage is completely on the side of sellers. Currently, the drop in volumes at the end of the week may provide temporary consolidation, but for a reversal, the price needs to be fixed above $64,000–$64,500 and the CVD delta needs to change towards purchases.
Priority scenario — continued testing of lower support zones in the $61,500–$62,000 area.
1
76

·
--
Article
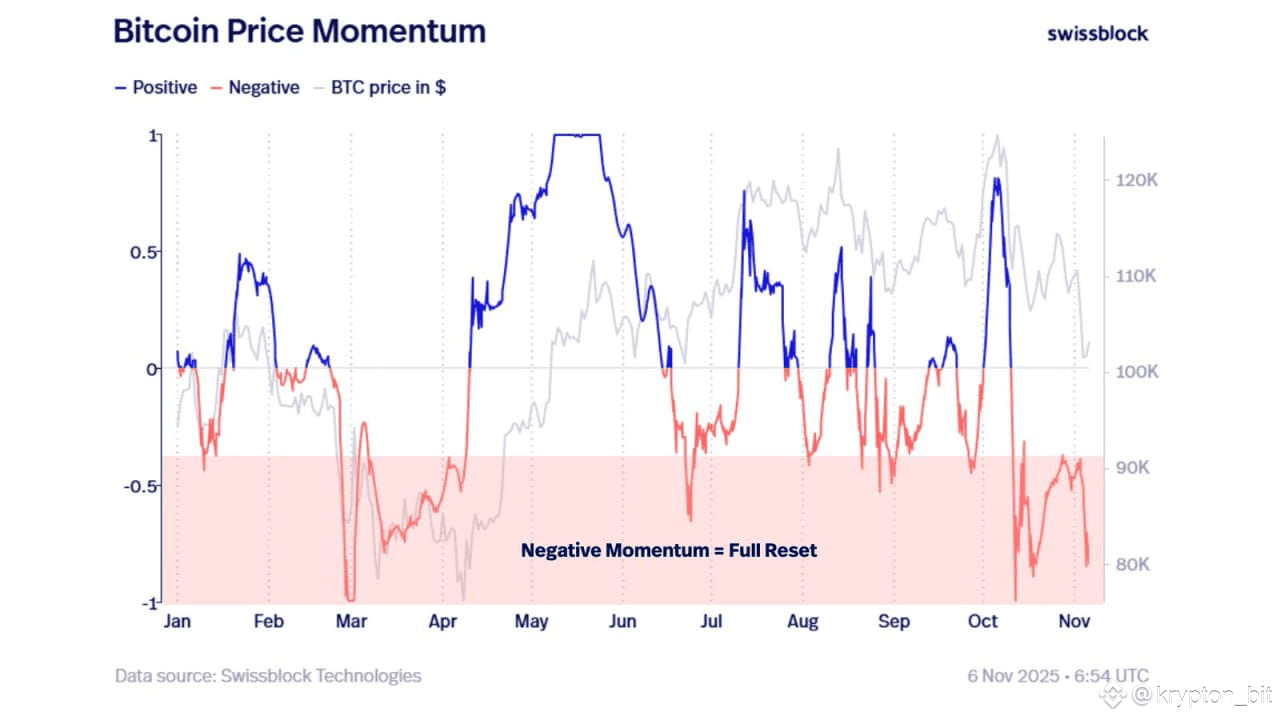
The market is in a waiting phase: pressure is decreasing, but potential remainsLong-term holders of bitcoin currently have an average profit of about 188%. This is still a high figure, but it is gradually decreasing. Typically, during such periods, some investors prefer not to lock in profits, waiting for a new growth impulse. Their average purchase price is about 35,000 dollars, which forms an important support zone.
The market is in a waiting phase: pressure is decreasing, but potential remains
Long-term holders of bitcoin currently have an average profit of about 188%. This is still a high figure, but it is gradually decreasing. Typically, during such periods, some investors prefer not to lock in profits, waiting for a new growth impulse. Their average purchase price is about 35,000 dollars, which forms an important support zone.
1
3
8.4k
·
--
Article
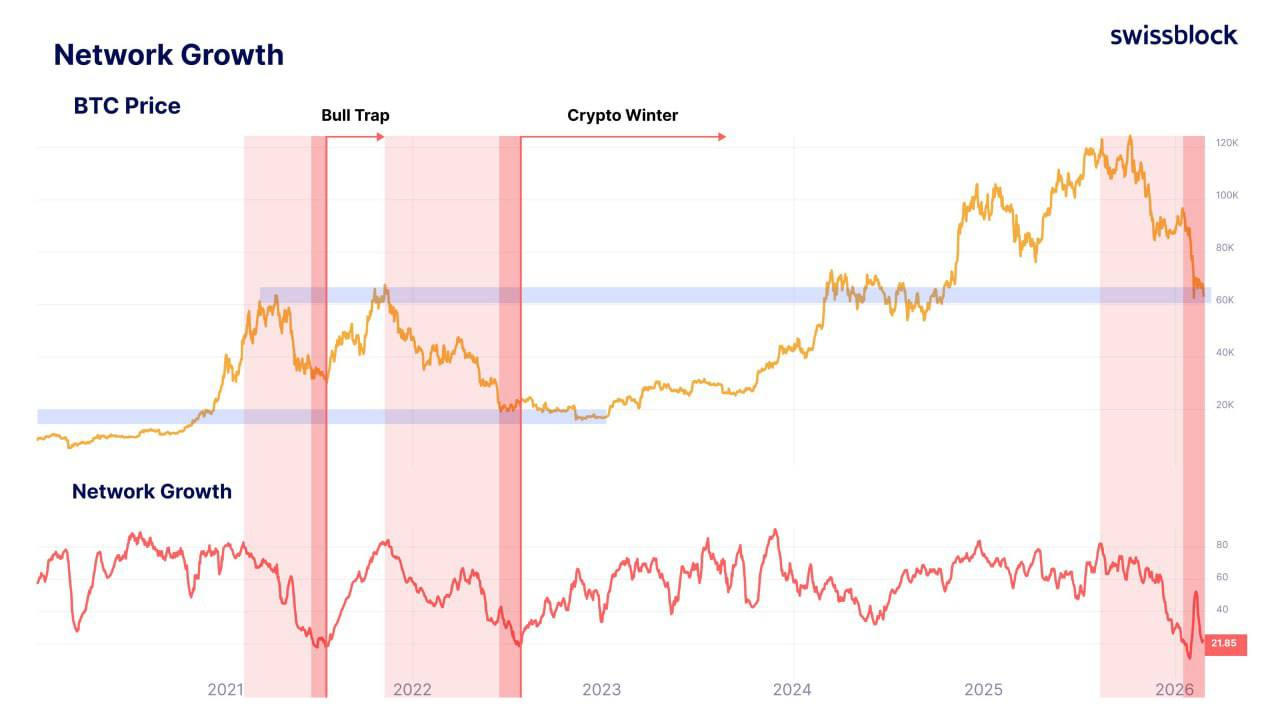
THE MARKET HAS BEEN CLEARED OF LEVERAGE. 99% OF NEW INVESTORS ARE AT A LOSS — WHAT DOES THIS MEAN FOR BTCOne of the most important phases of the cycle is currently being formed, which most participants misunderstand.
Let's analyze the facts.
📉 1️⃣ Massive cleaning of leverage
Current open interest in BTC: $44.8 billion
This is approximately –55% from the peak in October 2025.
What does this mean:
✅ the market is losing overloaded leverage
THE MARKET HAS BEEN CLEARED OF LEVERAGE. 99% OF NEW INVESTORS ARE AT A LOSS — WHAT DOES THIS MEAN FOR BTC
One of the most important phases of the cycle is currently being formed, which most participants misunderstand.
Let's analyze the facts.
📉 1️⃣ Massive cleaning of leverage
Current open interest in BTC: $44.8 billion
This is approximately –55% from the peak in October 2025.
What does this mean:
✅ the market is losing overloaded leverage
Let's analyze the facts.
📉 1️⃣ Massive cleaning of leverage
Current open interest in BTC: $44.8 billion
This is approximately –55% from the peak in October 2025.
What does this mean:
✅ the market is losing overloaded leverage
3
2
13
9.8k

·
--
$LDO DOMINATES TVL BUT OTHER METRICS TELL A DIFFERENT STORY 📊
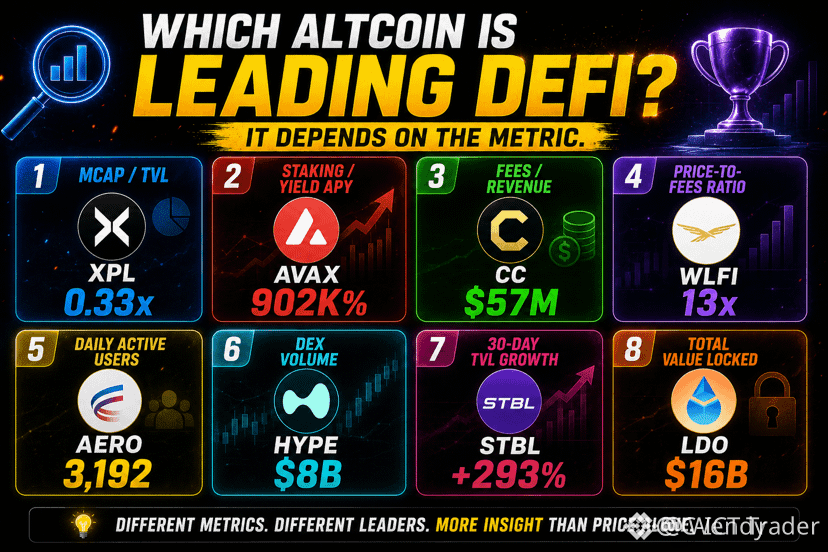
HYPE processes $8B in DEX volume while AERO leads daily active users at 3,192. No single protocol owns every category — LDO holds $16B in TVL but STBL grew TVL by 293% in 30 days. These divergences often signal where smart money is rotating next.
If you had to own just one DeFi project today, which would it be?
Not financial advice. Always manage your risk.
#LDO #DeFi #Metrics #Altcoins #CryptoAnalysis
💎
$LDO DOMINATES TVL BUT OTHER METRICS TELL A DIFFERENT STORY 📊
HYPE processes $8B in DEX volume while AERO leads daily active users at 3,192. No single protocol owns every category — LDO holds $16B in TVL but STBL grew TVL by 293% in 30 days. These divergences often signal where smart money is rotating next.
If you had to own just one DeFi project today, which would it be?
Not financial advice. Always manage your risk.
#LDO #DeFi #Metrics #Altcoins #CryptoAnalysis
💎
HYPE processes $8B in DEX volume while AERO leads daily active users at 3,192. No single protocol owns every category — LDO holds $16B in TVL but STBL grew TVL by 293% in 30 days. These divergences often signal where smart money is rotating next.
If you had to own just one DeFi project today, which would it be?
Not financial advice. Always manage your risk.
#LDO #DeFi #Metrics #Altcoins #CryptoAnalysis
💎
188
·
--
Article
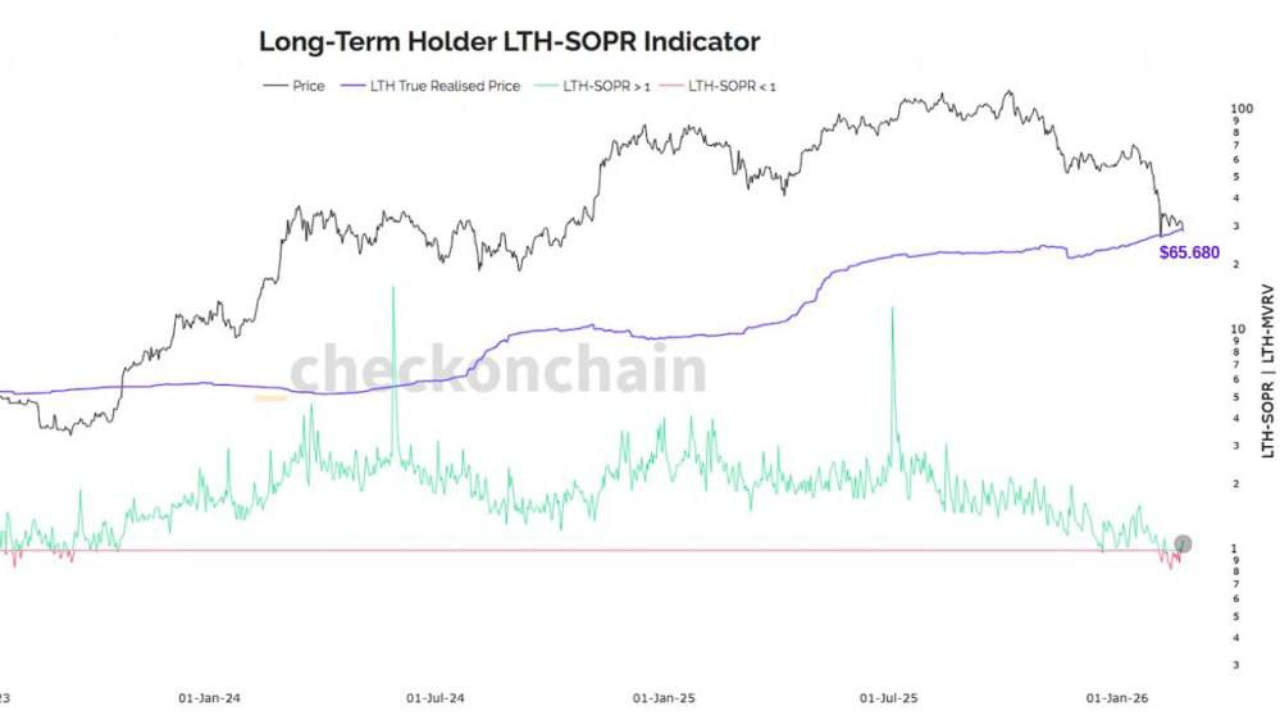
BTC AT THE EDGE: LTH LEVEL, 60K AND THE 'DEATH CROSS'The market has approached a zone where several critical metrics converge.
📊 1️⃣ Realized price of long-term holders — $65,680
The average cost basis for those holding BTC for 155+ days is now about $65,680.
This is the so-called Realized Price LTH — historically a strong balance level.
When the price is above → long-term holders are in profit.
BTC AT THE EDGE: LTH LEVEL, 60K AND THE 'DEATH CROSS'
The market has approached a zone where several critical metrics converge.
📊 1️⃣ Realized price of long-term holders — $65,680
The average cost basis for those holding BTC for 155+ days is now about $65,680.
This is the so-called Realized Price LTH — historically a strong balance level.
When the price is above → long-term holders are in profit.
📊 1️⃣ Realized price of long-term holders — $65,680
The average cost basis for those holding BTC for 155+ days is now about $65,680.
This is the so-called Realized Price LTH — historically a strong balance level.
When the price is above → long-term holders are in profit.
4
3
9
9.9k
Log in to explore more content
Join global crypto users on Binance Square
⚡️ Get latest and useful information about crypto.
💬 Trusted by the world’s largest crypto exchange.
👍 Discover real insights from verified creators.
Email / Phone number
Trending Topics
1
#AIStocksWhatNext
243,645 views
2,524 Discussing
2
#BitcoinBreaksAboveMayHighNears$86K
8,852 views
152 Discussing
3
#DogecoinRises15%
23,041 views
805 Discussing
4
#$14BBitcoinOptionsExpireFriday
1,638 views
69 Discussing
5
#BNBMarketCapPassesBNYMellon
16,340 views
595 Discussing
6
#CryptoMarketCapReclaims$3Trillion
2,136 views
60 Discussing
7
#MuseOvertakesChatGPTAsTopFreeIOSApp
10,706 views
463 Discussing
8
#TokenizedStockPlatformsCouldLaunchNextQuarter
16,835 views
528 Discussing
9
#StrategyAdds950Bitcoin
22,248 views
585 Discussing
10
#CardanoAddedToX402KitForADAPayments
22,681 views
610 Discussing