

#macroinsights
macroinsights
548,041 views
1,596 Discussing
Hot
Latest

·
--
Have you noticed that $BTC just reclaimed $86K and the market still refuses to get euphoric?
Most traders keep getting wrecked on these exact setups. They either FOMO in expecting a blow-off top that never shows up, or they sit frozen waiting for a crash that the positioning data simply does not support yet.
Bitcoin is back above $86K, but leverage has not piled in the way it does at classic cycle highs. Options traders are turning more bullish and the put/call ratio is rising as they add exposure, yet it remains far from the extremes seen around the previous top. Perps funding is still sitting below neutral, which keeps speculative leverage in check even as $ETH and the rest of the market follow the move higher. This is not the crowded, overheated tape that usually precedes a violent unwind.
The practical way to trade it is to stop treating $86K as a signal by itself. Watch funding first. As long as it stays suppressed, the market is not overheating. Track the put/call ratio against prior cycle extremes before you assume the top is in. Size your $BTC exposure so a sudden leverage spike cannot force you out. That is how you avoid selling too early or getting chopped on the next dip.
Where do you think this positioning gap takes us from here?
#Bitcoin #OnChain #MacroInsights
Have you noticed that $BTC just reclaimed $86K and the market still refuses to get euphoric?
Most traders keep getting wrecked on these exact setups. They either FOMO in expecting a blow-off top that never shows up, or they sit frozen waiting for a crash that the positioning data simply does not support yet.
Bitcoin is back above $86K, but leverage has not piled in the way it does at classic cycle highs. Options traders are turning more bullish and the put/call ratio is rising as they add exposure, yet it remains far from the extremes seen around the previous top. Perps funding is still sitting below neutral, which keeps speculative leverage in check even as $ETH and the rest of the market follow the move higher. This is not the crowded, overheated tape that usually precedes a violent unwind.
The practical way to trade it is to stop treating $86K as a signal by itself. Watch funding first. As long as it stays suppressed, the market is not overheating. Track the put/call ratio against prior cycle extremes before you assume the top is in. Size your $BTC exposure so a sudden leverage spike cannot force you out. That is how you avoid selling too early or getting chopped on the next dip.
Where do you think this positioning gap takes us from here?
#Bitcoin #OnChain #MacroInsights
Most traders keep getting wrecked on these exact setups. They either FOMO in expecting a blow-off top that never shows up, or they sit frozen waiting for a crash that the positioning data simply does not support yet.
Bitcoin is back above $86K, but leverage has not piled in the way it does at classic cycle highs. Options traders are turning more bullish and the put/call ratio is rising as they add exposure, yet it remains far from the extremes seen around the previous top. Perps funding is still sitting below neutral, which keeps speculative leverage in check even as $ETH and the rest of the market follow the move higher. This is not the crowded, overheated tape that usually precedes a violent unwind.
The practical way to trade it is to stop treating $86K as a signal by itself. Watch funding first. As long as it stays suppressed, the market is not overheating. Track the put/call ratio against prior cycle extremes before you assume the top is in. Size your $BTC exposure so a sudden leverage spike cannot force you out. That is how you avoid selling too early or getting chopped on the next dip.
Where do you think this positioning gap takes us from here?
#Bitcoin #OnChain #MacroInsights

12
·
--
everyone thinks regulatory clarity is right around the corner, but actually the political delays are quietly capping our upside.
most traders are busy longing every local pump expecting an instant breakout, only to get chopped up and bleed margin while waiting on legislation that is nowhere near ready.
look at what is happening with the clarity act right now. the market was front-running this bill as the ultimate green light, but with Washington stalling out, $BTC simply lacks the regulatory tailwind needed to break through 100,000 dollars anytime soon. ngl watching the order books stall out below six figures is a clear sign that big institutions are holding back until the rules are set in stone.
this does not just cap bitcoin either ser. when $BTC stays pinned in this range, liquidity dries up across the board and leaves assets like $ETH struggling to find momentum. we are likely stuck in this chop longer than most people want to admit.
how are you positioning your spot bags while we wait this out?
#Bitcoin #CryptoTrading #MacroInsights
everyone thinks regulatory clarity is right around the corner, but actually the political delays are quietly capping our upside.
most traders are busy longing every local pump expecting an instant breakout, only to get chopped up and bleed margin while waiting on legislation that is nowhere near ready.
look at what is happening with the clarity act right now. the market was front-running this bill as the ultimate green light, but with Washington stalling out, $BTC simply lacks the regulatory tailwind needed to break through 100,000 dollars anytime soon. ngl watching the order books stall out below six figures is a clear sign that big institutions are holding back until the rules are set in stone.
this does not just cap bitcoin either ser. when $BTC stays pinned in this range, liquidity dries up across the board and leaves assets like $ETH struggling to find momentum. we are likely stuck in this chop longer than most people want to admit.
how are you positioning your spot bags while we wait this out?
#Bitcoin #CryptoTrading #MacroInsights
most traders are busy longing every local pump expecting an instant breakout, only to get chopped up and bleed margin while waiting on legislation that is nowhere near ready.
look at what is happening with the clarity act right now. the market was front-running this bill as the ultimate green light, but with Washington stalling out, $BTC simply lacks the regulatory tailwind needed to break through 100,000 dollars anytime soon. ngl watching the order books stall out below six figures is a clear sign that big institutions are holding back until the rules are set in stone.
this does not just cap bitcoin either ser. when $BTC stays pinned in this range, liquidity dries up across the board and leaves assets like $ETH struggling to find momentum. we are likely stuck in this chop longer than most people want to admit.
how are you positioning your spot bags while we wait this out?
#Bitcoin #CryptoTrading #MacroInsights

127
·
--
If you’re still fading corporate $BTC accumulation as “old news,” stop now.
Traders keep getting chopped up trying to time every dip, while the bigger players use boring execution to build positions. The pain is real: sell too early, miss the next leg, then FOMO back in higher.
Strategy just resumed buying after a two-month pause, adding 4,603 $BTC for $370M at an average price of $80,318. That brings total holdings to 845,050 BTC, acquired at an average of $75,412.
The bearish take is obvious: funding Bitcoin buys by selling 4.53M $MSTR shares creates dilution risk, even if it raised $602M. But I lean bullish here because they also spent $151.8M on STRC buybacks, which suggests this is still a structured capital strategy, not panic buying.
Is this smart balance-sheet engineering, or is Strategy taking on too much risk at this stage of the cycle?
#Bitcoin #CryptoMarkets #MacroInsights
If you’re still fading corporate $BTC accumulation as “old news,” stop now.
Traders keep getting chopped up trying to time every dip, while the bigger players use boring execution to build positions. The pain is real: sell too early, miss the next leg, then FOMO back in higher.
Strategy just resumed buying after a two-month pause, adding 4,603 $BTC for $370M at an average price of $80,318. That brings total holdings to 845,050 BTC, acquired at an average of $75,412.
The bearish take is obvious: funding Bitcoin buys by selling 4.53M $MSTR shares creates dilution risk, even if it raised $602M. But I lean bullish here because they also spent $151.8M on STRC buybacks, which suggests this is still a structured capital strategy, not panic buying.
Is this smart balance-sheet engineering, or is Strategy taking on too much risk at this stage of the cycle?
#Bitcoin #CryptoMarkets #MacroInsights
Traders keep getting chopped up trying to time every dip, while the bigger players use boring execution to build positions. The pain is real: sell too early, miss the next leg, then FOMO back in higher.
Strategy just resumed buying after a two-month pause, adding 4,603 $BTC for $370M at an average price of $80,318. That brings total holdings to 845,050 BTC, acquired at an average of $75,412.
The bearish take is obvious: funding Bitcoin buys by selling 4.53M $MSTR shares creates dilution risk, even if it raised $602M. But I lean bullish here because they also spent $151.8M on STRC buybacks, which suggests this is still a structured capital strategy, not panic buying.
Is this smart balance-sheet engineering, or is Strategy taking on too much risk at this stage of the cycle?
#Bitcoin #CryptoMarkets #MacroInsights

37
·
--
Picture this: one hawkish speech at Jackson Hole and Bitcoin suddenly slipped below $78,000.
That is the problem traders keep facing with macro-driven markets. A chart can look ready for a breakout, but one shift in rate-cut expectations can turn FOMO buying into a painful exit within hours.
Kevin Warsh’s hawkish tone pushed back against the idea of easier policy, and risk assets came under fresh pressure. $BTC reacted sharply, dropping under $78K before recovering and moving back toward $80K.
The broader lesson is in the comparison. Bitcoin still trades like a high-beta risk asset when liquidity expectations change, much like $ETH and $SOL during previous central-bank repricings. The recovery toward $80K shows buyers are still active, but the failed move higher also highlights how fragile momentum can be when macro takes control.
Are traders underestimating the next rate decision, or is Bitcoin showing stronger resilience this time?
#Bitcoin #CryptoMarkets #MacroInsights
Picture this: one hawkish speech at Jackson Hole and Bitcoin suddenly slipped below $78,000.
That is the problem traders keep facing with macro-driven markets. A chart can look ready for a breakout, but one shift in rate-cut expectations can turn FOMO buying into a painful exit within hours.
Kevin Warsh’s hawkish tone pushed back against the idea of easier policy, and risk assets came under fresh pressure. $BTC reacted sharply, dropping under $78K before recovering and moving back toward $80K.
The broader lesson is in the comparison. Bitcoin still trades like a high-beta risk asset when liquidity expectations change, much like $ETH and $SOL during previous central-bank repricings. The recovery toward $80K shows buyers are still active, but the failed move higher also highlights how fragile momentum can be when macro takes control.
Are traders underestimating the next rate decision, or is Bitcoin showing stronger resilience this time?
#Bitcoin #CryptoMarkets #MacroInsights
That is the problem traders keep facing with macro-driven markets. A chart can look ready for a breakout, but one shift in rate-cut expectations can turn FOMO buying into a painful exit within hours.
Kevin Warsh’s hawkish tone pushed back against the idea of easier policy, and risk assets came under fresh pressure. $BTC reacted sharply, dropping under $78K before recovering and moving back toward $80K.
The broader lesson is in the comparison. Bitcoin still trades like a high-beta risk asset when liquidity expectations change, much like $ETH and $SOL during previous central-bank repricings. The recovery toward $80K shows buyers are still active, but the failed move higher also highlights how fragile momentum can be when macro takes control.
Are traders underestimating the next rate decision, or is Bitcoin showing stronger resilience this time?
#Bitcoin #CryptoMarkets #MacroInsights
83

·
--
Bullish
German unemployment unexpectedly falls in May, but the recovery signal remains fragile
📌 Germany’s labor market delivered a better-than-expected reading in May, with seasonally adjusted unemployment falling by 12,000, in sharp contrast to the Reuters poll forecast for a 10,000 increase. The unemployment rate also edged down to 6.3%, suggesting short-term pressure has eased after a weak start to the year.
💡 The unadjusted number of unemployed people fell to 2.95 million, down 58,000 from the previous month and below the 3 million mark for the first time after four consecutive months above that level. This is notable because Germany remains the largest economy in the Eurozone, so labor market shifts can influence expectations for consumption, fiscal pressure, and regional monetary policy.
⚠️ Still, this data is not enough to confirm a sustainable turnaround. Germany’s labor agency said the decline was largely a one-off effect following weak April figures, while Chair Andrea Nahles also noted that the spring recovery has not gained real momentum.
🔎 The key point to watch is that job vacancies stood at 643,000, up 8,000 from a year earlier, but German companies remain cautious amid geopolitical risks and a sluggish economic outlook. That means hiring momentum may stay limited in the coming months.
📉 For financial markets, the better-than-expected data may offer mild short-term support for Germany and the wider Eurozone, but it is unlikely to change expectations for ECB easing. If growth and employment indicators remain weak, rate-cut expectations will likely stay central for the euro and German bond yields.
#MacroInsights
German unemployment unexpectedly falls in May, but the recovery signal remains fragile
📌 Germany’s labor market delivered a better-than-expected reading in May, with seasonally adjusted unemployment falling by 12,000, in sharp contrast to the Reuters poll forecast for a 10,000 increase. The unemployment rate also edged down to 6.3%, suggesting short-term pressure has eased after a weak start to the year.
💡 The unadjusted number of unemployed people fell to 2.95 million, down 58,000 from the previous month and below the 3 million mark for the first time after four consecutive months above that level. This is notable because Germany remains the largest economy in the Eurozone, so labor market shifts can influence expectations for consumption, fiscal pressure, and regional monetary policy.
⚠️ Still, this data is not enough to confirm a sustainable turnaround. Germany’s labor agency said the decline was largely a one-off effect following weak April figures, while Chair Andrea Nahles also noted that the spring recovery has not gained real momentum.
🔎 The key point to watch is that job vacancies stood at 643,000, up 8,000 from a year earlier, but German companies remain cautious amid geopolitical risks and a sluggish economic outlook. That means hiring momentum may stay limited in the coming months.
📉 For financial markets, the better-than-expected data may offer mild short-term support for Germany and the wider Eurozone, but it is unlikely to change expectations for ECB easing. If growth and employment indicators remain weak, rate-cut expectations will likely stay central for the euro and German bond yields.
#MacroInsights
📌 Germany’s labor market delivered a better-than-expected reading in May, with seasonally adjusted unemployment falling by 12,000, in sharp contrast to the Reuters poll forecast for a 10,000 increase. The unemployment rate also edged down to 6.3%, suggesting short-term pressure has eased after a weak start to the year.
💡 The unadjusted number of unemployed people fell to 2.95 million, down 58,000 from the previous month and below the 3 million mark for the first time after four consecutive months above that level. This is notable because Germany remains the largest economy in the Eurozone, so labor market shifts can influence expectations for consumption, fiscal pressure, and regional monetary policy.
⚠️ Still, this data is not enough to confirm a sustainable turnaround. Germany’s labor agency said the decline was largely a one-off effect following weak April figures, while Chair Andrea Nahles also noted that the spring recovery has not gained real momentum.
🔎 The key point to watch is that job vacancies stood at 643,000, up 8,000 from a year earlier, but German companies remain cautious amid geopolitical risks and a sluggish economic outlook. That means hiring momentum may stay limited in the coming months.
📉 For financial markets, the better-than-expected data may offer mild short-term support for Germany and the wider Eurozone, but it is unlikely to change expectations for ECB easing. If growth and employment indicators remain weak, rate-cut expectations will likely stay central for the euro and German bond yields.
#MacroInsights

47
·
--
If you’re still treating a quiet $BTC market like “nothing is happening,” stop now.
The expensive mistake in crypto is assuming low volume means low risk. Traders get chopped up waiting for fireworks, then FOMO the first real move because they missed the compression phase.
Right now, Bitcoin is sitting in one of those eerie calm zones: spot volumes, exchange flows, and volatility are all near extreme lows. That usually means the market isn’t dead. It’s loading.
The macro twist is even more interesting. Treasuries have out-yielded the crypto carry trade for only the second time on record. That’s a rare setup, and it makes this feel less like a random $BTC lull and more like a 2020/2023-style “everyone got bored before the regime shift” moment.
But unlike past cycles, the competition for capital is real now. If risk-free yield looks better than chasing $ETH or $SOL carry, crypto needs more than vibes to pull liquidity back.
Is this the calm before Bitcoin expansion, or is macro finally forcing crypto to compete for attention?
#Bitcoin #CryptoMarket #MacroInsights
If you’re still treating a quiet $BTC market like “nothing is happening,” stop now.
The expensive mistake in crypto is assuming low volume means low risk. Traders get chopped up waiting for fireworks, then FOMO the first real move because they missed the compression phase.
Right now, Bitcoin is sitting in one of those eerie calm zones: spot volumes, exchange flows, and volatility are all near extreme lows. That usually means the market isn’t dead. It’s loading.
The macro twist is even more interesting. Treasuries have out-yielded the crypto carry trade for only the second time on record. That’s a rare setup, and it makes this feel less like a random $BTC lull and more like a 2020/2023-style “everyone got bored before the regime shift” moment.
But unlike past cycles, the competition for capital is real now. If risk-free yield looks better than chasing $ETH or $SOL carry, crypto needs more than vibes to pull liquidity back.
Is this the calm before Bitcoin expansion, or is macro finally forcing crypto to compete for attention?
#Bitcoin #CryptoMarket #MacroInsights
The expensive mistake in crypto is assuming low volume means low risk. Traders get chopped up waiting for fireworks, then FOMO the first real move because they missed the compression phase.
Right now, Bitcoin is sitting in one of those eerie calm zones: spot volumes, exchange flows, and volatility are all near extreme lows. That usually means the market isn’t dead. It’s loading.
The macro twist is even more interesting. Treasuries have out-yielded the crypto carry trade for only the second time on record. That’s a rare setup, and it makes this feel less like a random $BTC lull and more like a 2020/2023-style “everyone got bored before the regime shift” moment.
But unlike past cycles, the competition for capital is real now. If risk-free yield looks better than chasing $ETH or $SOL carry, crypto needs more than vibes to pull liquidity back.
Is this the calm before Bitcoin expansion, or is macro finally forcing crypto to compete for attention?
#Bitcoin #CryptoMarket #MacroInsights

22
·
--
Everyone thinks Saylor only has one button: buy $BTC... but actually this week shows the risk is more about liquidity than conviction.
A lot of traders see a whale headline and insta-FOMO, then get chopped when the real move was cash management. If you ignore the reserve side, ser, you’re trading half the story.
Case study: over the past week, Saylor sold $544M of $MSTR and added around $525M to USD reserves. That puts him at $3.75B in cash, reportedly for $STRC dividend coverage, while still holding about $54.80B in $BTC exposure.
The warning is simple: not every Saylor move means “instant pump.” Sometimes the alpha is defensive positioning, runway, and making sure forced selling doesn’t become the headline later.
When a balance sheet this big starts stacking dry powder, I’m watching liquidity conditions as much as price. Where do you think this goes from here? #BTC #MacroInsights #CryptoMarkets
Everyone thinks Saylor only has one button: buy $BTC ... but actually this week shows the risk is more about liquidity than conviction.
A lot of traders see a whale headline and insta-FOMO, then get chopped when the real move was cash management. If you ignore the reserve side, ser, you’re trading half the story.
Case study: over the past week, Saylor sold $544M of $MSTR and added around $525M to USD reserves. That puts him at $3.75B in cash, reportedly for $STRC dividend coverage, while still holding about $54.80B in $BTC exposure.
The warning is simple: not every Saylor move means “instant pump.” Sometimes the alpha is defensive positioning, runway, and making sure forced selling doesn’t become the headline later.
When a balance sheet this big starts stacking dry powder, I’m watching liquidity conditions as much as price. Where do you think this goes from here? #BTC #MacroInsights #CryptoMarkets
A lot of traders see a whale headline and insta-FOMO, then get chopped when the real move was cash management. If you ignore the reserve side, ser, you’re trading half the story.
Case study: over the past week, Saylor sold $544M of $MSTR and added around $525M to USD reserves. That puts him at $3.75B in cash, reportedly for $STRC dividend coverage, while still holding about $54.80B in $BTC exposure.
The warning is simple: not every Saylor move means “instant pump.” Sometimes the alpha is defensive positioning, runway, and making sure forced selling doesn’t become the headline later.
When a balance sheet this big starts stacking dry powder, I’m watching liquidity conditions as much as price. Where do you think this goes from here? #BTC #MacroInsights #CryptoMarkets

15

🚨 SOUTH KOREA MACRO SHIFT SIGNALS INSTITUTIONAL CAPITAL REALLOCATION FOR $FET 📊
South Korea dismissing U.S. memory chip mandate demands highlights a crucial pivot in sovereign capital allocation. 🔍 With Samsung and SK Hynix already committing $88 billion toward tech infrastructure, institutional flow is actively rejecting overhead capital inefficiency.
From a market structure standpoint, high-level macro friction often triggers liquidity rotation across high-beta computational protocols like $FET . ⚡ As cross-border capital mandates find equilibrium, smart money positioning favors decentralized infrastructure that captures existing computational momentum.
Key order flow blocks remain defended while macro narratives recalibrate across legacy and digital yield assets. 💬 Will this strategic infrastructure shift spark a liquidity sweep into AI data assets? 👇
⚠️ Not financial advice. Always manage your risk. 🛡️
🏷️ #FET #MacroInsights #MarketStructure #Crypto
⚡ 🔍
🚨 SOUTH KOREA MACRO SHIFT SIGNALS INSTITUTIONAL CAPITAL REALLOCATION FOR $FET 📊
South Korea dismissing U.S. memory chip mandate demands highlights a crucial pivot in sovereign capital allocation. 🔍 With Samsung and SK Hynix already committing $88 billion toward tech infrastructure, institutional flow is actively rejecting overhead capital inefficiency.
From a market structure standpoint, high-level macro friction often triggers liquidity rotation across high-beta computational protocols like $FET . ⚡ As cross-border capital mandates find equilibrium, smart money positioning favors decentralized infrastructure that captures existing computational momentum.
Key order flow blocks remain defended while macro narratives recalibrate across legacy and digital yield assets. 💬 Will this strategic infrastructure shift spark a liquidity sweep into AI data assets? 👇
⚠️ Not financial advice. Always manage your risk. 🛡️
🏷️ #FET #MacroInsights #MarketStructure #Crypto
⚡ 🔍
South Korea dismissing U.S. memory chip mandate demands highlights a crucial pivot in sovereign capital allocation. 🔍 With Samsung and SK Hynix already committing $88 billion toward tech infrastructure, institutional flow is actively rejecting overhead capital inefficiency.
From a market structure standpoint, high-level macro friction often triggers liquidity rotation across high-beta computational protocols like $FET . ⚡ As cross-border capital mandates find equilibrium, smart money positioning favors decentralized infrastructure that captures existing computational momentum.
Key order flow blocks remain defended while macro narratives recalibrate across legacy and digital yield assets. 💬 Will this strategic infrastructure shift spark a liquidity sweep into AI data assets? 👇
⚠️ Not financial advice. Always manage your risk. 🛡️
🏷️ #FET #MacroInsights #MarketStructure #Crypto
⚡ 🔍
1
207
·
--
Bullish
UK labor market turns defensive as companies shift toward temporary hiring
📌 The UK labor market is showing clearer signs of caution as companies increase temporary hiring while delaying permanent recruitment plans. This is no longer just a labor shortage story, but a reflection of defensive business sentiment amid high costs and macro uncertainty.
📉 REC/KPMG data showed the permanent staff placement index falling to 44.1 from 47.5, marking the sharpest decline in 10 months. In contrast, temporary hiring rose to 52.2 from 50.4, suggesting that companies still need workers but are avoiding long-term fixed costs.
⚠️ Pressure is coming from several directions at once, including weak economic confidence, high operating costs, new labor regulations, and Middle East instability bringing energy risks back into focus. In this environment, temporary contracts allow companies to fill staffing gaps while keeping flexibility.
🔎 The broader labor picture is also softening, with the UK unemployment rate rising to 5% and the number of young people not in work or education exceeding 1 million. Starting salaries and temporary pay increased only slightly, showing that wage pressure is cooling while labor demand is also weakening.
💡 The key point is that hiring demand has not disappeared, but it is becoming more uneven across sectors. Healthcare, nursing, and care services still show demand for permanent staff, while sectors more exposed to consumer spending and costs are turning more defensive.
✅ This is an early signal that UK companies are prioritizing safety over expansion. If geopolitical uncertainty and energy costs remain elevated, temporary hiring may continue to act as a buffer for the labor market in the coming months.
#MacroInsights $HOME $TON $BTC
UK labor market turns defensive as companies shift toward temporary hiring
📌 The UK labor market is showing clearer signs of caution as companies increase temporary hiring while delaying permanent recruitment plans. This is no longer just a labor shortage story, but a reflection of defensive business sentiment amid high costs and macro uncertainty.
📉 REC/KPMG data showed the permanent staff placement index falling to 44.1 from 47.5, marking the sharpest decline in 10 months. In contrast, temporary hiring rose to 52.2 from 50.4, suggesting that companies still need workers but are avoiding long-term fixed costs.
⚠️ Pressure is coming from several directions at once, including weak economic confidence, high operating costs, new labor regulations, and Middle East instability bringing energy risks back into focus. In this environment, temporary contracts allow companies to fill staffing gaps while keeping flexibility.
🔎 The broader labor picture is also softening, with the UK unemployment rate rising to 5% and the number of young people not in work or education exceeding 1 million. Starting salaries and temporary pay increased only slightly, showing that wage pressure is cooling while labor demand is also weakening.
💡 The key point is that hiring demand has not disappeared, but it is becoming more uneven across sectors. Healthcare, nursing, and care services still show demand for permanent staff, while sectors more exposed to consumer spending and costs are turning more defensive.
✅ This is an early signal that UK companies are prioritizing safety over expansion. If geopolitical uncertainty and energy costs remain elevated, temporary hiring may continue to act as a buffer for the labor market in the coming months.
#MacroInsights $HOME $TON $BTC
📌 The UK labor market is showing clearer signs of caution as companies increase temporary hiring while delaying permanent recruitment plans. This is no longer just a labor shortage story, but a reflection of defensive business sentiment amid high costs and macro uncertainty.
📉 REC/KPMG data showed the permanent staff placement index falling to 44.1 from 47.5, marking the sharpest decline in 10 months. In contrast, temporary hiring rose to 52.2 from 50.4, suggesting that companies still need workers but are avoiding long-term fixed costs.
⚠️ Pressure is coming from several directions at once, including weak economic confidence, high operating costs, new labor regulations, and Middle East instability bringing energy risks back into focus. In this environment, temporary contracts allow companies to fill staffing gaps while keeping flexibility.
🔎 The broader labor picture is also softening, with the UK unemployment rate rising to 5% and the number of young people not in work or education exceeding 1 million. Starting salaries and temporary pay increased only slightly, showing that wage pressure is cooling while labor demand is also weakening.
💡 The key point is that hiring demand has not disappeared, but it is becoming more uneven across sectors. Healthcare, nursing, and care services still show demand for permanent staff, while sectors more exposed to consumer spending and costs are turning more defensive.
✅ This is an early signal that UK companies are prioritizing safety over expansion. If geopolitical uncertainty and energy costs remain elevated, temporary hiring may continue to act as a buffer for the labor market in the coming months.
#MacroInsights $HOME $TON $BTC

1
284
·
--
Here’s what happened when the latest FOMC decision hit the market: $BTC slipped 2.8%, and honestly, that move fits the old script.
The hard part for traders is not the first red candle. It’s knowing whether to hold through macro noise, cut early, or avoid buying the dip too soon.
As a case study, this FOMC reaction looks very similar to previous ones. In 6 of the last 7 comparable events, $BTC saw an average post-FOMC drop of around 4-5%. So far, we’re only at 2.8%, which means the current pullback is not unusual by historical standards.
If the pattern keeps playing out, the low $60K-$61K zone becomes the area to watch. That’s where buyers need to show up. The key level is $60K, because losing it could trigger a sweep of recent lows and drag sentiment lower across majors like $ETH and $SOL.
The lesson here is simple: macro events often repeat in rhythm, even if not perfectly in price. FOMC dips have punished late FOMO buyers before, but they’ve also created cleaner entries when support holds.
Do you think $BTC defends $60K, or are we setting up for a deeper sweep?
#BTC #CryptoTrading #MacroInsights
Here’s what happened when the latest FOMC decision hit the market: $BTC slipped 2.8%, and honestly, that move fits the old script.
The hard part for traders is not the first red candle. It’s knowing whether to hold through macro noise, cut early, or avoid buying the dip too soon.
As a case study, this FOMC reaction looks very similar to previous ones. In 6 of the last 7 comparable events, $BTC saw an average post-FOMC drop of around 4-5%. So far, we’re only at 2.8%, which means the current pullback is not unusual by historical standards.
If the pattern keeps playing out, the low $60K-$61K zone becomes the area to watch. That’s where buyers need to show up. The key level is $60K, because losing it could trigger a sweep of recent lows and drag sentiment lower across majors like $ETH and $SOL .
The lesson here is simple: macro events often repeat in rhythm, even if not perfectly in price. FOMC dips have punished late FOMO buyers before, but they’ve also created cleaner entries when support holds.
Do you think $BTC defends $60K, or are we setting up for a deeper sweep?
#BTC #CryptoTrading #MacroInsights
The hard part for traders is not the first red candle. It’s knowing whether to hold through macro noise, cut early, or avoid buying the dip too soon.
As a case study, this FOMC reaction looks very similar to previous ones. In 6 of the last 7 comparable events, $BTC saw an average post-FOMC drop of around 4-5%. So far, we’re only at 2.8%, which means the current pullback is not unusual by historical standards.
If the pattern keeps playing out, the low $60K-$61K zone becomes the area to watch. That’s where buyers need to show up. The key level is $60K, because losing it could trigger a sweep of recent lows and drag sentiment lower across majors like $ETH and $SOL .
The lesson here is simple: macro events often repeat in rhythm, even if not perfectly in price. FOMC dips have punished late FOMO buyers before, but they’ve also created cleaner entries when support holds.
Do you think $BTC defends $60K, or are we setting up for a deeper sweep?
#BTC #CryptoTrading #MacroInsights

24
·
--
If you’re still chasing $BTC right after FOMC candles, stop now.
That reaction trade has been punishing late entries. Traders FOMO into the first bounce, then get trapped when the real move extends lower.
So far, $BTC is down 2.8% since FOMC. That may feel “not too bad,” but history says the move may not be finished. In 6 of the last 7 similar cases, the average post-FOMC drop was around 4-5%, which puts the 60K-61K zone firmly in play.
The bullish side says this is just a normal macro shakeout before continuation, especially if 60K holds and $ETH or $SOL start showing strength. But I lean cautious here. If $BTC loses 60K cleanly, the market likely sweeps the lows before any serious recovery attempt.
Is this just another FOMC dip to buy, or are we about to see a deeper liquidity sweep?
#BTC #CryptoTrading #MacroInsights
If you’re still chasing $BTC right after FOMC candles, stop now.
That reaction trade has been punishing late entries. Traders FOMO into the first bounce, then get trapped when the real move extends lower.
So far, $BTC is down 2.8% since FOMC. That may feel “not too bad,” but history says the move may not be finished. In 6 of the last 7 similar cases, the average post-FOMC drop was around 4-5%, which puts the 60K-61K zone firmly in play.
The bullish side says this is just a normal macro shakeout before continuation, especially if 60K holds and $ETH or $SOL start showing strength. But I lean cautious here. If $BTC loses 60K cleanly, the market likely sweeps the lows before any serious recovery attempt.
Is this just another FOMC dip to buy, or are we about to see a deeper liquidity sweep?
#BTC #CryptoTrading #MacroInsights
That reaction trade has been punishing late entries. Traders FOMO into the first bounce, then get trapped when the real move extends lower.
So far, $BTC is down 2.8% since FOMC. That may feel “not too bad,” but history says the move may not be finished. In 6 of the last 7 similar cases, the average post-FOMC drop was around 4-5%, which puts the 60K-61K zone firmly in play.
The bullish side says this is just a normal macro shakeout before continuation, especially if 60K holds and $ETH or $SOL start showing strength. But I lean cautious here. If $BTC loses 60K cleanly, the market likely sweeps the lows before any serious recovery attempt.
Is this just another FOMC dip to buy, or are we about to see a deeper liquidity sweep?
#BTC #CryptoTrading #MacroInsights

46
·
--
Here’s what happened when Bitcoin walked into August with history already leaning against it.
For traders, months like this are tricky because the chart can look bullish one week and still punish late entries the next. That’s how people end up FOMO buying $BTC near resistance or exiting too early because seasonality gets in their head.
The case study is simple: August has historically been Bitcoin’s weakest month, with a 69% chance of closing red. Even more interesting, 100% of bear market years and the years immediately after bear markets have ended August in the red.
That puts 2024 in an awkward comparison zone. $BTC is also on a 4-year August losing streak, its longest ever, which makes this month less about one candle and more about whether Bitcoin can finally break a pattern that has trapped traders for years.
We’ve seen similar seasonal pressure before, especially when $ETH and large caps like $BNB start moving in sympathy instead of leading with strength. The lesson isn’t “August must dump,” but that historical context matters when planning entries, stops, and exits.
Does $BTC finally break the August curse this time, or does history win again? #Bitcoin #BTC #MacroInsights
Here’s what happened when Bitcoin walked into August with history already leaning against it.
For traders, months like this are tricky because the chart can look bullish one week and still punish late entries the next. That’s how people end up FOMO buying $BTC near resistance or exiting too early because seasonality gets in their head.
The case study is simple: August has historically been Bitcoin’s weakest month, with a 69% chance of closing red. Even more interesting, 100% of bear market years and the years immediately after bear markets have ended August in the red.
That puts 2024 in an awkward comparison zone. $BTC is also on a 4-year August losing streak, its longest ever, which makes this month less about one candle and more about whether Bitcoin can finally break a pattern that has trapped traders for years.
We’ve seen similar seasonal pressure before, especially when $ETH and large caps like $BNB start moving in sympathy instead of leading with strength. The lesson isn’t “August must dump,” but that historical context matters when planning entries, stops, and exits.
Does $BTC finally break the August curse this time, or does history win again? #Bitcoin #BTC #MacroInsights
For traders, months like this are tricky because the chart can look bullish one week and still punish late entries the next. That’s how people end up FOMO buying $BTC near resistance or exiting too early because seasonality gets in their head.
The case study is simple: August has historically been Bitcoin’s weakest month, with a 69% chance of closing red. Even more interesting, 100% of bear market years and the years immediately after bear markets have ended August in the red.
That puts 2024 in an awkward comparison zone. $BTC is also on a 4-year August losing streak, its longest ever, which makes this month less about one candle and more about whether Bitcoin can finally break a pattern that has trapped traders for years.
We’ve seen similar seasonal pressure before, especially when $ETH and large caps like $BNB start moving in sympathy instead of leading with strength. The lesson isn’t “August must dump,” but that historical context matters when planning entries, stops, and exits.
Does $BTC finally break the August curse this time, or does history win again? #Bitcoin #BTC #MacroInsights

21

·
--
🚨 GEOPOLITICAL FUD RISES AS $BTC PREPARES FOR AN INSTITUTIONAL LIQUIDITY SWEEP! 💥
Geopolitical tension surrounding South Korea and Iran is creating the perfect backdrop for macro players to manufacture volatility across the crypto market. 🔍 When headline news escalates, institutional desks frequently capitalize on emotional panic by triggering liquidity hunts on both sides of the order book.
This artificial turbulence is engineered to flush overleveraged positions before smart money establishes clean accumulation blocks. ⚡ As $BTC prepares for heightened expansion, keeping your capital protected and monitoring key demand zones will separate disciplined traders from market casualties. 💬 Are you waiting for a key liquidity sweep before entry, or standing aside until market structure clarifies? 👇
⚠️ Not financial advice. Always manage your risk. 🛡️
🏷️ #BTC #MacroInsights #MarketStructure #Liquidity
⚡ 🦈
🚨 GEOPOLITICAL FUD RISES AS $BTC PREPARES FOR AN INSTITUTIONAL LIQUIDITY SWEEP! 💥
Geopolitical tension surrounding South Korea and Iran is creating the perfect backdrop for macro players to manufacture volatility across the crypto market. 🔍 When headline news escalates, institutional desks frequently capitalize on emotional panic by triggering liquidity hunts on both sides of the order book.
This artificial turbulence is engineered to flush overleveraged positions before smart money establishes clean accumulation blocks. ⚡ As $BTC prepares for heightened expansion, keeping your capital protected and monitoring key demand zones will separate disciplined traders from market casualties. 💬 Are you waiting for a key liquidity sweep before entry, or standing aside until market structure clarifies? 👇
⚠️ Not financial advice. Always manage your risk. 🛡️
🏷️ #BTC #MacroInsights #MarketStructure #Liquidity
⚡ 🦈
Geopolitical tension surrounding South Korea and Iran is creating the perfect backdrop for macro players to manufacture volatility across the crypto market. 🔍 When headline news escalates, institutional desks frequently capitalize on emotional panic by triggering liquidity hunts on both sides of the order book.
This artificial turbulence is engineered to flush overleveraged positions before smart money establishes clean accumulation blocks. ⚡ As $BTC prepares for heightened expansion, keeping your capital protected and monitoring key demand zones will separate disciplined traders from market casualties. 💬 Are you waiting for a key liquidity sweep before entry, or standing aside until market structure clarifies? 👇
⚠️ Not financial advice. Always manage your risk. 🛡️
🏷️ #BTC #MacroInsights #MarketStructure #Liquidity
⚡ 🦈
7

·
--
🚨 IRAQ HORMUZ OIL SHIPPING UNLOCKED AS MACRO LIQUIDITY SHIFTS FOR $BTC 🌊
Recent diplomatic shifts in the Middle East around the Strait of Hormuz are easing energy supply chain friction, directly impacting global macro risk pricing. 🌊 As geopolitical premium unwinds, institutional capital is recalibrating order flow across major asset classes, looking for high-probability structural reclaims.
🔍 When energy volatility cools, market liquidity typically redistributes back into digital assets like $BTC as smart money moves out of defensive positions. 📊 Watching for institutional demand responses at lower timeframe order blocks as macro risk appetite stabilizes. 💬 How are you positioning your portfolio as macro geopolitical risk unwinds across global markets? 👇
⚠️ Not financial advice. Always manage your risk. 🛡️
🏷️ #BTC #MacroInsights #MarketStructure #Crypto
🎯 🦈
🚨 IRAQ HORMUZ OIL SHIPPING UNLOCKED AS MACRO LIQUIDITY SHIFTS FOR $BTC 🌊
Recent diplomatic shifts in the Middle East around the Strait of Hormuz are easing energy supply chain friction, directly impacting global macro risk pricing. 🌊 As geopolitical premium unwinds, institutional capital is recalibrating order flow across major asset classes, looking for high-probability structural reclaims.
🔍 When energy volatility cools, market liquidity typically redistributes back into digital assets like $BTC as smart money moves out of defensive positions. 📊 Watching for institutional demand responses at lower timeframe order blocks as macro risk appetite stabilizes. 💬 How are you positioning your portfolio as macro geopolitical risk unwinds across global markets? 👇
⚠️ Not financial advice. Always manage your risk. 🛡️
🏷️ #BTC #MacroInsights #MarketStructure #Crypto
🎯 🦈
Recent diplomatic shifts in the Middle East around the Strait of Hormuz are easing energy supply chain friction, directly impacting global macro risk pricing. 🌊 As geopolitical premium unwinds, institutional capital is recalibrating order flow across major asset classes, looking for high-probability structural reclaims.
🔍 When energy volatility cools, market liquidity typically redistributes back into digital assets like $BTC as smart money moves out of defensive positions. 📊 Watching for institutional demand responses at lower timeframe order blocks as macro risk appetite stabilizes. 💬 How are you positioning your portfolio as macro geopolitical risk unwinds across global markets? 👇
⚠️ Not financial advice. Always manage your risk. 🛡️
🏷️ #BTC #MacroInsights #MarketStructure #Crypto
🎯 🦈
24
·
--
Bullish
U.S. manufacturing rises to a 4-year high, but price pressure and supply-chain stress remain key risks
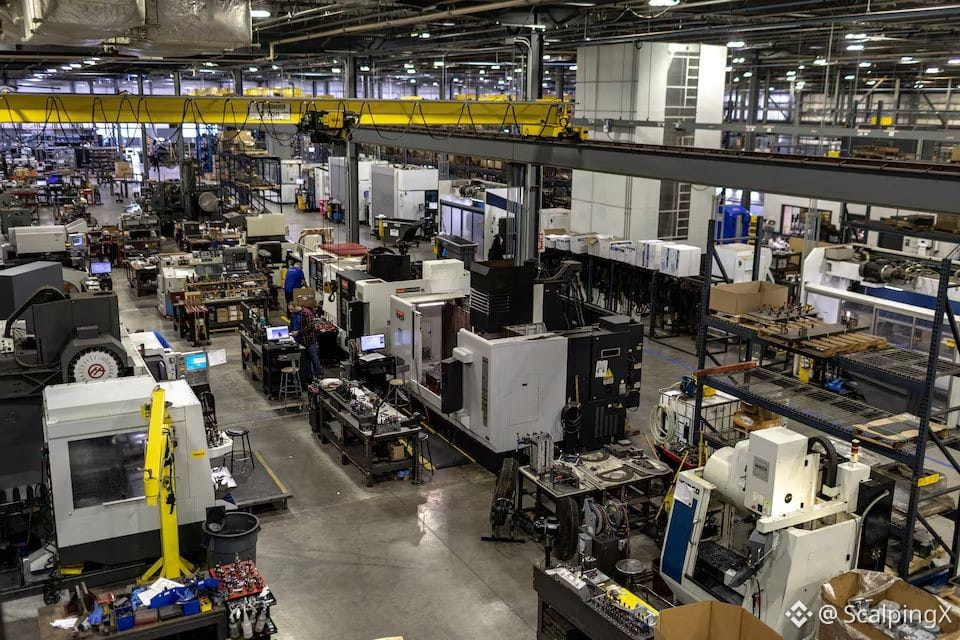
📌 The U.S. Manufacturing PMI rose to 54.0 in May from 52.7, marking the 5th straight month of expansion and the highest level since May 2022. This points to a clearer recovery in the manufacturing sector, supported by stronger domestic demand and improved inventory building.
💡 The main drivers came from New Orders rising to 56.8 and Production reaching 54.3, showing that businesses are still maintaining a positive production pace. The fact that all 6 largest industry groups expanded also gives this report broader strength, rather than relying on only a few isolated sectors.
⚠️ The key point to watch is Supplier Deliveries holding high at 60.6, signaling that delivery times continued to slow for the 6th consecutive month. This suggests supply chains are not fully stable yet, especially as companies appear to be front-loading orders ahead of shortage risks and pricing volatility.
⏱️ Cost pressure also remains sticky, with Prices Paid still very high at 82.1 despite easing slightly from the previous month. If input costs stay elevated, inflation risks from the manufacturing sector could make markets more cautious about expectations for an early Fed policy easing.
🔎 Overall, this data is positive for U.S. growth and may support short-term risk-on sentiment. However, the downside is tighter supply chains, higher raw material costs, and manufacturing employment still below the expansion threshold, leaving the overall picture not fully one-sided.
#MacroInsights $BNB
U.S. manufacturing rises to a 4-year high, but price pressure and supply-chain stress remain key risks
📌 The U.S. Manufacturing PMI rose to 54.0 in May from 52.7, marking the 5th straight month of expansion and the highest level since May 2022. This points to a clearer recovery in the manufacturing sector, supported by stronger domestic demand and improved inventory building.
💡 The main drivers came from New Orders rising to 56.8 and Production reaching 54.3, showing that businesses are still maintaining a positive production pace. The fact that all 6 largest industry groups expanded also gives this report broader strength, rather than relying on only a few isolated sectors.
⚠️ The key point to watch is Supplier Deliveries holding high at 60.6, signaling that delivery times continued to slow for the 6th consecutive month. This suggests supply chains are not fully stable yet, especially as companies appear to be front-loading orders ahead of shortage risks and pricing volatility.
⏱️ Cost pressure also remains sticky, with Prices Paid still very high at 82.1 despite easing slightly from the previous month. If input costs stay elevated, inflation risks from the manufacturing sector could make markets more cautious about expectations for an early Fed policy easing.
🔎 Overall, this data is positive for U.S. growth and may support short-term risk-on sentiment. However, the downside is tighter supply chains, higher raw material costs, and manufacturing employment still below the expansion threshold, leaving the overall picture not fully one-sided.
#MacroInsights $BNB
📌 The U.S. Manufacturing PMI rose to 54.0 in May from 52.7, marking the 5th straight month of expansion and the highest level since May 2022. This points to a clearer recovery in the manufacturing sector, supported by stronger domestic demand and improved inventory building.
💡 The main drivers came from New Orders rising to 56.8 and Production reaching 54.3, showing that businesses are still maintaining a positive production pace. The fact that all 6 largest industry groups expanded also gives this report broader strength, rather than relying on only a few isolated sectors.
⚠️ The key point to watch is Supplier Deliveries holding high at 60.6, signaling that delivery times continued to slow for the 6th consecutive month. This suggests supply chains are not fully stable yet, especially as companies appear to be front-loading orders ahead of shortage risks and pricing volatility.
⏱️ Cost pressure also remains sticky, with Prices Paid still very high at 82.1 despite easing slightly from the previous month. If input costs stay elevated, inflation risks from the manufacturing sector could make markets more cautious about expectations for an early Fed policy easing.
🔎 Overall, this data is positive for U.S. growth and may support short-term risk-on sentiment. However, the downside is tighter supply chains, higher raw material costs, and manufacturing employment still below the expansion threshold, leaving the overall picture not fully one-sided.
#MacroInsights $BNB
56
·
--
Bullish
U.S. consumers are starting to change their spending habits as the gasoline shock moves from the pump into household budgets
📌 U.S. consumers have not stopped spending, but a more defensive mindset is becoming clearer in everyday decisions. Pressure from gasoline prices around $4/gallon is pushing many households to buy less, choose cheaper places, and cut back on non-essential items.
⛽ One notable signal is the change in fueling behavior. Sam’s Club customers are buying less than 10 gallons per visit on average for the first time since 2022, while more drivers are shifting to Costco, Sam’s Club, or BJ’s to save money. Convenience store data also shows pump transactions down nearly 10%, while in-store sales fell 10.4%.
🛒 The pressure is no longer limited to energy. Sales of non-food items dropped 6%, with housewares, clothing, footwear, and sports equipment down around 5–7%. Shoppers are sticking more closely to shopping lists, cutting convenience items and decorative purchases, and prioritizing products with clearer practical value.
📉 For markets, this is an unfavorable signal for consumer discretionary names, restaurants, premium goods, and retailers that rely heavily on store traffic. In contrast, value-focused chains such as Walmart, Costco, Dollar General, and BJ’s may benefit relatively as consumers look for cheaper options.
⚠️ The key point is that geopolitical stress around Iran is now reaching U.S. consumer behavior through energy prices. If gasoline prices stay elevated after tax refund support fades, pressure on retail sales, consumer confidence, and risk assets could become clearer in the coming weeks.
#MacroInsights $BTC $ETH $BNB
U.S. consumers are starting to change their spending habits as the gasoline shock moves from the pump into household budgets
📌 U.S. consumers have not stopped spending, but a more defensive mindset is becoming clearer in everyday decisions. Pressure from gasoline prices around $4/gallon is pushing many households to buy less, choose cheaper places, and cut back on non-essential items.
⛽ One notable signal is the change in fueling behavior. Sam’s Club customers are buying less than 10 gallons per visit on average for the first time since 2022, while more drivers are shifting to Costco, Sam’s Club, or BJ’s to save money. Convenience store data also shows pump transactions down nearly 10%, while in-store sales fell 10.4%.
🛒 The pressure is no longer limited to energy. Sales of non-food items dropped 6%, with housewares, clothing, footwear, and sports equipment down around 5–7%. Shoppers are sticking more closely to shopping lists, cutting convenience items and decorative purchases, and prioritizing products with clearer practical value.
📉 For markets, this is an unfavorable signal for consumer discretionary names, restaurants, premium goods, and retailers that rely heavily on store traffic. In contrast, value-focused chains such as Walmart, Costco, Dollar General, and BJ’s may benefit relatively as consumers look for cheaper options.
⚠️ The key point is that geopolitical stress around Iran is now reaching U.S. consumer behavior through energy prices. If gasoline prices stay elevated after tax refund support fades, pressure on retail sales, consumer confidence, and risk assets could become clearer in the coming weeks.
#MacroInsights $BTC $ETH $BNB
📌 U.S. consumers have not stopped spending, but a more defensive mindset is becoming clearer in everyday decisions. Pressure from gasoline prices around $4/gallon is pushing many households to buy less, choose cheaper places, and cut back on non-essential items.
⛽ One notable signal is the change in fueling behavior. Sam’s Club customers are buying less than 10 gallons per visit on average for the first time since 2022, while more drivers are shifting to Costco, Sam’s Club, or BJ’s to save money. Convenience store data also shows pump transactions down nearly 10%, while in-store sales fell 10.4%.
🛒 The pressure is no longer limited to energy. Sales of non-food items dropped 6%, with housewares, clothing, footwear, and sports equipment down around 5–7%. Shoppers are sticking more closely to shopping lists, cutting convenience items and decorative purchases, and prioritizing products with clearer practical value.
📉 For markets, this is an unfavorable signal for consumer discretionary names, restaurants, premium goods, and retailers that rely heavily on store traffic. In contrast, value-focused chains such as Walmart, Costco, Dollar General, and BJ’s may benefit relatively as consumers look for cheaper options.
⚠️ The key point is that geopolitical stress around Iran is now reaching U.S. consumer behavior through energy prices. If gasoline prices stay elevated after tax refund support fades, pressure on retail sales, consumer confidence, and risk assets could become clearer in the coming weeks.
#MacroInsights $BTC $ETH $BNB

165
·
--
Why is nobody talking about BlackRock buying $500M of $BTC in 5 days without a single reported sell?
Most traders are still trying to time every candle, getting shaken out by noise, then FOMO buying when the move is obvious. That’s exactly how retail misses the real entries.
Here’s the case study: while the market debates short-term pullbacks, BlackRock has been accumulating aggressively. $500M in $BTC over 5 days is not casual exposure. It’s a consistent buy streak, and the more important detail is that there has been no selling during that period.
The mainstream take is usually “institutions are just trading flows.” Maybe. But when the buying is this concentrated, it looks less like a quick flip and more like positioning. If this pace continues, the obvious question is whether they push toward $1B in weekly $BTC accumulation before the week closes.
This also matters beyond Bitcoin. If institutional demand keeps absorbing supply, it can reshape sentiment across majors like $ETH and $BNB, especially if retail is still waiting for the “perfect dip” that never comes.
Where do you think this goes from here?
#Bitcoin #CryptoMarket #MacroInsights
Why is nobody talking about BlackRock buying $500M of $BTC in 5 days without a single reported sell?
Most traders are still trying to time every candle, getting shaken out by noise, then FOMO buying when the move is obvious. That’s exactly how retail misses the real entries.
Here’s the case study: while the market debates short-term pullbacks, BlackRock has been accumulating aggressively. $500M in $BTC over 5 days is not casual exposure. It’s a consistent buy streak, and the more important detail is that there has been no selling during that period.
The mainstream take is usually “institutions are just trading flows.” Maybe. But when the buying is this concentrated, it looks less like a quick flip and more like positioning. If this pace continues, the obvious question is whether they push toward $1B in weekly $BTC accumulation before the week closes.
This also matters beyond Bitcoin. If institutional demand keeps absorbing supply, it can reshape sentiment across majors like $ETH and $BNB , especially if retail is still waiting for the “perfect dip” that never comes.
Where do you think this goes from here?
#Bitcoin #CryptoMarket #MacroInsights
Most traders are still trying to time every candle, getting shaken out by noise, then FOMO buying when the move is obvious. That’s exactly how retail misses the real entries.
Here’s the case study: while the market debates short-term pullbacks, BlackRock has been accumulating aggressively. $500M in $BTC over 5 days is not casual exposure. It’s a consistent buy streak, and the more important detail is that there has been no selling during that period.
The mainstream take is usually “institutions are just trading flows.” Maybe. But when the buying is this concentrated, it looks less like a quick flip and more like positioning. If this pace continues, the obvious question is whether they push toward $1B in weekly $BTC accumulation before the week closes.
This also matters beyond Bitcoin. If institutional demand keeps absorbing supply, it can reshape sentiment across majors like $ETH and $BNB , especially if retail is still waiting for the “perfect dip” that never comes.
Where do you think this goes from here?
#Bitcoin #CryptoMarket #MacroInsights
11
·
--
If you’re still treating bank-backed Bitcoin access as “nothing news,” stop now.
A lot of traders lose money chasing loud narratives while the real adoption curve moves quietly in the background. By the time it shows up in price, the easy entries are usually gone.
Swiss cantonal bank BancaStato now offers regulated $BTC trading and custody inside its digital banking platform through Sygnum’s infrastructure. Not a meme coin launch, not a weekend pump, just another traditional bank making Bitcoin usable for regular clients.
This feels similar to the early ETF build-up: boring headlines, slow institutional plumbing, then suddenly everyone acts surprised when liquidity shows up. Meanwhile, $ETH and $SOL still fight for mindshare in the app-layer casino, but $BTC keeps sneaking deeper into the banking rails like it pays rent there.
Is this the kind of quiet adoption that actually matters more than crypto-native hype cycles?
#BTC #Bitcoin #MacroInsights
If you’re still treating bank-backed Bitcoin access as “nothing news,” stop now.
A lot of traders lose money chasing loud narratives while the real adoption curve moves quietly in the background. By the time it shows up in price, the easy entries are usually gone.
Swiss cantonal bank BancaStato now offers regulated $BTC trading and custody inside its digital banking platform through Sygnum’s infrastructure. Not a meme coin launch, not a weekend pump, just another traditional bank making Bitcoin usable for regular clients.
This feels similar to the early ETF build-up: boring headlines, slow institutional plumbing, then suddenly everyone acts surprised when liquidity shows up. Meanwhile, $ETH and $SOL still fight for mindshare in the app-layer casino, but $BTC keeps sneaking deeper into the banking rails like it pays rent there.
Is this the kind of quiet adoption that actually matters more than crypto-native hype cycles?
#BTC #Bitcoin #MacroInsights
A lot of traders lose money chasing loud narratives while the real adoption curve moves quietly in the background. By the time it shows up in price, the easy entries are usually gone.
Swiss cantonal bank BancaStato now offers regulated $BTC trading and custody inside its digital banking platform through Sygnum’s infrastructure. Not a meme coin launch, not a weekend pump, just another traditional bank making Bitcoin usable for regular clients.
This feels similar to the early ETF build-up: boring headlines, slow institutional plumbing, then suddenly everyone acts surprised when liquidity shows up. Meanwhile, $ETH and $SOL still fight for mindshare in the app-layer casino, but $BTC keeps sneaking deeper into the banking rails like it pays rent there.
Is this the kind of quiet adoption that actually matters more than crypto-native hype cycles?
#BTC #Bitcoin #MacroInsights

30
·
--
Here's what happened when $BTC reacted to the latest FOMC: the move looked small at first, but the setup is more fragile than it seems.
A lot of traders get caught here because a 2.8% drop does not feel dramatic. The risk is assuming the worst is over, then watching price slide into the real liquidity zone.
The case study is simple. Since FOMC, $BTC is down 2.8%. In 6 of the last 7 similar reactions, Bitcoin saw an average pullback of 4-5%, which means the current move may not be fully priced in yet.
If this follows the same pattern, the 60-61K area becomes the level to watch. That zone matters because losing 60K could trigger a sweep of the lows, and that is where late longs in $ETH and $SOL often start feeling the pressure too.
The lesson: macro reactions can look contained before they expand. What matters now is not the first drop, but whether buyers defend the level everyone is watching.
Do you think 60K holds, or are we setting up for a liquidity sweep?
#BTC #CryptoTrading #MacroInsights
Here's what happened when $BTC reacted to the latest FOMC: the move looked small at first, but the setup is more fragile than it seems.
A lot of traders get caught here because a 2.8% drop does not feel dramatic. The risk is assuming the worst is over, then watching price slide into the real liquidity zone.
The case study is simple. Since FOMC, $BTC is down 2.8%. In 6 of the last 7 similar reactions, Bitcoin saw an average pullback of 4-5%, which means the current move may not be fully priced in yet.
If this follows the same pattern, the 60-61K area becomes the level to watch. That zone matters because losing 60K could trigger a sweep of the lows, and that is where late longs in $ETH and $SOL often start feeling the pressure too.
The lesson: macro reactions can look contained before they expand. What matters now is not the first drop, but whether buyers defend the level everyone is watching.
Do you think 60K holds, or are we setting up for a liquidity sweep?
#BTC #CryptoTrading #MacroInsights
A lot of traders get caught here because a 2.8% drop does not feel dramatic. The risk is assuming the worst is over, then watching price slide into the real liquidity zone.
The case study is simple. Since FOMC, $BTC is down 2.8%. In 6 of the last 7 similar reactions, Bitcoin saw an average pullback of 4-5%, which means the current move may not be fully priced in yet.
If this follows the same pattern, the 60-61K area becomes the level to watch. That zone matters because losing 60K could trigger a sweep of the lows, and that is where late longs in $ETH and $SOL often start feeling the pressure too.
The lesson: macro reactions can look contained before they expand. What matters now is not the first drop, but whether buyers defend the level everyone is watching.
Do you think 60K holds, or are we setting up for a liquidity sweep?
#BTC #CryptoTrading #MacroInsights
25
·
--
Why is nobody talking about how fragile this $BTC bounce actually looks?
A lot of traders get trapped buying the “recovery” after price stabilizes, only to realize liquidity is too thin to support the move. That’s where FOMO entries turn into forced exits.
$BTC holding near $65K sounds bullish on the surface. Taker demand is improving, institutional inflows remain strong, and downside hedging has been easing. That’s the part of the story everyone wants to trade.
But the case study here is the gap between price strength and market depth. Spot liquidity is still subdued, and weak on-chain activity suggests this isn’t yet a broad-based conviction move. In other words, $BTC may be stabilizing, but the foundation is not as strong as the headline price suggests.
For $ETH and $BNB traders, the lesson is simple: a bounce backed by flows can run, but a bounce without real participation can reverse fast. Confirmation matters more than vibes here.
What’s your take: is $BTC building a real base at $65K, or is this just another liquidity trap?
#BTC #CryptoTrading #MacroInsights
Why is nobody talking about how fragile this $BTC bounce actually looks?
A lot of traders get trapped buying the “recovery” after price stabilizes, only to realize liquidity is too thin to support the move. That’s where FOMO entries turn into forced exits.
$BTC holding near $65K sounds bullish on the surface. Taker demand is improving, institutional inflows remain strong, and downside hedging has been easing. That’s the part of the story everyone wants to trade.
But the case study here is the gap between price strength and market depth. Spot liquidity is still subdued, and weak on-chain activity suggests this isn’t yet a broad-based conviction move. In other words, $BTC may be stabilizing, but the foundation is not as strong as the headline price suggests.
For $ETH and $BNB traders, the lesson is simple: a bounce backed by flows can run, but a bounce without real participation can reverse fast. Confirmation matters more than vibes here.
What’s your take: is $BTC building a real base at $65K, or is this just another liquidity trap?
#BTC #CryptoTrading #MacroInsights
A lot of traders get trapped buying the “recovery” after price stabilizes, only to realize liquidity is too thin to support the move. That’s where FOMO entries turn into forced exits.
$BTC holding near $65K sounds bullish on the surface. Taker demand is improving, institutional inflows remain strong, and downside hedging has been easing. That’s the part of the story everyone wants to trade.
But the case study here is the gap between price strength and market depth. Spot liquidity is still subdued, and weak on-chain activity suggests this isn’t yet a broad-based conviction move. In other words, $BTC may be stabilizing, but the foundation is not as strong as the headline price suggests.
For $ETH and $BNB traders, the lesson is simple: a bounce backed by flows can run, but a bounce without real participation can reverse fast. Confirmation matters more than vibes here.
What’s your take: is $BTC building a real base at $65K, or is this just another liquidity trap?
#BTC #CryptoTrading #MacroInsights

21
Log in to explore more content
Join global crypto users on Binance Square
⚡️ Get latest and useful information about crypto.
💬 Trusted by the world’s largest crypto exchange.
👍 Discover real insights from verified creators.
Email / Phone number
Trending Topics
1
#BitwiseFilesFinalNEARSpotETFProspectus
89,704 views
1,461 Discussing
2
#BitgetHackerMoves$83MStolenXRP
33,482 views
165 Discussing
3
#SOLSpotETFWeeklyInflow$188M
22,099 views
133 Discussing
4
#DogecoinETFsPostBiggestWeekSinceLaunch
55,572 views
995 Discussing
5
#StrategyStriveAdd2305BitcoinThisWeek
146,851 views
2,196 Discussing
6
#TrumpRejectsIranHormuzReopening
126,252 views
1,658 Discussing
7
#TokenizedStockDEXVolumeHits$20.9B
194 views
8 Discussing
8
#CircleTetherFreezeBitgetHackerWallet
109,003 views
1,528 Discussing
9
#SECSaysTokenBuybacksNotAutoSecurities
73,515 views
912 Discussing
10
#ChinaUSAgreeOn$30BTariffCut
5,625 views
47 Discussing