
#iost
iost
1.2M views
6,802 Discussing
Hot
Latest

·
--
Bullish
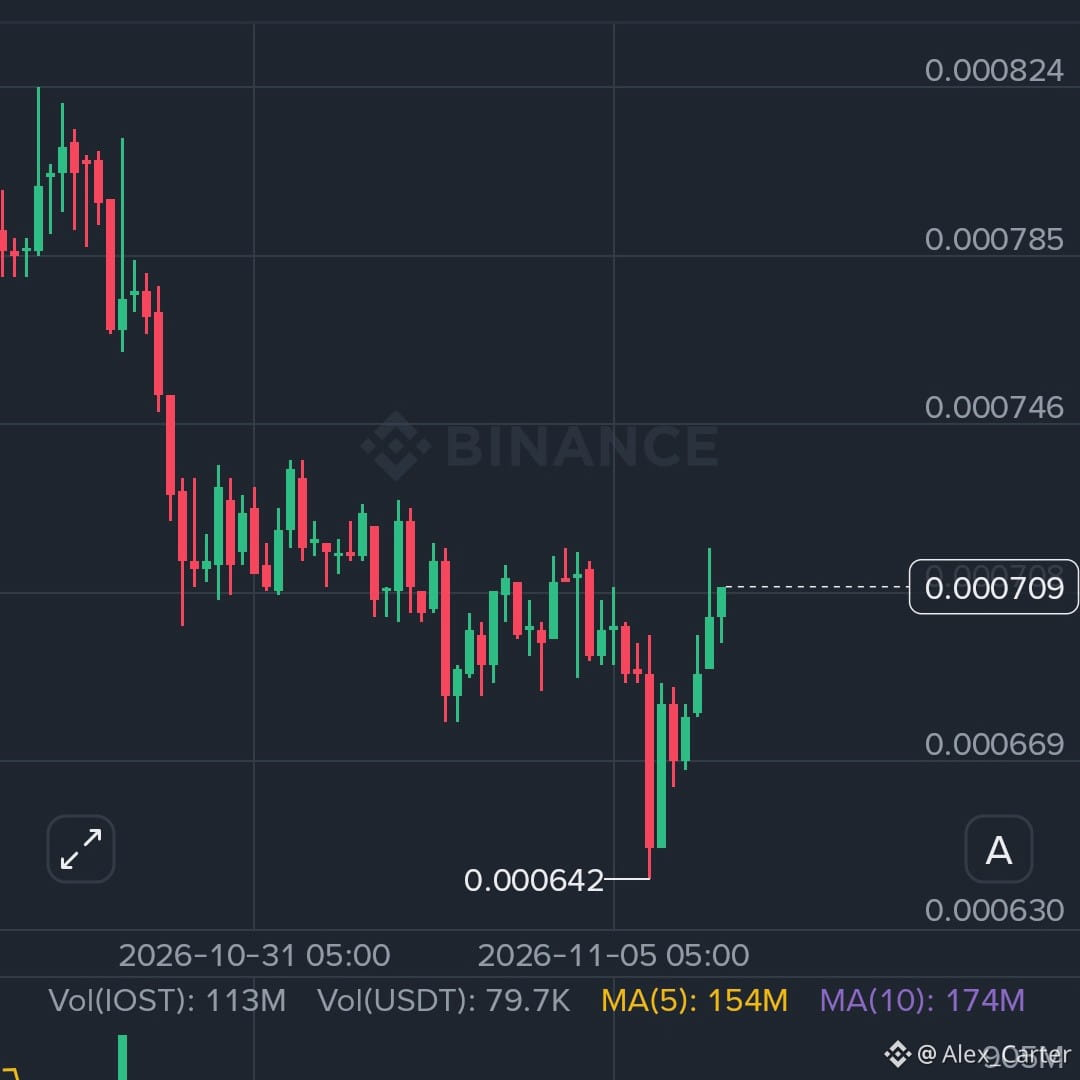
$IOST Don't Let This Opportunity Pass!
📍 Entry Zone: $0.000700 – $0.000715
🎯 TP1: $0.000750
🎯 TP2: $0.000785
🎯 TP3: $0.000825
🛑 Stop Loss: $0.000675
IOST is trading near $0.000710, with buyers needing to push beyond the nearby $0.000725 area to build stronger upside momentum. A sustained move above that level could open the way toward the next targets. If buying pressure fades, price may revisit the lower end of the entry zone. Watch volume and candle strength before making a decision.
#IOST $IOST
{future}(IOSTUSDT)
$IOST Don't Let This Opportunity Pass!
📍 Entry Zone: $0.000700 – $0.000715
🎯 TP1: $0.000750
🎯 TP2: $0.000785
🎯 TP3: $0.000825
🛑 Stop Loss: $0.000675
IOST is trading near $0.000710, with buyers needing to push beyond the nearby $0.000725 area to build stronger upside momentum. A sustained move above that level could open the way toward the next targets. If buying pressure fades, price may revisit the lower end of the entry zone. Watch volume and candle strength before making a decision.
#IOST $IOST
📍 Entry Zone: $0.000700 – $0.000715
🎯 TP1: $0.000750
🎯 TP2: $0.000785
🎯 TP3: $0.000825
🛑 Stop Loss: $0.000675
IOST is trading near $0.000710, with buyers needing to push beyond the nearby $0.000725 area to build stronger upside momentum. A sustained move above that level could open the way toward the next targets. If buying pressure fades, price may revisit the lower end of the entry zone. Watch volume and candle strength before making a decision.
#IOST $IOST
1
22

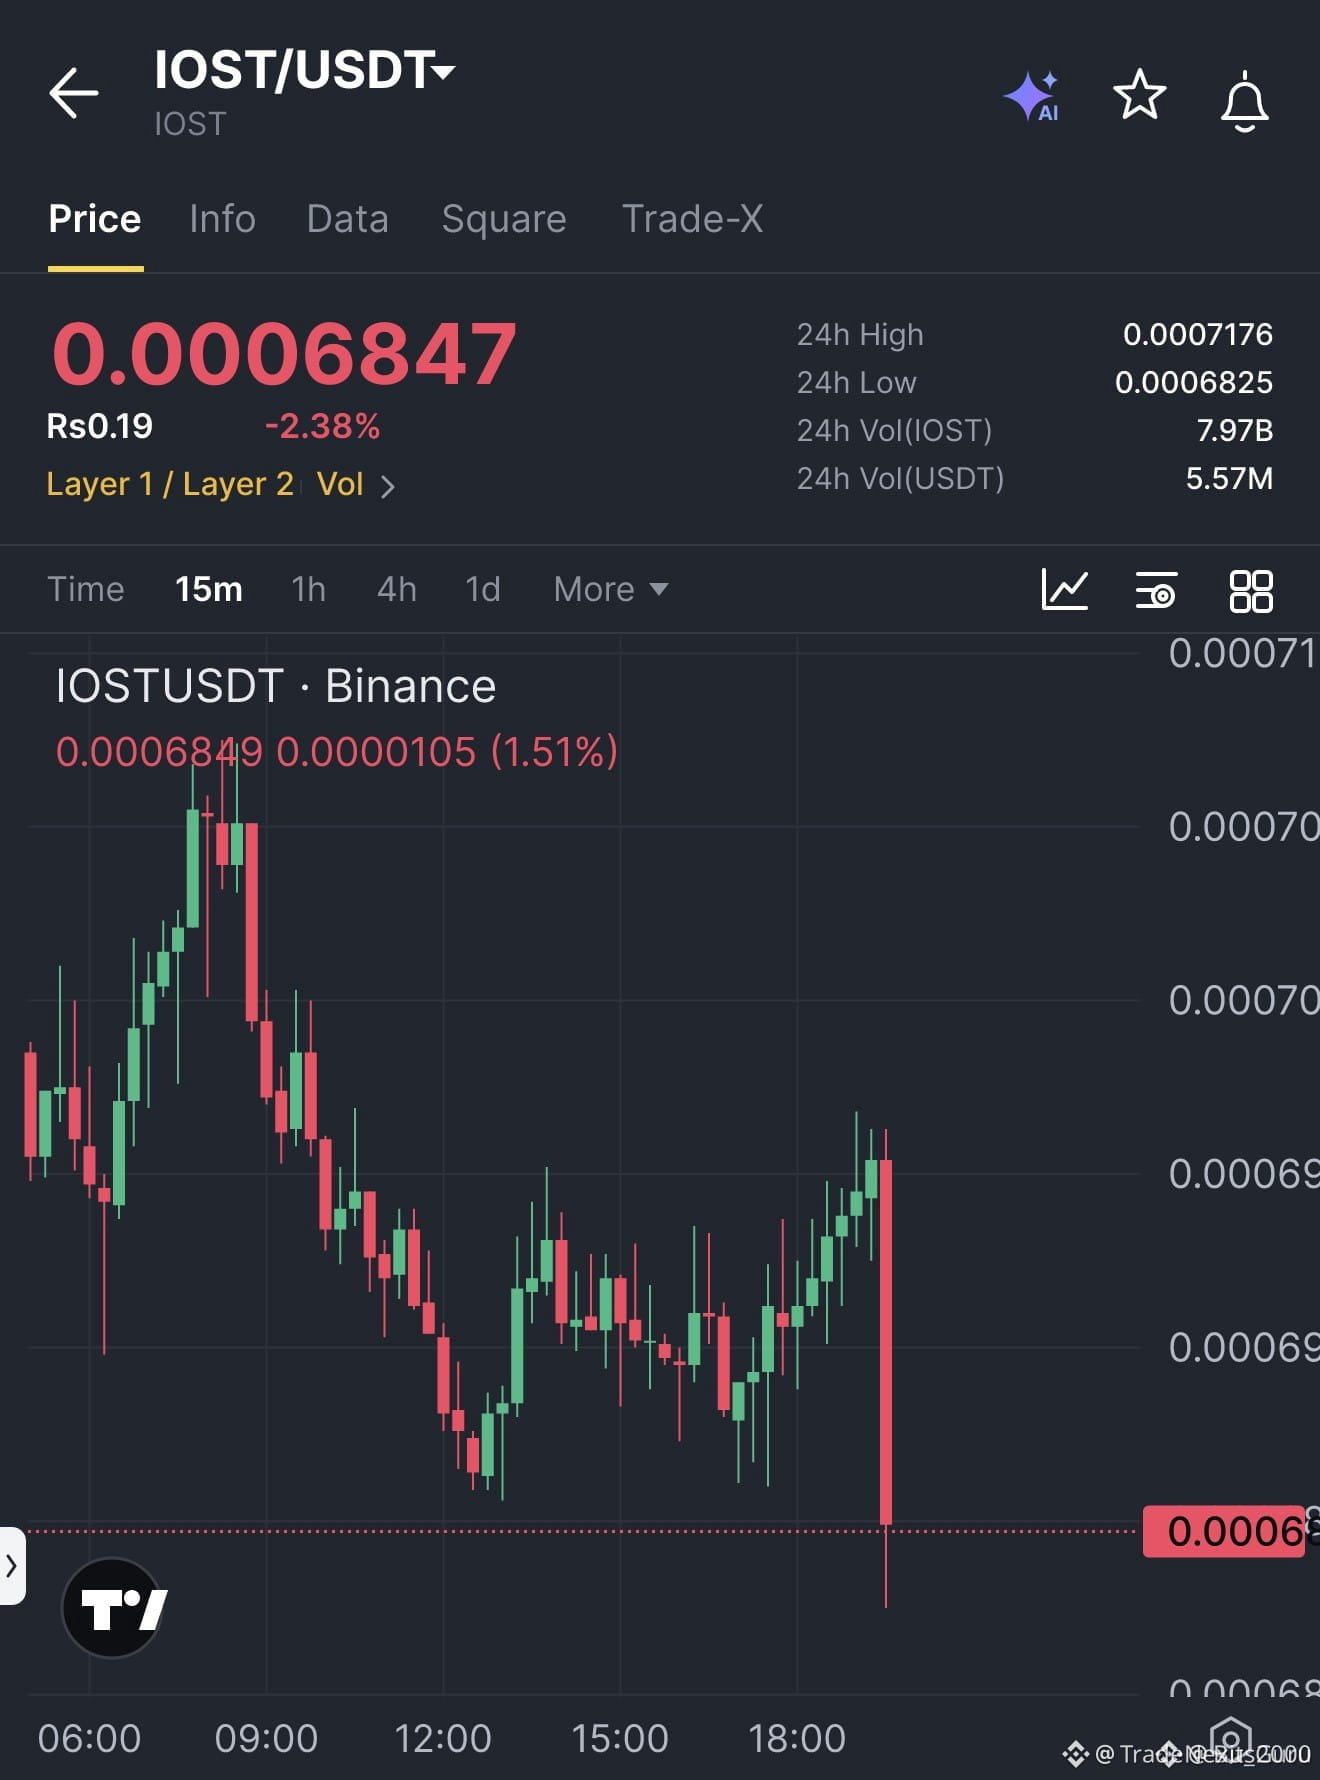
🔴 $IOST UNDER PRESSURE – SHORT ENTRY LIVE AT 0.0006847 🚨
Entry: 0.0006847 ⚡
Target: 0.0006658 🚀
Target: 0.0006532 🚀
Target: 0.0006343 🚀
Stop Loss: 0.0006973 ⚠️
🦈 Sellers ripped the previous candle’s low after a sustained climb, exposing a fresh liquidity pocket. 📊 The pull‑back aligns with a classic smart‑money squeeze, and volume spikes on the 1H confirm aggressive short pressure. 📌 With three tiered targets, the setup offers a clean risk‑reward corridor, letting traders capture the downside wave while keeping the stop just above the breach level. 💡 The invalidation line at 0.0006973 acts as a hard ceiling for any bullish resurgence.
💬 Are you ready to ride this short swing or waiting for a deeper liquidity hunt? 👇
⚠️ Not financial advice. Always manage your risk. 🛡️
🏷️ #IOST #ShortSetup #LiquiditySweep #Crypto
🔥 🦈
🔴 $IOST UNDER PRESSURE – SHORT ENTRY LIVE AT 0.0006847 🚨
Entry: 0.0006847 ⚡
Target: 0.0006658 🚀
Target: 0.0006532 🚀
Target: 0.0006343 🚀
Stop Loss: 0.0006973 ⚠️
🦈 Sellers ripped the previous candle’s low after a sustained climb, exposing a fresh liquidity pocket. 📊 The pull‑back aligns with a classic smart‑money squeeze, and volume spikes on the 1H confirm aggressive short pressure. 📌 With three tiered targets, the setup offers a clean risk‑reward corridor, letting traders capture the downside wave while keeping the stop just above the breach level. 💡 The invalidation line at 0.0006973 acts as a hard ceiling for any bullish resurgence.
💬 Are you ready to ride this short swing or waiting for a deeper liquidity hunt? 👇
⚠️ Not financial advice. Always manage your risk. 🛡️
🏷️ #IOST #ShortSetup #LiquiditySweep #Crypto
🔥 🦈
Entry: 0.0006847 ⚡
Target: 0.0006658 🚀
Target: 0.0006532 🚀
Target: 0.0006343 🚀
Stop Loss: 0.0006973 ⚠️
🦈 Sellers ripped the previous candle’s low after a sustained climb, exposing a fresh liquidity pocket. 📊 The pull‑back aligns with a classic smart‑money squeeze, and volume spikes on the 1H confirm aggressive short pressure. 📌 With three tiered targets, the setup offers a clean risk‑reward corridor, letting traders capture the downside wave while keeping the stop just above the breach level. 💡 The invalidation line at 0.0006973 acts as a hard ceiling for any bullish resurgence.
💬 Are you ready to ride this short swing or waiting for a deeper liquidity hunt? 👇
⚠️ Not financial advice. Always manage your risk. 🛡️
🏷️ #IOST #ShortSetup #LiquiditySweep #Crypto
🔥 🦈
9

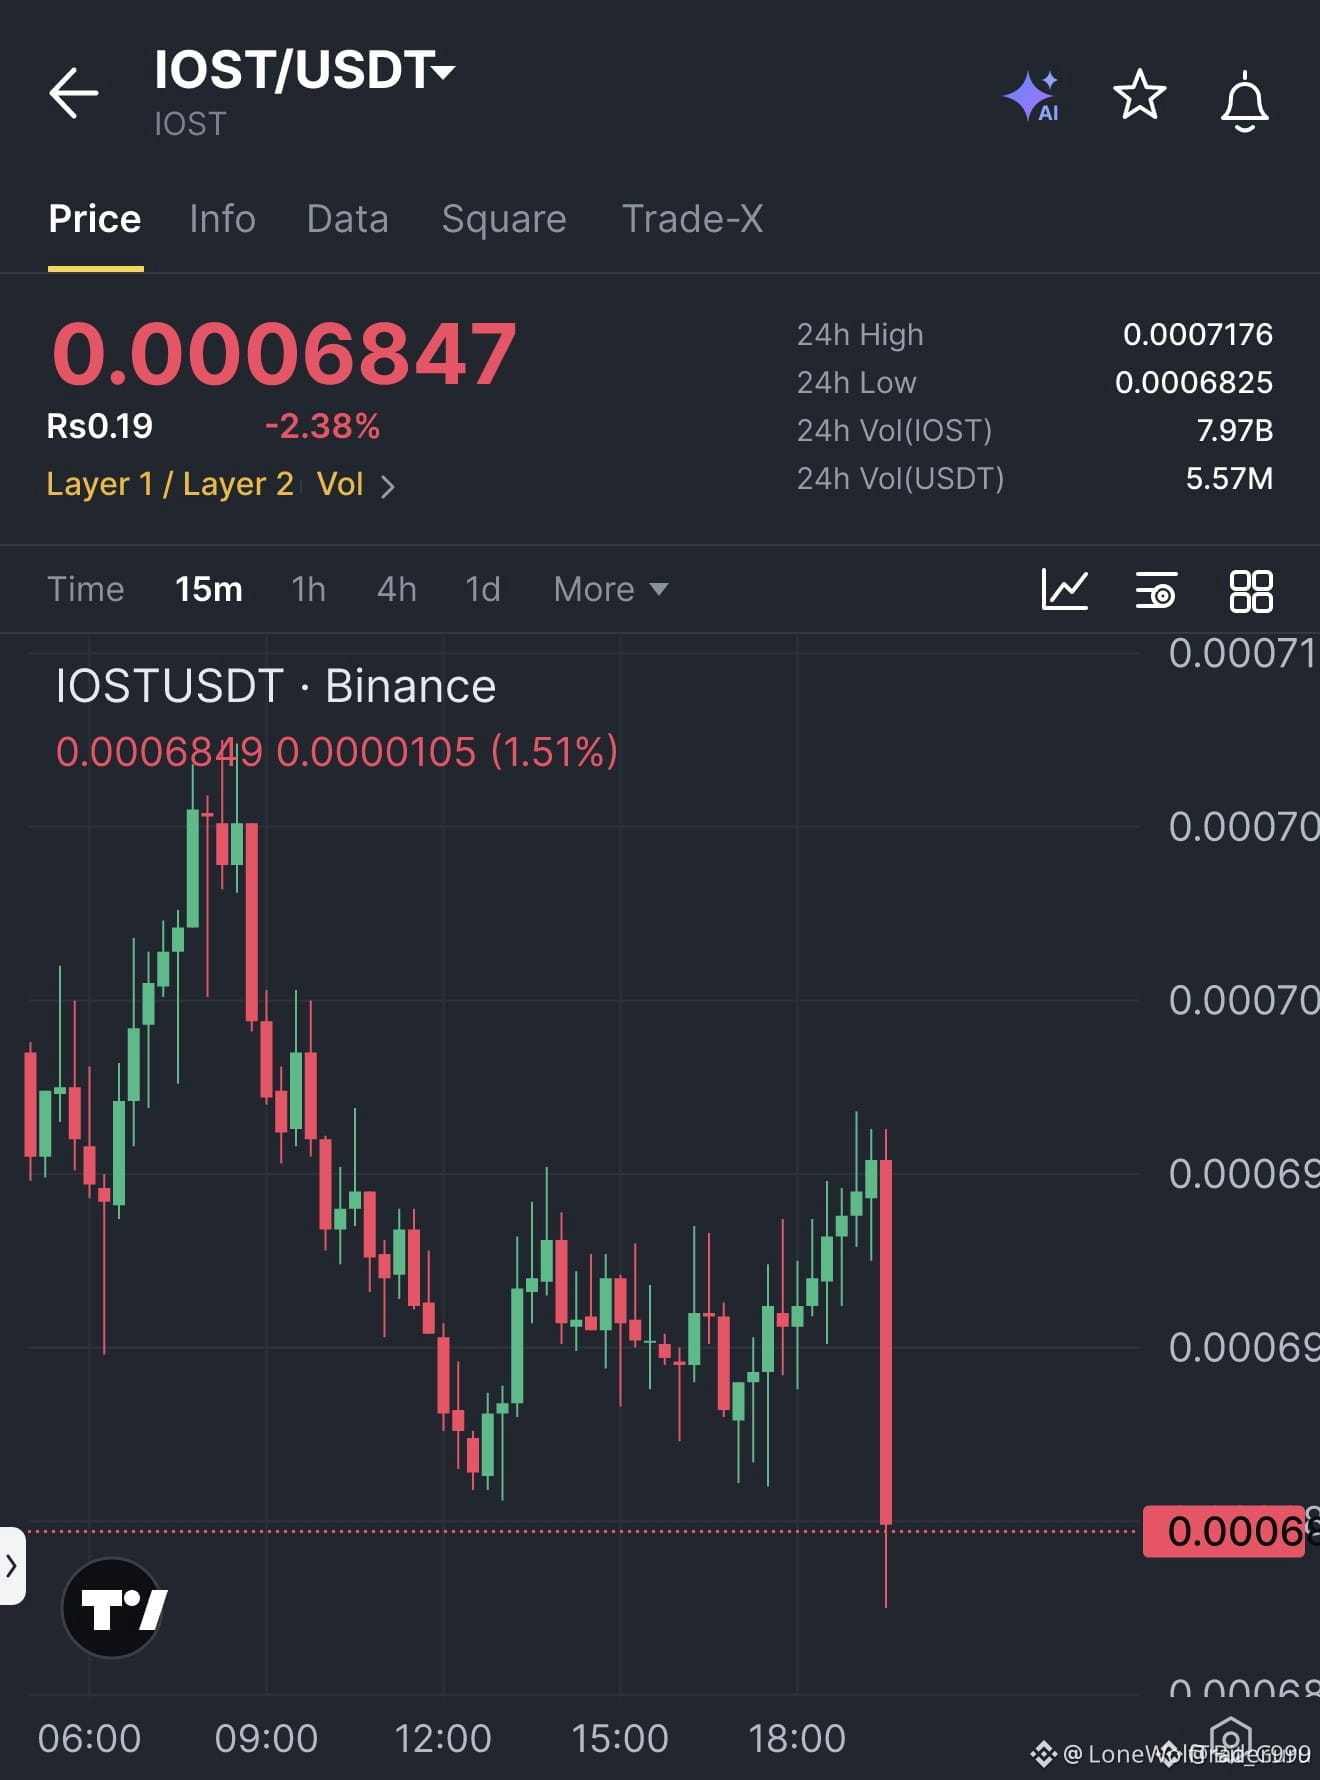
🔴 $IOST SHORT SETUP ROARS WITH LIQUIDITY SWEEP! 🚀
Entry: 0.0006847 ⚡
Target: 0.0006658, 0.0006532, 0.0006343 🚀
Stop Loss: 0.0006973 ⚠️
Sellers ripped the prior candle’s low after a tight rally, handing the pull‑back a clean trigger. 📊 The order flow shows smart‑money whales draining liquidity at the 0.0006973 ceiling, paving a steep descent path. ⚡ With each bite, the bid side weakens, setting the stage for a rapid cascade toward the three‑tier targets. 🦈
💬 Are you ready to ride this short wave or wait for the next liquidity sweep? 👇
⚠️ Not financial advice. Always manage your risk. 🛡️
🏷️ #IOST #ShortSetup #Crypto #LiquiditySweep
🔥 🦈
🔴 $IOST SHORT SETUP ROARS WITH LIQUIDITY SWEEP! 🚀
Entry: 0.0006847 ⚡
Target: 0.0006658, 0.0006532, 0.0006343 🚀
Stop Loss: 0.0006973 ⚠️
Sellers ripped the prior candle’s low after a tight rally, handing the pull‑back a clean trigger. 📊 The order flow shows smart‑money whales draining liquidity at the 0.0006973 ceiling, paving a steep descent path. ⚡ With each bite, the bid side weakens, setting the stage for a rapid cascade toward the three‑tier targets. 🦈
💬 Are you ready to ride this short wave or wait for the next liquidity sweep? 👇
⚠️ Not financial advice. Always manage your risk. 🛡️
🏷️ #IOST #ShortSetup #Crypto #LiquiditySweep
🔥 🦈
Entry: 0.0006847 ⚡
Target: 0.0006658, 0.0006532, 0.0006343 🚀
Stop Loss: 0.0006973 ⚠️
Sellers ripped the prior candle’s low after a tight rally, handing the pull‑back a clean trigger. 📊 The order flow shows smart‑money whales draining liquidity at the 0.0006973 ceiling, paving a steep descent path. ⚡ With each bite, the bid side weakens, setting the stage for a rapid cascade toward the three‑tier targets. 🦈
💬 Are you ready to ride this short wave or wait for the next liquidity sweep? 👇
⚠️ Not financial advice. Always manage your risk. 🛡️
🏷️ #IOST #ShortSetup #Crypto #LiquiditySweep
🔥 🦈
10

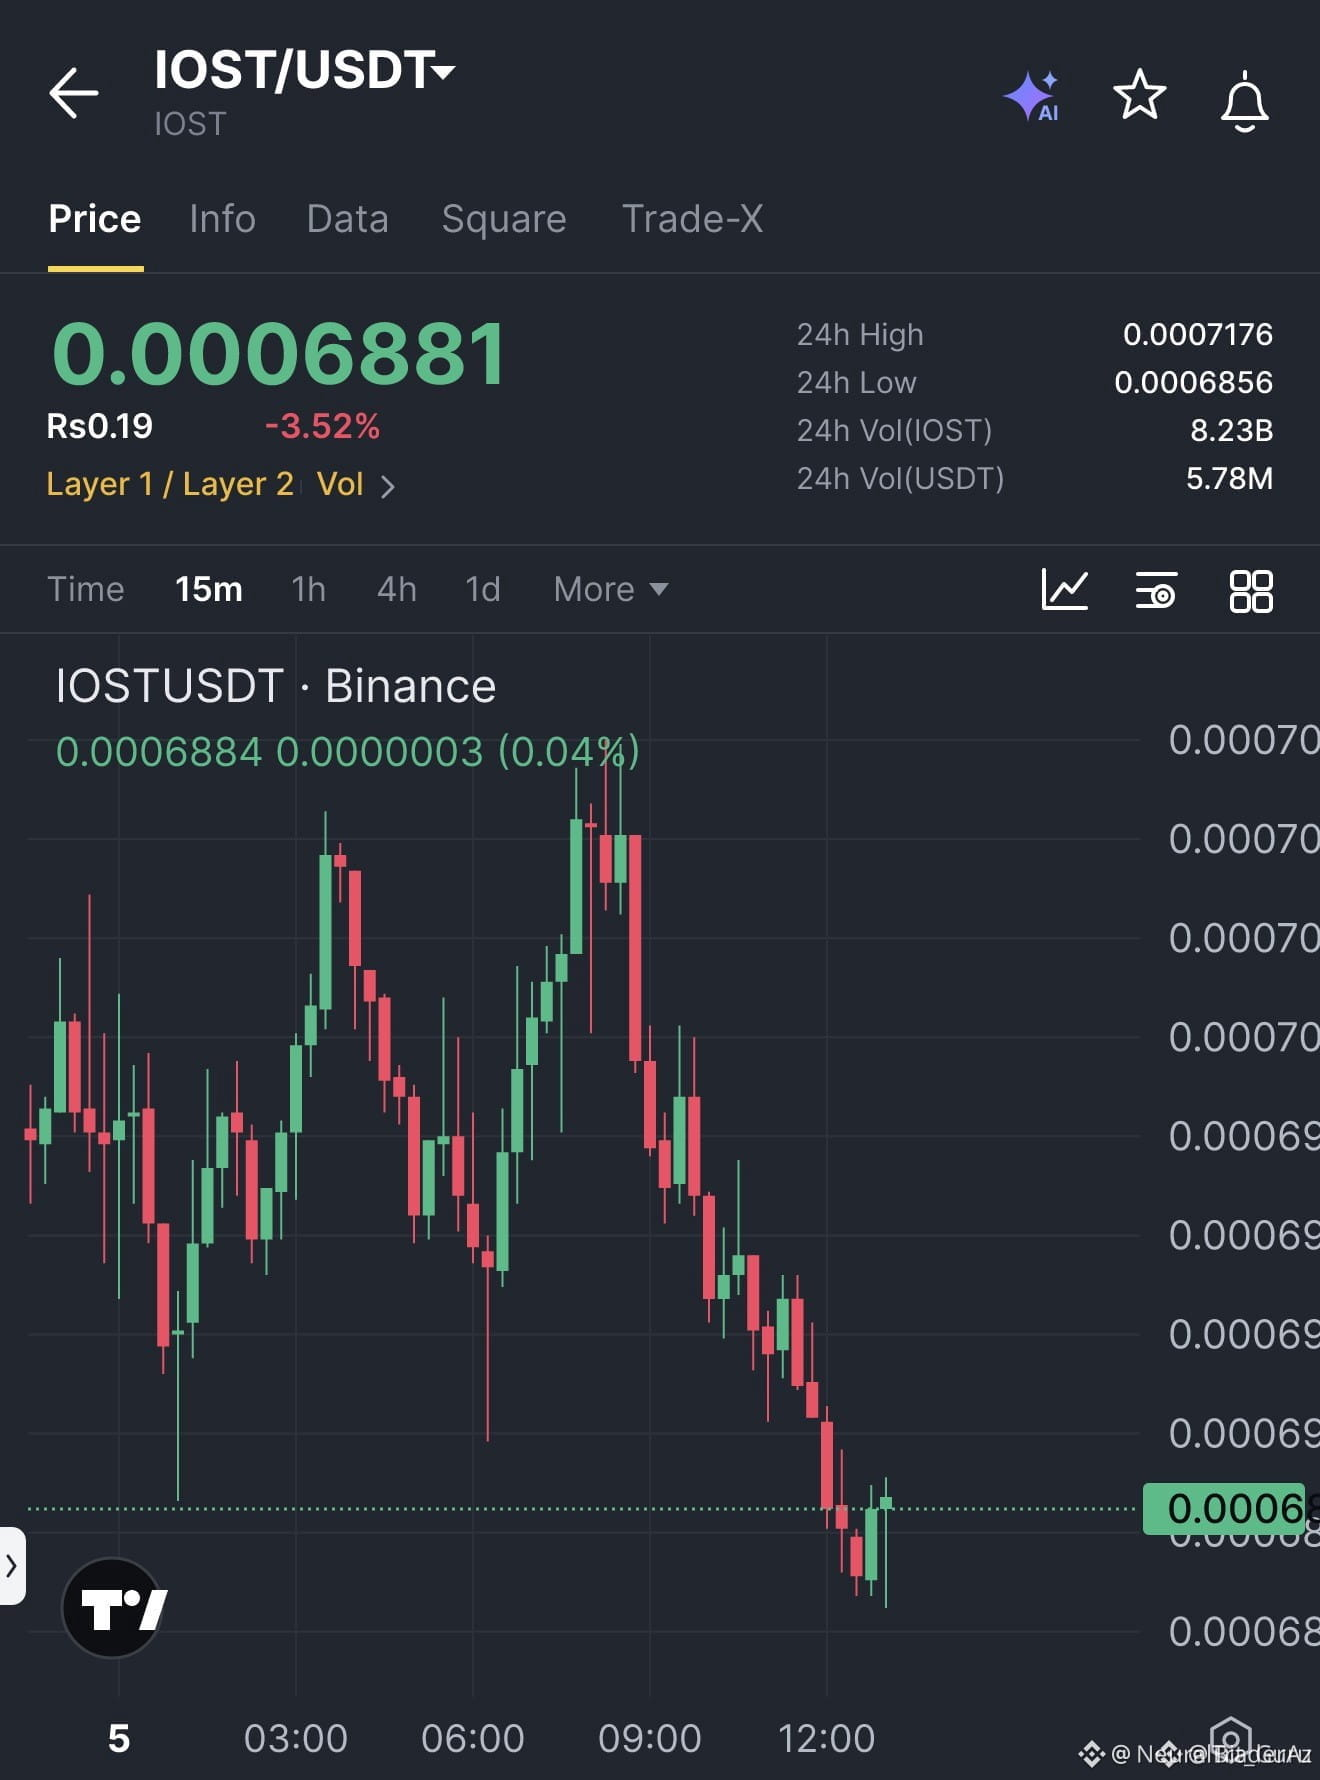
🚀 $IOST BREAKS LIQUIDITY CLUTCH, SMART MONEY REENGAGES 🦈
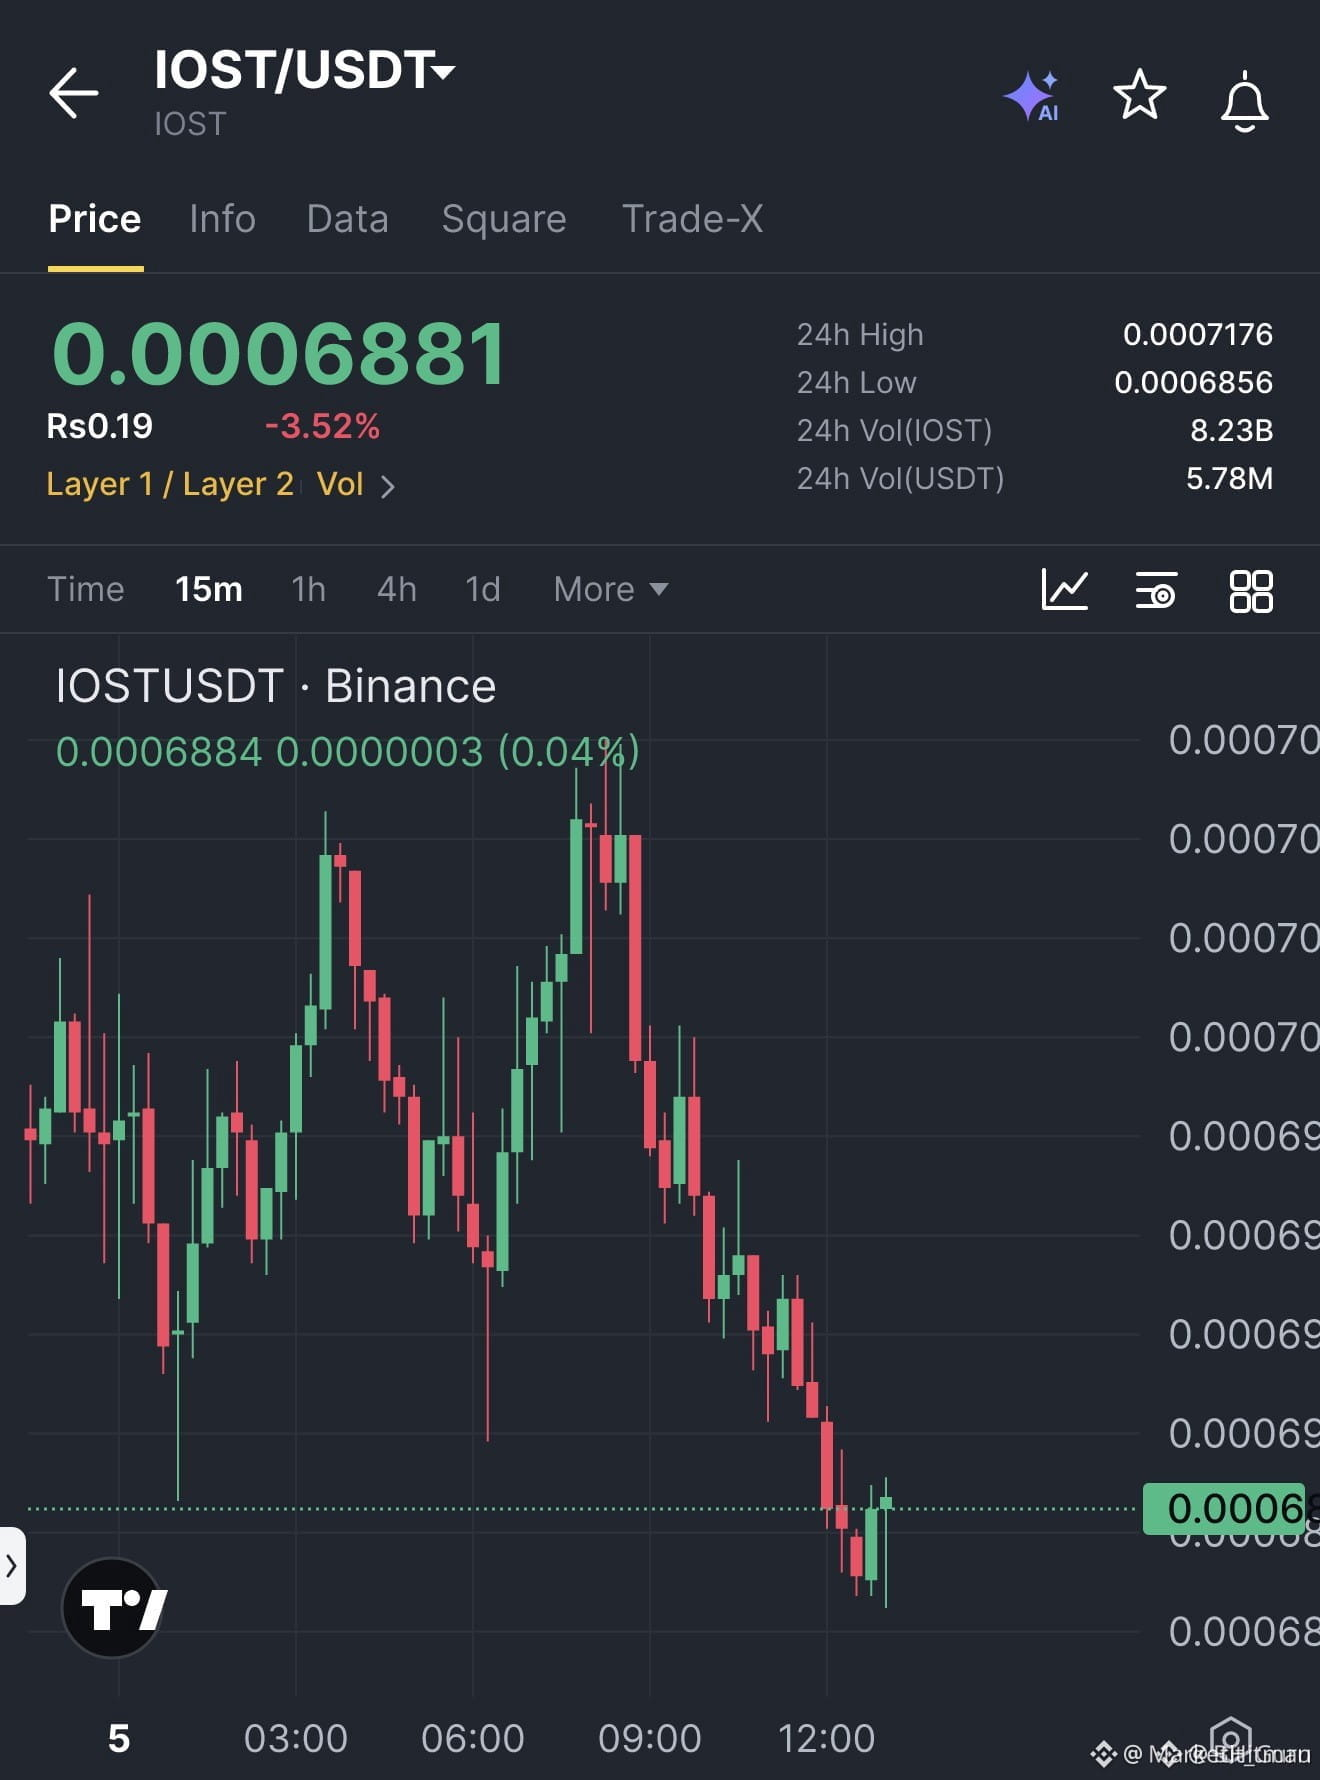
Entry: 0.0006884 ⚡
Target: 0.0007 🚀
Stop Loss: 0.0006855 ⚠️
The market’s micro‑structure flipped as buyers punched through the prior candle’s high, sealing a demand block that has been defending the 0.00068 zone for three sessions 📊. Volume on the 4‑hour chart swells, and the RSI is nudging away from oversold territory, suggesting down‑trend exhaustion is near ⚡. The entry sits just above the break, giving the trade a clean risk‑to‑reward envelope.
💬 Are you aligning with this liquidity sweep or waiting for a deeper pullback?
⚠️ Not financial advice. Always manage your risk. 🛡️
🏷️ #IOST #LongSetup #LiquiditySweep #Crypto
🚀 ⚡
🚀 $IOST BREAKS LIQUIDITY CLUTCH, SMART MONEY REENGAGES 🦈
Entry: 0.0006884 ⚡
Target: 0.0007 🚀
Stop Loss: 0.0006855 ⚠️
The market’s micro‑structure flipped as buyers punched through the prior candle’s high, sealing a demand block that has been defending the 0.00068 zone for three sessions 📊. Volume on the 4‑hour chart swells, and the RSI is nudging away from oversold territory, suggesting down‑trend exhaustion is near ⚡. The entry sits just above the break, giving the trade a clean risk‑to‑reward envelope.
💬 Are you aligning with this liquidity sweep or waiting for a deeper pullback?
⚠️ Not financial advice. Always manage your risk. 🛡️
🏷️ #IOST #LongSetup #LiquiditySweep #Crypto
🚀 ⚡
Entry: 0.0006884 ⚡
Target: 0.0007 🚀
Stop Loss: 0.0006855 ⚠️
The market’s micro‑structure flipped as buyers punched through the prior candle’s high, sealing a demand block that has been defending the 0.00068 zone for three sessions 📊. Volume on the 4‑hour chart swells, and the RSI is nudging away from oversold territory, suggesting down‑trend exhaustion is near ⚡. The entry sits just above the break, giving the trade a clean risk‑to‑reward envelope.
💬 Are you aligning with this liquidity sweep or waiting for a deeper pullback?
⚠️ Not financial advice. Always manage your risk. 🛡️
🏷️ #IOST #LongSetup #LiquiditySweep #Crypto
🚀 ⚡
16

·
--
🚀 🟢 $IOST SURGES INTO LONG ZONE – BULLISH BREAKOUT ALERT!
Entry: 0.0006884 ⚡
Target: 0.0006928 🚀
Stop Loss: 0.0006855 ⚠️
📊 Buyers ripped past the prior candle’s high after a sustained decline, snapping the supply wall and flashing a clear recovery trigger. 🌊 The order flow shows smart money stepping in, with volume swelling on the 15‑minute chart and the RSI edging off oversold territory.
⚡ With a tight stop just below the breakout level and a tiered target ladder up to 0.0007, the risk‑reward profile screams disciplined aggression. 📌 Stick to the plan and let the liquidity sweep fuel the upside.
💬 Are you loading your bids now or waiting for the next liquidity dip? 👇
⚠️ Not financial advice. Always manage your risk. 🛡️
🏷️ #IOST #LongSetup #Breakout #Crypto
🔥 💎
🚀 🟢 $IOST SURGES INTO LONG ZONE – BULLISH BREAKOUT ALERT!
Entry: 0.0006884 ⚡
Target: 0.0006928 🚀
Stop Loss: 0.0006855 ⚠️
📊 Buyers ripped past the prior candle’s high after a sustained decline, snapping the supply wall and flashing a clear recovery trigger. 🌊 The order flow shows smart money stepping in, with volume swelling on the 15‑minute chart and the RSI edging off oversold territory.
⚡ With a tight stop just below the breakout level and a tiered target ladder up to 0.0007, the risk‑reward profile screams disciplined aggression. 📌 Stick to the plan and let the liquidity sweep fuel the upside.
💬 Are you loading your bids now or waiting for the next liquidity dip? 👇
⚠️ Not financial advice. Always manage your risk. 🛡️
🏷️ #IOST #LongSetup #Breakout #Crypto
🔥 💎
Entry: 0.0006884 ⚡
Target: 0.0006928 🚀
Stop Loss: 0.0006855 ⚠️
📊 Buyers ripped past the prior candle’s high after a sustained decline, snapping the supply wall and flashing a clear recovery trigger. 🌊 The order flow shows smart money stepping in, with volume swelling on the 15‑minute chart and the RSI edging off oversold territory.
⚡ With a tight stop just below the breakout level and a tiered target ladder up to 0.0007, the risk‑reward profile screams disciplined aggression. 📌 Stick to the plan and let the liquidity sweep fuel the upside.
💬 Are you loading your bids now or waiting for the next liquidity dip? 👇
⚠️ Not financial advice. Always manage your risk. 🛡️
🏷️ #IOST #LongSetup #Breakout #Crypto
🔥 💎
12

·
--
$IOST AN ALTCOIN WORTH WATCHING?
📊 Sometimes the most interesting market opportunities begin with changes in volume and momentum.
👀 $IOST is worth monitoring for:
Volume expansion
Price structure
Buyer interest
Broader market direction
🔥 A confirmed trend change would make the chart more interesting.
Patience and confirmation are key.
What's your view on IOST?
#IOST #BinanceSquare
$IOST AN ALTCOIN WORTH WATCHING?
📊 Sometimes the most interesting market opportunities begin with changes in volume and momentum.
👀 $IOST is worth monitoring for:
Volume expansion
Price structure
Buyer interest
Broader market direction
🔥 A confirmed trend change would make the chart more interesting.
Patience and confirmation are key.
What's your view on IOST?
#IOST #BinanceSquare
📊 Sometimes the most interesting market opportunities begin with changes in volume and momentum.
👀 $IOST is worth monitoring for:
Volume expansion
Price structure
Buyer interest
Broader market direction
🔥 A confirmed trend change would make the chart more interesting.
Patience and confirmation are key.
What's your view on IOST?
#IOST #BinanceSquare

1
733

·
--
Bullish
After the v4.10 upgrade, can this coin $IOST soar high??
I remember the incredible moves $IOST has made since September 2026: it rose to $0.001, then in October $IOST made another pretty big move to $0.0019... The past two months have seen big moves. Will this November bring the next big peak and make #IOST the coin with the most significant, most active, and highest moves for three consecutive months?
Let's see—will coin #IOST go to the moon with v4.10??
#BullishMomentum IOST #tothemoon 2026
{spot}(IOSTUSDT)
After the v4.10 upgrade, can this coin $IOST soar high??
I remember the incredible moves $IOST has made since September 2026: it rose to $0.001, then in October $IOST made another pretty big move to $0.0019... The past two months have seen big moves. Will this November bring the next big peak and make #IOST the coin with the most significant, most active, and highest moves for three consecutive months?
Let's see—will coin #IOST go to the moon with v4.10??
#BullishMomentum IOST #tothemoon 2026
I remember the incredible moves $IOST has made since September 2026: it rose to $0.001, then in October $IOST made another pretty big move to $0.0019... The past two months have seen big moves. Will this November bring the next big peak and make #IOST the coin with the most significant, most active, and highest moves for three consecutive months?
Let's see—will coin #IOST go to the moon with v4.10??
#BullishMomentum IOST #tothemoon 2026
aRozko:
"Полетит ли монета на "Луну"...⁉️
О да❗ Господа ❗
Все больше и больше ,
присутствует, ощущение "Космоса"
Именно туда монета летит 🐝❗😀
1
2
325

·
--
🚀 $IOST /USDT: Consolidation before the next move or a correction? 15m analysis 📊
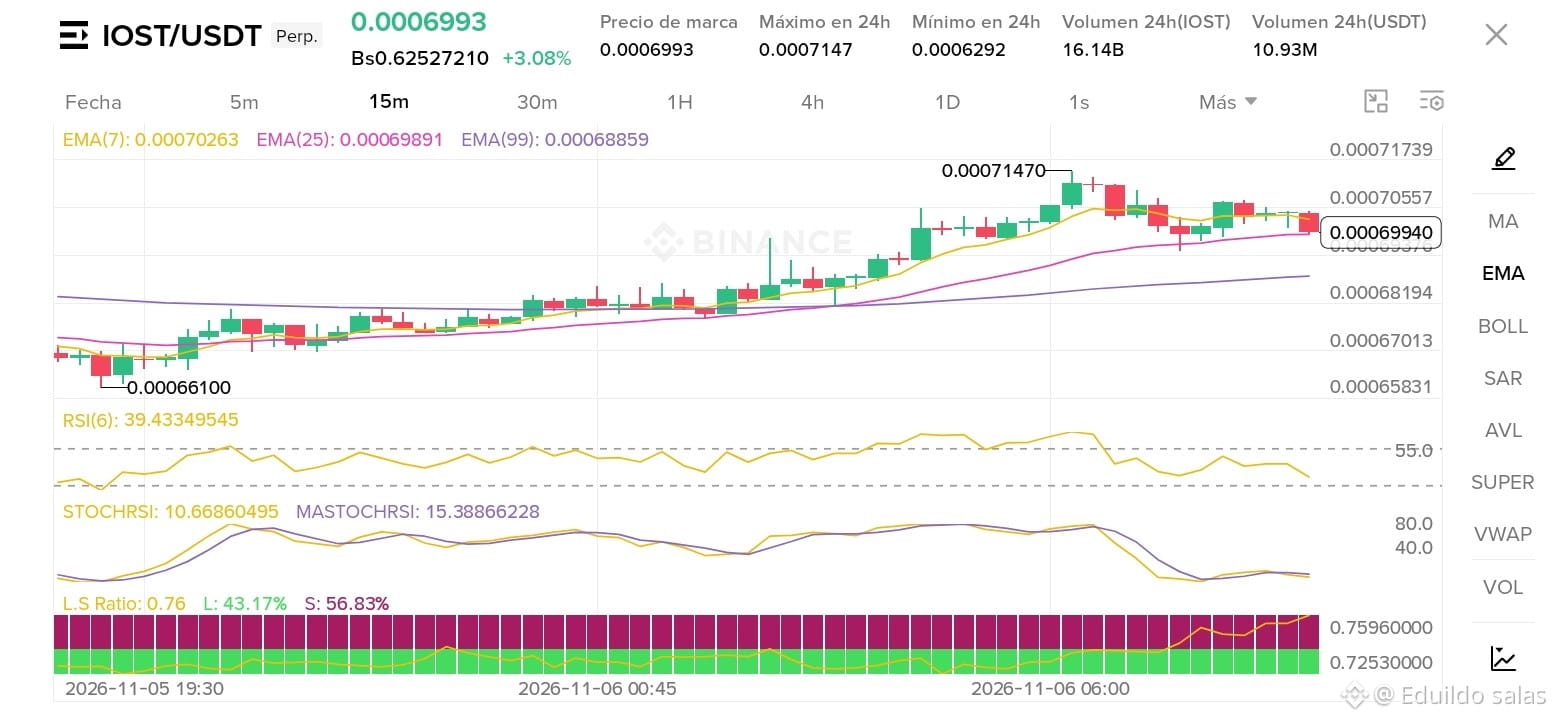
Taking a look at the IOST/USDT chart on the 15-minute timeframe, the cryptocurrency is showing interesting behavior after hitting a 24-hour high of 0.0007147 and currently trading around 0.0006993 (+3.08% on the day).
🔍 Key technical details from the chart:
Moving Averages (EMA): The current price is very close to the EMA(25), which is at 0.0006989, while the EMA(7) is at 0.0007026 and the EMA(99) acts as dynamic support lower down at 0.0006885. We are in a zone of indecision or a tight short-term range.
RSI (6): It is at 39.43, indicating slight short-term selling pressure following the rejection at the highs, and is dangerously close to the oversold zone, which could attract institutional buyers or bounce traders.
StochRSI: It is showing very low levels (STOCHRSI: 10.66 and MASTOCHRSI: 15.38), suggesting that the asset is heavily oversold on this timeframe and opening the door to a possible imminent bullish crossover (technical bounce).
Volume and Long/Short Ratio: We see robust 24-hour volume of 16.14B IOST (10.93M USDT). The position ratio shows L: 43.17% / S: 56.83% (Long/Short ratio of 0.76), reflecting a slight bearish advantage in perpetual futures—ideal for a possible short squeeze if the price breaks upward.
💡 Conclusion: Keep a close eye on current support around the 0.0006950–0.0006900 zone. If it holds, we could see another attempt to reach the 0.0007147 resistance. Always manage your risk!
What do you think, trader? Do you see a bullish bounce, or will it need to seek lower support levels? Let me know in the comments! 👇💬
#IOST #BinanceSquare #BinanceReopensWithdrawalsForMoreAssets #binancepick
🚀 $IOST /USDT: Consolidation before the next move or a correction? 15m analysis 📊
Taking a look at the IOST/USDT chart on the 15-minute timeframe, the cryptocurrency is showing interesting behavior after hitting a 24-hour high of 0.0007147 and currently trading around 0.0006993 (+3.08% on the day).
🔍 Key technical details from the chart:
Moving Averages (EMA): The current price is very close to the EMA(25), which is at 0.0006989, while the EMA(7) is at 0.0007026 and the EMA(99) acts as dynamic support lower down at 0.0006885. We are in a zone of indecision or a tight short-term range.
RSI (6): It is at 39.43, indicating slight short-term selling pressure following the rejection at the highs, and is dangerously close to the oversold zone, which could attract institutional buyers or bounce traders.
StochRSI: It is showing very low levels (STOCHRSI: 10.66 and MASTOCHRSI: 15.38), suggesting that the asset is heavily oversold on this timeframe and opening the door to a possible imminent bullish crossover (technical bounce).
Volume and Long/Short Ratio: We see robust 24-hour volume of 16.14B IOST (10.93M USDT). The position ratio shows L: 43.17% / S: 56.83% (Long/Short ratio of 0.76), reflecting a slight bearish advantage in perpetual futures—ideal for a possible short squeeze if the price breaks upward.
💡 Conclusion: Keep a close eye on current support around the 0.0006950–0.0006900 zone. If it holds, we could see another attempt to reach the 0.0007147 resistance. Always manage your risk!
What do you think, trader? Do you see a bullish bounce, or will it need to seek lower support levels? Let me know in the comments! 👇💬
#IOST #BinanceSquare #BinanceReopensWithdrawalsForMoreAssets #binancepick
Taking a look at the IOST/USDT chart on the 15-minute timeframe, the cryptocurrency is showing interesting behavior after hitting a 24-hour high of 0.0007147 and currently trading around 0.0006993 (+3.08% on the day).
🔍 Key technical details from the chart:
Moving Averages (EMA): The current price is very close to the EMA(25), which is at 0.0006989, while the EMA(7) is at 0.0007026 and the EMA(99) acts as dynamic support lower down at 0.0006885. We are in a zone of indecision or a tight short-term range.
RSI (6): It is at 39.43, indicating slight short-term selling pressure following the rejection at the highs, and is dangerously close to the oversold zone, which could attract institutional buyers or bounce traders.
StochRSI: It is showing very low levels (STOCHRSI: 10.66 and MASTOCHRSI: 15.38), suggesting that the asset is heavily oversold on this timeframe and opening the door to a possible imminent bullish crossover (technical bounce).
Volume and Long/Short Ratio: We see robust 24-hour volume of 16.14B IOST (10.93M USDT). The position ratio shows L: 43.17% / S: 56.83% (Long/Short ratio of 0.76), reflecting a slight bearish advantage in perpetual futures—ideal for a possible short squeeze if the price breaks upward.
💡 Conclusion: Keep a close eye on current support around the 0.0006950–0.0006900 zone. If it holds, we could see another attempt to reach the 0.0007147 resistance. Always manage your risk!
What do you think, trader? Do you see a bullish bounce, or will it need to seek lower support levels? Let me know in the comments! 👇💬
#IOST #BinanceSquare #BinanceReopensWithdrawalsForMoreAssets #binancepick
161
·
--
🚀 Live Technical Analysis: $IOST / USDT (Perpetual - 15m) 📈
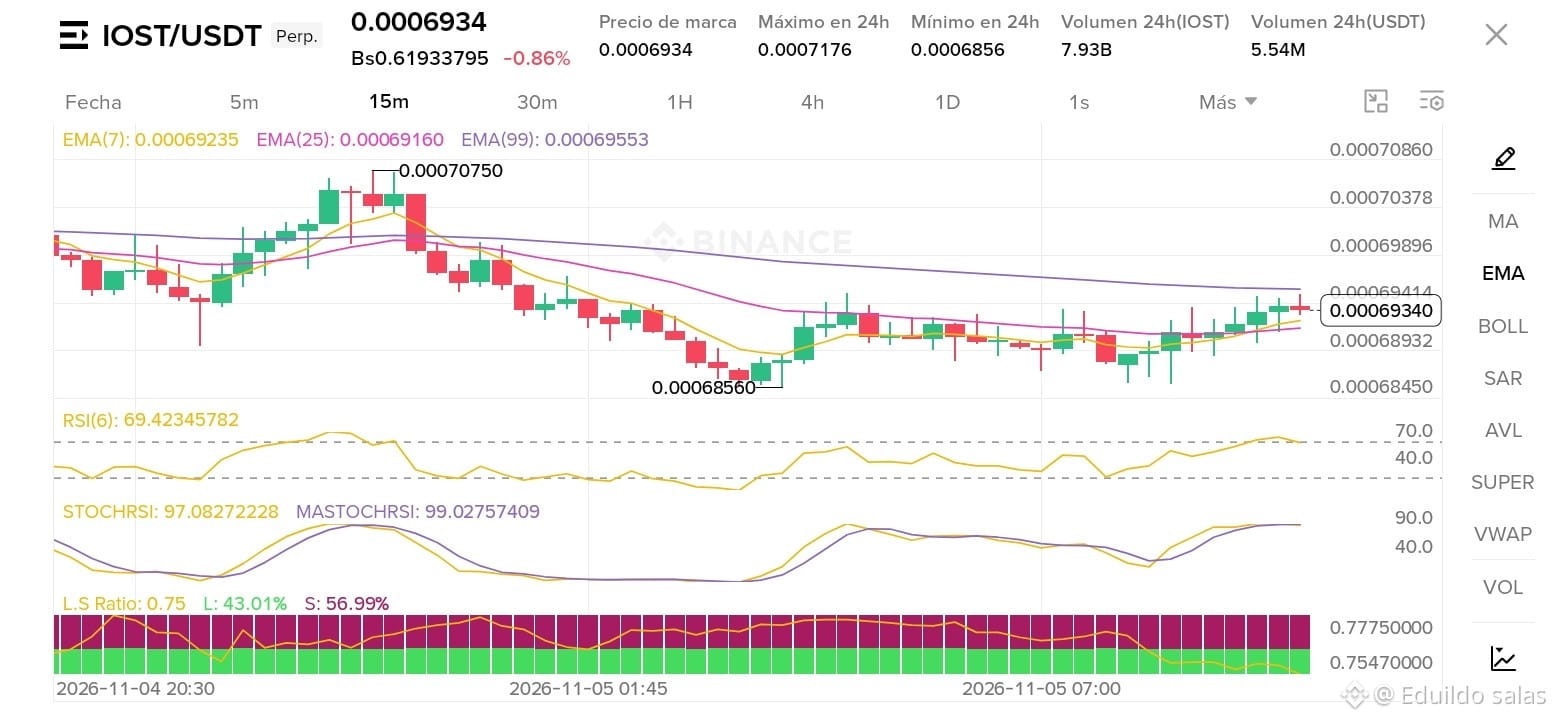
The $IOST pair is showing an interesting battle on the 15-minute chart after bouncing from its 24-hour low of 0.00068560 and moving toward a recent high near 0.00070750. Could this be the start of a new impulse or a key consolidation? 👀👇
📊 What are the indicators telling us?
Current Price: At 0.00069340 (-0.86%), trading right in a short-term equilibrium zone.
Moving Averages (EMA 7, 25, 99): The lines are quite compressed and intertwined around the current price, indicating a clear compression phase as the market awaits a move backed by strong volume.
RSI (6): At 69.42, dangerously close to the overbought zone. Buyers are trying to take control, but immediate resistance could temporarily hold them back.
StochRSI: Elevated readings (97.08 and 99.02) suggest that the asset is near the top of its current range. Keep a close eye out for a possible relief pullback or continued bullish pressure if more volume comes in.
L/S Ratio: Currently at 0.75 (Longs: 43.01% / Shorts: 56.99%), indicating a slight dominance of short positions, which could fuel a potential short squeeze if the price breaks through the upper resistance with force.
💡 Conclusion: Closely monitoring a breakout from the current range. Will it break through 0.00070750 with force, or seek support at the lower EMAs?
How do you see your position shaping up over the next few hours? Let me know in the comments! 👇💬
#IOST #CryptoTrading #BinanceSquare #BinancePick
🚀 Live Technical Analysis: $IOST / USDT (Perpetual - 15m) 📈
The $IOST pair is showing an interesting battle on the 15-minute chart after bouncing from its 24-hour low of 0.00068560 and moving toward a recent high near 0.00070750. Could this be the start of a new impulse or a key consolidation? 👀👇
📊 What are the indicators telling us?
Current Price: At 0.00069340 (-0.86%), trading right in a short-term equilibrium zone.
Moving Averages (EMA 7, 25, 99): The lines are quite compressed and intertwined around the current price, indicating a clear compression phase as the market awaits a move backed by strong volume.
RSI (6): At 69.42, dangerously close to the overbought zone. Buyers are trying to take control, but immediate resistance could temporarily hold them back.
StochRSI: Elevated readings (97.08 and 99.02) suggest that the asset is near the top of its current range. Keep a close eye out for a possible relief pullback or continued bullish pressure if more volume comes in.
L/S Ratio: Currently at 0.75 (Longs: 43.01% / Shorts: 56.99%), indicating a slight dominance of short positions, which could fuel a potential short squeeze if the price breaks through the upper resistance with force.
💡 Conclusion: Closely monitoring a breakout from the current range. Will it break through 0.00070750 with force, or seek support at the lower EMAs?
How do you see your position shaping up over the next few hours? Let me know in the comments! 👇💬
#IOST #CryptoTrading #BinanceSquare #BinancePick
The $IOST pair is showing an interesting battle on the 15-minute chart after bouncing from its 24-hour low of 0.00068560 and moving toward a recent high near 0.00070750. Could this be the start of a new impulse or a key consolidation? 👀👇
📊 What are the indicators telling us?
Current Price: At 0.00069340 (-0.86%), trading right in a short-term equilibrium zone.
Moving Averages (EMA 7, 25, 99): The lines are quite compressed and intertwined around the current price, indicating a clear compression phase as the market awaits a move backed by strong volume.
RSI (6): At 69.42, dangerously close to the overbought zone. Buyers are trying to take control, but immediate resistance could temporarily hold them back.
StochRSI: Elevated readings (97.08 and 99.02) suggest that the asset is near the top of its current range. Keep a close eye out for a possible relief pullback or continued bullish pressure if more volume comes in.
L/S Ratio: Currently at 0.75 (Longs: 43.01% / Shorts: 56.99%), indicating a slight dominance of short positions, which could fuel a potential short squeeze if the price breaks through the upper resistance with force.
💡 Conclusion: Closely monitoring a breakout from the current range. Will it break through 0.00070750 with force, or seek support at the lower EMAs?
How do you see your position shaping up over the next few hours? Let me know in the comments! 👇💬
#IOST #CryptoTrading #BinanceSquare #BinancePick
199

·
--
Bullish
The official IOST account announced a mandatory Mainnet Upgrade to version v4.10.0.
Deadline: Before block 48008000 is reached (expected on November 10 at 23:45 UTC).
Details: The upgrade is mandatory for all Node Operators to ensure network stability and compatibility.
Impact on the currency ($IOST):
Such network updates and protocol upgrades enhance efficiency and security, and typically support investor and developer confidence in the project's infrastructure. However, price movements should be monitored during the upgrade to avoid volatility associated with temporary service interruptions or node readiness.
#IOST #crypto #bullish #CryptoUpdate
$IOST
{spot}(IOSTUSDT)
The official IOST account announced a mandatory Mainnet Upgrade to version v4.10.0.
Deadline: Before block 48008000 is reached (expected on November 10 at 23:45 UTC).
Details: The upgrade is mandatory for all Node Operators to ensure network stability and compatibility.
Impact on the currency ($IOST ):
Such network updates and protocol upgrades enhance efficiency and security, and typically support investor and developer confidence in the project's infrastructure. However, price movements should be monitored during the upgrade to avoid volatility associated with temporary service interruptions or node readiness.
#IOST #crypto #bullish #CryptoUpdate
$IOST
Deadline: Before block 48008000 is reached (expected on November 10 at 23:45 UTC).
Details: The upgrade is mandatory for all Node Operators to ensure network stability and compatibility.
Impact on the currency ($IOST ):
Such network updates and protocol upgrades enhance efficiency and security, and typically support investor and developer confidence in the project's infrastructure. However, price movements should be monitored during the upgrade to avoid volatility associated with temporary service interruptions or node readiness.
#IOST #crypto #bullish #CryptoUpdate
$IOST
1
36
·
--
🚨 Attention, traders! Bounce opportunity or bear trap in $IOST ?
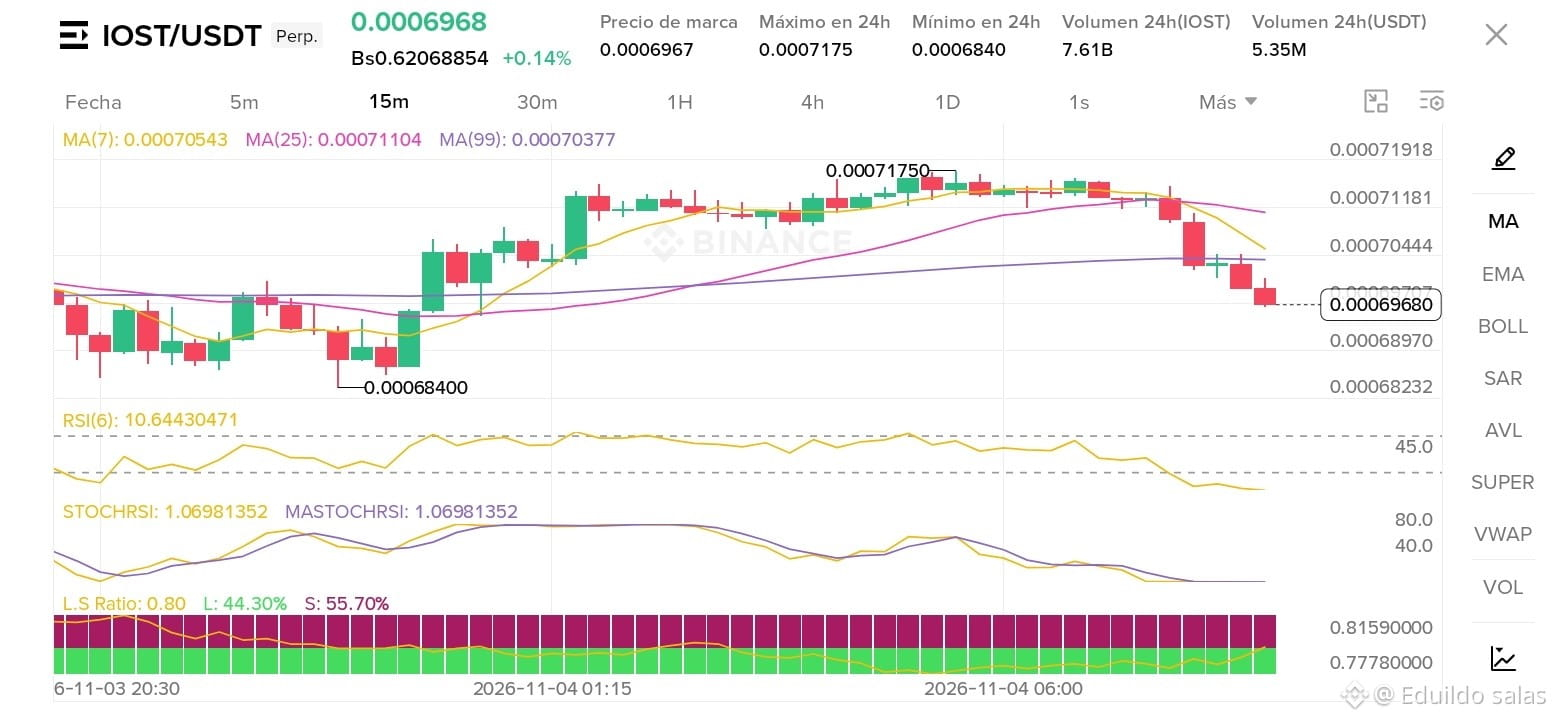
Let’s analyze what’s happening right now on the $IOST /USDT (Perp) chart on the 15-minute timeframe:
Current price: $0.0006968 USDT, showing a slight change of +0.14%.
24h range: High of $0.0007175 and low of $0.0006840.
Key Indicators:
RSI(6) at extreme levels: It’s at an ultra-low reading of 10.64, indicating a massive oversold condition. Are we nearing a bottom for an imminent technical bounce?
StochRSI: Also compressed in the lower zone (1.06), reinforcing short-term selling pressure while warning of a possible trend reversal if buying volume comes in.
Moving Averages (MA): The price recently broke below the moving averages (MA(7) at $0.000705, MA(25) at $0.000711, and MA(99) at $0.000703), showing a recent bearish crossover, with the bears temporarily in control.
Long/Short Ratio: Currently at 0.80, with 55.70% of positions Short versus 44.30% Long. Watch out for a possible short squeeze if the price holds at current support and sellers get trapped!
📊 24h Volume: Solid activity, with 7.61B IOST (5.35M USDT) traded, showing that the market is liquid and rapid moves could happen at any moment.
Are you accumulating in this oversold zone, or would you rather wait for confirmation above the 7-period moving average? Let me know what you think in the comments! 👇
#IOST #BinanceSquare #binancepick #EarningsSeason #BinanceIncidentReport
🚨 Attention, traders! Bounce opportunity or bear trap in $IOST ?
Let’s analyze what’s happening right now on the $IOST /USDT (Perp) chart on the 15-minute timeframe:
Current price: $0.0006968 USDT, showing a slight change of +0.14%.
24h range: High of $0.0007175 and low of $0.0006840.
Key Indicators:
RSI(6) at extreme levels: It’s at an ultra-low reading of 10.64, indicating a massive oversold condition. Are we nearing a bottom for an imminent technical bounce?
StochRSI: Also compressed in the lower zone (1.06), reinforcing short-term selling pressure while warning of a possible trend reversal if buying volume comes in.
Moving Averages (MA): The price recently broke below the moving averages (MA(7) at $0.000705, MA(25) at $0.000711, and MA(99) at $0.000703), showing a recent bearish crossover, with the bears temporarily in control.
Long/Short Ratio: Currently at 0.80, with 55.70% of positions Short versus 44.30% Long. Watch out for a possible short squeeze if the price holds at current support and sellers get trapped!
📊 24h Volume: Solid activity, with 7.61B IOST (5.35M USDT) traded, showing that the market is liquid and rapid moves could happen at any moment.
Are you accumulating in this oversold zone, or would you rather wait for confirmation above the 7-period moving average? Let me know what you think in the comments! 👇
#IOST #BinanceSquare #binancepick #EarningsSeason #BinanceIncidentReport
Let’s analyze what’s happening right now on the $IOST /USDT (Perp) chart on the 15-minute timeframe:
Current price: $0.0006968 USDT, showing a slight change of +0.14%.
24h range: High of $0.0007175 and low of $0.0006840.
Key Indicators:
RSI(6) at extreme levels: It’s at an ultra-low reading of 10.64, indicating a massive oversold condition. Are we nearing a bottom for an imminent technical bounce?
StochRSI: Also compressed in the lower zone (1.06), reinforcing short-term selling pressure while warning of a possible trend reversal if buying volume comes in.
Moving Averages (MA): The price recently broke below the moving averages (MA(7) at $0.000705, MA(25) at $0.000711, and MA(99) at $0.000703), showing a recent bearish crossover, with the bears temporarily in control.
Long/Short Ratio: Currently at 0.80, with 55.70% of positions Short versus 44.30% Long. Watch out for a possible short squeeze if the price holds at current support and sellers get trapped!
📊 24h Volume: Solid activity, with 7.61B IOST (5.35M USDT) traded, showing that the market is liquid and rapid moves could happen at any moment.
Are you accumulating in this oversold zone, or would you rather wait for confirmation above the 7-period moving average? Let me know what you think in the comments! 👇
#IOST #BinanceSquare #binancepick #EarningsSeason #BinanceIncidentReport
215

📉 MY IOST/USDT TRADE IS IN LOSS – NEED YOUR ADVICE!
I bought IOST/USDT, but unfortunately, the price keeps falling and my investment is now in loss.
I'm still watching the market and trying to make the right decision.
I want to hear from experienced traders in the Binance community.
💬 What would you do in my position?
Hold and wait for a recovery?
Sell and accept the loss?
Wait for confirmation before making another move?
Your advice and market analysis would be appreciated!
#IOST #cryptotrading #BinanceSquare #TradingCommunity
{spot}(IOSTUSDT)
📉 MY IOST/USDT TRADE IS IN LOSS – NEED YOUR ADVICE!
I bought IOST/USDT, but unfortunately, the price keeps falling and my investment is now in loss.
I'm still watching the market and trying to make the right decision.
I want to hear from experienced traders in the Binance community.
💬 What would you do in my position?
Hold and wait for a recovery?
Sell and accept the loss?
Wait for confirmation before making another move?
Your advice and market analysis would be appreciated!
#IOST #cryptotrading #BinanceSquare #TradingCommunity
I bought IOST/USDT, but unfortunately, the price keeps falling and my investment is now in loss.
I'm still watching the market and trying to make the right decision.
I want to hear from experienced traders in the Binance community.
💬 What would you do in my position?
Hold and wait for a recovery?
Sell and accept the loss?
Wait for confirmation before making another move?
Your advice and market analysis would be appreciated!
#IOST #cryptotrading #BinanceSquare #TradingCommunity

重生之我是天才交易圆:
我的成本从0.00075降到了0.000709🤑
3
2
572
·
--
🚨 Attention, traders! What’s happening with $IOST /USDT on the 15m timeframe? 📉📈
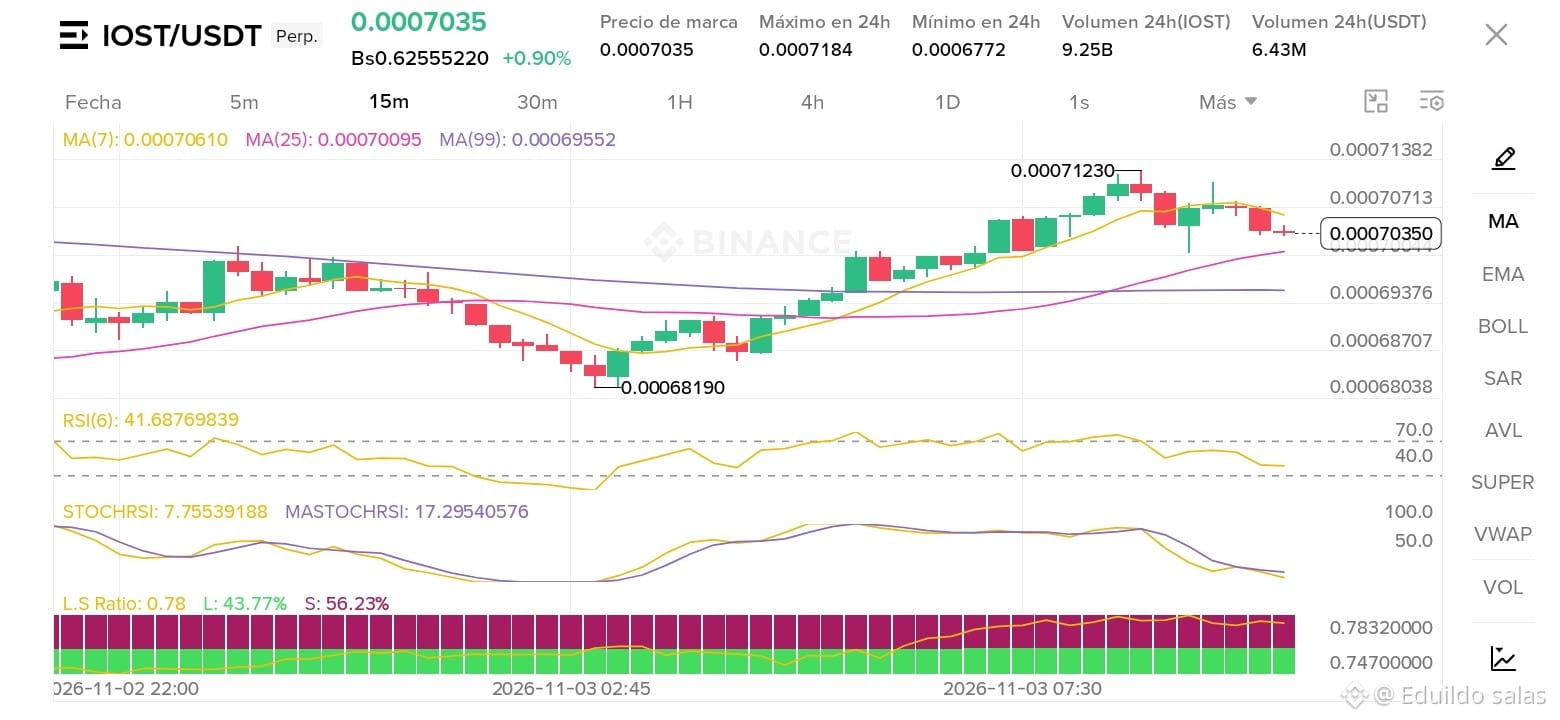
The IOST/USDT Perp pair is showing an interesting move after hitting a low of 0.00068190 and seeking a bullish push up to 0.0007184. The price is currently trading at 0.0007035 (+0.90%), in a key zone of indecision.
📊 Quick technical analysis:
Current price: 0.0007035 USDT
24h range: High of 0.0007184 | Low of 0.0006772
24h volume: Solid activity, with 9.25B IOST (equivalent to 6.43M USDT).
Moving Averages (MA): The MA lines show a recent crossover, with the price hovering around the intermediate average and testing dynamic support after being rejected in the upper zone.
RSI (6): At 41.68, tilting toward the neutral-to-bearish zone, indicating that immediate selling pressure has prevailed since the latest peak.
StochRSI: At very low levels (7.75), suggesting a possible oversold zone and opening the door to an imminent technical rebound if buyers step in strongly.
Long/Short Ratio: Currently at 0.78 (L: 43.77% vs S: 56.23%), reflecting a slight bearish dominance in short-term market sentiment.
💡 What can we expect? If current support holds and the StochRSI crosses upward from this compression zone, we could see another test of resistance at 0.000712 - 0.000718. Keep a close eye on volume and the reaction over the next few candles!
Are you accumulating or waiting for confirmation? Let me know in the comments! 👇💬
#IOST #BinanceSquare #BinancePick #EarningsSeason #Nasdaq100EntersCorrection
🚨 Attention, traders! What’s happening with $IOST /USDT on the 15m timeframe? 📉📈
The IOST/USDT Perp pair is showing an interesting move after hitting a low of 0.00068190 and seeking a bullish push up to 0.0007184. The price is currently trading at 0.0007035 (+0.90%), in a key zone of indecision.
📊 Quick technical analysis:
Current price: 0.0007035 USDT
24h range: High of 0.0007184 | Low of 0.0006772
24h volume: Solid activity, with 9.25B IOST (equivalent to 6.43M USDT).
Moving Averages (MA): The MA lines show a recent crossover, with the price hovering around the intermediate average and testing dynamic support after being rejected in the upper zone.
RSI (6): At 41.68, tilting toward the neutral-to-bearish zone, indicating that immediate selling pressure has prevailed since the latest peak.
StochRSI: At very low levels (7.75), suggesting a possible oversold zone and opening the door to an imminent technical rebound if buyers step in strongly.
Long/Short Ratio: Currently at 0.78 (L: 43.77% vs S: 56.23%), reflecting a slight bearish dominance in short-term market sentiment.
💡 What can we expect? If current support holds and the StochRSI crosses upward from this compression zone, we could see another test of resistance at 0.000712 - 0.000718. Keep a close eye on volume and the reaction over the next few candles!
Are you accumulating or waiting for confirmation? Let me know in the comments! 👇💬
#IOST #BinanceSquare #BinancePick #EarningsSeason #Nasdaq100EntersCorrection
The IOST/USDT Perp pair is showing an interesting move after hitting a low of 0.00068190 and seeking a bullish push up to 0.0007184. The price is currently trading at 0.0007035 (+0.90%), in a key zone of indecision.
📊 Quick technical analysis:
Current price: 0.0007035 USDT
24h range: High of 0.0007184 | Low of 0.0006772
24h volume: Solid activity, with 9.25B IOST (equivalent to 6.43M USDT).
Moving Averages (MA): The MA lines show a recent crossover, with the price hovering around the intermediate average and testing dynamic support after being rejected in the upper zone.
RSI (6): At 41.68, tilting toward the neutral-to-bearish zone, indicating that immediate selling pressure has prevailed since the latest peak.
StochRSI: At very low levels (7.75), suggesting a possible oversold zone and opening the door to an imminent technical rebound if buyers step in strongly.
Long/Short Ratio: Currently at 0.78 (L: 43.77% vs S: 56.23%), reflecting a slight bearish dominance in short-term market sentiment.
💡 What can we expect? If current support holds and the StochRSI crosses upward from this compression zone, we could see another test of resistance at 0.000712 - 0.000718. Keep a close eye on volume and the reaction over the next few candles!
Are you accumulating or waiting for confirmation? Let me know in the comments! 👇💬
#IOST #BinanceSquare #BinancePick #EarningsSeason #Nasdaq100EntersCorrection
200
·
--
🚨 Attention traders! Bounce opportunity or bear trap in $IOST /USDT?
Let's analyze the 1D chart (lower timeframe of 15m/recent candles) for this Perpetual pair:
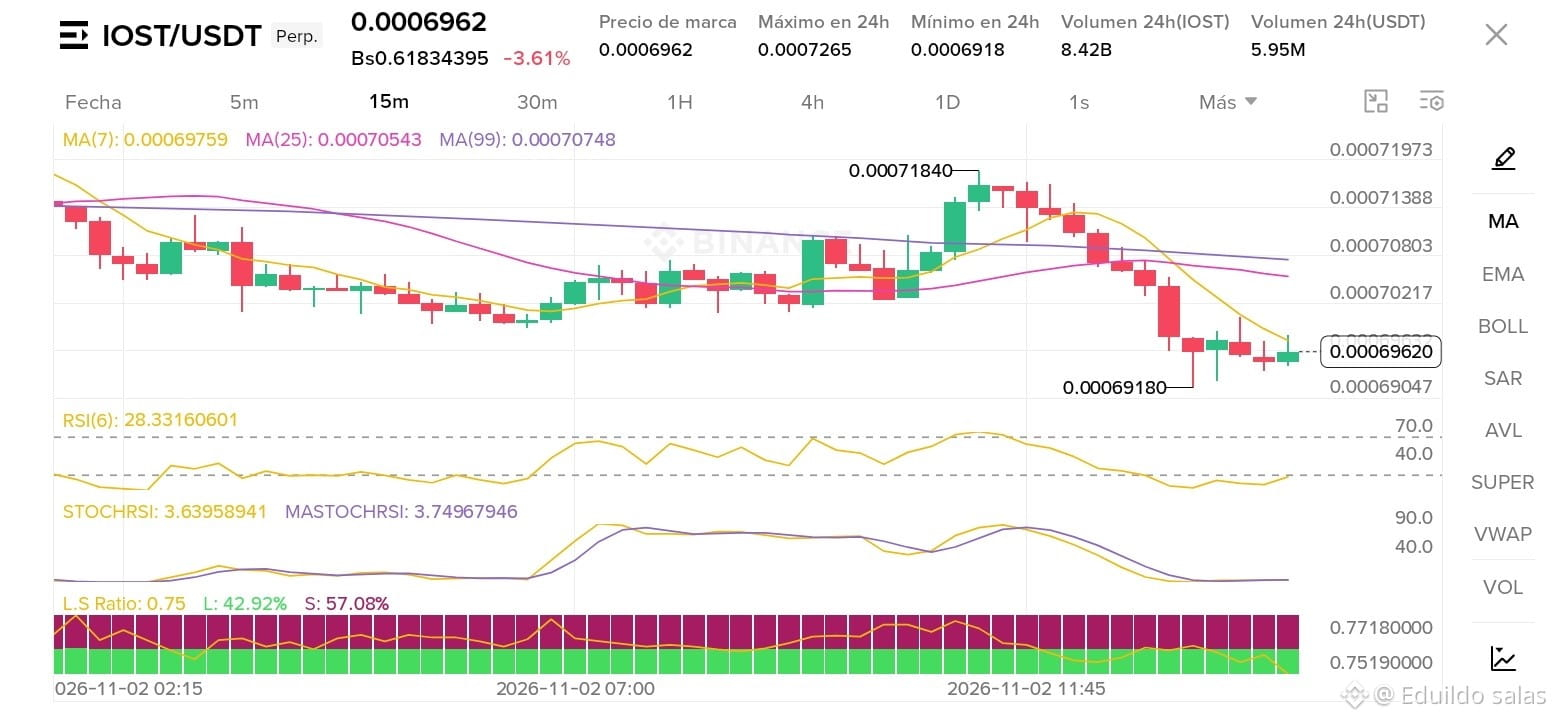
Current price: 0.0006962 USDT (down -3.61%).
24h range: High of 0.0007265 and a recent low touching 0.0006918 USDT.
Key Indicators:
RSI(6): At 28.33, indicating that the price has clearly entered oversold territory.
StochRSI: Extremely low (3.63), suggesting selling pressure may be easing and a bullish crossover or short-term technical bounce may be imminent.
Volume: Robust 24h volume of 8.42B IOST (5.95M USDT), showing high market activity.
Long/Short Sentiment: The L/S ratio is 0.75, with 57.08% of positions short, which could trigger a juicy short squeeze if buyers defend the current support at 0.0006918.
Are you accumulating in this oversold zone, or would you rather wait for confirmation? I'll be reading your thoughts in the comments! 👇💬
#IOST #BinanceSquare #BinanceWithdrawalScamWarning #goodbye
🚨 Attention traders! Bounce opportunity or bear trap in $IOST /USDT?
Let's analyze the 1D chart (lower timeframe of 15m/recent candles) for this Perpetual pair:
Current price: 0.0006962 USDT (down -3.61%).
24h range: High of 0.0007265 and a recent low touching 0.0006918 USDT.
Key Indicators:
RSI(6): At 28.33, indicating that the price has clearly entered oversold territory.
StochRSI: Extremely low (3.63), suggesting selling pressure may be easing and a bullish crossover or short-term technical bounce may be imminent.
Volume: Robust 24h volume of 8.42B IOST (5.95M USDT), showing high market activity.
Long/Short Sentiment: The L/S ratio is 0.75, with 57.08% of positions short, which could trigger a juicy short squeeze if buyers defend the current support at 0.0006918.
Are you accumulating in this oversold zone, or would you rather wait for confirmation? I'll be reading your thoughts in the comments! 👇💬
#IOST #BinanceSquare #BinanceWithdrawalScamWarning #goodbye
Let's analyze the 1D chart (lower timeframe of 15m/recent candles) for this Perpetual pair:
Current price: 0.0006962 USDT (down -3.61%).
24h range: High of 0.0007265 and a recent low touching 0.0006918 USDT.
Key Indicators:
RSI(6): At 28.33, indicating that the price has clearly entered oversold territory.
StochRSI: Extremely low (3.63), suggesting selling pressure may be easing and a bullish crossover or short-term technical bounce may be imminent.
Volume: Robust 24h volume of 8.42B IOST (5.95M USDT), showing high market activity.
Long/Short Sentiment: The L/S ratio is 0.75, with 57.08% of positions short, which could trigger a juicy short squeeze if buyers defend the current support at 0.0006918.
Are you accumulating in this oversold zone, or would you rather wait for confirmation? I'll be reading your thoughts in the comments! 👇💬
#IOST #BinanceSquare #BinanceWithdrawalScamWarning #goodbye
259
·
--
🚀 Quick Analysis: $IOST / USDT (Perpetual - 15m Timeframe)
📈 Current Technical Setup:
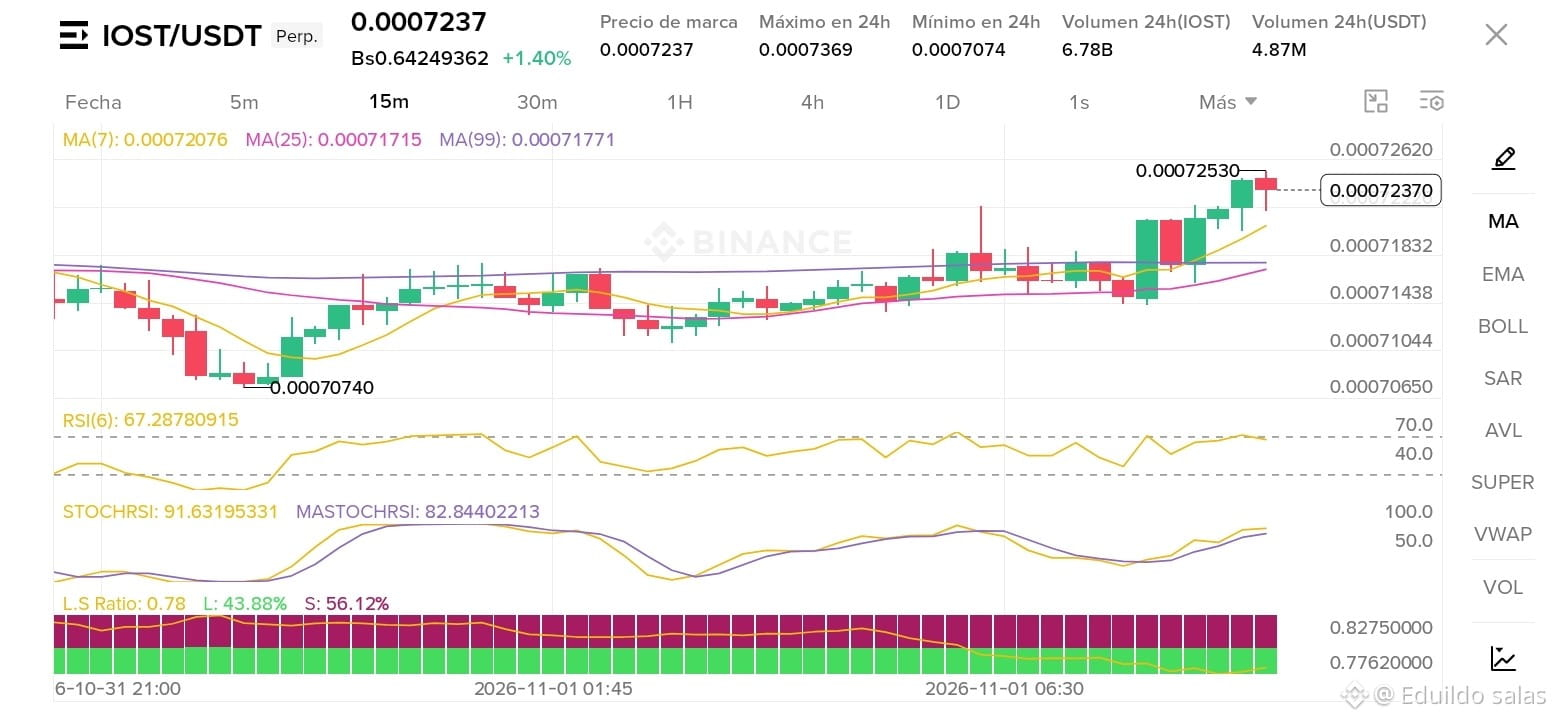
Current price: $0.0007237 (+1.40%)
Trading Range (24h): Low of $0.0007074 ➔ High of $0.0007369
Moving Averages (MA): The trend lines (MA 7, 25, and 99) show a short-term bullish alignment after bouncing from the key support zone at $0.0007074.
Momentum Indicators:
RSI (6): At ~67.28, approaching the overbought zone, but with room for one final bullish push if buying pressure holds.
StochRSI: In elevated territory (~91.63), suggesting caution about a possible short-term consolidation or pullback before the trend continues.
🎯 Suggested Trading Setup (Risk Management)
Direction: 🟢 Long (Buy / Bullish) on a pullback or breakout above immediate resistance.
Entry Zone: $0.0007180 – $0.0007230 (looking for support at the fast moving average).
Take Profit (TP):
TP1: $0.0007350
TP2: $0.0007500
Stop Loss (SL): $0.0007050 (below recent support and the structure invalidation level).
⚠️ Risk management note: Trade with controlled leverage and stick to your Stop Loss to protect your capital amid the high volatility of the perpetual market.
#IOST #BinanceSquare #CryptoTrading #AnalisisTecnico #BinanceSAFUFundTransferCompleted7499BTC
🚀 Quick Analysis: $IOST / USDT (Perpetual - 15m Timeframe)
📈 Current Technical Setup:
Current price: $0.0007237 (+1.40%)
Trading Range (24h): Low of $0.0007074 ➔ High of $0.0007369
Moving Averages (MA): The trend lines (MA 7, 25, and 99) show a short-term bullish alignment after bouncing from the key support zone at $0.0007074.
Momentum Indicators:
RSI (6): At ~67.28, approaching the overbought zone, but with room for one final bullish push if buying pressure holds.
StochRSI: In elevated territory (~91.63), suggesting caution about a possible short-term consolidation or pullback before the trend continues.
🎯 Suggested Trading Setup (Risk Management)
Direction: 🟢 Long (Buy / Bullish) on a pullback or breakout above immediate resistance.
Entry Zone: $0.0007180 – $0.0007230 (looking for support at the fast moving average).
Take Profit (TP):
TP1: $0.0007350
TP2: $0.0007500
Stop Loss (SL): $0.0007050 (below recent support and the structure invalidation level).
⚠️ Risk management note: Trade with controlled leverage and stick to your Stop Loss to protect your capital amid the high volatility of the perpetual market.
#IOST #BinanceSquare #CryptoTrading #AnalisisTecnico #BinanceSAFUFundTransferCompleted7499BTC
📈 Current Technical Setup:
Current price: $0.0007237 (+1.40%)
Trading Range (24h): Low of $0.0007074 ➔ High of $0.0007369
Moving Averages (MA): The trend lines (MA 7, 25, and 99) show a short-term bullish alignment after bouncing from the key support zone at $0.0007074.
Momentum Indicators:
RSI (6): At ~67.28, approaching the overbought zone, but with room for one final bullish push if buying pressure holds.
StochRSI: In elevated territory (~91.63), suggesting caution about a possible short-term consolidation or pullback before the trend continues.
🎯 Suggested Trading Setup (Risk Management)
Direction: 🟢 Long (Buy / Bullish) on a pullback or breakout above immediate resistance.
Entry Zone: $0.0007180 – $0.0007230 (looking for support at the fast moving average).
Take Profit (TP):
TP1: $0.0007350
TP2: $0.0007500
Stop Loss (SL): $0.0007050 (below recent support and the structure invalidation level).
⚠️ Risk management note: Trade with controlled leverage and stick to your Stop Loss to protect your capital amid the high volatility of the perpetual market.
#IOST #BinanceSquare #CryptoTrading #AnalisisTecnico #BinanceSAFUFundTransferCompleted7499BTC
257
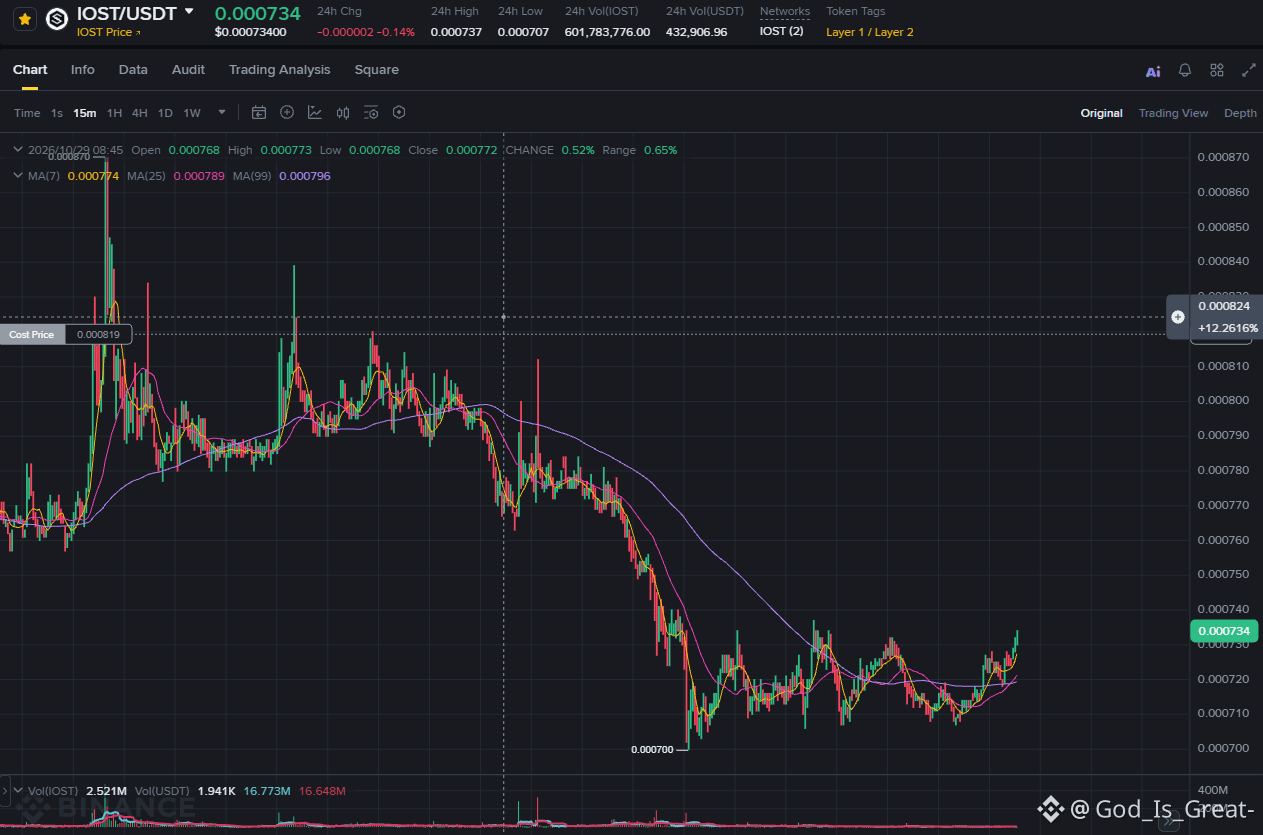
15-minute IOST/USDT chart. Price is about 0.000734 right now. I see a sharp drop from around 0.00082
down toward 0.0007, then some buyers came in near 0.00071 to 0.00072. There's a little recovery trying to form, but nothing confirmed yet. Key support's at 0.00072, resistance is around 0.000737, and if you see a clean breakout with strong volume, maybe it can push toward 0.00075 or 0.00077.
But if 0.00072 fails, retesting 0.00071 or 0.0007 is possible. Binance Square caption idea: IOST/USDT update: buyers trying to take control. Do you think IOST can break 0.00075 next, or will sellers take control again?
#IOST
{spot}(IOSTUSDT)
#IOSTUSDT #CryptoMarket
15-minute IOST/USDT chart. Price is about 0.000734 right now. I see a sharp drop from around 0.00082
down toward 0.0007, then some buyers came in near 0.00071 to 0.00072. There's a little recovery trying to form, but nothing confirmed yet. Key support's at 0.00072, resistance is around 0.000737, and if you see a clean breakout with strong volume, maybe it can push toward 0.00075 or 0.00077.
But if 0.00072 fails, retesting 0.00071 or 0.0007 is possible. Binance Square caption idea: IOST/USDT update: buyers trying to take control. Do you think IOST can break 0.00075 next, or will sellers take control again?
#IOST
#IOSTUSDT #CryptoMarket
down toward 0.0007, then some buyers came in near 0.00071 to 0.00072. There's a little recovery trying to form, but nothing confirmed yet. Key support's at 0.00072, resistance is around 0.000737, and if you see a clean breakout with strong volume, maybe it can push toward 0.00075 or 0.00077.
But if 0.00072 fails, retesting 0.00071 or 0.0007 is possible. Binance Square caption idea: IOST/USDT update: buyers trying to take control. Do you think IOST can break 0.00075 next, or will sellers take control again?
#IOST
#IOSTUSDT #CryptoMarket
890
·
--
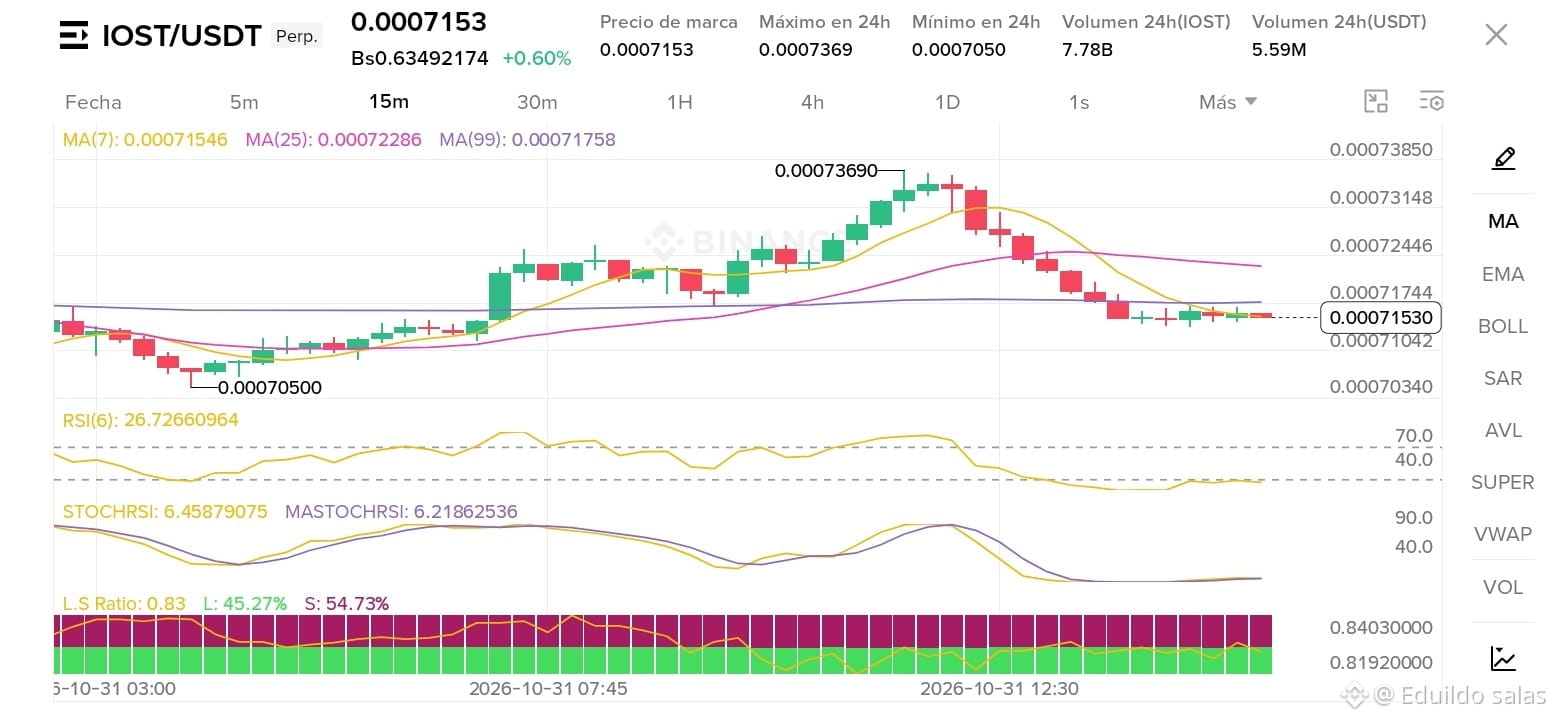
📊 Quick Analysis of $IOST /USDT (15m Timeframe)
The IOST/USDT pair is at a very interesting decision point after a correction from its 24-hour high of 0.0007369. It is currently trading at 0.0007153, showing sideways price action that deserves our full attention.
🔍 Key chart details:
Current Price: 0.0007153 USDT (+0.60%).
24h Range: High of 0.0007369 and low of 0.0007050.
Volume: Very solid, with 7.78B IOST and 5.59M USDT traded.
Technical Indicators:
RSI(6): At 26.72, entering oversold territory, which could suggest a possible bearish exhaustion or an imminent technical rebound.
StochRSI: Extremely low (6.45), reinforcing the short-term oversold reading.
Moving Averages (MA): The MA(7) at 0.0007154 is very close to the current price, intersecting with the recent trend as it seeks to stabilize after pulling back from the higher moving averages.
L/S Ratio: At 0.83 (45.27% Longs vs. 54.73% Shorts), reflecting some recent bearish pressure, but leaving room for surprises if buyers defend current support levels.
💡 What to watch: If the oversold readings on the RSI and StochRSI manage to attract buying volume in this support zone, we could see an attempt to recover toward the moving average area. Keep this pair on your radar!
What do you think—will it rebound or will the range continue? Let me know in the comments! 👇
#IOST #CryptoTrading #BinanceSquare #AnalisisTecnico #TradingSignals
📊 Quick Analysis of $IOST /USDT (15m Timeframe)
The IOST/USDT pair is at a very interesting decision point after a correction from its 24-hour high of 0.0007369. It is currently trading at 0.0007153, showing sideways price action that deserves our full attention.
🔍 Key chart details:
Current Price: 0.0007153 USDT (+0.60%).
24h Range: High of 0.0007369 and low of 0.0007050.
Volume: Very solid, with 7.78B IOST and 5.59M USDT traded.
Technical Indicators:
RSI(6): At 26.72, entering oversold territory, which could suggest a possible bearish exhaustion or an imminent technical rebound.
StochRSI: Extremely low (6.45), reinforcing the short-term oversold reading.
Moving Averages (MA): The MA(7) at 0.0007154 is very close to the current price, intersecting with the recent trend as it seeks to stabilize after pulling back from the higher moving averages.
L/S Ratio: At 0.83 (45.27% Longs vs. 54.73% Shorts), reflecting some recent bearish pressure, but leaving room for surprises if buyers defend current support levels.
💡 What to watch: If the oversold readings on the RSI and StochRSI manage to attract buying volume in this support zone, we could see an attempt to recover toward the moving average area. Keep this pair on your radar!
What do you think—will it rebound or will the range continue? Let me know in the comments! 👇
#IOST #CryptoTrading #BinanceSquare #AnalisisTecnico #TradingSignals
The IOST/USDT pair is at a very interesting decision point after a correction from its 24-hour high of 0.0007369. It is currently trading at 0.0007153, showing sideways price action that deserves our full attention.
🔍 Key chart details:
Current Price: 0.0007153 USDT (+0.60%).
24h Range: High of 0.0007369 and low of 0.0007050.
Volume: Very solid, with 7.78B IOST and 5.59M USDT traded.
Technical Indicators:
RSI(6): At 26.72, entering oversold territory, which could suggest a possible bearish exhaustion or an imminent technical rebound.
StochRSI: Extremely low (6.45), reinforcing the short-term oversold reading.
Moving Averages (MA): The MA(7) at 0.0007154 is very close to the current price, intersecting with the recent trend as it seeks to stabilize after pulling back from the higher moving averages.
L/S Ratio: At 0.83 (45.27% Longs vs. 54.73% Shorts), reflecting some recent bearish pressure, but leaving room for surprises if buyers defend current support levels.
💡 What to watch: If the oversold readings on the RSI and StochRSI manage to attract buying volume in this support zone, we could see an attempt to recover toward the moving average area. Keep this pair on your radar!
What do you think—will it rebound or will the range continue? Let me know in the comments! 👇
#IOST #CryptoTrading #BinanceSquare #AnalisisTecnico #TradingSignals
326

·
--
Multi-timeframe confluence: $IOST / $WLFI weakening on the 30-minute chart, 4-hour bearish trend confirmed🔥
════════════════════
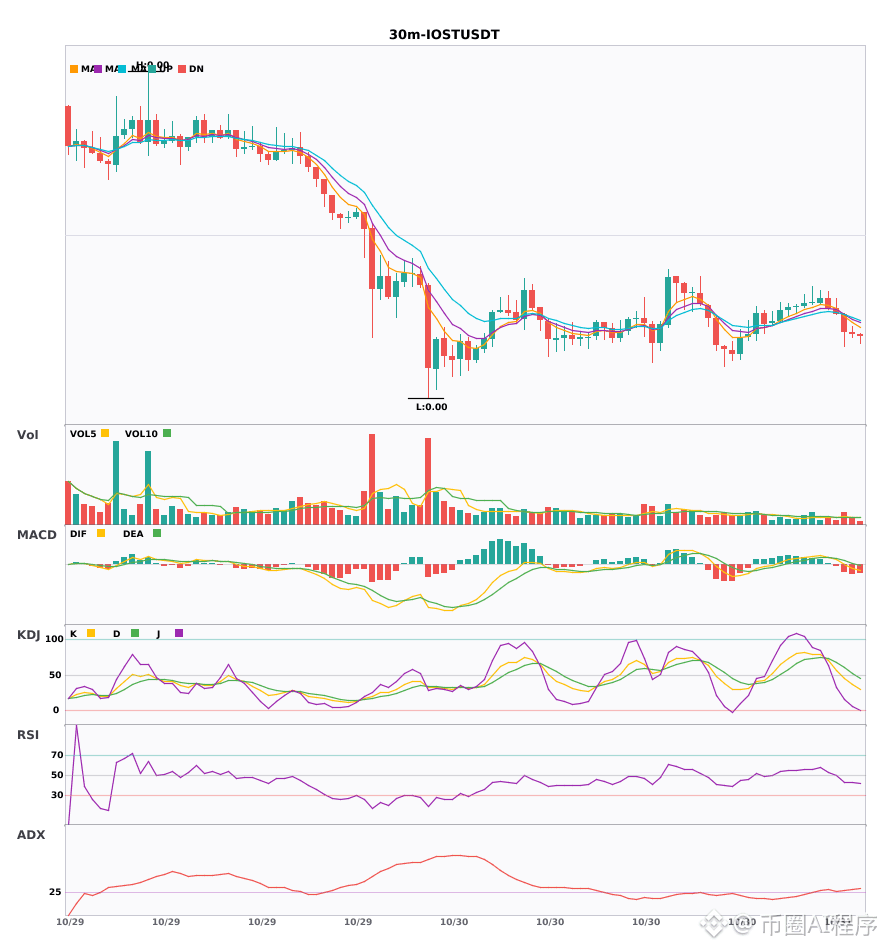
🟢 $IOST 30-minute bearish signal
⚠️Technical analysis: 4-hour bearish confluence confirmed | 30-minute entry: MACD bearish, trend weak, momentum strengthening | EMA5 < EMA8 < EMA13, bearish alignment | Volume increased (1.8x)
════════════════════
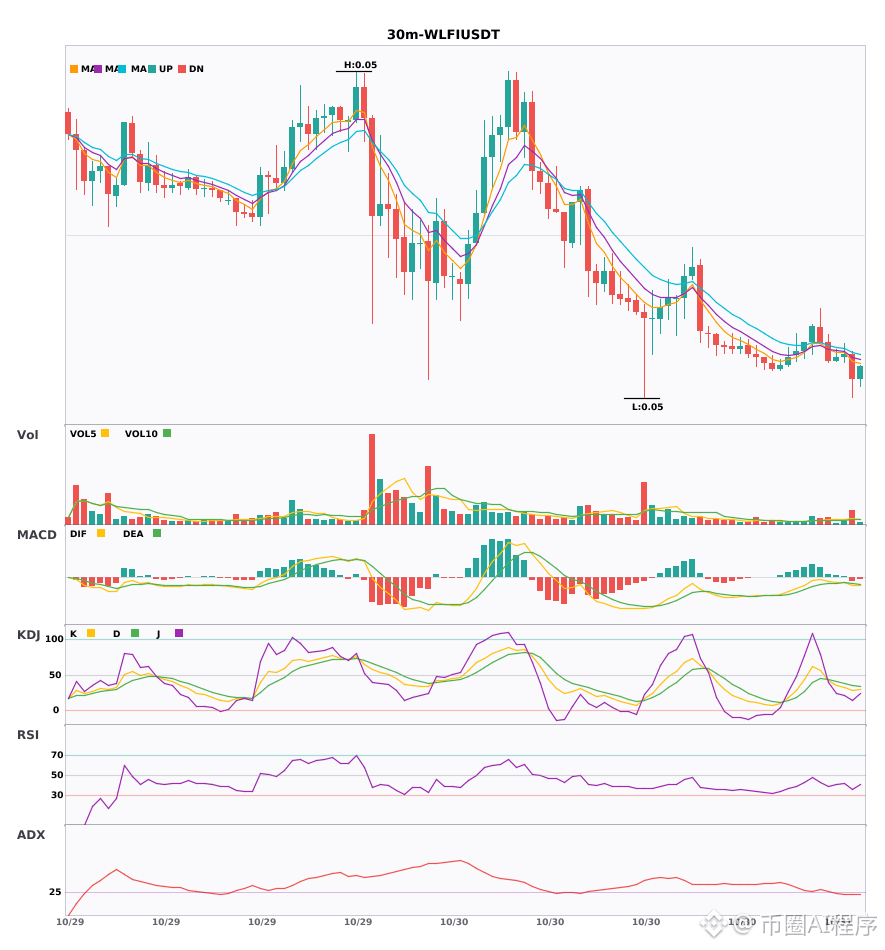
🟢 $WLFI 30-minute bearish signal
⚠️Technical analysis: 4-hour bearish confluence confirmed | 30-minute entry: MACD bearish cross below zero, bearish momentum accelerating | EMA5 < EMA8 < EMA13, bearish alignment | KDJ weak, bears in control (K: 28.1, D: 34.7) | Volume surged (2.7x)
════════════════════
🔔 Follow for first-hand market alerts 🔔
#多周期共振 #IOST #WLFI
📌 When trading, pay attention to whether the candlestick patterns align
Multi-timeframe confluence: $IOST / $WLFI weakening on the 30-minute chart, 4-hour bearish trend confirmed🔥
════════════════════
🟢 $IOST 30-minute bearish signal
⚠️Technical analysis: 4-hour bearish confluence confirmed | 30-minute entry: MACD bearish, trend weak, momentum strengthening | EMA5 < EMA8 < EMA13, bearish alignment | Volume increased (1.8x)
════════════════════
🟢 $WLFI 30-minute bearish signal
⚠️Technical analysis: 4-hour bearish confluence confirmed | 30-minute entry: MACD bearish cross below zero, bearish momentum accelerating | EMA5 < EMA8 < EMA13, bearish alignment | KDJ weak, bears in control (K: 28.1, D: 34.7) | Volume surged (2.7x)
════════════════════
🔔 Follow for first-hand market alerts 🔔
#多周期共振 #IOST #WLFI
📌 When trading, pay attention to whether the candlestick patterns align
════════════════════
🟢 $IOST 30-minute bearish signal
⚠️Technical analysis: 4-hour bearish confluence confirmed | 30-minute entry: MACD bearish, trend weak, momentum strengthening | EMA5 < EMA8 < EMA13, bearish alignment | Volume increased (1.8x)
════════════════════
🟢 $WLFI 30-minute bearish signal
⚠️Technical analysis: 4-hour bearish confluence confirmed | 30-minute entry: MACD bearish cross below zero, bearish momentum accelerating | EMA5 < EMA8 < EMA13, bearish alignment | KDJ weak, bears in control (K: 28.1, D: 34.7) | Volume surged (2.7x)
════════════════════
🔔 Follow for first-hand market alerts 🔔
#多周期共振 #IOST #WLFI
📌 When trading, pay attention to whether the candlestick patterns align
22

·
--
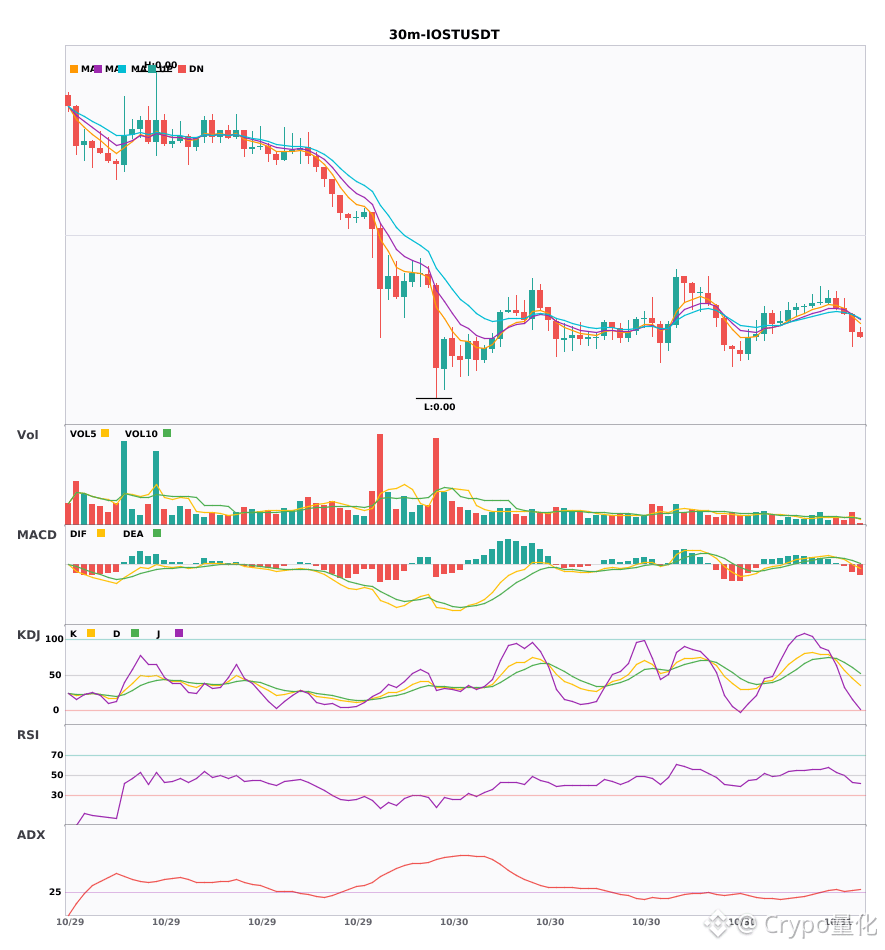
3 30-minute bearish alerts: $Bull Comes / $STRC / $IOST🔥
════════════════════
🟢 $Bull Comes 30-minute bearish signal
⚠️Technical analysis: ADX(25) Trend is forming; entry is possible | MACD is bearish, trend is weak, momentum is strengthening | EMA5 < EMA8 < EMA13, bearish alignment | Volume increase (1.6x)
════════════════════
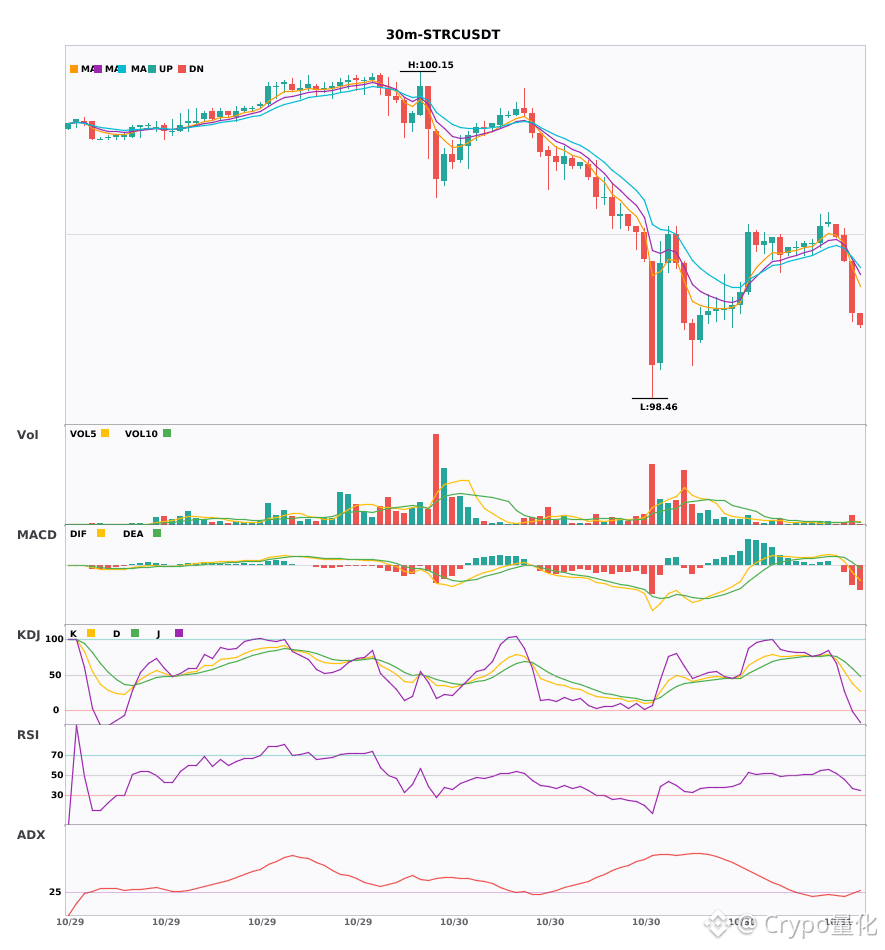
🟢 $STRC 30-minute bearish signal
⚠️Technical analysis: ADX(26) Trend is forming; entry is possible | MACD DIF fell below zero, trend turned bearish | EMA5 crossed below EMA8, short-term trend turned bearish | Volume surge (3.1x)
════════════════════
🟢 $IOST 30-minute bearish signal
⚠️Technical analysis: ADX(31) Clear trending market | MACD DIF fell below zero, trend turned bearish | EMA5 crossed below EMA8, short-term trend turned bearish | Volume increase (1.8x)
════════════════════
🔔 Follow for first-hand market alerts 🔔
#技术分析 #牛来 #STRC #IOST
📌 When trading, pay attention to whether the candlestick pattern confirms the signal
3 30-minute bearish alerts: $Bull Comes / $STRC / $IOST 🔥
════════════════════
🟢 $Bull Comes 30-minute bearish signal
⚠️Technical analysis: ADX(25) Trend is forming; entry is possible | MACD is bearish, trend is weak, momentum is strengthening | EMA5 < EMA8 < EMA13, bearish alignment | Volume increase (1.6x)
════════════════════
🟢 $STRC 30-minute bearish signal
⚠️Technical analysis: ADX(26) Trend is forming; entry is possible | MACD DIF fell below zero, trend turned bearish | EMA5 crossed below EMA8, short-term trend turned bearish | Volume surge (3.1x)
════════════════════
🟢 $IOST 30-minute bearish signal
⚠️Technical analysis: ADX(31) Clear trending market | MACD DIF fell below zero, trend turned bearish | EMA5 crossed below EMA8, short-term trend turned bearish | Volume increase (1.8x)
════════════════════
🔔 Follow for first-hand market alerts 🔔
#技术分析 #牛来 #STRC #IOST
📌 When trading, pay attention to whether the candlestick pattern confirms the signal
════════════════════
🟢 $Bull Comes 30-minute bearish signal
⚠️Technical analysis: ADX(25) Trend is forming; entry is possible | MACD is bearish, trend is weak, momentum is strengthening | EMA5 < EMA8 < EMA13, bearish alignment | Volume increase (1.6x)
════════════════════
🟢 $STRC 30-minute bearish signal
⚠️Technical analysis: ADX(26) Trend is forming; entry is possible | MACD DIF fell below zero, trend turned bearish | EMA5 crossed below EMA8, short-term trend turned bearish | Volume surge (3.1x)
════════════════════
🟢 $IOST 30-minute bearish signal
⚠️Technical analysis: ADX(31) Clear trending market | MACD DIF fell below zero, trend turned bearish | EMA5 crossed below EMA8, short-term trend turned bearish | Volume increase (1.8x)
════════════════════
🔔 Follow for first-hand market alerts 🔔
#技术分析 #牛来 #STRC #IOST
📌 When trading, pay attention to whether the candlestick pattern confirms the signal
28
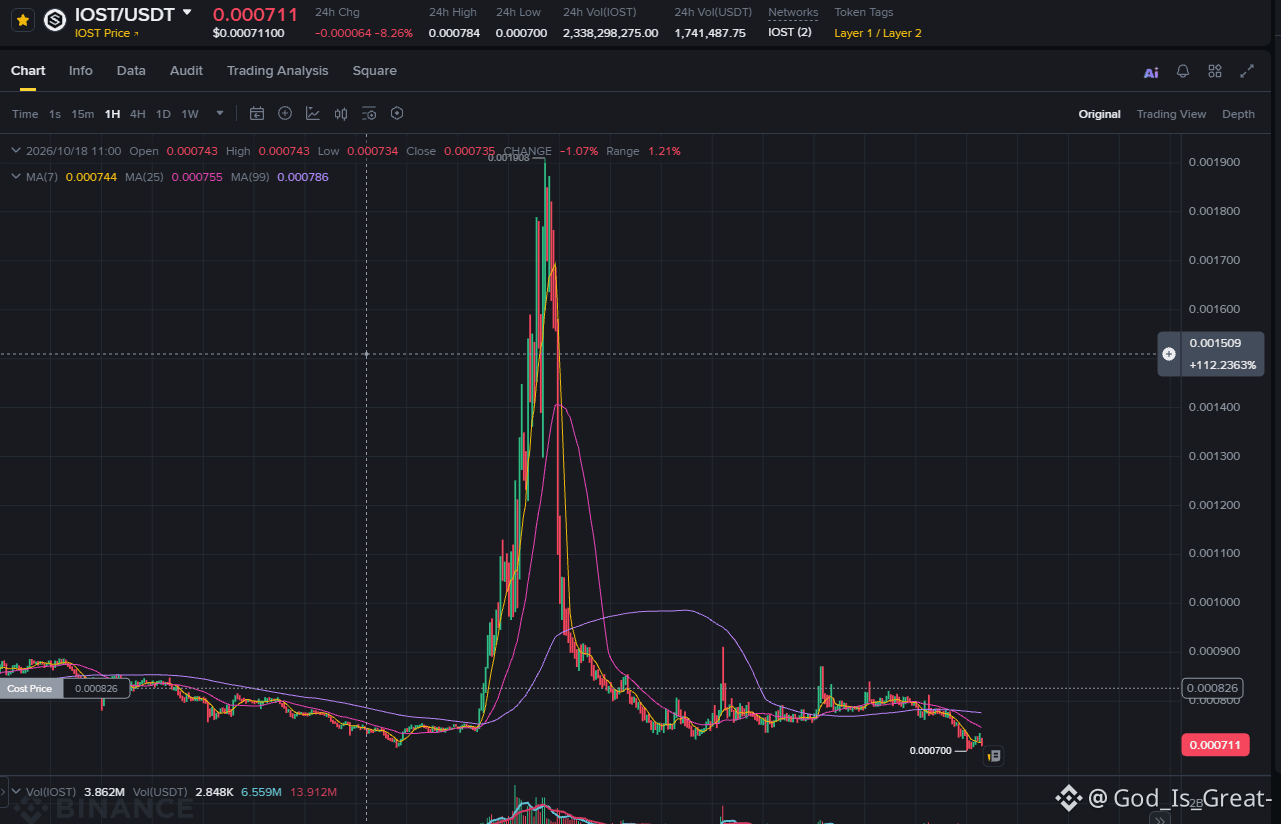
$IOST has experienced a sharp price drop recently, but traders are watching closely for a possible recovery and bullish breakout.
Are you ready for the next big $IOST move? 👀
Can IOST make a strong comeback?
#EarningsSeason #IOST
{spot}(IOSTUSDT)
$IOST has experienced a sharp price drop recently, but traders are watching closely for a possible recovery and bullish breakout.
Are you ready for the next big $IOST move? 👀
Can IOST make a strong comeback?
#EarningsSeason #IOST
Are you ready for the next big $IOST move? 👀
Can IOST make a strong comeback?
#EarningsSeason #IOST
763
Log in to explore more content
Join global crypto users on Binance Square
⚡️ Get latest and useful information about crypto.
💬 Trusted by the world’s largest crypto exchange.
👍 Discover real insights from verified creators.
Email / Phone number
Trending Topics
1
#BitcoinRebounds$75KAsChipsLead
3,981 views
91 Discussing
2
#JobsReportRaisesHikeOdds
73,956 views
814 Discussing
3
#US Data Center Rules May Constrain AI Expansion
8,711 views
89 Discussing
4
#$2TWipedOutHedgeFundsFaceLiquidation
10,683 views
94 Discussing
5
#WillAnthropicListOnTime
8,250 views
214 Discussing
6
#USNovemberMichiganExpectationsIndexPrelimAt50.9
16,260 views
320 Discussing
7
#OilPlungesBelow$100
17,446 views
37 Discussing
8
#TradFiForBeginners
10,052 views
202 Discussing
9
#USMidtermsCouldShakeUpUS-IranTies
34,392 views
486 Discussing
10
#RussianCentralBankNamesBTCETHUSDTForNonQualifiedInvestors
656 views
11 Discussing