
#ethbtc
ethbtc
699,604 views
857 Discussing
Hot
Latest

·
--
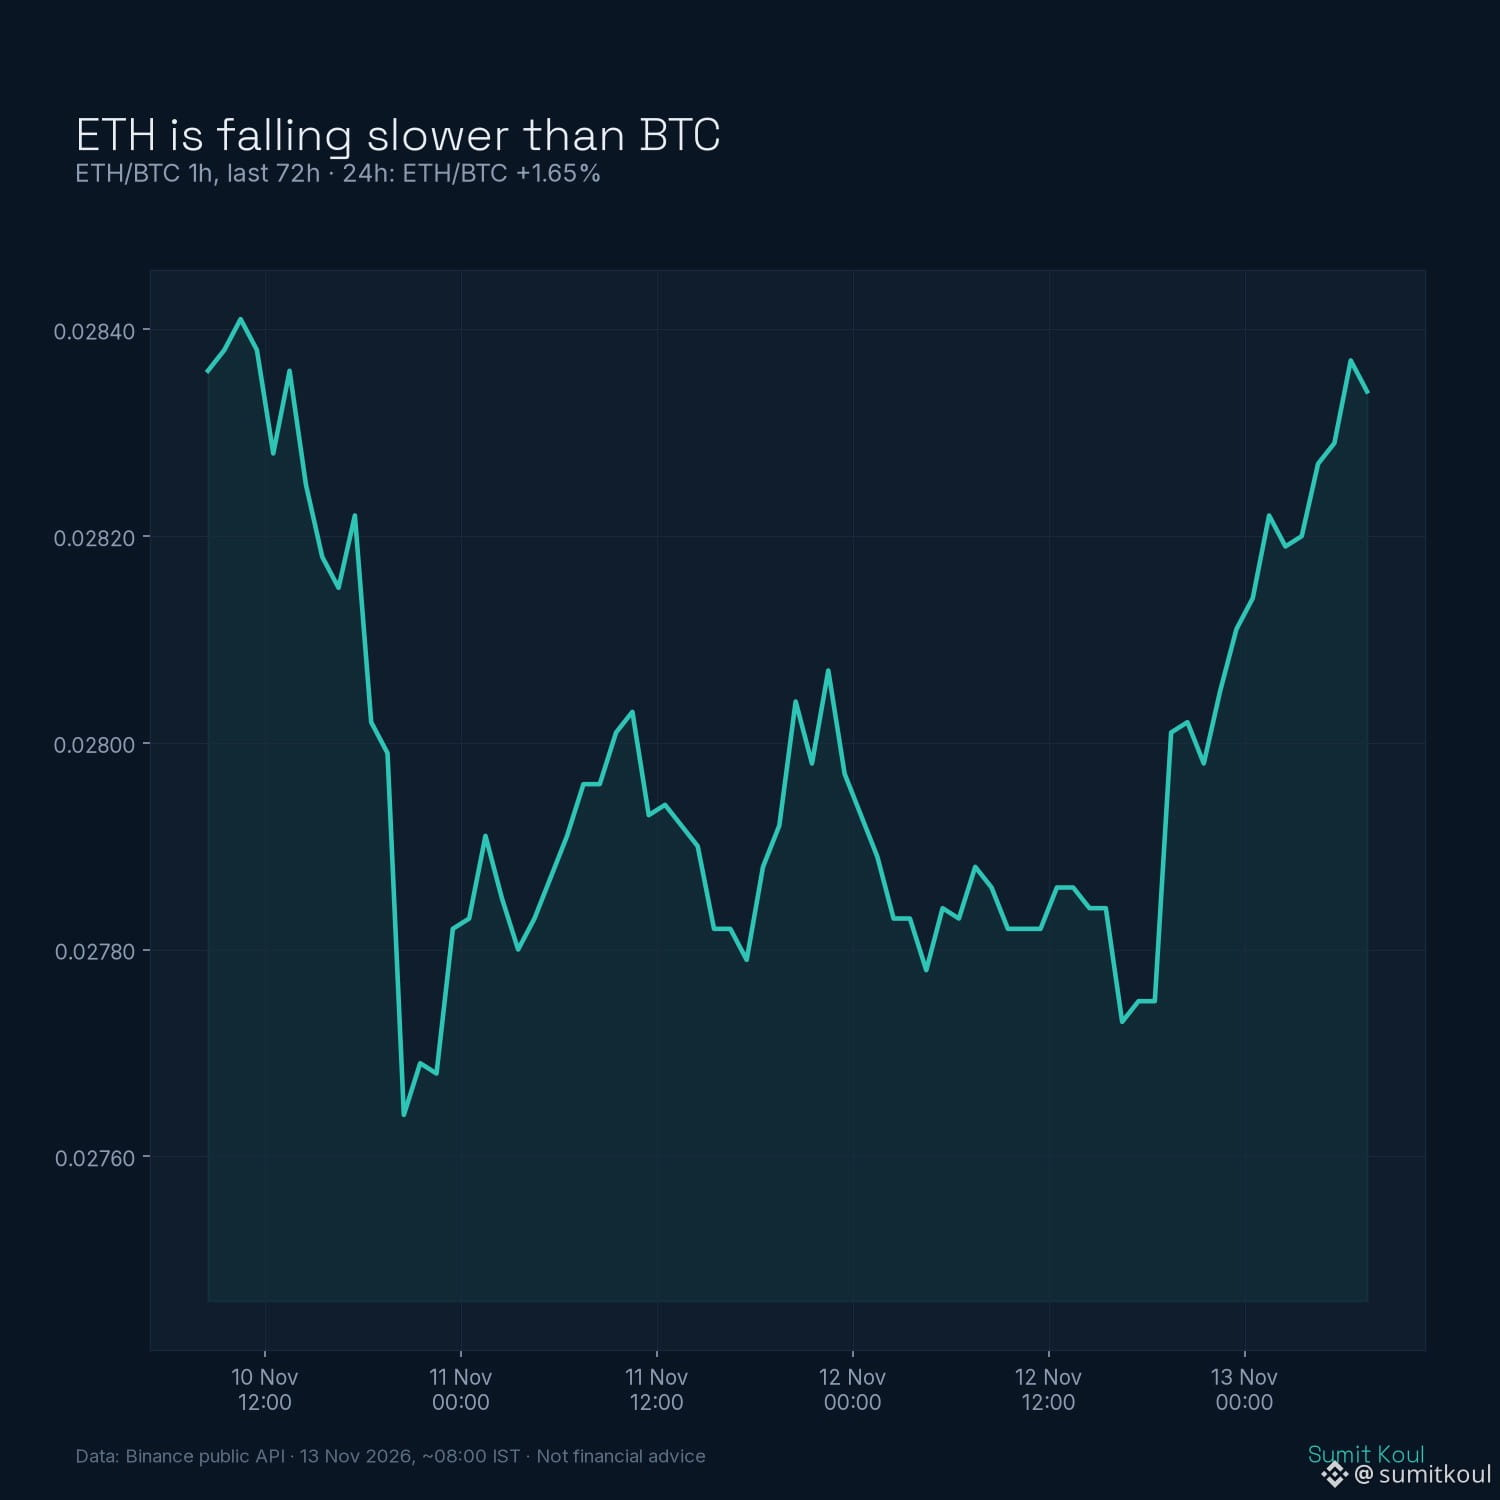
$ETH is falling slower than $BTC today.
ETH/BTC is +1.65% over 24h while BTC is -4.4%.
One reason: on-chain analyst Ember flagged 3 addresses (suspected Erik Voorhees-linked) buying 23,091 ETH for 47.36M USDT at an average of ~$2,051.
One wallet cluster is not a trend. But ETH is holding around 2,000 while BTC lost 71K. Worth watching if that relative strength holds into the weekend.
Not financial advice. DYOR.
#Ethereum #ETHBTC #Crypto
$ETH is falling slower than $BTC today.
ETH/BTC is +1.65% over 24h while BTC is -4.4%.
One reason: on-chain analyst Ember flagged 3 addresses (suspected Erik Voorhees-linked) buying 23,091 ETH for 47.36M USDT at an average of ~$2,051.
One wallet cluster is not a trend. But ETH is holding around 2,000 while BTC lost 71K. Worth watching if that relative strength holds into the weekend.
Not financial advice. DYOR.
#Ethereum #ETHBTC #Crypto
ETH/BTC is +1.65% over 24h while BTC is -4.4%.
One reason: on-chain analyst Ember flagged 3 addresses (suspected Erik Voorhees-linked) buying 23,091 ETH for 47.36M USDT at an average of ~$2,051.
One wallet cluster is not a trend. But ETH is holding around 2,000 while BTC lost 71K. Worth watching if that relative strength holds into the weekend.
Not financial advice. DYOR.
#Ethereum #ETHBTC #Crypto
39

🔥 ETHBTC - STRONG MOVE UP! 🔥
ETH is showing power against BTC 💪
Last Price: 0.028301
24h Change: +1.13% 📈
24h High: 0.028420
ETH has started beating BTC. A clear uptrend is visible on the chart, and the price is trading above MA60.
What do you think? Will ETH go higher, or will there be a correction from here?
Share your opinion in the comments 👇
#ETHBTC #binanc e #crypto #Ethereum✅ #Bitcoin #Trading #CryptoPakistan
🔥 ETHBTC - STRONG MOVE UP! 🔥
ETH is showing power against BTC 💪
Last Price: 0.028301
24h Change: +1.13% 📈
24h High: 0.028420
ETH has started beating BTC. A clear uptrend is visible on the chart, and the price is trading above MA60.
What do you think? Will ETH go higher, or will there be a correction from here?
Share your opinion in the comments 👇
#ETHBTC #binanc e #crypto #Ethereum✅ #Bitcoin #Trading #CryptoPakistan
ETH is showing power against BTC 💪
Last Price: 0.028301
24h Change: +1.13% 📈
24h High: 0.028420
ETH has started beating BTC. A clear uptrend is visible on the chart, and the price is trading above MA60.
What do you think? Will ETH go higher, or will there be a correction from here?
Share your opinion in the comments 👇
#ETHBTC #binanc e #crypto #Ethereum✅ #Bitcoin #Trading #CryptoPakistan
66

·
--
🎯ETH/BTC exchange rate at 0.028, back to the previous bear market
📰Bitcoin dominance has hit 59%. ETH is at $1,910, with an exchange rate of 0.0281 against BTC. SOL is at $78, down 5.3%; ZEC is at $917. Only HYPE is still holding up.
💬Honestly, this isn’t alt season—it’s a major asset sell-off. Money is flowing to the biggest player. Small-cap bounces are only worth buying and selling the same day. Don’t get attached.
🏷️ #以太坊 #比特币市占 #山寨币 #ETHBTC
🎯ETH/BTC exchange rate at 0.028, back to the previous bear market
📰Bitcoin dominance has hit 59%. ETH is at $1,910, with an exchange rate of 0.0281 against BTC. SOL is at $78, down 5.3%; ZEC is at $917. Only HYPE is still holding up.
💬Honestly, this isn’t alt season—it’s a major asset sell-off. Money is flowing to the biggest player. Small-cap bounces are only worth buying and selling the same day. Don’t get attached.
🏷️ #以太坊 #比特币市占 #山寨币 #ETHBTC
📰Bitcoin dominance has hit 59%. ETH is at $1,910, with an exchange rate of 0.0281 against BTC. SOL is at $78, down 5.3%; ZEC is at $917. Only HYPE is still holding up.
💬Honestly, this isn’t alt season—it’s a major asset sell-off. Money is flowing to the biggest player. Small-cap bounces are only worth buying and selling the same day. Don’t get attached.
🏷️ #以太坊 #比特币市占 #山寨币 #ETHBTC
1k
·
--
🎯 ETH falls below $2,000, nearly twice as hard as BTC
📰 ETH is now at $2,000, down 14.5% in seven days and 20.5% in a month, with barely a decent bounce along the way. Over the same periods, BTC is down just 8.6% and 14.4%, while the ETH/BTC exchange rate keeps sliding.
💬 Honestly, this ratio is the real signal. When the broader market falls, ETH falls harder; when it rebounds, ETH can’t keep up. Altseason money has clearly been pulling out first. If ETH can’t hold above $2,000, it may be time for someone else to tell the story.
🏷️ #ETH #以太坊 #ETHBTC #Altseason
🎯 ETH falls below $2,000, nearly twice as hard as BTC
📰 ETH is now at $2,000, down 14.5% in seven days and 20.5% in a month, with barely a decent bounce along the way. Over the same periods, BTC is down just 8.6% and 14.4%, while the ETH/BTC exchange rate keeps sliding.
💬 Honestly, this ratio is the real signal. When the broader market falls, ETH falls harder; when it rebounds, ETH can’t keep up. Altseason money has clearly been pulling out first. If ETH can’t hold above $2,000, it may be time for someone else to tell the story.
🏷️ #ETH #以太坊 #ETHBTC #Altseason
📰 ETH is now at $2,000, down 14.5% in seven days and 20.5% in a month, with barely a decent bounce along the way. Over the same periods, BTC is down just 8.6% and 14.4%, while the ETH/BTC exchange rate keeps sliding.
💬 Honestly, this ratio is the real signal. When the broader market falls, ETH falls harder; when it rebounds, ETH can’t keep up. Altseason money has clearly been pulling out first. If ETH can’t hold above $2,000, it may be time for someone else to tell the story.
🏷️ #ETH #以太坊 #ETHBTC #Altseason
1
·
--
🎯 ETH/BTC plunged to 0.0278, a four-year low—and there seems to be no floor
📰 ETH is down 58.7% from its peak, while BTC is down just 41.8%. Over the past 30 days, they’ve fallen 18.6% versus 12%—that’s a brutal gap.
💬 Honestly, this is no longer just following the market down; capital is clearly picking sides. The fear index is at 25. For ETH to turn things around, it needs a new narrative. There’s no point rushing.
🏷️ #ETHBTC #以太坊 #恐慌贪婪 #CapitalFlows
🎯 ETH/BTC plunged to 0.0278, a four-year low—and there seems to be no floor
📰 ETH is down 58.7% from its peak, while BTC is down just 41.8%. Over the past 30 days, they’ve fallen 18.6% versus 12%—that’s a brutal gap.
💬 Honestly, this is no longer just following the market down; capital is clearly picking sides. The fear index is at 25. For ETH to turn things around, it needs a new narrative. There’s no point rushing.
🏷️ #ETHBTC #以太坊 #恐慌贪婪 #CapitalFlows
📰 ETH is down 58.7% from its peak, while BTC is down just 41.8%. Over the past 30 days, they’ve fallen 18.6% versus 12%—that’s a brutal gap.
💬 Honestly, this is no longer just following the market down; capital is clearly picking sides. The fear index is at 25. For ETH to turn things around, it needs a new narrative. There’s no point rushing.
🏷️ #ETHBTC #以太坊 #恐慌贪婪 #CapitalFlows
4

·
--
ETH has fallen twice as much as BTC this time, but its two biggest sellers may have gone quiet at the same time
ETH is down about 14% in a week, while BTC is down only about 8%; at current prices, ETH/BTC is around 0.0279, its lowest since July 9.
ETH is currently around $2,082, below its 200-day moving average (about $2,154). Its November 10 close was the lowest since August 18.
But ETF selling suddenly stalled: there were net outflows totaling $983 million over the past 12 trading days, but on November 10, outflows were just $1.32 million for the day, compared with $184.5 million the day before.
Leverage has also been flushed out: ETH futures saw about $253 million in liquidations over 24 hours, including $193 million in long positions. Its liquidations exceeded BTC's, even though its open interest is only half the size of BTC's.
My take: ETH's weakness isn't due to a new problem. It's because the deleveraging this cycle has been concentrated in ETH, with ETF selling and long liquidations hitting it from both sides. Now both sides are close to running out of steam, yet the price is still below its moving average. That suggests the market just doesn't dare sell it down further—it still doesn't dare buy in.
The key isn't ETH's price in dollars, but ETH/BTC: Bitfinex's reversal confirmation level is 0.0298. Only a reclaim and hold above that level would count as a return of capital. It's now at 0.0279, still about 6% short of that level.
Watch three variables next: whether daily outflows from ETH ETFs can stay near zero or even turn positive; whether ETH/BTC can hold above 0.0298; and whether BTC will test $70,000. According to Bitfinex's estimates, if it really does fall that far, the median altcoin would drop another 8–10%, and ETH wouldn't escape either.
Is the ETH you hold among those flushed out in this round, or are you waiting for the ratio to get above 0.0298 before making a move?
$ETH $BTC
#以太坊 #ETHBTC #ETF资金流 #Deleveraging
The above is only a compilation of market information and does not constitute investment advice.
ETH has fallen twice as much as BTC this time, but its two biggest sellers may have gone quiet at the same time
ETH is down about 14% in a week, while BTC is down only about 8%; at current prices, ETH/BTC is around 0.0279, its lowest since July 9.
ETH is currently around $2,082, below its 200-day moving average (about $2,154). Its November 10 close was the lowest since August 18.
But ETF selling suddenly stalled: there were net outflows totaling $983 million over the past 12 trading days, but on November 10, outflows were just $1.32 million for the day, compared with $184.5 million the day before.
Leverage has also been flushed out: ETH futures saw about $253 million in liquidations over 24 hours, including $193 million in long positions. Its liquidations exceeded BTC's, even though its open interest is only half the size of BTC's.
My take: ETH's weakness isn't due to a new problem. It's because the deleveraging this cycle has been concentrated in ETH, with ETF selling and long liquidations hitting it from both sides. Now both sides are close to running out of steam, yet the price is still below its moving average. That suggests the market just doesn't dare sell it down further—it still doesn't dare buy in.
The key isn't ETH's price in dollars, but ETH/BTC: Bitfinex's reversal confirmation level is 0.0298. Only a reclaim and hold above that level would count as a return of capital. It's now at 0.0279, still about 6% short of that level.
Watch three variables next: whether daily outflows from ETH ETFs can stay near zero or even turn positive; whether ETH/BTC can hold above 0.0298; and whether BTC will test $70,000. According to Bitfinex's estimates, if it really does fall that far, the median altcoin would drop another 8–10%, and ETH wouldn't escape either.
Is the ETH you hold among those flushed out in this round, or are you waiting for the ratio to get above 0.0298 before making a move?
$ETH $BTC
#以太坊 #ETHBTC #ETF资金流 #Deleveraging
The above is only a compilation of market information and does not constitute investment advice.
ETH is down about 14% in a week, while BTC is down only about 8%; at current prices, ETH/BTC is around 0.0279, its lowest since July 9.
ETH is currently around $2,082, below its 200-day moving average (about $2,154). Its November 10 close was the lowest since August 18.
But ETF selling suddenly stalled: there were net outflows totaling $983 million over the past 12 trading days, but on November 10, outflows were just $1.32 million for the day, compared with $184.5 million the day before.
Leverage has also been flushed out: ETH futures saw about $253 million in liquidations over 24 hours, including $193 million in long positions. Its liquidations exceeded BTC's, even though its open interest is only half the size of BTC's.
My take: ETH's weakness isn't due to a new problem. It's because the deleveraging this cycle has been concentrated in ETH, with ETF selling and long liquidations hitting it from both sides. Now both sides are close to running out of steam, yet the price is still below its moving average. That suggests the market just doesn't dare sell it down further—it still doesn't dare buy in.
The key isn't ETH's price in dollars, but ETH/BTC: Bitfinex's reversal confirmation level is 0.0298. Only a reclaim and hold above that level would count as a return of capital. It's now at 0.0279, still about 6% short of that level.
Watch three variables next: whether daily outflows from ETH ETFs can stay near zero or even turn positive; whether ETH/BTC can hold above 0.0298; and whether BTC will test $70,000. According to Bitfinex's estimates, if it really does fall that far, the median altcoin would drop another 8–10%, and ETH wouldn't escape either.
Is the ETH you hold among those flushed out in this round, or are you waiting for the ratio to get above 0.0298 before making a move?
$ETH $BTC
#以太坊 #ETHBTC #ETF资金流 #Deleveraging
The above is only a compilation of market information and does not constitute investment advice.
SunspotAlgo:
0.0279 到 0.0298 还差一段,ETF 流出就算翻正,比值也未必跟着回去(关注我,交易信号自动转发)
1
22

·
--
Ξ ETHEREUM — November 10, 2026
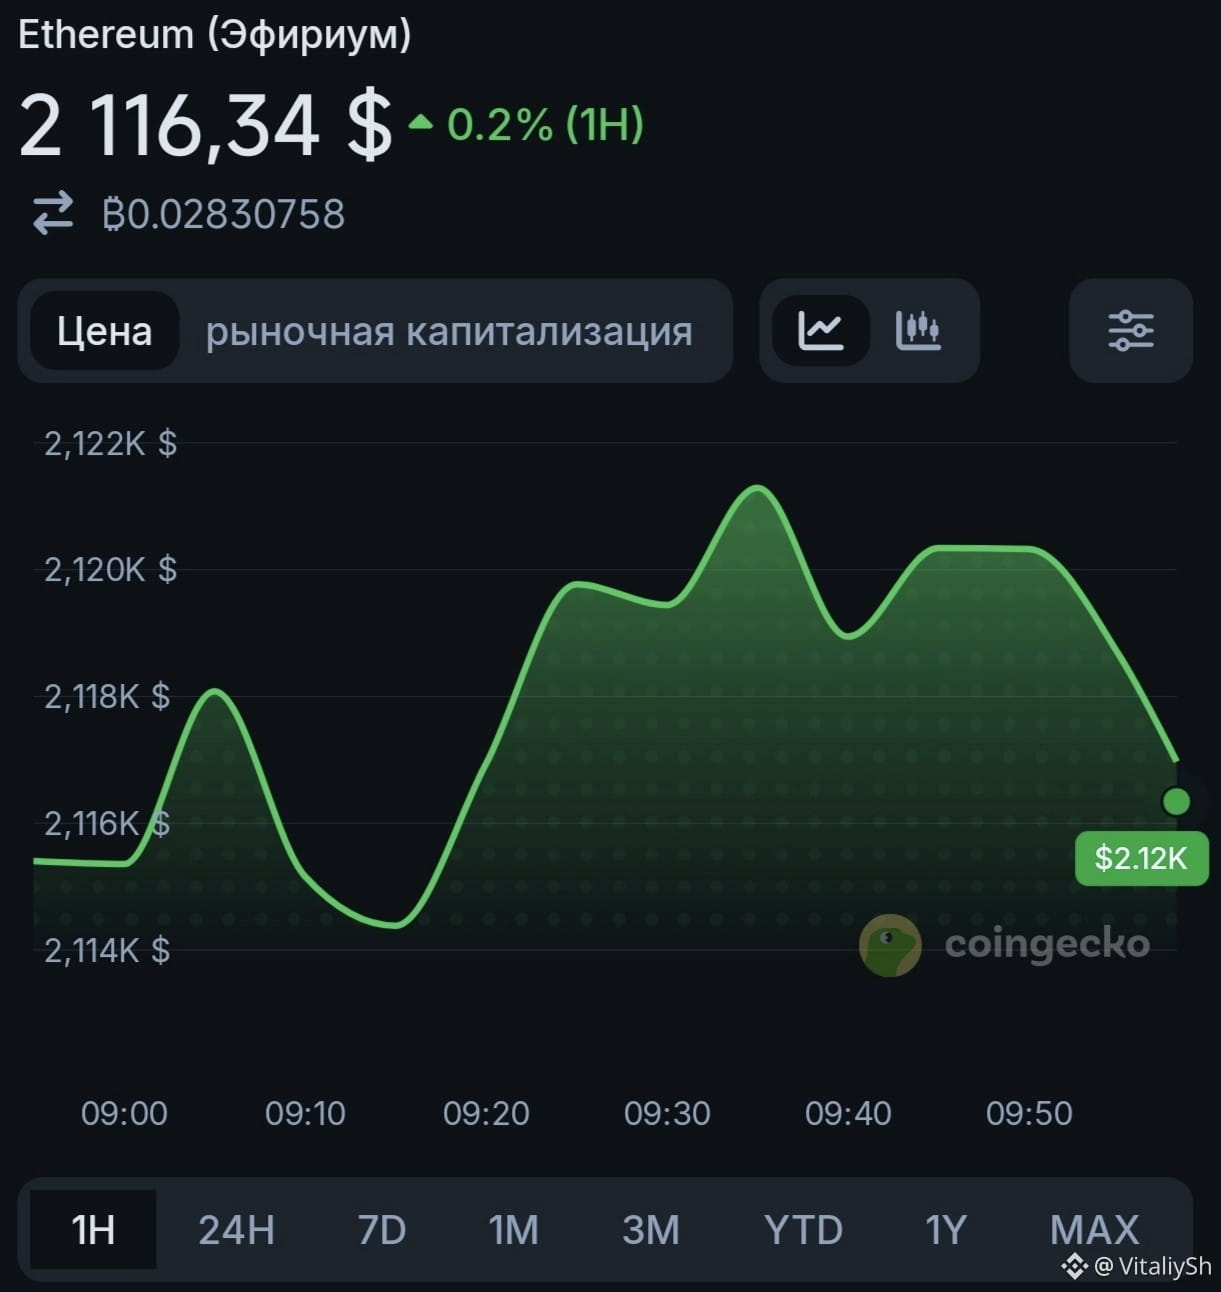
📍 Price: ~$2,120–2,140 (−4.4% in 24 hours, low of $2,065)
📉 ETH weaker than BTC: ETH/BTC fell to 0.0283 (lowest since July), down 5.8% for the week
📊 WHAT MATTERS
• ETH ETFs: $184.6 million in outflows on November 9 — third consecutive day; ETHA (BlackRock) −$119.3 million
• Ethereum Foundation sold 1,000 ETH ($2.13 million) — 14 days after its previous sale
• 24-hour liquidations: $507 million in ETH longs — the largest volume among all assets
• US CPI today at 21:30 Kyiv time — the main catalyst
⚖️ LEVELS
🟢 Support: $2,110–2,115 → $2,065 → $2,021 ($866 million in longs)
🔴 Resistance: $2,233 ($780 million in shorts) → $2,350–2,385
💬 SENTIMENT
RSI ~30 — oversold territory, but the trend remains bearish. A break above $2,233 could trigger a short squeeze involving $780 million; a drop below $2,021 could lead to a cascade of long liquidations totaling $866 million. CPI will determine the direction.
⚠️ RISKS
• Higher-than-expected CPI — ETH could break below $2,021
• ETF outflows for 3 consecutive days — institutions are not returning
• ETH/BTC at its lowest since July — capital is flowing into BTC
• $866 million in long liquidations are waiting below $2,021
⚠️ Not financial advice. The crypto market carries high risk.
#Ethereum #ETH #Crypto #MarketAnalysis #ETF #BlackRock #CPI #Liquidations #ETHBTC $ETH
Ξ ETHEREUM — November 10, 2026
📍 Price: ~$2,120–2,140 (−4.4% in 24 hours, low of $2,065)
📉 ETH weaker than BTC: ETH/BTC fell to 0.0283 (lowest since July), down 5.8% for the week
📊 WHAT MATTERS
• ETH ETFs: $184.6 million in outflows on November 9 — third consecutive day; ETHA (BlackRock) −$119.3 million
• Ethereum Foundation sold 1,000 ETH ($2.13 million) — 14 days after its previous sale
• 24-hour liquidations: $507 million in ETH longs — the largest volume among all assets
• US CPI today at 21:30 Kyiv time — the main catalyst
⚖️ LEVELS
🟢 Support: $2,110–2,115 → $2,065 → $2,021 ($866 million in longs)
🔴 Resistance: $2,233 ($780 million in shorts) → $2,350–2,385
💬 SENTIMENT
RSI ~30 — oversold territory, but the trend remains bearish. A break above $2,233 could trigger a short squeeze involving $780 million; a drop below $2,021 could lead to a cascade of long liquidations totaling $866 million. CPI will determine the direction.
⚠️ RISKS
• Higher-than-expected CPI — ETH could break below $2,021
• ETF outflows for 3 consecutive days — institutions are not returning
• ETH/BTC at its lowest since July — capital is flowing into BTC
• $866 million in long liquidations are waiting below $2,021
⚠️ Not financial advice. The crypto market carries high risk.
#Ethereum #ETH #Crypto #MarketAnalysis #ETF #BlackRock #CPI #Liquidations #ETHBTC $ETH
📍 Price: ~$2,120–2,140 (−4.4% in 24 hours, low of $2,065)
📉 ETH weaker than BTC: ETH/BTC fell to 0.0283 (lowest since July), down 5.8% for the week
📊 WHAT MATTERS
• ETH ETFs: $184.6 million in outflows on November 9 — third consecutive day; ETHA (BlackRock) −$119.3 million
• Ethereum Foundation sold 1,000 ETH ($2.13 million) — 14 days after its previous sale
• 24-hour liquidations: $507 million in ETH longs — the largest volume among all assets
• US CPI today at 21:30 Kyiv time — the main catalyst
⚖️ LEVELS
🟢 Support: $2,110–2,115 → $2,065 → $2,021 ($866 million in longs)
🔴 Resistance: $2,233 ($780 million in shorts) → $2,350–2,385
💬 SENTIMENT
RSI ~30 — oversold territory, but the trend remains bearish. A break above $2,233 could trigger a short squeeze involving $780 million; a drop below $2,021 could lead to a cascade of long liquidations totaling $866 million. CPI will determine the direction.
⚠️ RISKS
• Higher-than-expected CPI — ETH could break below $2,021
• ETF outflows for 3 consecutive days — institutions are not returning
• ETH/BTC at its lowest since July — capital is flowing into BTC
• $866 million in long liquidations are waiting below $2,021
⚠️ Not financial advice. The crypto market carries high risk.
#Ethereum #ETH #Crypto #MarketAnalysis #ETF #BlackRock #CPI #Liquidations #ETHBTC $ETH
1
629
·
--
🎯 ETH got slashed by $750 overnight, harder than BTC
📰 ETH fell 5.2% in 24 hours to $2,121, while BTC slipped just 1.4% to $74.8K. ETH was already down 7% last week and is down 15% over the past 30 days.
💬 Honestly, the market is already splitting into tiers. BTC has a cushion of 850,000 coins held by big players, while ETH is running naked. This thing is falling more like an altcoin than the altcoins themselves.
🏷️ #ETH #ETHBTC #山寨季 #RiskAssets
🎯 ETH got slashed by $750 overnight, harder than BTC
📰 ETH fell 5.2% in 24 hours to $2,121, while BTC slipped just 1.4% to $74.8K. ETH was already down 7% last week and is down 15% over the past 30 days.
💬 Honestly, the market is already splitting into tiers. BTC has a cushion of 850,000 coins held by big players, while ETH is running naked. This thing is falling more like an altcoin than the altcoins themselves.
🏷️ #ETH #ETHBTC #山寨季 #RiskAssets
📰 ETH fell 5.2% in 24 hours to $2,121, while BTC slipped just 1.4% to $74.8K. ETH was already down 7% last week and is down 15% over the past 30 days.
💬 Honestly, the market is already splitting into tiers. BTC has a cushion of 850,000 coins held by big players, while ETH is running naked. This thing is falling more like an altcoin than the altcoins themselves.
🏷️ #ETH #ETHBTC #山寨季 #RiskAssets
142

·
--
An address tagged as a Drift hacker (0x45d…c00ca) put up $20 million in $ETH shorts and $BTC longs, both with 20x leverage, and was up $658,000 a day later.
This wasn’t money made by betting on the right direction. One side short and one side long, with equal leverage, made the positions themselves close to neutral. According to Ai Yi’s monitoring, both coins plunged at 6 a.m. Beijing time on November 9, then BTC rebounded more strongly than ETH. The ETH/BTC exchange rate fell 3.56%, and the gains came from relative strength.
At 20x leverage, the real risk is also in the exchange rate: betting that ETH will underperform BTC works in your favor during a downturn; but if BTC leads a rally and ETH follows, those paper gains can disappear just as quickly. Now it remains to be seen whether ETH/BTC can hold on to this morning’s decline.
#ETHBTC #链上数据 #Drift
An address tagged as a Drift hacker (0x45d…c00ca) put up $20 million in $ETH shorts and $BTC longs, both with 20x leverage, and was up $658,000 a day later.
This wasn’t money made by betting on the right direction. One side short and one side long, with equal leverage, made the positions themselves close to neutral. According to Ai Yi’s monitoring, both coins plunged at 6 a.m. Beijing time on November 9, then BTC rebounded more strongly than ETH. The ETH/BTC exchange rate fell 3.56%, and the gains came from relative strength.
At 20x leverage, the real risk is also in the exchange rate: betting that ETH will underperform BTC works in your favor during a downturn; but if BTC leads a rally and ETH follows, those paper gains can disappear just as quickly. Now it remains to be seen whether ETH/BTC can hold on to this morning’s decline.
#ETHBTC #链上数据 #Drift
This wasn’t money made by betting on the right direction. One side short and one side long, with equal leverage, made the positions themselves close to neutral. According to Ai Yi’s monitoring, both coins plunged at 6 a.m. Beijing time on November 9, then BTC rebounded more strongly than ETH. The ETH/BTC exchange rate fell 3.56%, and the gains came from relative strength.
At 20x leverage, the real risk is also in the exchange rate: betting that ETH will underperform BTC works in your favor during a downturn; but if BTC leads a rally and ETH follows, those paper gains can disappear just as quickly. Now it remains to be seen whether ETH/BTC can hold on to this morning’s decline.
#ETHBTC #链上数据 #Drift
7
·
--
🎯 ETH/BTC is stuck at 0.029; ETH hasn’t caught up this time
📰 ETH is at $2,228, down just 1.7% in seven days and outperforming BTC’s 3% drop. But its ratio against BTC is still stuck at 0.029, a long way from last cycle’s 0.033
💬 Bitcoin is moving sideways, while ETH has fallen less, which shows that selling pressure is indeed easing. Wait for the ratio to break above 0.030 before talking about a rebound. For now, the best you can say is that it hasn’t crashed; a trend reversal is still a long way off
🏷️ #ETHBTC #ETH #汇率 #catch-up rally
🎯 ETH/BTC is stuck at 0.029; ETH hasn’t caught up this time
📰 ETH is at $2,228, down just 1.7% in seven days and outperforming BTC’s 3% drop. But its ratio against BTC is still stuck at 0.029, a long way from last cycle’s 0.033
💬 Bitcoin is moving sideways, while ETH has fallen less, which shows that selling pressure is indeed easing. Wait for the ratio to break above 0.030 before talking about a rebound. For now, the best you can say is that it hasn’t crashed; a trend reversal is still a long way off
🏷️ #ETHBTC #ETH #汇率 #catch-up rally
📰 ETH is at $2,228, down just 1.7% in seven days and outperforming BTC’s 3% drop. But its ratio against BTC is still stuck at 0.029, a long way from last cycle’s 0.033
💬 Bitcoin is moving sideways, while ETH has fallen less, which shows that selling pressure is indeed easing. Wait for the ratio to break above 0.030 before talking about a rebound. For now, the best you can say is that it hasn’t crashed; a trend reversal is still a long way off
🏷️ #ETHBTC #ETH #汇率 #catch-up rally
5

·
--
Article
ETH Fell 7% Today. Against Bitcoin, It's Still Winning the Week$ETH is down 7% in 24 hours, sitting near $2,264 after tagging $2,236. Ugly candle. But zoom out one level and look at ETH priced in bitcoin, and the picture changes: the ETH/BTC ratio is still up about 2.6% on the week.
That's the part most people miss on red days like this. When everything bleeds, the question isn't only "how much did ETH drop?" It's "did it drop more or less than the thing it competes with for capital?"
What the ratio is doing
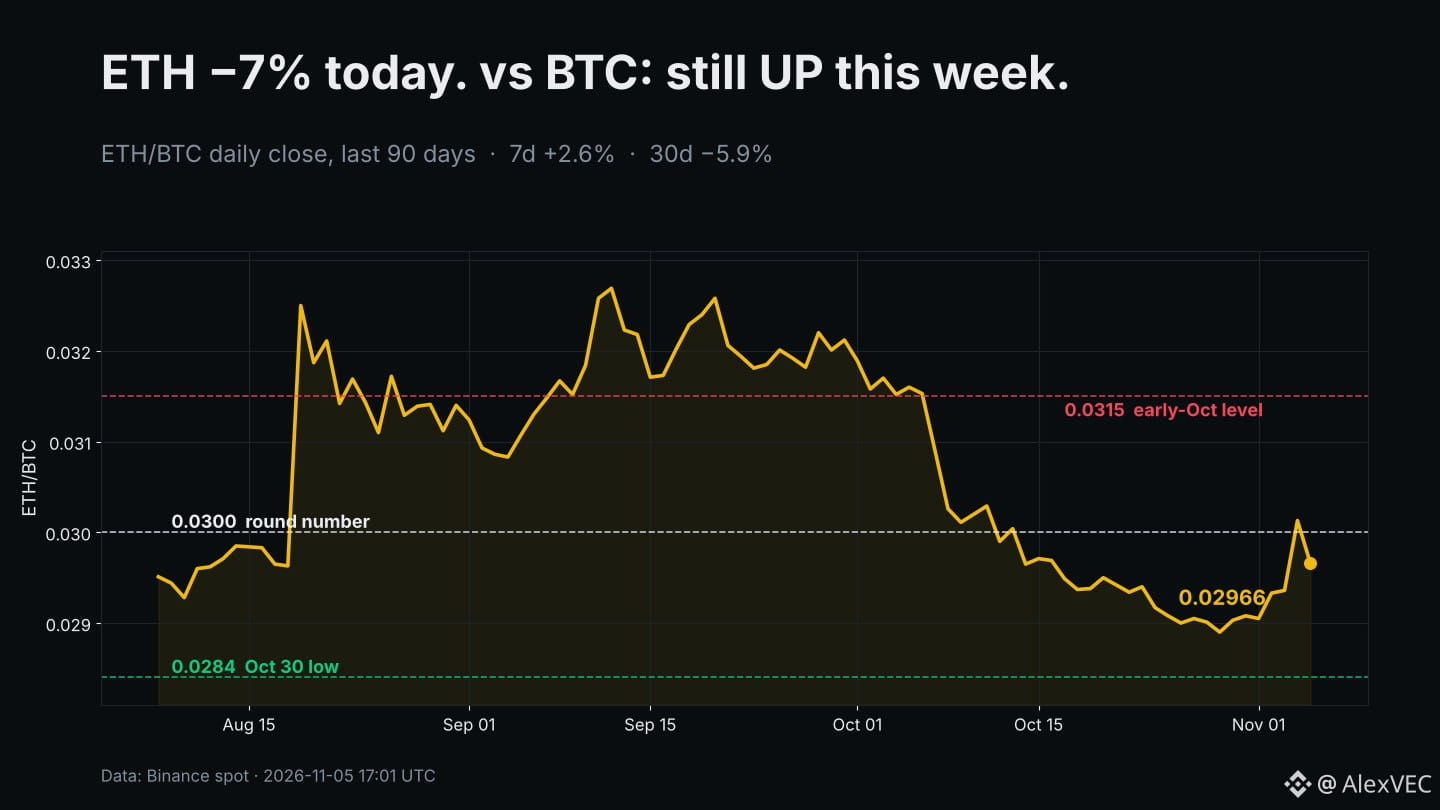
ETH/BTC is at 0.02966 on Binance spot. On Oct 30 it printed a low of 0.02835, the weakest level of the last three months. From there it climbed for five days and on Nov 4 closed at 0.03013, the first daily close back above 0.030 since mid-October. Today it gave back about 1.9%, but it's still holding above where it was a week ago (0.0289).
So the ratio pulled back today, yet the week-long bounce off the lows is still intact.
The bigger frame
Over 30 days the story is less friendly. ETH is down 16% in that window, while $BTC is down about 10.7%. That gap is exactly why the ratio is still 5.9% lower than a month ago. Early October it was hanging around 0.0315, then it broke down hard in a few sessions.
Over 90 days, though, the two are almost tied: ETH +18.2%, BTC +17.6%, ratio basically flat (+0.5%). In other words, ETH hasn't really lost the quarter to bitcoin. It lost October, and it's been clawing some of that back in November.
Three levels I'm watching on ETH/BTC
1. 0.0300. The round number it just reclaimed on a closing basis and lost again today. Getting back above it and holding would say the Oct 30 low was a real bottom for the ratio.
2. 0.0284. The Oct 30 low. If the ratio slides back there while BTC is also falling, that's the classic "alts get hit twice" scenario, and ETH would likely underperform any further market flush.
3. 0.0315. The early-October shelf. That's where the breakdown started, so it's the first area where sellers who got trapped may want out.
Why it matters even if you only trade dollars
The ratio tells you which side of the risk curve the market is leaning on. When ETH/BTC rises during a dip, money is rotating into ETH rather than fleeing it. When it falls during a dip, ETH tends to drop harder than BTC, and the bounce is weaker too.
Right now we're in a mixed state. In dollar terms both are red: BTC is down 5.2% to around $76,380 after trading as high as $80,962 in the last 24 hours, and ETH's 24h range was $2,236 to $2,444. In ratio terms, ETH is still ahead of where it started the week.
How I'd frame the next few days
If BTC stabilizes above today's low near $75,568 and ETH/BTC holds above 0.029, the November ratio bounce stays on track. If BTC keeps sliding and the ratio loses 0.0290, I'd expect ETH to lag on the way down and treat any bounce with more caution.
Neither outcome is guaranteed. Volatility is elevated, and a single macro headline can flip both charts in an hour. Size positions so a bad day like today doesn't force your hand.
What's your read: does ETH/BTC reclaim 0.030 this month, or retest the Oct 30 low first?
Not financial advice.
#ETHBTC #Ethereum #CryptoAnalysis
ETH Fell 7% Today. Against Bitcoin, It's Still Winning the Week
$ETH is down 7% in 24 hours, sitting near $2,264 after tagging $2,236. Ugly candle. But zoom out one level and look at ETH priced in bitcoin, and the picture changes: the ETH/BTC ratio is still up about 2.6% on the week.
That's the part most people miss on red days like this. When everything bleeds, the question isn't only "how much did ETH drop?" It's "did it drop more or less than the thing it competes with for capital?"
What the ratio is doing
ETH/BTC is at 0.02966 on Binance spot. On Oct 30 it printed a low of 0.02835, the weakest level of the last three months. From there it climbed for five days and on Nov 4 closed at 0.03013, the first daily close back above 0.030 since mid-October. Today it gave back about 1.9%, but it's still holding above where it was a week ago (0.0289).
So the ratio pulled back today, yet the week-long bounce off the lows is still intact.
The bigger frame
Over 30 days the story is less friendly. ETH is down 16% in that window, while $BTC is down about 10.7%. That gap is exactly why the ratio is still 5.9% lower than a month ago. Early October it was hanging around 0.0315, then it broke down hard in a few sessions.
Over 90 days, though, the two are almost tied: ETH +18.2%, BTC +17.6%, ratio basically flat (+0.5%). In other words, ETH hasn't really lost the quarter to bitcoin. It lost October, and it's been clawing some of that back in November.
Three levels I'm watching on ETH/BTC
1. 0.0300. The round number it just reclaimed on a closing basis and lost again today. Getting back above it and holding would say the Oct 30 low was a real bottom for the ratio.
2. 0.0284. The Oct 30 low. If the ratio slides back there while BTC is also falling, that's the classic "alts get hit twice" scenario, and ETH would likely underperform any further market flush.
3. 0.0315. The early-October shelf. That's where the breakdown started, so it's the first area where sellers who got trapped may want out.
Why it matters even if you only trade dollars
The ratio tells you which side of the risk curve the market is leaning on. When ETH/BTC rises during a dip, money is rotating into ETH rather than fleeing it. When it falls during a dip, ETH tends to drop harder than BTC, and the bounce is weaker too.
Right now we're in a mixed state. In dollar terms both are red: BTC is down 5.2% to around $76,380 after trading as high as $80,962 in the last 24 hours, and ETH's 24h range was $2,236 to $2,444. In ratio terms, ETH is still ahead of where it started the week.
How I'd frame the next few days
If BTC stabilizes above today's low near $75,568 and ETH/BTC holds above 0.029, the November ratio bounce stays on track. If BTC keeps sliding and the ratio loses 0.0290, I'd expect ETH to lag on the way down and treat any bounce with more caution.
Neither outcome is guaranteed. Volatility is elevated, and a single macro headline can flip both charts in an hour. Size positions so a bad day like today doesn't force your hand.
What's your read: does ETH/BTC reclaim 0.030 this month, or retest the Oct 30 low first?
Not financial advice.
#ETHBTC #Ethereum #CryptoAnalysis
That's the part most people miss on red days like this. When everything bleeds, the question isn't only "how much did ETH drop?" It's "did it drop more or less than the thing it competes with for capital?"
What the ratio is doing
ETH/BTC is at 0.02966 on Binance spot. On Oct 30 it printed a low of 0.02835, the weakest level of the last three months. From there it climbed for five days and on Nov 4 closed at 0.03013, the first daily close back above 0.030 since mid-October. Today it gave back about 1.9%, but it's still holding above where it was a week ago (0.0289).
So the ratio pulled back today, yet the week-long bounce off the lows is still intact.
The bigger frame
Over 30 days the story is less friendly. ETH is down 16% in that window, while $BTC is down about 10.7%. That gap is exactly why the ratio is still 5.9% lower than a month ago. Early October it was hanging around 0.0315, then it broke down hard in a few sessions.
Over 90 days, though, the two are almost tied: ETH +18.2%, BTC +17.6%, ratio basically flat (+0.5%). In other words, ETH hasn't really lost the quarter to bitcoin. It lost October, and it's been clawing some of that back in November.
Three levels I'm watching on ETH/BTC
1. 0.0300. The round number it just reclaimed on a closing basis and lost again today. Getting back above it and holding would say the Oct 30 low was a real bottom for the ratio.
2. 0.0284. The Oct 30 low. If the ratio slides back there while BTC is also falling, that's the classic "alts get hit twice" scenario, and ETH would likely underperform any further market flush.
3. 0.0315. The early-October shelf. That's where the breakdown started, so it's the first area where sellers who got trapped may want out.
Why it matters even if you only trade dollars
The ratio tells you which side of the risk curve the market is leaning on. When ETH/BTC rises during a dip, money is rotating into ETH rather than fleeing it. When it falls during a dip, ETH tends to drop harder than BTC, and the bounce is weaker too.
Right now we're in a mixed state. In dollar terms both are red: BTC is down 5.2% to around $76,380 after trading as high as $80,962 in the last 24 hours, and ETH's 24h range was $2,236 to $2,444. In ratio terms, ETH is still ahead of where it started the week.
How I'd frame the next few days
If BTC stabilizes above today's low near $75,568 and ETH/BTC holds above 0.029, the November ratio bounce stays on track. If BTC keeps sliding and the ratio loses 0.0290, I'd expect ETH to lag on the way down and treat any bounce with more caution.
Neither outcome is guaranteed. Volatility is elevated, and a single macro headline can flip both charts in an hour. Size positions so a bad day like today doesn't force your hand.
What's your read: does ETH/BTC reclaim 0.030 this month, or retest the Oct 30 low first?
Not financial advice.
#ETHBTC #Ethereum #CryptoAnalysis
13
·
--
Article
BTC Is Winning the Month. The Alts Are Only Fighting for the Week.Every few weeks the timeline declares "alt season is loading." So I pulled 30 days of Binance daily closes for seven majors and lined them up against $BTC. The scoreboard is not kind to the alts.
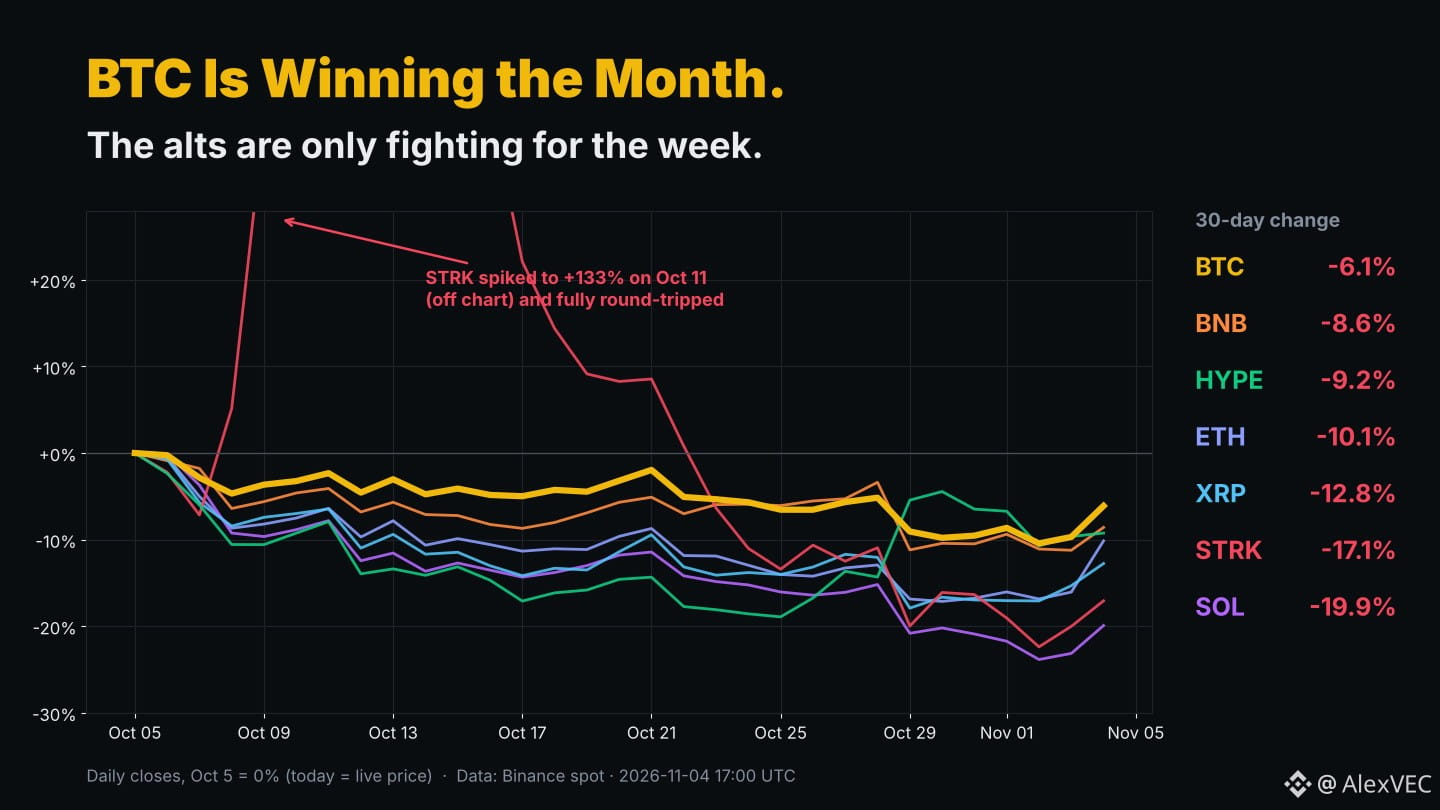
THE 30-DAY TABLE (Oct 5 close vs. live price)
BTC -6.1%
BNB -8.6%
HYPE -9.2%
ETH -10.1%
XRP -12.8%
STRK -17.1%
SOL -19.9%
Seven coins, one red month, and Bitcoin lost the least. That's the classic shape of a risk-off tape: when money gets nervous it hides in the deepest, most liquid asset, and everything further out the curve bleeds faster on the way down.
THE LAST 24 HOURS
BTC tagged $75,736 in the last day, its lowest print of the whole 30-day window, then bounced to around $80,530 (+3.6% on the day, roughly +6% off the low). The 30-day high sits at $86,999, so price is still about 7% below where it topped this month. A V off a monthly low is constructive, but one green day doesn't erase a month of lower highs.
WHERE THE ALTS ARE ACTUALLY WINNING
Zoom in to seven days and the picture shifts. ETH is +3.2% on the week and HYPE +5.9%, while BTC is about -1%. Today $ETH led the bounce at +5.9%, running from $2,226 to around $2,435.
The ETH/BTC ratio tells the same story in one number: 0.0316 a month ago, down to 0.0290 a week ago, now back near 0.0302. That's a real relative bounce, but it hasn't reclaimed the starting level. Alts are winning the sprint, BTC is still winning the race.
SOL is the other side of the trade: -5.6% on the week and nearly -20% on the month, the weakest large cap on this list. BNB (-5.4% weekly) and XRP (-0.8%) are mostly drifting with the market.
THE CAUTIONARY TALE: $STRK
If you want to know why BTC keeps winning these comparisons, look at STRK's chart. It went from a $0.0491 close on Oct 7 to a $0.1265 high on Oct 11, more than 2.5x in four days. On a closing basis it was +133% for the month at the peak. Today it trades around $0.0438, below where the run started and roughly 65% under that high.
That's the alt trade in a nutshell. The upside is fast and real, but if you don't take profit into the spike, the round trip can be just as fast. Small caps like STRK can move ±20% in a day with thin order books, so size accordingly.
WHAT WOULD CHANGE MY MIND
For a genuine rotation from BTC into alts, I'd want to see:
1. ETH/BTC holding above 0.030 and pushing back toward 0.0316, not just a one-day spike.
2. Alts outperforming on red BTC days, not only on green ones. Today every major except HYPE rallied together, which looks more like a broad relief bounce than rotation.
3. BTC building a base above the fresh monthly low near $75.7K. A weak leader rarely produces a healthy alt season.
THE TAKEAWAY
Over 30 days, the boring choice won. Over 7 days, ETH and HYPE are showing some relative strength worth watching. If you trade alts here, treat it as a short-term relative-strength play with a clear invalidation, not as the start of a new cycle until the ratios confirm it.
Are you rotating into alts on this bounce, or sitting tight in BTC until ETH/BTC proves itself?
Not financial advice.
#BTCvsAlts #CryptoMarket #ETHBTC
BTC Is Winning the Month. The Alts Are Only Fighting for the Week.
Every few weeks the timeline declares "alt season is loading." So I pulled 30 days of Binance daily closes for seven majors and lined them up against $BTC . The scoreboard is not kind to the alts.
THE 30-DAY TABLE (Oct 5 close vs. live price)
BTC -6.1%
BNB -8.6%
HYPE -9.2%
ETH -10.1%
XRP -12.8%
STRK -17.1%
SOL -19.9%
Seven coins, one red month, and Bitcoin lost the least. That's the classic shape of a risk-off tape: when money gets nervous it hides in the deepest, most liquid asset, and everything further out the curve bleeds faster on the way down.
THE LAST 24 HOURS
BTC tagged $75,736 in the last day, its lowest print of the whole 30-day window, then bounced to around $80,530 (+3.6% on the day, roughly +6% off the low). The 30-day high sits at $86,999, so price is still about 7% below where it topped this month. A V off a monthly low is constructive, but one green day doesn't erase a month of lower highs.
WHERE THE ALTS ARE ACTUALLY WINNING
Zoom in to seven days and the picture shifts. ETH is +3.2% on the week and HYPE +5.9%, while BTC is about -1%. Today $ETH led the bounce at +5.9%, running from $2,226 to around $2,435.
The ETH/BTC ratio tells the same story in one number: 0.0316 a month ago, down to 0.0290 a week ago, now back near 0.0302. That's a real relative bounce, but it hasn't reclaimed the starting level. Alts are winning the sprint, BTC is still winning the race.
SOL is the other side of the trade: -5.6% on the week and nearly -20% on the month, the weakest large cap on this list. BNB (-5.4% weekly) and XRP (-0.8%) are mostly drifting with the market.
THE CAUTIONARY TALE: $STRK
If you want to know why BTC keeps winning these comparisons, look at STRK's chart. It went from a $0.0491 close on Oct 7 to a $0.1265 high on Oct 11, more than 2.5x in four days. On a closing basis it was +133% for the month at the peak. Today it trades around $0.0438, below where the run started and roughly 65% under that high.
That's the alt trade in a nutshell. The upside is fast and real, but if you don't take profit into the spike, the round trip can be just as fast. Small caps like STRK can move ±20% in a day with thin order books, so size accordingly.
WHAT WOULD CHANGE MY MIND
For a genuine rotation from BTC into alts, I'd want to see:
1. ETH/BTC holding above 0.030 and pushing back toward 0.0316, not just a one-day spike.
2. Alts outperforming on red BTC days, not only on green ones. Today every major except HYPE rallied together, which looks more like a broad relief bounce than rotation.
3. BTC building a base above the fresh monthly low near $75.7K. A weak leader rarely produces a healthy alt season.
THE TAKEAWAY
Over 30 days, the boring choice won. Over 7 days, ETH and HYPE are showing some relative strength worth watching. If you trade alts here, treat it as a short-term relative-strength play with a clear invalidation, not as the start of a new cycle until the ratios confirm it.
Are you rotating into alts on this bounce, or sitting tight in BTC until ETH/BTC proves itself?
Not financial advice.
#BTCvsAlts #CryptoMarket #ETHBTC
THE 30-DAY TABLE (Oct 5 close vs. live price)
BTC -6.1%
BNB -8.6%
HYPE -9.2%
ETH -10.1%
XRP -12.8%
STRK -17.1%
SOL -19.9%
Seven coins, one red month, and Bitcoin lost the least. That's the classic shape of a risk-off tape: when money gets nervous it hides in the deepest, most liquid asset, and everything further out the curve bleeds faster on the way down.
THE LAST 24 HOURS
BTC tagged $75,736 in the last day, its lowest print of the whole 30-day window, then bounced to around $80,530 (+3.6% on the day, roughly +6% off the low). The 30-day high sits at $86,999, so price is still about 7% below where it topped this month. A V off a monthly low is constructive, but one green day doesn't erase a month of lower highs.
WHERE THE ALTS ARE ACTUALLY WINNING
Zoom in to seven days and the picture shifts. ETH is +3.2% on the week and HYPE +5.9%, while BTC is about -1%. Today $ETH led the bounce at +5.9%, running from $2,226 to around $2,435.
The ETH/BTC ratio tells the same story in one number: 0.0316 a month ago, down to 0.0290 a week ago, now back near 0.0302. That's a real relative bounce, but it hasn't reclaimed the starting level. Alts are winning the sprint, BTC is still winning the race.
SOL is the other side of the trade: -5.6% on the week and nearly -20% on the month, the weakest large cap on this list. BNB (-5.4% weekly) and XRP (-0.8%) are mostly drifting with the market.
THE CAUTIONARY TALE: $STRK
If you want to know why BTC keeps winning these comparisons, look at STRK's chart. It went from a $0.0491 close on Oct 7 to a $0.1265 high on Oct 11, more than 2.5x in four days. On a closing basis it was +133% for the month at the peak. Today it trades around $0.0438, below where the run started and roughly 65% under that high.
That's the alt trade in a nutshell. The upside is fast and real, but if you don't take profit into the spike, the round trip can be just as fast. Small caps like STRK can move ±20% in a day with thin order books, so size accordingly.
WHAT WOULD CHANGE MY MIND
For a genuine rotation from BTC into alts, I'd want to see:
1. ETH/BTC holding above 0.030 and pushing back toward 0.0316, not just a one-day spike.
2. Alts outperforming on red BTC days, not only on green ones. Today every major except HYPE rallied together, which looks more like a broad relief bounce than rotation.
3. BTC building a base above the fresh monthly low near $75.7K. A weak leader rarely produces a healthy alt season.
THE TAKEAWAY
Over 30 days, the boring choice won. Over 7 days, ETH and HYPE are showing some relative strength worth watching. If you trade alts here, treat it as a short-term relative-strength play with a clear invalidation, not as the start of a new cycle until the ratios confirm it.
Are you rotating into alts on this bounce, or sitting tight in BTC until ETH/BTC proves itself?
Not financial advice.
#BTCvsAlts #CryptoMarket #ETHBTC
10

·
--
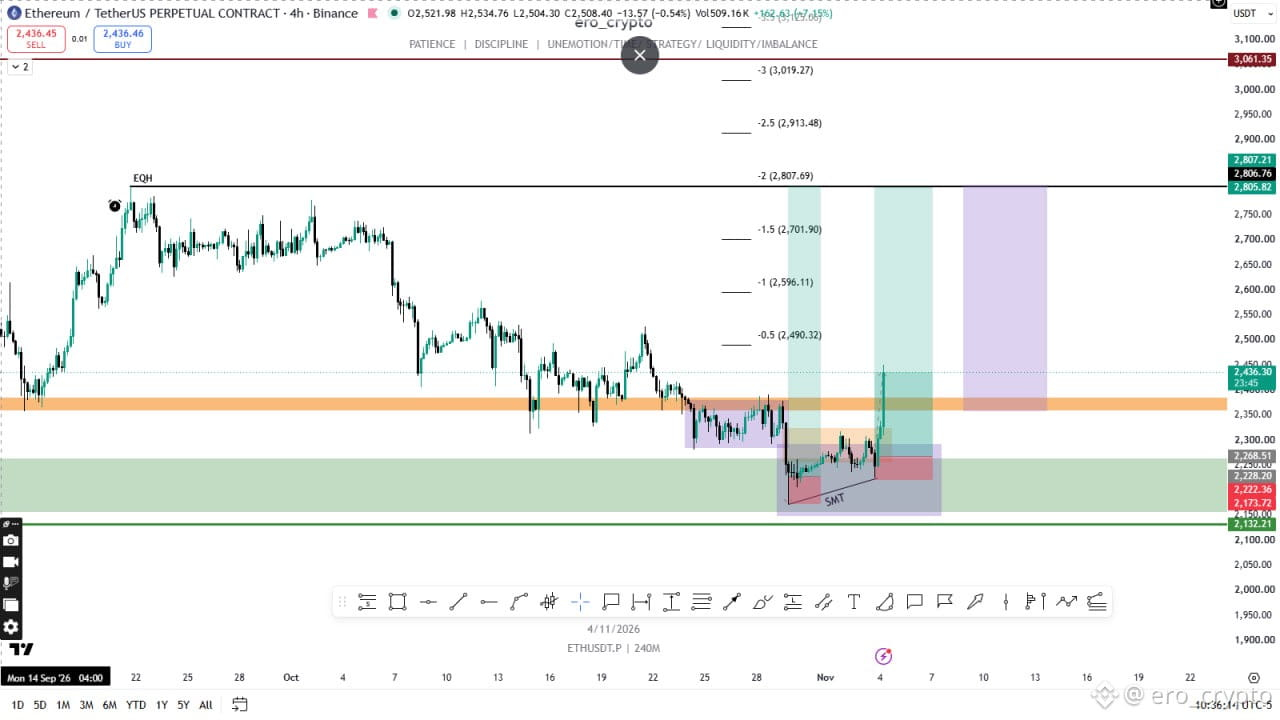
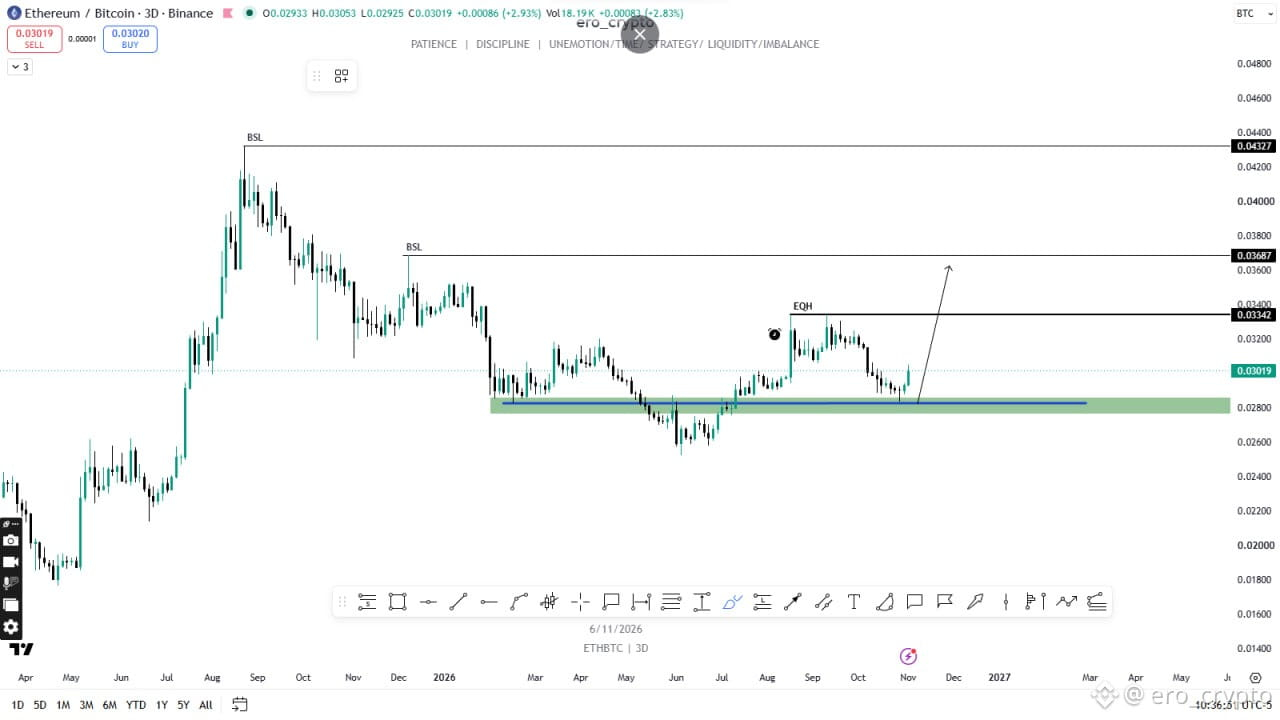
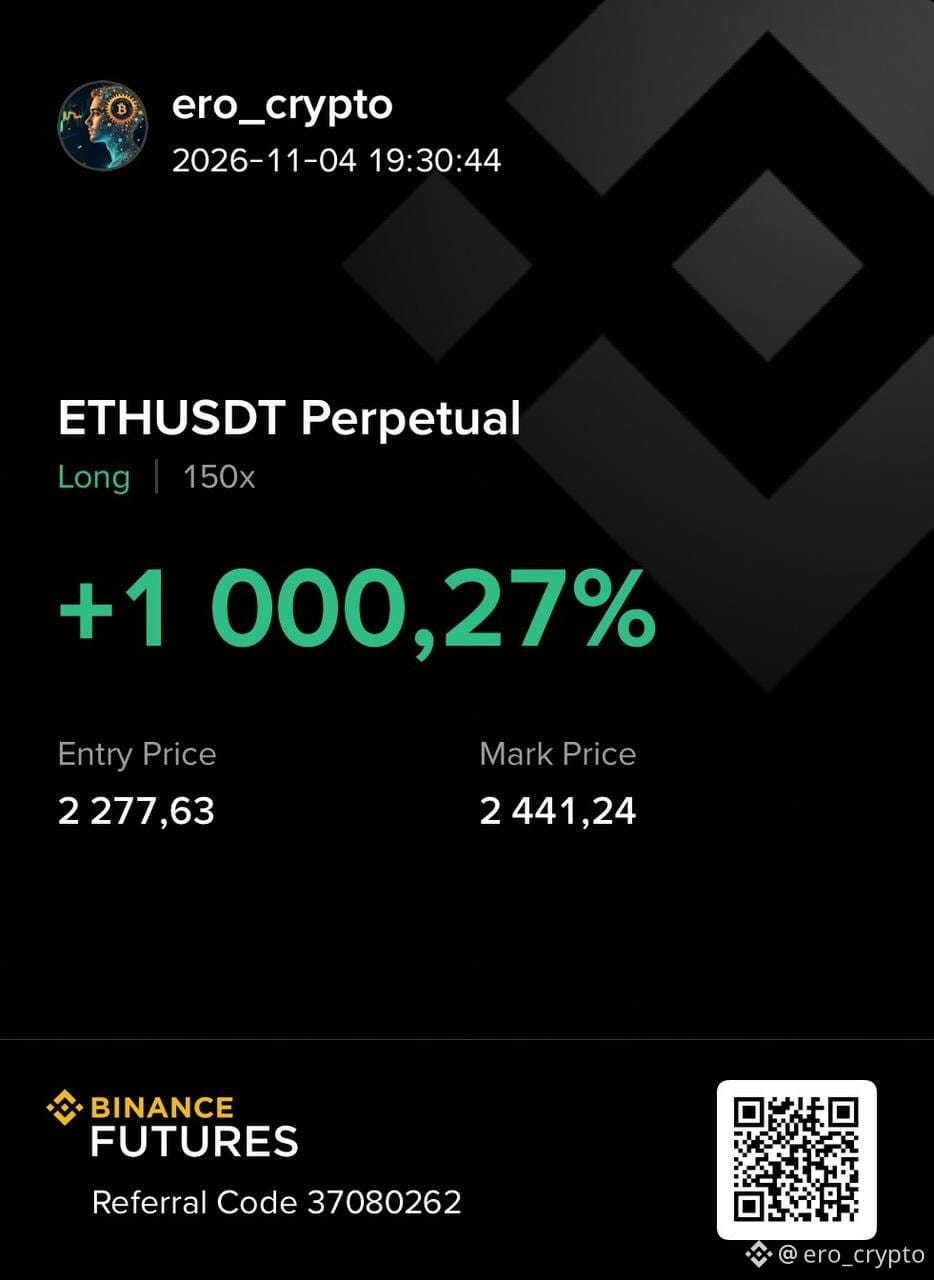
#ETHBTC - the reasons why I longed $ETH and not $BTC
My initial entry was at 2235–2240. I added a bit to the position at higher levels after the 2d confirmation, wanted to increased my position size.
#ETHBTC - the reasons why I longed $ETH and not $BTC
My initial entry was at 2235–2240. I added a bit to the position at higher levels after the 2d confirmation, wanted to increased my position size.
My initial entry was at 2235–2240. I added a bit to the position at higher levels after the 2d confirmation, wanted to increased my position size.
1
478
·
--
🎯 ETH's rally this time is a bit ridiculous
📰 It's up 8.2% in 24 hours, hitting $2,427—way ahead of Bitcoin's 5.6% gain. ETH/BTC has quietly strengthened, signaling that capital is rotating.
💬 Bitcoin is moving sideways while ETH is making the first move—seasoned traders know this rhythm. ETH never lacks a story; what it lacks is money. When the money turns back, ETH is the fastest off the blocks. The altcoin rally hasn't even started yet.
🏷️ #ETH #ETHBTC #山寨季 #CapitalRotation
🎯 ETH's rally this time is a bit ridiculous
📰 It's up 8.2% in 24 hours, hitting $2,427—way ahead of Bitcoin's 5.6% gain. ETH/BTC has quietly strengthened, signaling that capital is rotating.
💬 Bitcoin is moving sideways while ETH is making the first move—seasoned traders know this rhythm. ETH never lacks a story; what it lacks is money. When the money turns back, ETH is the fastest off the blocks. The altcoin rally hasn't even started yet.
🏷️ #ETH #ETHBTC #山寨季 #CapitalRotation
📰 It's up 8.2% in 24 hours, hitting $2,427—way ahead of Bitcoin's 5.6% gain. ETH/BTC has quietly strengthened, signaling that capital is rotating.
💬 Bitcoin is moving sideways while ETH is making the first move—seasoned traders know this rhythm. ETH never lacks a story; what it lacks is money. When the money turns back, ETH is the fastest off the blocks. The altcoin rally hasn't even started yet.
🏷️ #ETH #ETHBTC #山寨季 #CapitalRotation
56
·
--
🎯 ETH is underperforming BTC, and the gap is nearing an extreme
📰 ETH is currently at $2,294, up 2.2% today and down 15% over 30 days. BTC is down 9% over the same period. The ETH/BTC ratio has been steadily sliding, as funds flow into Bitcoin.
💬 Honestly, ETH is only good for riding BTC’s beta right now. This ratio is firmly smothering any sparks of altseason. For ETH to make an independent move, it needs a new story first.
🏷️ #ETH #ETHBTC #山寨季 #RelativeStrength
🎯 ETH is underperforming BTC, and the gap is nearing an extreme
📰 ETH is currently at $2,294, up 2.2% today and down 15% over 30 days. BTC is down 9% over the same period. The ETH/BTC ratio has been steadily sliding, as funds flow into Bitcoin.
💬 Honestly, ETH is only good for riding BTC’s beta right now. This ratio is firmly smothering any sparks of altseason. For ETH to make an independent move, it needs a new story first.
🏷️ #ETH #ETHBTC #山寨季 #RelativeStrength
📰 ETH is currently at $2,294, up 2.2% today and down 15% over 30 days. BTC is down 9% over the same period. The ETH/BTC ratio has been steadily sliding, as funds flow into Bitcoin.
💬 Honestly, ETH is only good for riding BTC’s beta right now. This ratio is firmly smothering any sparks of altseason. For ETH to make an independent move, it needs a new story first.
🏷️ #ETH #ETHBTC #山寨季 #RelativeStrength
231

·
--
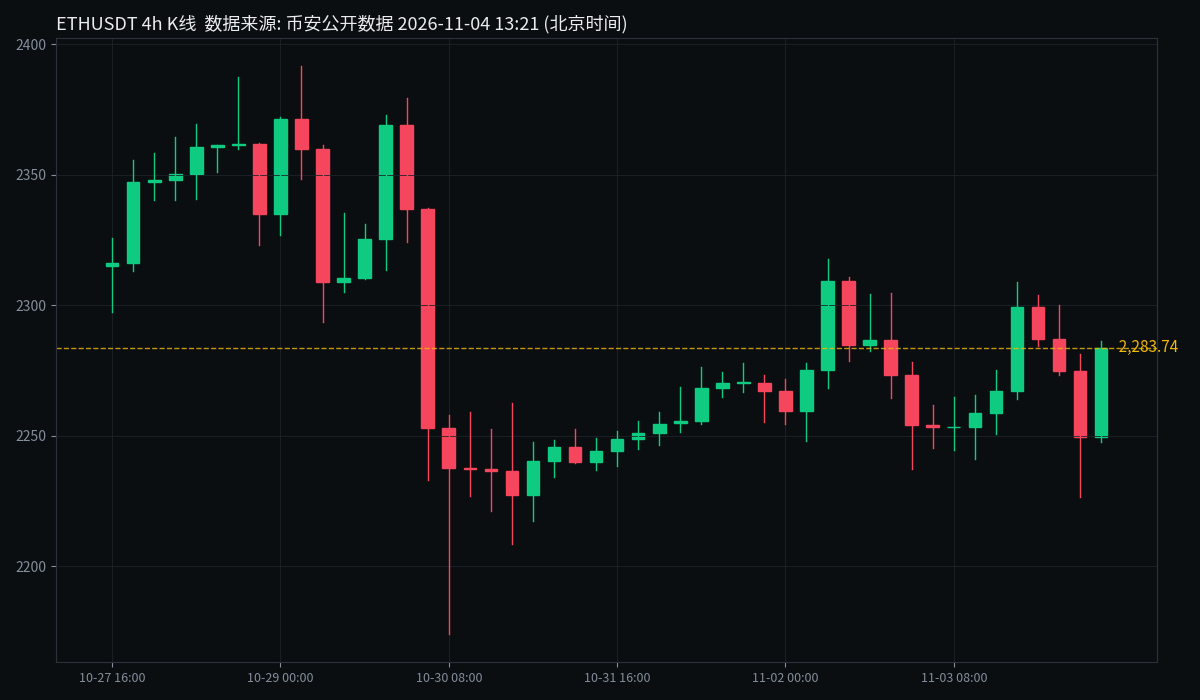
I was scrolling X around noon today, and people were talking about the ETH-to-BTC ratio again. Some were watching the 0.0295 area, while others pointed out that it still needs to break above key resistance to count. Neither side was making a definitive call, so I’m just looking at what the numbers show.
$ETH is now around $2,285, up 1.3% over the past 24 hours. The 24-hour range is $2,226–$2,309, with spot trading volume of about $410 million. Over the past 7 days, the range is $2,174–$2,380, and the price is up 1.4%.
Looking at the ratio against BTC: ETHBTC is now at 0.02948, up 0.44% over the past 24 hours. Its 24-hour range is 0.02931–0.02967, and its 7-day range is 0.02835–0.02967. At this level, it’s just a small step below the 24-hour high and not far from the 7-day high, but it hasn’t broken through yet.
Put simply, this is just a topic people were discussing on X around noon today, not a conclusion: the ratio is hovering near its highs. First, watch 0.02967 above; beyond that, compare it with the 7-day high. On the downside, 0.02931 is the 24-hour low, followed by the 7-day low of 0.02835. Volatility is high to begin with, and hovering near the highs for a day doesn’t tell us whether the trend has turned.
When you follow ETH, do you usually look at its dollar price first, or its ratio against BTC?
$ETH #ETHBTC #MarketWatch
I was scrolling X around noon today, and people were talking about the ETH-to-BTC ratio again. Some were watching the 0.0295 area, while others pointed out that it still needs to break above key resistance to count. Neither side was making a definitive call, so I’m just looking at what the numbers show.
$ETH is now around $2,285, up 1.3% over the past 24 hours. The 24-hour range is $2,226–$2,309, with spot trading volume of about $410 million. Over the past 7 days, the range is $2,174–$2,380, and the price is up 1.4%.
Looking at the ratio against BTC: ETHBTC is now at 0.02948, up 0.44% over the past 24 hours. Its 24-hour range is 0.02931–0.02967, and its 7-day range is 0.02835–0.02967. At this level, it’s just a small step below the 24-hour high and not far from the 7-day high, but it hasn’t broken through yet.
Put simply, this is just a topic people were discussing on X around noon today, not a conclusion: the ratio is hovering near its highs. First, watch 0.02967 above; beyond that, compare it with the 7-day high. On the downside, 0.02931 is the 24-hour low, followed by the 7-day low of 0.02835. Volatility is high to begin with, and hovering near the highs for a day doesn’t tell us whether the trend has turned.
When you follow ETH, do you usually look at its dollar price first, or its ratio against BTC?
$ETH #ETHBTC #MarketWatch
$ETH is now around $2,285, up 1.3% over the past 24 hours. The 24-hour range is $2,226–$2,309, with spot trading volume of about $410 million. Over the past 7 days, the range is $2,174–$2,380, and the price is up 1.4%.
Looking at the ratio against BTC: ETHBTC is now at 0.02948, up 0.44% over the past 24 hours. Its 24-hour range is 0.02931–0.02967, and its 7-day range is 0.02835–0.02967. At this level, it’s just a small step below the 24-hour high and not far from the 7-day high, but it hasn’t broken through yet.
Put simply, this is just a topic people were discussing on X around noon today, not a conclusion: the ratio is hovering near its highs. First, watch 0.02967 above; beyond that, compare it with the 7-day high. On the downside, 0.02931 is the 24-hour low, followed by the 7-day low of 0.02835. Volatility is high to begin with, and hovering near the highs for a day doesn’t tell us whether the trend has turned.
When you follow ETH, do you usually look at its dollar price first, or its ratio against BTC?
$ETH #ETHBTC #MarketWatch
337
·
--
🎯 Bitcoin is standing still, while ETH quietly gains 5 points in seven days
📰 ETH is at $2,263 today, up 0.45% in 24 hours, while BTC at $77K is barely moving. But zoom out to the past seven days, and ETH has outperformed Bitcoin by 5 points—funds are quietly shifting positions
💬 Honestly, the real test is which one holds up better when prices fall. Bitcoin has caught its breath over the past couple of days, and money is starting to feel out ETH. That signal is more convincing than any trading tip
🏷️ #ETH #ETHBTC #资金轮动 #AltcoinSeason
🎯 Bitcoin is standing still, while ETH quietly gains 5 points in seven days
📰 ETH is at $2,263 today, up 0.45% in 24 hours, while BTC at $77K is barely moving. But zoom out to the past seven days, and ETH has outperformed Bitcoin by 5 points—funds are quietly shifting positions
💬 Honestly, the real test is which one holds up better when prices fall. Bitcoin has caught its breath over the past couple of days, and money is starting to feel out ETH. That signal is more convincing than any trading tip
🏷️ #ETH #ETHBTC #资金轮动 #AltcoinSeason
📰 ETH is at $2,263 today, up 0.45% in 24 hours, while BTC at $77K is barely moving. But zoom out to the past seven days, and ETH has outperformed Bitcoin by 5 points—funds are quietly shifting positions
💬 Honestly, the real test is which one holds up better when prices fall. Bitcoin has caught its breath over the past couple of days, and money is starting to feel out ETH. That signal is more convincing than any trading tip
🏷️ #ETH #ETHBTC #资金轮动 #AltcoinSeason
166

·
--
📚 Beginner Tutorial Series: Understanding the ETH/BTC Exchange Rate Makes It Easy to Spot Capital Rotation
Many beginners focus only on whether an individual coin is going up or down, but overlook a more important indicator: the ETH/BTC exchange rate. It measures how much Bitcoin you can exchange for 1 Ethereum. If it rises, Ethereum is stronger relative to Bitcoin, and capital is rotating into Ethereum; if it falls, the opposite is true.
Here’s a recent example: On November 1, the ETH/BTC exchange rate rose 0.79% over 24 hours to 0.02921. That day, Ethereum gained 1.28%, while Bitcoin rose just 0.51%, so Ethereum clearly outperformed. Today’s live market data continues this trend: Ethereum is at $2,295, up about 0.95% over 24 hours; Bitcoin is at $77,564, up just about 0.02%. Ethereum’s relative strength is clear on the same day.
Beginners can use this indicator by remembering three simple steps:
First, watch the direction, not the absolute value. A rising exchange rate = a period of strength for Ethereum, when it’s worth keeping an eye on the Ethereum ecosystem; a falling exchange rate = a period of strength for Bitcoin, with capital flowing back into Bitcoin.
Second, consider the trend in context. A rebound from a long-term low often signals that rotation is beginning; but after a series of sharp rises at a high level, be alert to the possibility that rotation is ending and capital is flowing back.
Third, don’t rely on a single indicator. The exchange rate only tells you which asset is relatively stronger; it doesn’t tell you whether the market as a whole is rising or falling. Make your assessment alongside overall market trends, trading volume, and your own position management.
Learning to read the ETH/BTC exchange rate is like getting a new pair of glasses for tracking capital flows. The next time you see Ethereum outperforming Bitcoin, you’ll know what it means.
Do you usually look at the ETH/BTC exchange rate to guide your decisions, or do you only watch individual coin prices? Let’s discuss in the comments 👇
#新手教学 #ETHBTC #Cryptocurrency
⚠️ Personal opinion, DYOR, and be mindful of the risks
📚 Beginner Tutorial Series: Understanding the ETH/BTC Exchange Rate Makes It Easy to Spot Capital Rotation
Many beginners focus only on whether an individual coin is going up or down, but overlook a more important indicator: the ETH/BTC exchange rate. It measures how much Bitcoin you can exchange for 1 Ethereum. If it rises, Ethereum is stronger relative to Bitcoin, and capital is rotating into Ethereum; if it falls, the opposite is true.
Here’s a recent example: On November 1, the ETH/BTC exchange rate rose 0.79% over 24 hours to 0.02921. That day, Ethereum gained 1.28%, while Bitcoin rose just 0.51%, so Ethereum clearly outperformed. Today’s live market data continues this trend: Ethereum is at $2,295, up about 0.95% over 24 hours; Bitcoin is at $77,564, up just about 0.02%. Ethereum’s relative strength is clear on the same day.
Beginners can use this indicator by remembering three simple steps:
First, watch the direction, not the absolute value. A rising exchange rate = a period of strength for Ethereum, when it’s worth keeping an eye on the Ethereum ecosystem; a falling exchange rate = a period of strength for Bitcoin, with capital flowing back into Bitcoin.
Second, consider the trend in context. A rebound from a long-term low often signals that rotation is beginning; but after a series of sharp rises at a high level, be alert to the possibility that rotation is ending and capital is flowing back.
Third, don’t rely on a single indicator. The exchange rate only tells you which asset is relatively stronger; it doesn’t tell you whether the market as a whole is rising or falling. Make your assessment alongside overall market trends, trading volume, and your own position management.
Learning to read the ETH/BTC exchange rate is like getting a new pair of glasses for tracking capital flows. The next time you see Ethereum outperforming Bitcoin, you’ll know what it means.
Do you usually look at the ETH/BTC exchange rate to guide your decisions, or do you only watch individual coin prices? Let’s discuss in the comments 👇
#新手教学 #ETHBTC #Cryptocurrency
⚠️ Personal opinion, DYOR, and be mindful of the risks
Many beginners focus only on whether an individual coin is going up or down, but overlook a more important indicator: the ETH/BTC exchange rate. It measures how much Bitcoin you can exchange for 1 Ethereum. If it rises, Ethereum is stronger relative to Bitcoin, and capital is rotating into Ethereum; if it falls, the opposite is true.
Here’s a recent example: On November 1, the ETH/BTC exchange rate rose 0.79% over 24 hours to 0.02921. That day, Ethereum gained 1.28%, while Bitcoin rose just 0.51%, so Ethereum clearly outperformed. Today’s live market data continues this trend: Ethereum is at $2,295, up about 0.95% over 24 hours; Bitcoin is at $77,564, up just about 0.02%. Ethereum’s relative strength is clear on the same day.
Beginners can use this indicator by remembering three simple steps:
First, watch the direction, not the absolute value. A rising exchange rate = a period of strength for Ethereum, when it’s worth keeping an eye on the Ethereum ecosystem; a falling exchange rate = a period of strength for Bitcoin, with capital flowing back into Bitcoin.
Second, consider the trend in context. A rebound from a long-term low often signals that rotation is beginning; but after a series of sharp rises at a high level, be alert to the possibility that rotation is ending and capital is flowing back.
Third, don’t rely on a single indicator. The exchange rate only tells you which asset is relatively stronger; it doesn’t tell you whether the market as a whole is rising or falling. Make your assessment alongside overall market trends, trading volume, and your own position management.
Learning to read the ETH/BTC exchange rate is like getting a new pair of glasses for tracking capital flows. The next time you see Ethereum outperforming Bitcoin, you’ll know what it means.
Do you usually look at the ETH/BTC exchange rate to guide your decisions, or do you only watch individual coin prices? Let’s discuss in the comments 👇
#新手教学 #ETHBTC #Cryptocurrency
⚠️ Personal opinion, DYOR, and be mindful of the risks
4
·
--
🎯 ETH’s exchange rate has fallen back to where it was three months ago—90 days of effort down the drain
📰 ETH/BTC is at 0.0293, compared with 0.0317 at the start of the month. Measured in crypto terms, ETH fell 7 percentage points more than BTC over the past month—the exchange rate wiped out all its gains
💬 If you were hoping to outperform BTC, these 90 days were basically a waste. It falls harder on the way down and can’t keep up on the way up—a classic toxic-boyfriend pattern. Until it has a narrative of its own, don’t rush to buy the dip
🏷️ #ETH #汇率 #ETHBTC #RelativeStrength
🎯 ETH’s exchange rate has fallen back to where it was three months ago—90 days of effort down the drain
📰 ETH/BTC is at 0.0293, compared with 0.0317 at the start of the month. Measured in crypto terms, ETH fell 7 percentage points more than BTC over the past month—the exchange rate wiped out all its gains
💬 If you were hoping to outperform BTC, these 90 days were basically a waste. It falls harder on the way down and can’t keep up on the way up—a classic toxic-boyfriend pattern. Until it has a narrative of its own, don’t rush to buy the dip
🏷️ #ETH #汇率 #ETHBTC #RelativeStrength
📰 ETH/BTC is at 0.0293, compared with 0.0317 at the start of the month. Measured in crypto terms, ETH fell 7 percentage points more than BTC over the past month—the exchange rate wiped out all its gains
💬 If you were hoping to outperform BTC, these 90 days were basically a waste. It falls harder on the way down and can’t keep up on the way up—a classic toxic-boyfriend pattern. Until it has a narrative of its own, don’t rush to buy the dip
🏷️ #ETH #汇率 #ETHBTC #RelativeStrength
393
·
--
🎯 ETH hasn’t really fallen this time around—it’s just that everything else has crashed
📰 Up 1.8% in 24 hours, down just 0.6% over seven days, and up 0.8% against BTC at 0.0294. That -14% over 30 days is an old wound, not a fresh one.
💬 Look at this trend: it can’t fall much further, but it can’t climb either. Those who’ve been waiting two months for a catch-up rally will have to keep waiting. This cycle, ETH is just a follower; it won’t be leading the way. Investors would rather take a chance on ZEC.
🏷️ #ETH #以太坊 #ETHBTC #RelativeStrength
🎯 ETH hasn’t really fallen this time around—it’s just that everything else has crashed
📰 Up 1.8% in 24 hours, down just 0.6% over seven days, and up 0.8% against BTC at 0.0294. That -14% over 30 days is an old wound, not a fresh one.
💬 Look at this trend: it can’t fall much further, but it can’t climb either. Those who’ve been waiting two months for a catch-up rally will have to keep waiting. This cycle, ETH is just a follower; it won’t be leading the way. Investors would rather take a chance on ZEC.
🏷️ #ETH #以太坊 #ETHBTC #RelativeStrength
📰 Up 1.8% in 24 hours, down just 0.6% over seven days, and up 0.8% against BTC at 0.0294. That -14% over 30 days is an old wound, not a fresh one.
💬 Look at this trend: it can’t fall much further, but it can’t climb either. Those who’ve been waiting two months for a catch-up rally will have to keep waiting. This cycle, ETH is just a follower; it won’t be leading the way. Investors would rather take a chance on ZEC.
🏷️ #ETH #以太坊 #ETHBTC #RelativeStrength
1
227
Log in to explore more content
Join global crypto users on Binance Square
⚡️ Get latest and useful information about crypto.
💬 Trusted by the world’s largest crypto exchange.
👍 Discover real insights from verified creators.
Email / Phone number
Trending Topics
1
#WhoWillSucceedJensenHuangatNvidia?
14,807 views
221 Discussing
2
#WhatWillDriveCryptoandStocks’NextRebound?
294,122 views
2,179 Discussing
3
#USPPIMissMayEaseBTCPressure
131,357 views
1,496 Discussing
4
#dYdXPlansV9.9UpgradeToShiftUSDCToInjective
14 views
5 Discussing
5
#TradFiForBeginners
653,670 views
4,225 Discussing
6
#MANTRAPausesUnstakingFor7DaysAfterKeplrSecurityIncident
2,138 views
34 Discussing
7
#BitcoinCoreDisclosesTorTrafficVulnerability
61,566 views
879 Discussing
8
#BitcoinBreaksBelow200WeekMovingAverage
129,470 views
887 Discussing
9
#SpaceXTeslaMergerTalksWouldCombine30220BTC
36,573 views
483 Discussing
10
#Anthropic’s6xIPODemandSignalsPotentialRecordRaise
113,378 views
942 Discussing