
#dataliteracy
dataliteracy
55 views
11 Discussing
Hot
Latest

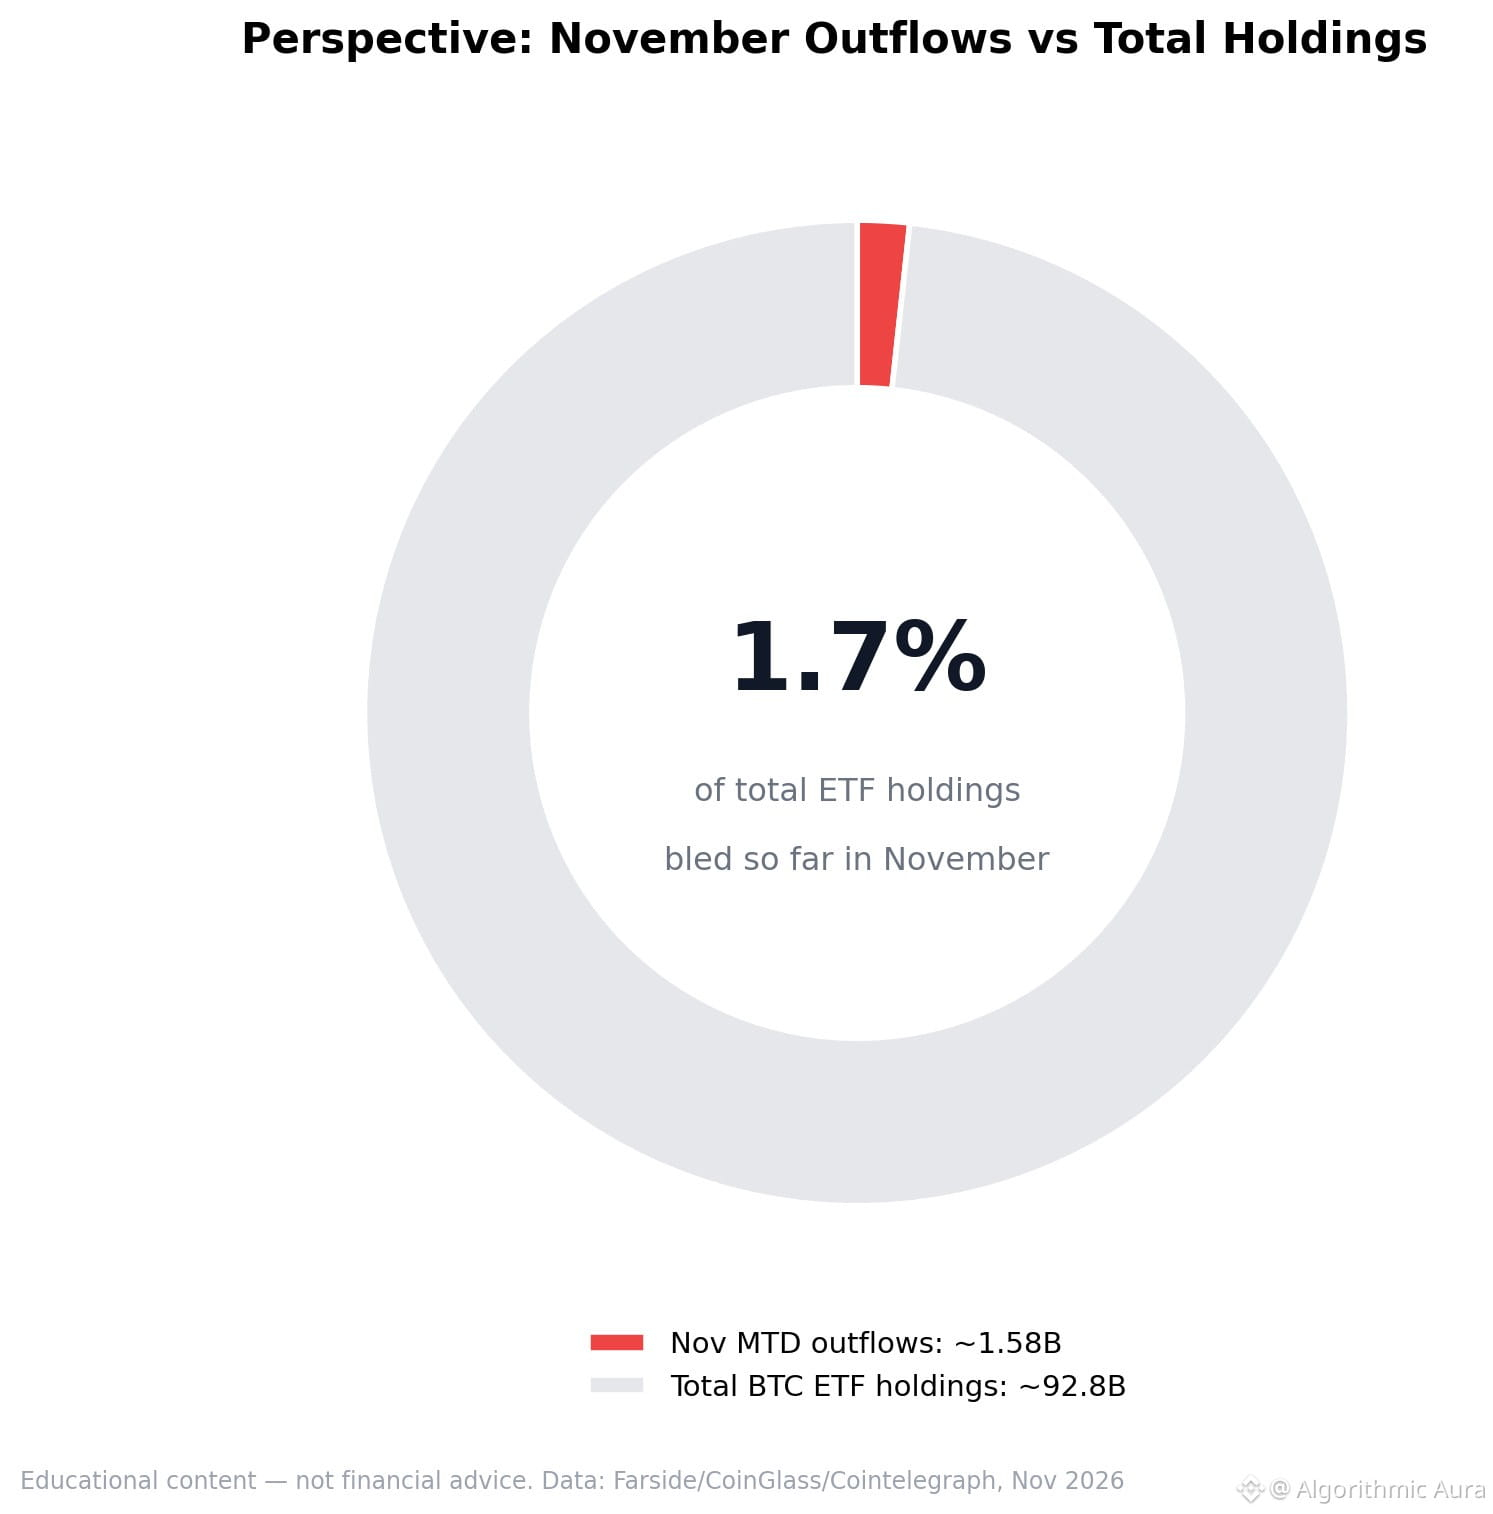
🧮 Understand the scale: just how large are November’s ETF outflows?
1️⃣ November MTD outflows: ~1.58B (Farside, through Nov 10)
2️⃣ Total BTC ETF holdings: ~92.8B
3️⃣ Meaning: so far, this month’s outflows are only ~1.7% of holdings
This isn’t a “everything is fine” post — the streak is painful and affects sentiment. But perspective matters: 1.7% of holdings could be a large institution rebalancing, not a full exit. Look at the donut. 🍩
The rule of data literacy: read both SIZE and direction. 📏
$BTC
#BitcoinETF #DataLiteracy #CryptoMarkets
🧮 Understand the scale: just how large are November’s ETF outflows?
1️⃣ November MTD outflows: ~1.58B (Farside, through Nov 10)
2️⃣ Total BTC ETF holdings: ~92.8B
3️⃣ Meaning: so far, this month’s outflows are only ~1.7% of holdings
This isn’t a “everything is fine” post — the streak is painful and affects sentiment. But perspective matters: 1.7% of holdings could be a large institution rebalancing, not a full exit. Look at the donut. 🍩
The rule of data literacy: read both SIZE and direction. 📏
$BTC
#BitcoinETF #DataLiteracy #CryptoMarkets
1️⃣ November MTD outflows: ~1.58B (Farside, through Nov 10)
2️⃣ Total BTC ETF holdings: ~92.8B
3️⃣ Meaning: so far, this month’s outflows are only ~1.7% of holdings
This isn’t a “everything is fine” post — the streak is painful and affects sentiment. But perspective matters: 1.7% of holdings could be a large institution rebalancing, not a full exit. Look at the donut. 🍩
The rule of data literacy: read both SIZE and direction. 📏
$BTC
#BitcoinETF #DataLiteracy #CryptoMarkets
29
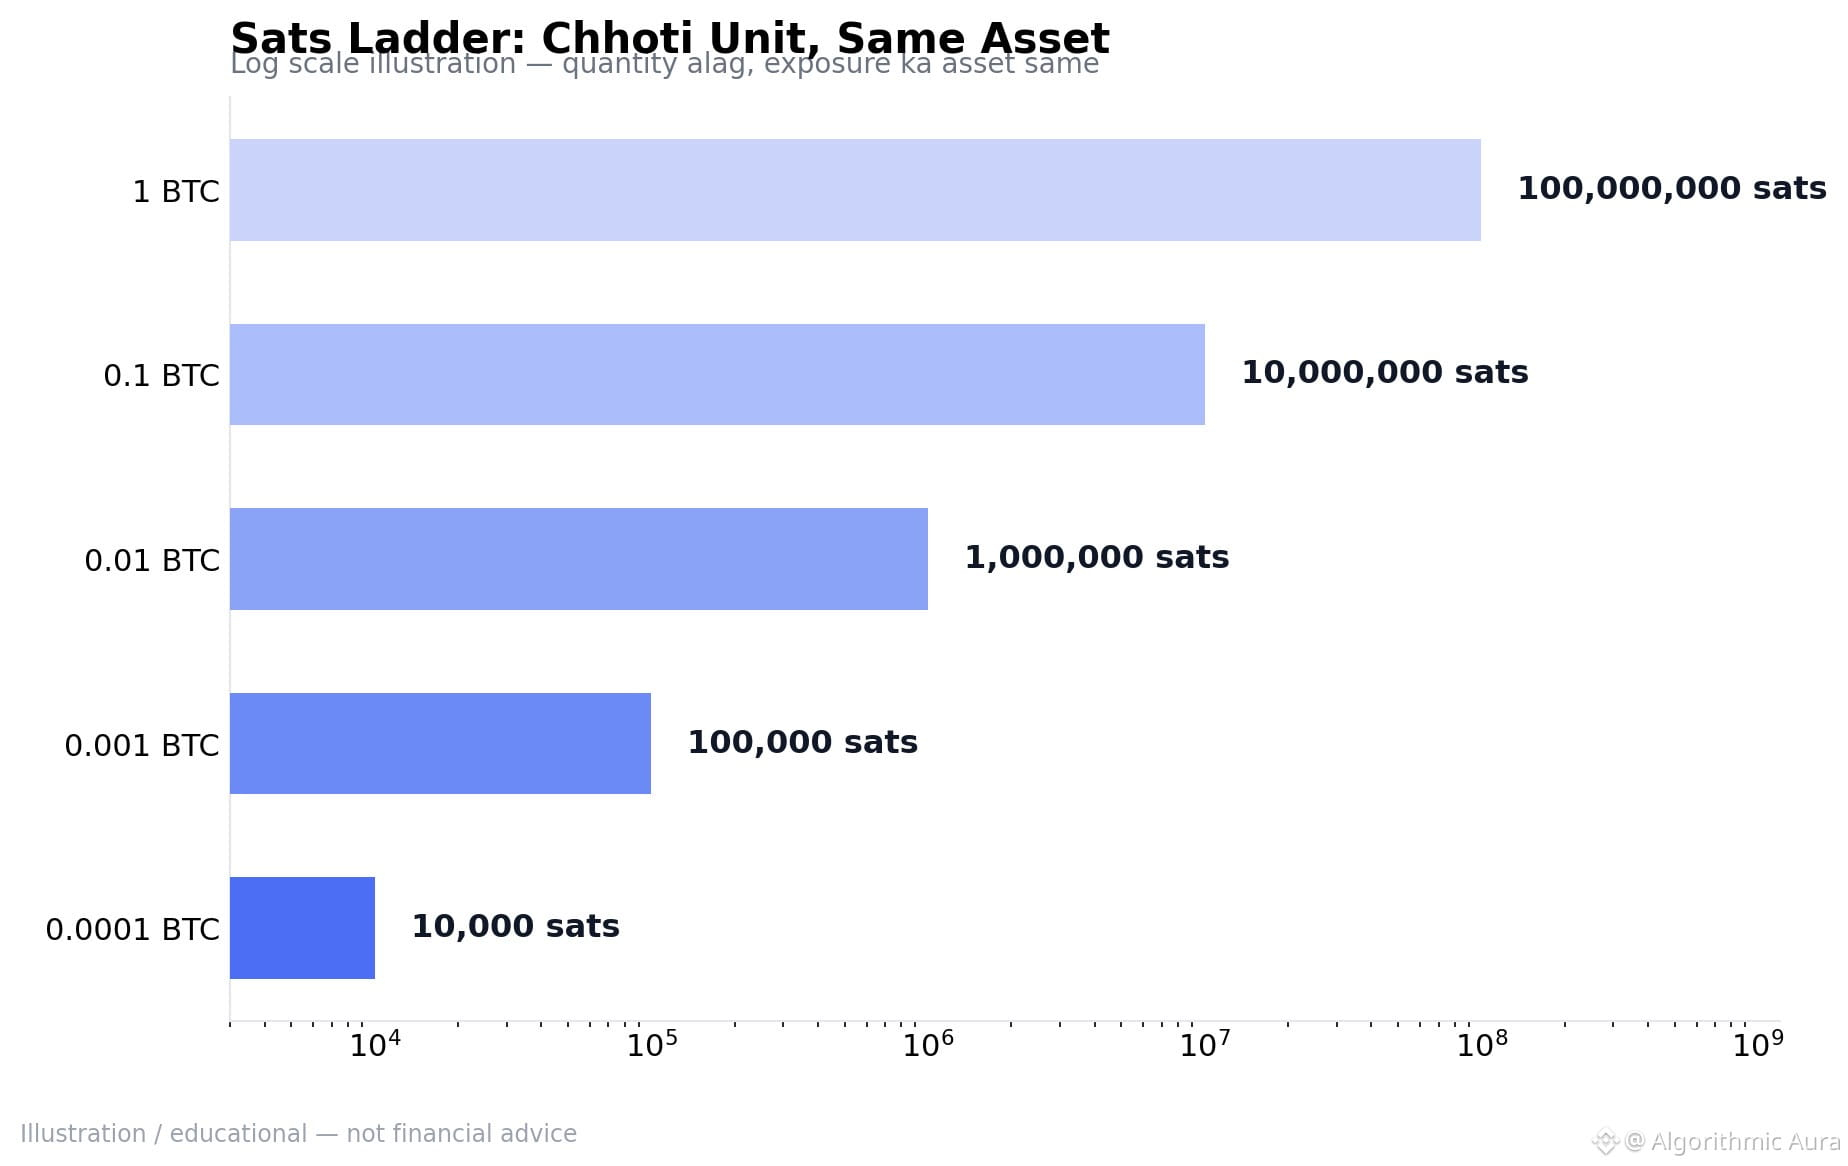
🧮 Sats ladder — BTC’s smaller units, in one chart.
1️⃣ 1 BTC = 100,000,000 sats
2️⃣ 0.01 BTC = 1M sats — 0.001 BTC = 100K sats
3️⃣ 0.0001 BTC = 10K sats — and this is meaningful exposure too
The point isn’t whether you buy a little or a lot — the size of the unit shouldn’t determine your portfolio decisions. Look at the exposure percentage, not the decimals. 📏
Illustration (log scale) — not market data. 🔍
$BTC
#Bitcoin #CryptoEducation #DataLiteracy
🧮 Sats ladder — BTC’s smaller units, in one chart.
1️⃣ 1 BTC = 100,000,000 sats
2️⃣ 0.01 BTC = 1M sats — 0.001 BTC = 100K sats
3️⃣ 0.0001 BTC = 10K sats — and this is meaningful exposure too
The point isn’t whether you buy a little or a lot — the size of the unit shouldn’t determine your portfolio decisions. Look at the exposure percentage, not the decimals. 📏
Illustration (log scale) — not market data. 🔍
$BTC
#Bitcoin #CryptoEducation #DataLiteracy
1️⃣ 1 BTC = 100,000,000 sats
2️⃣ 0.01 BTC = 1M sats — 0.001 BTC = 100K sats
3️⃣ 0.0001 BTC = 10K sats — and this is meaningful exposure too
The point isn’t whether you buy a little or a lot — the size of the unit shouldn’t determine your portfolio decisions. Look at the exposure percentage, not the decimals. 📏
Illustration (log scale) — not market data. 🔍
$BTC
#Bitcoin #CryptoEducation #DataLiteracy
🔢 Unit bias — how costly is the “I want 1 whole coin” mindset?
1️⃣ “BTC is too expensive” — so newcomers flock to cheaper coins, just because they get a bigger quantity
2️⃣ Reality: 0.001 BTC and 1 BTC are the same asset with the same exposure — only the quantity differs
3️⃣ The useful unit: percentage of your portfolio, not coin count
Sats math: 1 BTC = 100M sats. 10,000 sats = 0.0001 BTC. A small number doesn’t mean a small investment. 🧮
Evaluate your portfolio in units, not decimals. Sats ladder in the chart. 🔍
$BTC
#CryptoEducation #Bitcoin #DataLiteracy
🔢 Unit bias — how costly is the “I want 1 whole coin” mindset?
1️⃣ “BTC is too expensive” — so newcomers flock to cheaper coins, just because they get a bigger quantity
2️⃣ Reality: 0.001 BTC and 1 BTC are the same asset with the same exposure — only the quantity differs
3️⃣ The useful unit: percentage of your portfolio, not coin count
Sats math: 1 BTC = 100M sats. 10,000 sats = 0.0001 BTC. A small number doesn’t mean a small investment. 🧮
Evaluate your portfolio in units, not decimals. Sats ladder in the chart. 🔍
$BTC
#CryptoEducation #Bitcoin #DataLiteracy
1️⃣ “BTC is too expensive” — so newcomers flock to cheaper coins, just because they get a bigger quantity
2️⃣ Reality: 0.001 BTC and 1 BTC are the same asset with the same exposure — only the quantity differs
3️⃣ The useful unit: percentage of your portfolio, not coin count
Sats math: 1 BTC = 100M sats. 10,000 sats = 0.0001 BTC. A small number doesn’t mean a small investment. 🧮
Evaluate your portfolio in units, not decimals. Sats ladder in the chart. 🔍
$BTC
#CryptoEducation #Bitcoin #DataLiteracy
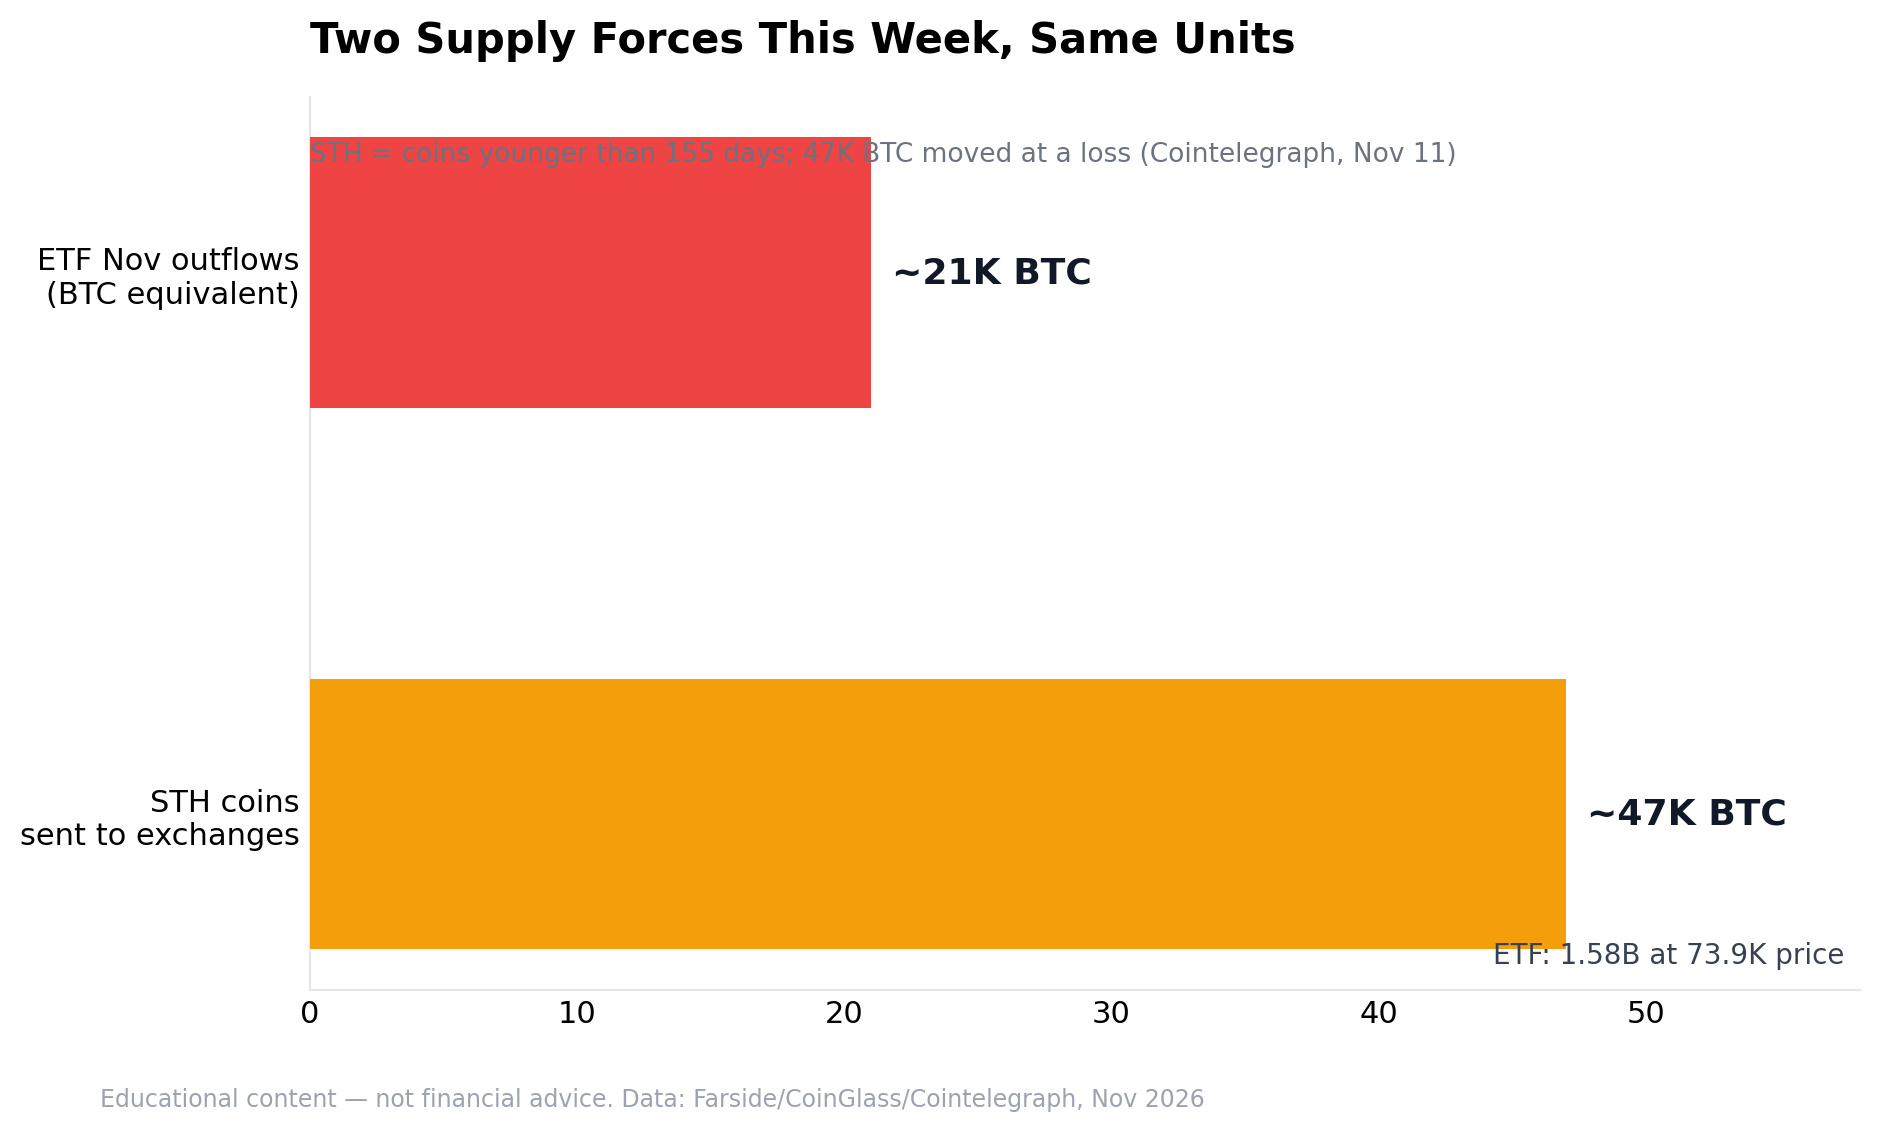
🧮 Two supply forces, in the same unit (BTC):
1️⃣ Short-term holders → exchanges: 47K BTC (at a loss — yesterday’s report)
2️⃣ Bitcoin ETF November outflows: ~1.58B ≈ 21K BTC equivalent (at a price of 73.9K)
Meaning: retail-side STH pressure is currently ~2x greater than the institutional-side bleed. 🔍
This comparison is only useful when both numbers are fresh — and they both are right now. That’s the real supply math: who’s moving how much, and at what rate. Side by side on the chart. 📐
$BTC
#OnChain #BitcoinETF #DataLiteracy
🧮 Two supply forces, in the same unit (BTC):
1️⃣ Short-term holders → exchanges: 47K BTC (at a loss — yesterday’s report)
2️⃣ Bitcoin ETF November outflows: ~1.58B ≈ 21K BTC equivalent (at a price of 73.9K)
Meaning: retail-side STH pressure is currently ~2x greater than the institutional-side bleed. 🔍
This comparison is only useful when both numbers are fresh — and they both are right now. That’s the real supply math: who’s moving how much, and at what rate. Side by side on the chart. 📐
$BTC
#OnChain #BitcoinETF #DataLiteracy
1️⃣ Short-term holders → exchanges: 47K BTC (at a loss — yesterday’s report)
2️⃣ Bitcoin ETF November outflows: ~1.58B ≈ 21K BTC equivalent (at a price of 73.9K)
Meaning: retail-side STH pressure is currently ~2x greater than the institutional-side bleed. 🔍
This comparison is only useful when both numbers are fresh — and they both are right now. That’s the real supply math: who’s moving how much, and at what rate. Side by side on the chart. 📐
$BTC
#OnChain #BitcoinETF #DataLiteracy
1

Why does SHELL's market capitalization differ across platforms?
Some data platforms report SHELL's circulating supply at around 270 million tokens, while other sources put it close to 457 million.
Since market capitalization is calculated by multiplying the token price by the circulating supply, this discrepancy can cause the displayed market cap to differ by millions of dollars.
This doesn't necessarily mean the actual supply has changed over a few days. Platforms may be using different calculation methods.
When researching a token, check both the figures and how they're calculated.
#SHELL #MarketCap #DataLiteracy
Why does SHELL's market capitalization differ across platforms?
Some data platforms report SHELL's circulating supply at around 270 million tokens, while other sources put it close to 457 million.
Since market capitalization is calculated by multiplying the token price by the circulating supply, this discrepancy can cause the displayed market cap to differ by millions of dollars.
This doesn't necessarily mean the actual supply has changed over a few days. Platforms may be using different calculation methods.
When researching a token, check both the figures and how they're calculated.
#SHELL #MarketCap #DataLiteracy
Some data platforms report SHELL's circulating supply at around 270 million tokens, while other sources put it close to 457 million.
Since market capitalization is calculated by multiplying the token price by the circulating supply, this discrepancy can cause the displayed market cap to differ by millions of dollars.
This doesn't necessarily mean the actual supply has changed over a few days. Platforms may be using different calculation methods.
When researching a token, check both the figures and how they're calculated.
#SHELL #MarketCap #DataLiteracy
78
$SHELL | Two numbers, one screen, only one is live
The header price in every screenshot reads 0.02298 USDT, down 0.91% over 24 hours—the same across all seven checks. But the price box just above the candlestick chart shows 0.02404 USDT, the same figure across four separate timeframes.
The header figure matches the published change, high, and low exactly across every tab. The price box on the chart appears to show the close of the most recently completed candle, a figure that can lag behind the live tick price depending on how much time is left in that candle. Good to know before trusting any number displayed before your eyes.
#SHELL #DataLiteracy #BTC
$SHELL | Two numbers, one screen, only one is live
The header price in every screenshot reads 0.02298 USDT, down 0.91% over 24 hours—the same across all seven checks. But the price box just above the candlestick chart shows 0.02404 USDT, the same figure across four separate timeframes.
The header figure matches the published change, high, and low exactly across every tab. The price box on the chart appears to show the close of the most recently completed candle, a figure that can lag behind the live tick price depending on how much time is left in that candle. Good to know before trusting any number displayed before your eyes.
#SHELL #DataLiteracy #BTC
The header price in every screenshot reads 0.02298 USDT, down 0.91% over 24 hours—the same across all seven checks. But the price box just above the candlestick chart shows 0.02404 USDT, the same figure across four separate timeframes.
The header figure matches the published change, high, and low exactly across every tab. The price box on the chart appears to show the close of the most recently completed candle, a figure that can lag behind the live tick price depending on how much time is left in that candle. Good to know before trusting any number displayed before your eyes.
#SHELL #DataLiteracy #BTC
12
$SHELL | A strange point in the calculation, explained plainly
This looks like an error, but it isn’t: SHELL’s monthly Bollinger lower band currently calculates to -0.05209, a negative number. Obviously, the price can’t trade below zero.
What’s actually happening is that the formula is doing exactly what it was designed to do, and SHELL’s monthly volatility is simply large enough relative to its own moving average to push the lower band below zero on paper. This is a mathematical consequence, not a price level, and a good reminder that indicators can sometimes produce numbers worth taking a second look at before interpreting them literally.
#SHELL #DataLiteracy #CryptoEducation
$SHELL | A strange point in the calculation, explained plainly
This looks like an error, but it isn’t: SHELL’s monthly Bollinger lower band currently calculates to -0.05209, a negative number. Obviously, the price can’t trade below zero.
What’s actually happening is that the formula is doing exactly what it was designed to do, and SHELL’s monthly volatility is simply large enough relative to its own moving average to push the lower band below zero on paper. This is a mathematical consequence, not a price level, and a good reminder that indicators can sometimes produce numbers worth taking a second look at before interpreting them literally.
#SHELL #DataLiteracy #CryptoEducation
This looks like an error, but it isn’t: SHELL’s monthly Bollinger lower band currently calculates to -0.05209, a negative number. Obviously, the price can’t trade below zero.
What’s actually happening is that the formula is doing exactly what it was designed to do, and SHELL’s monthly volatility is simply large enough relative to its own moving average to push the lower band below zero on paper. This is a mathematical consequence, not a price level, and a good reminder that indicators can sometimes produce numbers worth taking a second look at before interpreting them literally.
#SHELL #DataLiteracy #CryptoEducation
11
$SHELL | A Quirk in the Math, Explained Honestly
Here's something that might look like a bug but isn't: SHELL's monthly Bollinger lower band currently calculates to -0.05209, a negative number. Price obviously can't trade below zero.
What's actually happening is the formula is doing exactly what it's built to do, and SHELL's monthly volatility has simply been large enough, relative to its own average, to push that lower line below zero on paper. It's a math artifact, not a price level, and it's a good reminder that indicators can produce numbers that need a second look before trusting them at face value.
#SHELL #DataLiteracy #CryptoEducation
$SHELL | A Quirk in the Math, Explained Honestly
Here's something that might look like a bug but isn't: SHELL's monthly Bollinger lower band currently calculates to -0.05209, a negative number. Price obviously can't trade below zero.
What's actually happening is the formula is doing exactly what it's built to do, and SHELL's monthly volatility has simply been large enough, relative to its own average, to push that lower line below zero on paper. It's a math artifact, not a price level, and it's a good reminder that indicators can produce numbers that need a second look before trusting them at face value.
#SHELL #DataLiteracy #CryptoEducation
Here's something that might look like a bug but isn't: SHELL's monthly Bollinger lower band currently calculates to -0.05209, a negative number. Price obviously can't trade below zero.
What's actually happening is the formula is doing exactly what it's built to do, and SHELL's monthly volatility has simply been large enough, relative to its own average, to push that lower line below zero on paper. It's a math artifact, not a price level, and it's a good reminder that indicators can produce numbers that need a second look before trusting them at face value.
#SHELL #DataLiteracy #CryptoEducation
49
$SHELL | Two Numbers, One Screen, Only One of Them Is Live
Every screenshot's header price read 0.02298 USDT, down 0.91% over 24 hours, consistent across all seven views checked. But the price marker sitting directly on the candlestick chart showed 0.02404 USDT, the same figure, on four separate timeframe charts.
The header figure lines up exactly with the stated 24h change, high, and low on every tab. The chart marker reads as the close of the last fully completed candle, a number that can lag the live ticker by however long that candle has left to run. Worth knowing before trusting whichever number happens to be sitting in front of you.
#SHELL #DataLiteracy #BTC
$SHELL | Two Numbers, One Screen, Only One of Them Is Live
Every screenshot's header price read 0.02298 USDT, down 0.91% over 24 hours, consistent across all seven views checked. But the price marker sitting directly on the candlestick chart showed 0.02404 USDT, the same figure, on four separate timeframe charts.
The header figure lines up exactly with the stated 24h change, high, and low on every tab. The chart marker reads as the close of the last fully completed candle, a number that can lag the live ticker by however long that candle has left to run. Worth knowing before trusting whichever number happens to be sitting in front of you.
#SHELL #DataLiteracy #BTC
Every screenshot's header price read 0.02298 USDT, down 0.91% over 24 hours, consistent across all seven views checked. But the price marker sitting directly on the candlestick chart showed 0.02404 USDT, the same figure, on four separate timeframe charts.
The header figure lines up exactly with the stated 24h change, high, and low on every tab. The chart marker reads as the close of the last fully completed candle, a number that can lag the live ticker by however long that candle has left to run. Worth knowing before trusting whichever number happens to be sitting in front of you.
#SHELL #DataLiteracy #BTC
1
91
Log in to explore more content
Join global crypto users on Binance Square
⚡️ Get latest and useful information about crypto.
💬 Trusted by the world’s largest crypto exchange.
👍 Discover real insights from verified creators.
Email / Phone number
Trending Topics
1
#HuangExitNvidiaStrategyInFocus
98,281 views
1,067 Discussing
2
#AnthropicRejectsIPODelayValuationinQuestion
703,885 views
5,310 Discussing
3
#BitMineReports$6.3BNetLossForFiscal2026
12,561 views
127 Discussing
4
#SoFiExpandsSoFiUSDStablecoinToPolygon
522 views
18 Discussing
5
#TetherGoldXAUTCompletesKPMGAudit
405 views
20 Discussing
6
#ChipStocksExtendLossesAfterNvidiaCEOChange
39,591 views
465 Discussing
7
#TrezorConfirmsMaliciousImplantsIn3Safe5Devices
30 views
6 Discussing
8
#TradFiForBeginners
536,178 views
3,730 Discussing
9
#ThailandProposes$148KDailyStablecoinDepositWithdrawalCaps
3,423 views
49 Discussing
10
#CoreWeaveJumps10%On168%RevenueGrowth
199,209 views
1,690 Discussing