
#cryptomarketanalysi
cryptomarketanalysi
62,305 views
15 Discussing
Hot
Latest


·
--
Article
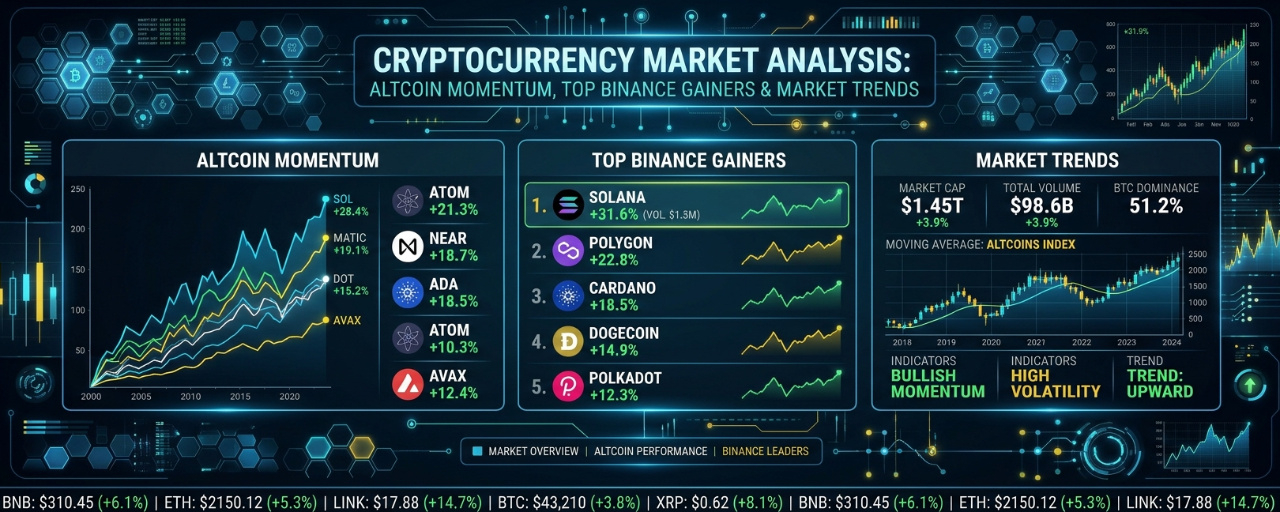
Cryptocurrency Market Analysis: Altcoin Momentum, Top Binance Gainers & Market Trends📊 🌍 Overall Crypto Market Overview
The cryptocurrency market is showing selective bullish momentum despite a slight overall market contraction, with total global market capitalization hovering around $2.4 trillion–$2.5 trillion.
While Bitcoin continues to maintain relatively stable price action around its mid-range support levels, several altcoins are experiencing impressive gains. However, the broader market has yet to demonstrate the strength required for a full-scale altcoin rally.
📈 Market Direction & Bitcoin Dominance
The Altcoin Season Index currently stands at 41/100, suggesting that the market remains in a Bitcoin-oriented or neutral phase rather than a confirmed altcoin season.
This indicates that:
Bitcoin's relative stability is helping maintain broader market confidence.Selected altcoins are outperforming due to project-specific developments and sector demand.Capital is rotating between individual narratives instead of flowing equally across the entire altcoin market.Traders are showing interest in high-growth opportunities but remain selective about risk exposure.
Market Insight: A sustained decline in Bitcoin dominance could create opportunities for altcoins. However, without stronger market-wide participation, individual rallies may struggle to maintain momentum.
🔥 Key Market Narratives Driving Capital
Several cryptocurrency sectors are attracting increased attention:
🤖 AI & DePIN Infrastructure: Projects connected to artificial intelligence, decentralized computing and infrastructure are benefiting from growing interest in emerging technologies.⚙️ Layer-1 & Layer-2 Scaling: Modular blockchain networks and rollup infrastructure, including Initia and Caldera, are attracting speculative capital as investors look for scalable blockchain ecosystems.🌉 Cross-Chain Technology: LayerZero is benefiting from continued interest in blockchain interoperability and cross-chain communication.🏦 Real-World Asset Tokenization: Tokenized financial assets and blockchain-based investment products remain important long-term market narratives.
Analysis: The current rotation suggests that traders are prioritizing projects with identifiable technology narratives rather than buying altcoins indiscriminately.
💰 Trading Volume & Liquidity Analysis
Global cryptocurrency trading volume is approximately $73B–$74B over 24 hours, indicating moderate trading activity and selective liquidity concentration.
The memecoin sector represents approximately $1.71B in daily trading volume, with a combined market capitalization of around $19.04B.
This suggests that speculative interest remains active, although liquidity is not necessarily distributed evenly across smaller tokens.
Important Observation: Rising trading volume alongside strong price appreciation can indicate growing market participation. However, traders should distinguish between genuine accumulation and short-lived speculative buying.
🚀 Top 5 Altcoin Gainers on Binance (24 Hours)
Excluding tokenized stock derivatives.
🥇 Initia (INIT)
📈 24h Change: +70.94%💵 Price: $0.29259📊 24h Volume: $157.71M🏦 Market Cap: $98.66M
Market Analysis: Initia is leading the gainers with an impressive rally. Its Layer-1 and interoperability narrative may be attracting speculative interest. The substantial trading volume indicates strong market participation.
Trading Outlook: After such a sharp increase, traders should watch for consolidation or a possible pullback. A sustained move above newly established support could indicate further upside, while declining volume may signal weakening momentum.
🥈 Harmony (ONE)
📈 24h Change: +26.23%💵 Price: $0.001776📊 24h Volume: $111.75M🏦 Market Cap: $43.98M
Market Analysis: Harmony is showing renewed buying interest after consolidating around lower price levels. Increased spot volume suggests that traders are paying attention to the potential technical recovery.
Trading Outlook: The key factor is whether ONE can maintain its breakout structure. A successful retest of previous resistance as support would strengthen the bullish outlook.
🥉 Caldera (ERA)
📈 24h Change: +15.63%💵 Price: $0.0821📊 24h Volume: $27.79M🏦 Market Cap: $36.56M
Market Analysis: Caldera is benefiting from interest in blockchain rollup infrastructure and modular scaling solutions. Its relatively small market capitalization also makes it more sensitive to changes in trading activity.
Trading Outlook: Continued volume expansion could support further upside. However, traders should monitor resistance levels and avoid chasing an extended rally.
🔹 BENQI (QI)
📈 24h Change: +12.16%💵 Price: $0.001956📊 24h Volume: $13.06M🏦 Market Cap: $14.04M
Market Analysis: BENQI is attracting attention through its connection to the Avalanche DeFi ecosystem and liquid staking sector.
Trading Outlook: Further upside may depend on sustained buying pressure and broader Avalanche ecosystem activity. Its relatively small market capitalization increases the risk of sudden price fluctuations.
🔹 LayerZero (ZRO)
📈 24h Change: +9.31%💵 Price: $1.60📊 24h Volume: $62.22M🏦 Market Cap: $1.23B
Market Analysis: LayerZero is demonstrating comparatively moderate but potentially meaningful strength. Its cross-chain messaging infrastructure provides exposure to the growing interoperability narrative.
Trading Outlook: Compared with smaller gainers, ZRO has a larger market capitalization and substantial trading activity. Traders should monitor whether buying volume continues supporting its upward movement.
🐸 Top 5 Memecoin Gainers on Binance (24 Hours)
Memecoins are showing modest positive momentum, with PEPE leading the selected gainers in both percentage appreciation and reported trading volume.
🥇 Pepe (PEPE)
📈 24h Change: +5.27%💵 Price: $0.00000539📊 24h Volume: $779.13M🏦 Market Cap: $2.23B
Market Analysis: PEPE is attracting substantial trading activity, suggesting strong speculative participation. Its high volume compared with other memecoins makes it an important indicator of sentiment within the meme sector.
Trading Outlook: Continued volume and higher price lows would support a bullish interpretation. However, sharp reversals remain possible.
🥈 Dogs (DOGS)
📈 24h Change: +4.76%💵 Price: $0.00003193📊 24h Volume: $3.57M🏦 Market Cap: $17.39M
Market Analysis: DOGS is showing a modest recovery, potentially supported by renewed interest in the TON ecosystem.
Trading Outlook: Traders should look for stronger volume confirmation before considering the move a sustainable recovery.
🥉 Niu Lai (牛来)
📈 24h Change: +4.30%💵 Price: $0.05944📊 24h Volume: $10.17M🏦 Market Cap: $59.42M
Market Analysis: The token is recording positive price action, with reported buying interest during Asian trading sessions.
Trading Outlook: Maintaining current momentum will depend on continued participation and the ability to hold recent support levels.
🔹 Act I: The AI Prophecy (ACT)
📈 24h Change: +3.54%💵 Price: $0.00965📊 24h Volume: $47.15M🏦 Market Cap: $9.15M
Market Analysis: ACT combines AI-related speculation with the memecoin narrative. This crossover can attract attention when artificial intelligence becomes a dominant market theme.
Trading Outlook: Its relatively high trading volume compared with market capitalization suggests active speculation. Traders should monitor whether buying pressure translates into sustained price appreciation.
🔹 1000*cheems.pet (1000CHEEMS)
📈 24h Change: +2.39%💵 Price: $0.000385📊 24h Volume: $1.01M🏦 Market Cap: $72.46M
Market Analysis: The token is showing a modest recovery within the traditional dog-themed memecoin category.
Trading Outlook: A stronger breakout would require increased trading volume and sustained buying interest rather than a temporary price bounce.
📉 Overall Market Outlook & Trading Strategy
The current market environment reflects selective bullishness rather than a broad cryptocurrency recovery.
For day traders, three factors deserve particular attention:
📊 Bitcoin Direction: Monitor BTC support and resistance levels because a sudden Bitcoin correction could negatively affect altcoin momentum.💹 Volume Confirmation: Look for increasing volume during upward movements. Price increases without sufficient participation may indicate weak breakouts.🎯 Support & Resistance: Identify previous breakout zones and monitor whether prices successfully retest those levels before entering trades.⚠️ Avoid FOMO: Tokens showing gains of 15%–70% within 24 hours can experience aggressive profit-taking and sudden reversals.🛡️ Risk Management: Use appropriate position sizing, predefined stop-loss levels and realistic profit targets. Avoid excessive leverage, particularly in low-cap altcoins and memecoins.
🔮 Final Market Verdict
The cryptocurrency market is currently displaying an interesting combination of Bitcoin stability, selective altcoin strength and continued speculative interest in memecoins.
Initia and Harmony are leading the selected altcoin gainers, while PEPE dominates the highlighted memecoin activity.
The Altcoin Season Index at 41/100 suggests that a widespread altcoin rally has not yet been established. For now, opportunities appear concentrated in individual projects and emerging market narratives.
The key question for traders is whether today's buying pressure develops into sustained accumulation or turns into another short-lived speculative rally.
⚠️ Risk Disclaimer: Cryptocurrency markets are highly volatile. The prices, volumes, market capitalizations and percentage changes presented above are based on the supplied market snapshot and may change rapidly. This analysis is for educational and informational purposes only and should not be considered financial or investment advice. Always conduct independent research before trading.
#CryptoMarketAnalysi #AltcoinMarketUpdate #TopAltcoinGainersToday #CryptoTechnicalAnalysis
$INIT $ONE $ERA
{spot}(ERAUSDT)
{spot}(ONEUSDT)
{spot}(INITUSDT)
Cryptocurrency Market Analysis: Altcoin Momentum, Top Binance Gainers & Market Trends
📊 🌍 Overall Crypto Market Overview
The cryptocurrency market is showing selective bullish momentum despite a slight overall market contraction, with total global market capitalization hovering around $2.4 trillion–$2.5 trillion.
While Bitcoin continues to maintain relatively stable price action around its mid-range support levels, several altcoins are experiencing impressive gains. However, the broader market has yet to demonstrate the strength required for a full-scale altcoin rally.
📈 Market Direction & Bitcoin Dominance
The Altcoin Season Index currently stands at 41/100, suggesting that the market remains in a Bitcoin-oriented or neutral phase rather than a confirmed altcoin season.
This indicates that:
Bitcoin's relative stability is helping maintain broader market confidence.Selected altcoins are outperforming due to project-specific developments and sector demand.Capital is rotating between individual narratives instead of flowing equally across the entire altcoin market.Traders are showing interest in high-growth opportunities but remain selective about risk exposure.
Market Insight: A sustained decline in Bitcoin dominance could create opportunities for altcoins. However, without stronger market-wide participation, individual rallies may struggle to maintain momentum.
🔥 Key Market Narratives Driving Capital
Several cryptocurrency sectors are attracting increased attention:
🤖 AI & DePIN Infrastructure: Projects connected to artificial intelligence, decentralized computing and infrastructure are benefiting from growing interest in emerging technologies.⚙️ Layer-1 & Layer-2 Scaling: Modular blockchain networks and rollup infrastructure, including Initia and Caldera, are attracting speculative capital as investors look for scalable blockchain ecosystems.🌉 Cross-Chain Technology: LayerZero is benefiting from continued interest in blockchain interoperability and cross-chain communication.🏦 Real-World Asset Tokenization: Tokenized financial assets and blockchain-based investment products remain important long-term market narratives.
Analysis: The current rotation suggests that traders are prioritizing projects with identifiable technology narratives rather than buying altcoins indiscriminately.
💰 Trading Volume & Liquidity Analysis
Global cryptocurrency trading volume is approximately $73B–$74B over 24 hours, indicating moderate trading activity and selective liquidity concentration.
The memecoin sector represents approximately $1.71B in daily trading volume, with a combined market capitalization of around $19.04B.
This suggests that speculative interest remains active, although liquidity is not necessarily distributed evenly across smaller tokens.
Important Observation: Rising trading volume alongside strong price appreciation can indicate growing market participation. However, traders should distinguish between genuine accumulation and short-lived speculative buying.
🚀 Top 5 Altcoin Gainers on Binance (24 Hours)
Excluding tokenized stock derivatives.
🥇 Initia (INIT)
📈 24h Change: +70.94%💵 Price: $0.29259📊 24h Volume: $157.71M🏦 Market Cap: $98.66M
Market Analysis: Initia is leading the gainers with an impressive rally. Its Layer-1 and interoperability narrative may be attracting speculative interest. The substantial trading volume indicates strong market participation.
Trading Outlook: After such a sharp increase, traders should watch for consolidation or a possible pullback. A sustained move above newly established support could indicate further upside, while declining volume may signal weakening momentum.
🥈 Harmony (ONE)
📈 24h Change: +26.23%💵 Price: $0.001776📊 24h Volume: $111.75M🏦 Market Cap: $43.98M
Market Analysis: Harmony is showing renewed buying interest after consolidating around lower price levels. Increased spot volume suggests that traders are paying attention to the potential technical recovery.
Trading Outlook: The key factor is whether ONE can maintain its breakout structure. A successful retest of previous resistance as support would strengthen the bullish outlook.
🥉 Caldera (ERA)
📈 24h Change: +15.63%💵 Price: $0.0821📊 24h Volume: $27.79M🏦 Market Cap: $36.56M
Market Analysis: Caldera is benefiting from interest in blockchain rollup infrastructure and modular scaling solutions. Its relatively small market capitalization also makes it more sensitive to changes in trading activity.
Trading Outlook: Continued volume expansion could support further upside. However, traders should monitor resistance levels and avoid chasing an extended rally.
🔹 BENQI (QI)
📈 24h Change: +12.16%💵 Price: $0.001956📊 24h Volume: $13.06M🏦 Market Cap: $14.04M
Market Analysis: BENQI is attracting attention through its connection to the Avalanche DeFi ecosystem and liquid staking sector.
Trading Outlook: Further upside may depend on sustained buying pressure and broader Avalanche ecosystem activity. Its relatively small market capitalization increases the risk of sudden price fluctuations.
🔹 LayerZero (ZRO)
📈 24h Change: +9.31%💵 Price: $1.60📊 24h Volume: $62.22M🏦 Market Cap: $1.23B
Market Analysis: LayerZero is demonstrating comparatively moderate but potentially meaningful strength. Its cross-chain messaging infrastructure provides exposure to the growing interoperability narrative.
Trading Outlook: Compared with smaller gainers, ZRO has a larger market capitalization and substantial trading activity. Traders should monitor whether buying volume continues supporting its upward movement.
🐸 Top 5 Memecoin Gainers on Binance (24 Hours)
Memecoins are showing modest positive momentum, with PEPE leading the selected gainers in both percentage appreciation and reported trading volume.
🥇 Pepe (PEPE)
📈 24h Change: +5.27%💵 Price: $0.00000539📊 24h Volume: $779.13M🏦 Market Cap: $2.23B
Market Analysis: PEPE is attracting substantial trading activity, suggesting strong speculative participation. Its high volume compared with other memecoins makes it an important indicator of sentiment within the meme sector.
Trading Outlook: Continued volume and higher price lows would support a bullish interpretation. However, sharp reversals remain possible.
🥈 Dogs (DOGS)
📈 24h Change: +4.76%💵 Price: $0.00003193📊 24h Volume: $3.57M🏦 Market Cap: $17.39M
Market Analysis: DOGS is showing a modest recovery, potentially supported by renewed interest in the TON ecosystem.
Trading Outlook: Traders should look for stronger volume confirmation before considering the move a sustainable recovery.
🥉 Niu Lai (牛来)
📈 24h Change: +4.30%💵 Price: $0.05944📊 24h Volume: $10.17M🏦 Market Cap: $59.42M
Market Analysis: The token is recording positive price action, with reported buying interest during Asian trading sessions.
Trading Outlook: Maintaining current momentum will depend on continued participation and the ability to hold recent support levels.
🔹 Act I: The AI Prophecy (ACT)
📈 24h Change: +3.54%💵 Price: $0.00965📊 24h Volume: $47.15M🏦 Market Cap: $9.15M
Market Analysis: ACT combines AI-related speculation with the memecoin narrative. This crossover can attract attention when artificial intelligence becomes a dominant market theme.
Trading Outlook: Its relatively high trading volume compared with market capitalization suggests active speculation. Traders should monitor whether buying pressure translates into sustained price appreciation.
🔹 1000*cheems.pet (1000CHEEMS)
📈 24h Change: +2.39%💵 Price: $0.000385📊 24h Volume: $1.01M🏦 Market Cap: $72.46M
Market Analysis: The token is showing a modest recovery within the traditional dog-themed memecoin category.
Trading Outlook: A stronger breakout would require increased trading volume and sustained buying interest rather than a temporary price bounce.
📉 Overall Market Outlook & Trading Strategy
The current market environment reflects selective bullishness rather than a broad cryptocurrency recovery.
For day traders, three factors deserve particular attention:
📊 Bitcoin Direction: Monitor BTC support and resistance levels because a sudden Bitcoin correction could negatively affect altcoin momentum.💹 Volume Confirmation: Look for increasing volume during upward movements. Price increases without sufficient participation may indicate weak breakouts.🎯 Support & Resistance: Identify previous breakout zones and monitor whether prices successfully retest those levels before entering trades.⚠️ Avoid FOMO: Tokens showing gains of 15%–70% within 24 hours can experience aggressive profit-taking and sudden reversals.🛡️ Risk Management: Use appropriate position sizing, predefined stop-loss levels and realistic profit targets. Avoid excessive leverage, particularly in low-cap altcoins and memecoins.
🔮 Final Market Verdict
The cryptocurrency market is currently displaying an interesting combination of Bitcoin stability, selective altcoin strength and continued speculative interest in memecoins.
Initia and Harmony are leading the selected altcoin gainers, while PEPE dominates the highlighted memecoin activity.
The Altcoin Season Index at 41/100 suggests that a widespread altcoin rally has not yet been established. For now, opportunities appear concentrated in individual projects and emerging market narratives.
The key question for traders is whether today's buying pressure develops into sustained accumulation or turns into another short-lived speculative rally.
⚠️ Risk Disclaimer: Cryptocurrency markets are highly volatile. The prices, volumes, market capitalizations and percentage changes presented above are based on the supplied market snapshot and may change rapidly. This analysis is for educational and informational purposes only and should not be considered financial or investment advice. Always conduct independent research before trading.
#CryptoMarketAnalysi #AltcoinMarketUpdate #TopAltcoinGainersToday #CryptoTechnicalAnalysis
$INIT $ONE $ERA
The cryptocurrency market is showing selective bullish momentum despite a slight overall market contraction, with total global market capitalization hovering around $2.4 trillion–$2.5 trillion.
While Bitcoin continues to maintain relatively stable price action around its mid-range support levels, several altcoins are experiencing impressive gains. However, the broader market has yet to demonstrate the strength required for a full-scale altcoin rally.
📈 Market Direction & Bitcoin Dominance
The Altcoin Season Index currently stands at 41/100, suggesting that the market remains in a Bitcoin-oriented or neutral phase rather than a confirmed altcoin season.
This indicates that:
Bitcoin's relative stability is helping maintain broader market confidence.Selected altcoins are outperforming due to project-specific developments and sector demand.Capital is rotating between individual narratives instead of flowing equally across the entire altcoin market.Traders are showing interest in high-growth opportunities but remain selective about risk exposure.
Market Insight: A sustained decline in Bitcoin dominance could create opportunities for altcoins. However, without stronger market-wide participation, individual rallies may struggle to maintain momentum.
🔥 Key Market Narratives Driving Capital
Several cryptocurrency sectors are attracting increased attention:
🤖 AI & DePIN Infrastructure: Projects connected to artificial intelligence, decentralized computing and infrastructure are benefiting from growing interest in emerging technologies.⚙️ Layer-1 & Layer-2 Scaling: Modular blockchain networks and rollup infrastructure, including Initia and Caldera, are attracting speculative capital as investors look for scalable blockchain ecosystems.🌉 Cross-Chain Technology: LayerZero is benefiting from continued interest in blockchain interoperability and cross-chain communication.🏦 Real-World Asset Tokenization: Tokenized financial assets and blockchain-based investment products remain important long-term market narratives.
Analysis: The current rotation suggests that traders are prioritizing projects with identifiable technology narratives rather than buying altcoins indiscriminately.
💰 Trading Volume & Liquidity Analysis
Global cryptocurrency trading volume is approximately $73B–$74B over 24 hours, indicating moderate trading activity and selective liquidity concentration.
The memecoin sector represents approximately $1.71B in daily trading volume, with a combined market capitalization of around $19.04B.
This suggests that speculative interest remains active, although liquidity is not necessarily distributed evenly across smaller tokens.
Important Observation: Rising trading volume alongside strong price appreciation can indicate growing market participation. However, traders should distinguish between genuine accumulation and short-lived speculative buying.
🚀 Top 5 Altcoin Gainers on Binance (24 Hours)
Excluding tokenized stock derivatives.
🥇 Initia (INIT)
📈 24h Change: +70.94%💵 Price: $0.29259📊 24h Volume: $157.71M🏦 Market Cap: $98.66M
Market Analysis: Initia is leading the gainers with an impressive rally. Its Layer-1 and interoperability narrative may be attracting speculative interest. The substantial trading volume indicates strong market participation.
Trading Outlook: After such a sharp increase, traders should watch for consolidation or a possible pullback. A sustained move above newly established support could indicate further upside, while declining volume may signal weakening momentum.
🥈 Harmony (ONE)
📈 24h Change: +26.23%💵 Price: $0.001776📊 24h Volume: $111.75M🏦 Market Cap: $43.98M
Market Analysis: Harmony is showing renewed buying interest after consolidating around lower price levels. Increased spot volume suggests that traders are paying attention to the potential technical recovery.
Trading Outlook: The key factor is whether ONE can maintain its breakout structure. A successful retest of previous resistance as support would strengthen the bullish outlook.
🥉 Caldera (ERA)
📈 24h Change: +15.63%💵 Price: $0.0821📊 24h Volume: $27.79M🏦 Market Cap: $36.56M
Market Analysis: Caldera is benefiting from interest in blockchain rollup infrastructure and modular scaling solutions. Its relatively small market capitalization also makes it more sensitive to changes in trading activity.
Trading Outlook: Continued volume expansion could support further upside. However, traders should monitor resistance levels and avoid chasing an extended rally.
🔹 BENQI (QI)
📈 24h Change: +12.16%💵 Price: $0.001956📊 24h Volume: $13.06M🏦 Market Cap: $14.04M
Market Analysis: BENQI is attracting attention through its connection to the Avalanche DeFi ecosystem and liquid staking sector.
Trading Outlook: Further upside may depend on sustained buying pressure and broader Avalanche ecosystem activity. Its relatively small market capitalization increases the risk of sudden price fluctuations.
🔹 LayerZero (ZRO)
📈 24h Change: +9.31%💵 Price: $1.60📊 24h Volume: $62.22M🏦 Market Cap: $1.23B
Market Analysis: LayerZero is demonstrating comparatively moderate but potentially meaningful strength. Its cross-chain messaging infrastructure provides exposure to the growing interoperability narrative.
Trading Outlook: Compared with smaller gainers, ZRO has a larger market capitalization and substantial trading activity. Traders should monitor whether buying volume continues supporting its upward movement.
🐸 Top 5 Memecoin Gainers on Binance (24 Hours)
Memecoins are showing modest positive momentum, with PEPE leading the selected gainers in both percentage appreciation and reported trading volume.
🥇 Pepe (PEPE)
📈 24h Change: +5.27%💵 Price: $0.00000539📊 24h Volume: $779.13M🏦 Market Cap: $2.23B
Market Analysis: PEPE is attracting substantial trading activity, suggesting strong speculative participation. Its high volume compared with other memecoins makes it an important indicator of sentiment within the meme sector.
Trading Outlook: Continued volume and higher price lows would support a bullish interpretation. However, sharp reversals remain possible.
🥈 Dogs (DOGS)
📈 24h Change: +4.76%💵 Price: $0.00003193📊 24h Volume: $3.57M🏦 Market Cap: $17.39M
Market Analysis: DOGS is showing a modest recovery, potentially supported by renewed interest in the TON ecosystem.
Trading Outlook: Traders should look for stronger volume confirmation before considering the move a sustainable recovery.
🥉 Niu Lai (牛来)
📈 24h Change: +4.30%💵 Price: $0.05944📊 24h Volume: $10.17M🏦 Market Cap: $59.42M
Market Analysis: The token is recording positive price action, with reported buying interest during Asian trading sessions.
Trading Outlook: Maintaining current momentum will depend on continued participation and the ability to hold recent support levels.
🔹 Act I: The AI Prophecy (ACT)
📈 24h Change: +3.54%💵 Price: $0.00965📊 24h Volume: $47.15M🏦 Market Cap: $9.15M
Market Analysis: ACT combines AI-related speculation with the memecoin narrative. This crossover can attract attention when artificial intelligence becomes a dominant market theme.
Trading Outlook: Its relatively high trading volume compared with market capitalization suggests active speculation. Traders should monitor whether buying pressure translates into sustained price appreciation.
🔹 1000*cheems.pet (1000CHEEMS)
📈 24h Change: +2.39%💵 Price: $0.000385📊 24h Volume: $1.01M🏦 Market Cap: $72.46M
Market Analysis: The token is showing a modest recovery within the traditional dog-themed memecoin category.
Trading Outlook: A stronger breakout would require increased trading volume and sustained buying interest rather than a temporary price bounce.
📉 Overall Market Outlook & Trading Strategy
The current market environment reflects selective bullishness rather than a broad cryptocurrency recovery.
For day traders, three factors deserve particular attention:
📊 Bitcoin Direction: Monitor BTC support and resistance levels because a sudden Bitcoin correction could negatively affect altcoin momentum.💹 Volume Confirmation: Look for increasing volume during upward movements. Price increases without sufficient participation may indicate weak breakouts.🎯 Support & Resistance: Identify previous breakout zones and monitor whether prices successfully retest those levels before entering trades.⚠️ Avoid FOMO: Tokens showing gains of 15%–70% within 24 hours can experience aggressive profit-taking and sudden reversals.🛡️ Risk Management: Use appropriate position sizing, predefined stop-loss levels and realistic profit targets. Avoid excessive leverage, particularly in low-cap altcoins and memecoins.
🔮 Final Market Verdict
The cryptocurrency market is currently displaying an interesting combination of Bitcoin stability, selective altcoin strength and continued speculative interest in memecoins.
Initia and Harmony are leading the selected altcoin gainers, while PEPE dominates the highlighted memecoin activity.
The Altcoin Season Index at 41/100 suggests that a widespread altcoin rally has not yet been established. For now, opportunities appear concentrated in individual projects and emerging market narratives.
The key question for traders is whether today's buying pressure develops into sustained accumulation or turns into another short-lived speculative rally.
⚠️ Risk Disclaimer: Cryptocurrency markets are highly volatile. The prices, volumes, market capitalizations and percentage changes presented above are based on the supplied market snapshot and may change rapidly. This analysis is for educational and informational purposes only and should not be considered financial or investment advice. Always conduct independent research before trading.
#CryptoMarketAnalysi #AltcoinMarketUpdate #TopAltcoinGainersToday #CryptoTechnicalAnalysis
$INIT $ONE $ERA
1
1
212

·
--
Fund Flow Friday: What Binance Stock Traders' Capital Movements Reveal This WeekWhat This Week's Market Rotation Reveals Across Crypto and Tokenized Stocks
Bitcoin just posted its best week since March, tokenized equity volume hit a record, and stablecoin dominance is falling. Here's what this week's fund flows actually reveal.
Bitcoin fell to $57,735 on July 1 — its weakest level in 21 months. Four days later, it had rallied nearly 7%, its best week since March.
That kind of reversal usually gets read as a bullish signal. The fund flow data underneath it tells a more complicated story — and that gap between the headline and the mechanics is exactly what this week's rotation is about.
Bitcoin's Rally Has a Structural Problem
Bitcoin recovered from $57,735 to above $63,000 this week, with price briefly touching $64,500 — a two-week high. On the surface, that reads as risk appetite returning to crypto.
The derivatives data says otherwise. BTC futures open interest slipped to 740,000 BTC, down from a July 3 high of 776,000 BTC, even as price kept climbing. Over $500 million in leveraged short positions were liquidated in a single 24-hour stretch, and shorts have accounted for the majority of liquidations for six straight days. That combination — rising price, falling open interest, one-sided liquidations — points to a short squeeze mechanically forcing the rally higher, not fresh buying conviction entering the market.
Spot demand tells the same story. U.S. spot Bitcoin ETFs snapped a 10-day losing streak this week, pulling in $221.7 million in one session and $265.69 million in another — both the largest single-day inflows in more than a month. That's a genuine improvement after June, the worst month on record for these products. But "best in two months" is a low bar coming off a historically weak stretch, and the sizing is small relative to the scale of the price move it's supposedly funding.
Why this matters: a squeeze-driven rally and a conviction-driven rally look identical on a price chart. They behave very differently once the squeeze exhausts itself.
Stablecoins Are Sending a Genuinely Bearish Signal — With a Catch
Stablecoin market cap fell to $312 billion in June, the largest monthly drop since the TerraUSD collapse. On its own, that reads as capital leaving crypto entirely.
But look at USDT's dominance rate — the share of the total crypto market held in Tether specifically — and the picture shifts. That dominance rate peaked at 9.35% last month, the highest level since the second half of 2022, before pulling back to 8.54% this week. Rising stablecoin dominance during a downturn, followed by a pullback as price recovers, is consistent with capital rotating out of a defensive stablecoin position and back into risk assets — not leaving the ecosystem.
There's a regulatory layer complicating this further. The EU's MiCA framework became fully operational on July 1, and Tether didn't submit the required electronic money issuance application in time — pushing USDT off licensed European exchanges. Circle's EURC, by contrast, is compliant, creating a real opening on regulated venues. Some of the June stablecoin cap decline may reflect this forced delisting rather than pure sentiment.
The distinction that matters: falling stablecoin cap plus falling USDT dominance during a price recovery is a different signal than falling stablecoin cap during a price decline. Context, not the number alone, tells you which one you're looking at.
Tokenized Equities Just Had Their Strongest Month on Record
While spot crypto trading volumes have struggled, tokenized stock volumes surged 145% to a record $3.86 billion. That's not a rounding error — it's the clearest sign yet that tokenized real-world assets are becoming a genuine parallel market rather than a niche experiment.
This is happening alongside expanding institutional infrastructure: Dinari and tZERO launched a joint turnkey platform for tokenized U.S. equities this week, and Swift rolled out a new blockchain ledger enabling 24/7 banking pilots across 17 major banks, including HSBC, UBS, Wells Fargo, and Citi. Separately, RWA tokens (tokenized gold, credit, funds, and treasuries) pushed their combined market cap above $63 billion, led by tokenized real-world credit and treasury products.
The read: institutional capital isn't waiting for crypto sentiment to fully recover before building tokenization infrastructure. That's a meaningfully different signal than retail speculation chasing a Bitcoin bounce.
Liquidity Diverged From Price This Week — That's the Real Tell
The single most useful data point from this week isn't the price move — it's the divergence between price and the metrics that normally confirm it.
{future}(BTCUSDT)
$BTC rose. Open interest fell. ETF inflows improved but stayed modest relative to the price move. That combination is a textbook mismatch: price advancing on thinner conviction than the chart implies. Traders managing size should weight execution quality and order-book depth more heavily than the headline percentage move this week, since a squeeze-driven advance carries a different risk profile than one confirmed by expanding open interest and strengthening spot demand.
Trade your favorite pair here: [Binance Spot Trading](https://www.binance.com/en/trade)
Looking Beyond Individual Assets
The clearest theme this week isn't "Bitcoin is back" or "stablecoins signal fear." It's a market where three separate rotations are happening simultaneously and pulling in different directions: a mechanical short squeeze in Bitcoin, a regulatory-driven reshuffling in stablecoins, and a genuine institutional build-out in tokenized equities that isn't waiting on crypto sentiment to recover.
Macro conditions are adding a tailwind rather than a headwind for now — the 2-year inflation breakeven rate has dropped below the Fed's 2% target, and New York Fed President John Williams hasn't signaled any near-term appetite for a rate hike. That's constructive background, but it doesn't resolve the open-interest divergence sitting underneath Bitcoin's rally.
Key Takeaways
Bitcoin's 7% weekly rally was accompanied by falling open interest (776K → 740K BTC) and one-sided short liquidations — a squeeze signature, not confirmed fresh demand.Spot Bitcoin ETF inflows improved to their best levels in over a month, but the dollar amounts remain modest relative to the price move they coincided with.Stablecoin market cap posted its steepest monthly drop since TerraUSD, but falling USDT dominance alongside a price recovery — plus MiCA's new EU compliance requirements — complicates a simple "capital is fleeing" read.Tokenized equity volume hit a record $3.86 billion (+145%), with major banks and platforms building settlement infrastructure independent of crypto's price cycle.When price and open interest diverge, the divergence is usually more informative than the price move itself.
Looking Ahead
The question worth tracking into next week isn't whether Bitcoin holds $63,000. It's whether open interest starts expanding alongside price — the signal that would convert this week's squeeze into a demand-confirmed trend. Watch ETF flow size relative to price action, and watch whether USDT dominance keeps falling as a read on risk appetite, separate from the MiCA-driven reshuffling distorting the headline stablecoin numbers.
Discussion
Given that open interest fell while price rose this week, do you read Bitcoin's move as a genuine trend change — or a squeeze that unwinds once short positioning resets?
Genuine trend change, ETF flows will catch upPure short squeeze, fades once positioning resetsToo early to tell — need to see next week's OI dataMacro (inflation breakevens) matters more than either
Share your read below.
Sources: CoinDesk market coverage (July 6–7, 2026) on Bitcoin open interest, ETF flows, and stablecoin dominance; CoinDesk Daybook newsletter on inflation breakevens (July 6, 2026); Investing News Network crypto market recap (July 8, 2026); KuCoin research on RWA token market cap (July 2026).
#BitcoinRally #CryptoMarketAnalysi #TokenizedStocks
Fund Flow Friday: What Binance Stock Traders' Capital Movements Reveal This Week
What This Week's Market Rotation Reveals Across Crypto and Tokenized Stocks
Bitcoin just posted its best week since March, tokenized equity volume hit a record, and stablecoin dominance is falling. Here's what this week's fund flows actually reveal.
Bitcoin fell to $57,735 on July 1 — its weakest level in 21 months. Four days later, it had rallied nearly 7%, its best week since March.
That kind of reversal usually gets read as a bullish signal. The fund flow data underneath it tells a more complicated story — and that gap between the headline and the mechanics is exactly what this week's rotation is about.
Bitcoin's Rally Has a Structural Problem
Bitcoin recovered from $57,735 to above $63,000 this week, with price briefly touching $64,500 — a two-week high. On the surface, that reads as risk appetite returning to crypto.
The derivatives data says otherwise. BTC futures open interest slipped to 740,000 BTC, down from a July 3 high of 776,000 BTC, even as price kept climbing. Over $500 million in leveraged short positions were liquidated in a single 24-hour stretch, and shorts have accounted for the majority of liquidations for six straight days. That combination — rising price, falling open interest, one-sided liquidations — points to a short squeeze mechanically forcing the rally higher, not fresh buying conviction entering the market.
Spot demand tells the same story. U.S. spot Bitcoin ETFs snapped a 10-day losing streak this week, pulling in $221.7 million in one session and $265.69 million in another — both the largest single-day inflows in more than a month. That's a genuine improvement after June, the worst month on record for these products. But "best in two months" is a low bar coming off a historically weak stretch, and the sizing is small relative to the scale of the price move it's supposedly funding.
Why this matters: a squeeze-driven rally and a conviction-driven rally look identical on a price chart. They behave very differently once the squeeze exhausts itself.
Stablecoins Are Sending a Genuinely Bearish Signal — With a Catch
Stablecoin market cap fell to $312 billion in June, the largest monthly drop since the TerraUSD collapse. On its own, that reads as capital leaving crypto entirely.
But look at USDT's dominance rate — the share of the total crypto market held in Tether specifically — and the picture shifts. That dominance rate peaked at 9.35% last month, the highest level since the second half of 2022, before pulling back to 8.54% this week. Rising stablecoin dominance during a downturn, followed by a pullback as price recovers, is consistent with capital rotating out of a defensive stablecoin position and back into risk assets — not leaving the ecosystem.
There's a regulatory layer complicating this further. The EU's MiCA framework became fully operational on July 1, and Tether didn't submit the required electronic money issuance application in time — pushing USDT off licensed European exchanges. Circle's EURC, by contrast, is compliant, creating a real opening on regulated venues. Some of the June stablecoin cap decline may reflect this forced delisting rather than pure sentiment.
The distinction that matters: falling stablecoin cap plus falling USDT dominance during a price recovery is a different signal than falling stablecoin cap during a price decline. Context, not the number alone, tells you which one you're looking at.
Tokenized Equities Just Had Their Strongest Month on Record
While spot crypto trading volumes have struggled, tokenized stock volumes surged 145% to a record $3.86 billion. That's not a rounding error — it's the clearest sign yet that tokenized real-world assets are becoming a genuine parallel market rather than a niche experiment.
This is happening alongside expanding institutional infrastructure: Dinari and tZERO launched a joint turnkey platform for tokenized U.S. equities this week, and Swift rolled out a new blockchain ledger enabling 24/7 banking pilots across 17 major banks, including HSBC, UBS, Wells Fargo, and Citi. Separately, RWA tokens (tokenized gold, credit, funds, and treasuries) pushed their combined market cap above $63 billion, led by tokenized real-world credit and treasury products.
The read: institutional capital isn't waiting for crypto sentiment to fully recover before building tokenization infrastructure. That's a meaningfully different signal than retail speculation chasing a Bitcoin bounce.
Liquidity Diverged From Price This Week — That's the Real Tell
The single most useful data point from this week isn't the price move — it's the divergence between price and the metrics that normally confirm it.
$BTC rose. Open interest fell. ETF inflows improved but stayed modest relative to the price move. That combination is a textbook mismatch: price advancing on thinner conviction than the chart implies. Traders managing size should weight execution quality and order-book depth more heavily than the headline percentage move this week, since a squeeze-driven advance carries a different risk profile than one confirmed by expanding open interest and strengthening spot demand.
Trade your favorite pair here: Binance Spot Trading
Looking Beyond Individual Assets
The clearest theme this week isn't "Bitcoin is back" or "stablecoins signal fear." It's a market where three separate rotations are happening simultaneously and pulling in different directions: a mechanical short squeeze in Bitcoin, a regulatory-driven reshuffling in stablecoins, and a genuine institutional build-out in tokenized equities that isn't waiting on crypto sentiment to recover.
Macro conditions are adding a tailwind rather than a headwind for now — the 2-year inflation breakeven rate has dropped below the Fed's 2% target, and New York Fed President John Williams hasn't signaled any near-term appetite for a rate hike. That's constructive background, but it doesn't resolve the open-interest divergence sitting underneath Bitcoin's rally.
Key Takeaways
Bitcoin's 7% weekly rally was accompanied by falling open interest (776K → 740K BTC) and one-sided short liquidations — a squeeze signature, not confirmed fresh demand.Spot Bitcoin ETF inflows improved to their best levels in over a month, but the dollar amounts remain modest relative to the price move they coincided with.Stablecoin market cap posted its steepest monthly drop since TerraUSD, but falling USDT dominance alongside a price recovery — plus MiCA's new EU compliance requirements — complicates a simple "capital is fleeing" read.Tokenized equity volume hit a record $3.86 billion (+145%), with major banks and platforms building settlement infrastructure independent of crypto's price cycle.When price and open interest diverge, the divergence is usually more informative than the price move itself.
Looking Ahead
The question worth tracking into next week isn't whether Bitcoin holds $63,000. It's whether open interest starts expanding alongside price — the signal that would convert this week's squeeze into a demand-confirmed trend. Watch ETF flow size relative to price action, and watch whether USDT dominance keeps falling as a read on risk appetite, separate from the MiCA-driven reshuffling distorting the headline stablecoin numbers.
Discussion
Given that open interest fell while price rose this week, do you read Bitcoin's move as a genuine trend change — or a squeeze that unwinds once short positioning resets?
Genuine trend change, ETF flows will catch upPure short squeeze, fades once positioning resetsToo early to tell — need to see next week's OI dataMacro (inflation breakevens) matters more than either
Share your read below.
Sources: CoinDesk market coverage (July 6–7, 2026) on Bitcoin open interest, ETF flows, and stablecoin dominance; CoinDesk Daybook newsletter on inflation breakevens (July 6, 2026); Investing News Network crypto market recap (July 8, 2026); KuCoin research on RWA token market cap (July 2026).
#BitcoinRally #CryptoMarketAnalysi #TokenizedStocks
Bitcoin just posted its best week since March, tokenized equity volume hit a record, and stablecoin dominance is falling. Here's what this week's fund flows actually reveal.
Bitcoin fell to $57,735 on July 1 — its weakest level in 21 months. Four days later, it had rallied nearly 7%, its best week since March.
That kind of reversal usually gets read as a bullish signal. The fund flow data underneath it tells a more complicated story — and that gap between the headline and the mechanics is exactly what this week's rotation is about.
Bitcoin's Rally Has a Structural Problem
Bitcoin recovered from $57,735 to above $63,000 this week, with price briefly touching $64,500 — a two-week high. On the surface, that reads as risk appetite returning to crypto.
The derivatives data says otherwise. BTC futures open interest slipped to 740,000 BTC, down from a July 3 high of 776,000 BTC, even as price kept climbing. Over $500 million in leveraged short positions were liquidated in a single 24-hour stretch, and shorts have accounted for the majority of liquidations for six straight days. That combination — rising price, falling open interest, one-sided liquidations — points to a short squeeze mechanically forcing the rally higher, not fresh buying conviction entering the market.
Spot demand tells the same story. U.S. spot Bitcoin ETFs snapped a 10-day losing streak this week, pulling in $221.7 million in one session and $265.69 million in another — both the largest single-day inflows in more than a month. That's a genuine improvement after June, the worst month on record for these products. But "best in two months" is a low bar coming off a historically weak stretch, and the sizing is small relative to the scale of the price move it's supposedly funding.
Why this matters: a squeeze-driven rally and a conviction-driven rally look identical on a price chart. They behave very differently once the squeeze exhausts itself.
Stablecoins Are Sending a Genuinely Bearish Signal — With a Catch
Stablecoin market cap fell to $312 billion in June, the largest monthly drop since the TerraUSD collapse. On its own, that reads as capital leaving crypto entirely.
But look at USDT's dominance rate — the share of the total crypto market held in Tether specifically — and the picture shifts. That dominance rate peaked at 9.35% last month, the highest level since the second half of 2022, before pulling back to 8.54% this week. Rising stablecoin dominance during a downturn, followed by a pullback as price recovers, is consistent with capital rotating out of a defensive stablecoin position and back into risk assets — not leaving the ecosystem.
There's a regulatory layer complicating this further. The EU's MiCA framework became fully operational on July 1, and Tether didn't submit the required electronic money issuance application in time — pushing USDT off licensed European exchanges. Circle's EURC, by contrast, is compliant, creating a real opening on regulated venues. Some of the June stablecoin cap decline may reflect this forced delisting rather than pure sentiment.
The distinction that matters: falling stablecoin cap plus falling USDT dominance during a price recovery is a different signal than falling stablecoin cap during a price decline. Context, not the number alone, tells you which one you're looking at.
Tokenized Equities Just Had Their Strongest Month on Record
While spot crypto trading volumes have struggled, tokenized stock volumes surged 145% to a record $3.86 billion. That's not a rounding error — it's the clearest sign yet that tokenized real-world assets are becoming a genuine parallel market rather than a niche experiment.
This is happening alongside expanding institutional infrastructure: Dinari and tZERO launched a joint turnkey platform for tokenized U.S. equities this week, and Swift rolled out a new blockchain ledger enabling 24/7 banking pilots across 17 major banks, including HSBC, UBS, Wells Fargo, and Citi. Separately, RWA tokens (tokenized gold, credit, funds, and treasuries) pushed their combined market cap above $63 billion, led by tokenized real-world credit and treasury products.
The read: institutional capital isn't waiting for crypto sentiment to fully recover before building tokenization infrastructure. That's a meaningfully different signal than retail speculation chasing a Bitcoin bounce.
Liquidity Diverged From Price This Week — That's the Real Tell
The single most useful data point from this week isn't the price move — it's the divergence between price and the metrics that normally confirm it.
$BTC rose. Open interest fell. ETF inflows improved but stayed modest relative to the price move. That combination is a textbook mismatch: price advancing on thinner conviction than the chart implies. Traders managing size should weight execution quality and order-book depth more heavily than the headline percentage move this week, since a squeeze-driven advance carries a different risk profile than one confirmed by expanding open interest and strengthening spot demand.
Trade your favorite pair here: Binance Spot Trading
Looking Beyond Individual Assets
The clearest theme this week isn't "Bitcoin is back" or "stablecoins signal fear." It's a market where three separate rotations are happening simultaneously and pulling in different directions: a mechanical short squeeze in Bitcoin, a regulatory-driven reshuffling in stablecoins, and a genuine institutional build-out in tokenized equities that isn't waiting on crypto sentiment to recover.
Macro conditions are adding a tailwind rather than a headwind for now — the 2-year inflation breakeven rate has dropped below the Fed's 2% target, and New York Fed President John Williams hasn't signaled any near-term appetite for a rate hike. That's constructive background, but it doesn't resolve the open-interest divergence sitting underneath Bitcoin's rally.
Key Takeaways
Bitcoin's 7% weekly rally was accompanied by falling open interest (776K → 740K BTC) and one-sided short liquidations — a squeeze signature, not confirmed fresh demand.Spot Bitcoin ETF inflows improved to their best levels in over a month, but the dollar amounts remain modest relative to the price move they coincided with.Stablecoin market cap posted its steepest monthly drop since TerraUSD, but falling USDT dominance alongside a price recovery — plus MiCA's new EU compliance requirements — complicates a simple "capital is fleeing" read.Tokenized equity volume hit a record $3.86 billion (+145%), with major banks and platforms building settlement infrastructure independent of crypto's price cycle.When price and open interest diverge, the divergence is usually more informative than the price move itself.
Looking Ahead
The question worth tracking into next week isn't whether Bitcoin holds $63,000. It's whether open interest starts expanding alongside price — the signal that would convert this week's squeeze into a demand-confirmed trend. Watch ETF flow size relative to price action, and watch whether USDT dominance keeps falling as a read on risk appetite, separate from the MiCA-driven reshuffling distorting the headline stablecoin numbers.
Discussion
Given that open interest fell while price rose this week, do you read Bitcoin's move as a genuine trend change — or a squeeze that unwinds once short positioning resets?
Genuine trend change, ETF flows will catch upPure short squeeze, fades once positioning resetsToo early to tell — need to see next week's OI dataMacro (inflation breakevens) matters more than either
Share your read below.
Sources: CoinDesk market coverage (July 6–7, 2026) on Bitcoin open interest, ETF flows, and stablecoin dominance; CoinDesk Daybook newsletter on inflation breakevens (July 6, 2026); Investing News Network crypto market recap (July 8, 2026); KuCoin research on RWA token market cap (July 2026).
#BitcoinRally #CryptoMarketAnalysi #TokenizedStocks
74
Log in to explore more content
Join global crypto users on Binance Square
⚡️ Get latest and useful information about crypto.
💬 Trusted by the world’s largest crypto exchange.
👍 Discover real insights from verified creators.
Email / Phone number
Trending Topics
1
#HuangRisksOusterOverReportedAffairWithSubordinate
8,215 views
161 Discussing
2
#AnthropicRejectsIPODelayValuationinQuestion
433,999 views
3,684 Discussing
3
#CoreWeaveJumps10%On168%RevenueGrowth
50,023 views
716 Discussing
4
#ZcashFallsBelow$1000ForFirstTimeSinceSeptember
25,862 views
136 Discussing
5
#CanNvidiaEarningsEaseMarketConcerns?
151,724 views
1,660 Discussing
6
#SolanaCompanyReports$3.4MQ3Revenue
153 views
6 Discussing
7
#StrategyMetaplanetLoseMSCIIndexMembership
1,996 views
52 Discussing
8
#tZEROWinsCFTCApprovalForRegulatedDerivativesExchange
204 views
8 Discussing
9
#HotCPIDecemberHikePriced
461,367 views
3,686 Discussing
10
#StablecoinSupplyDrops$14.2BIn30Days
423 views
8 Discussing