
#bitcoinfallsbelow$57ktotwoyearlow
bitcoinfallsbelow$57ktotwoyearlow
7,639 views
64 Discussing
Hot
Latest

·
--
Article
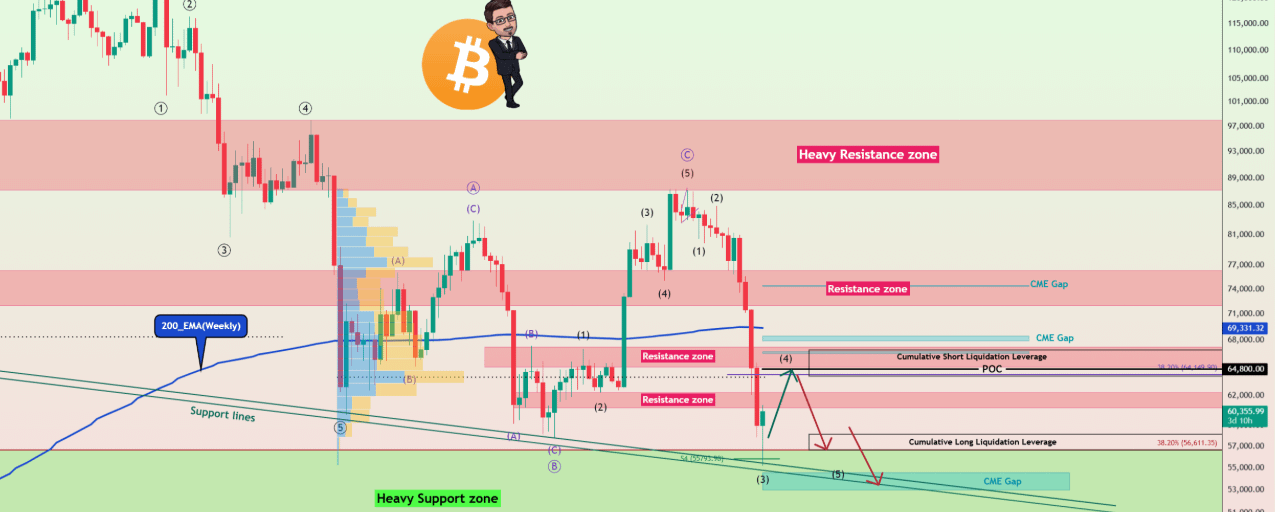
Bitcoin's Roadmap After $55K — Is a Short Squeeze to $68K Next?BTC has experienced a brutal sell-off over the past two weeks, eventually plunging to $55,130 as fear spread across global financial markets.
⠀
Weakness in U.S. equities, particularly AI-related stocks, has amplified the decline, while higher-rate expectations and deteriorating crypto liquidity continue to pressure risk assets.
⠀
But after such an aggressive liquidation event, I think the question is starting to change.
⠀
How much downside is really left before $BTC attempts a major corrective recovery?
⠀
Macro & Technical Structure
⠀
For the broader structure, I’m focusing on the 4-day time frame.
⠀
Bitcoin recently broke below the Weekly 200 SMA, but yesterday’s decline finally attracted buyers inside my Heavy Support Zone around ($48,200-$56,600) and near several important Support Lines.
⠀
The first reaction was strong.
⠀
If the Daily candle develops into a high-volume Hammer, it would strengthen the possibility that Bitcoin is entering a short-term bottoming process.
⠀
However, one bullish candle would not be enough for me to call the broader bearish trend over.
⠀
Elliott Wave | Is Wave 3 Ending?
⠀
From an Elliott Wave perspective, I believe bearish Wave 3 may be approaching completion.
⠀
If this interpretation is correct, Bitcoin could now begin corrective Wave 4.
⠀
That move could force significant Short covering and potentially push BTC toward the ($67,000-$68,000) area.
⠀
A deeper Wave 4 recovery could also influence the eventual size of Wave 5, depending on how the structure develops.
⠀
Order Flow | Is Selling Pressure Finally Exhausting?
⠀
This is where the setup becomes much more interesting.
⠀
The Coinbase Bitcoin Premium Index was around -0.17% in my latest review, compared with a 30-day average near -0.14% and a one-year average near -0.06%.
⠀
U.S. Spot demand is still clearly weak.
⠀
But while Bitcoin continued making lower price lows, the Coinbase Premium did not make an equally extreme new low.
⠀
That creates a potential bullish divergence and suggests relative selling pressure on Coinbase may be starting to weaken.
⠀
Open Interest has also gone through a major reset.
⠀
Across exchanges, OI dropped from roughly $17.9B toward $16.0B before recovering near $16.5B.
⠀
On Binance, Open Interest fell from around $8.65B to below $7.9B before rebounding toward $8.3B.
⠀
Funding Rates briefly turned negative before recovering toward slightly positive territory.
⠀
For me, this combination suggests that a significant amount of excessive leverage has already been flushed out of the market.
⠀
CVD Is Still the Main Warning
⠀
I’m not calling a confirmed trend reversal yet.
⠀
Futures / Spot CVD remain negative:
⠀
Weekly: -325.4B / -73.8B
⠀
Daily: -15.32B / -4.29B
⠀
4H: -21.42B / -1.54B
⠀
These are cumulative readings from different chart views, so they should not be treated as identical-period volume comparisons.
⠀
Taker Buy ratios also remain below 50%:
⠀
Weekly: 49.7%
⠀
Daily: 49.9%
⠀
4H: 49.2%
⠀
So sellers still control the broader order-flow picture.
⠀
However, the bullish divergence now developing on the 4-hour CVD suggests local selling momentum may finally be weakening.
⠀
$3.06B in Shorts | The Short-Squeeze Setup
⠀
One number caught my attention more than anything else.
⠀
At the time of writing, the liquidation map I’m monitoring shows approximately $3.06B in potential Short Liquidations above the market versus only around $596M in potential Long Liquidations below.
⠀
That is more than a 5x imbalance.
⠀
This does not guarantee Bitcoin will move higher.
⠀
But if buyers can generate momentum, the liquidity sitting above price becomes extremely interesting.
⠀
Combined with lower Open Interest, cooled Funding, the Coinbase Premium divergence, and the 4H CVD divergence, the conditions for a Short Squeeze are becoming increasingly attractive.
⠀
Daily RSI | An Extreme Historical Area
⠀
Another signal I’m watching closely is the Daily RSI.
⠀
Bitcoin’s RSI recently dropped toward the 17-18 area, an extremely oversold reading on its 0-to-100 scale.
⠀
Historically, Bitcoin has repeatedly formed important local bottoms when Daily RSI reached similar extremes, with several of those episodes followed by recoveries exceeding 30%.
⠀
In some cases, Bitcoin first made another price low while RSI formed a higher low, creating Positive Regular Divergence before the stronger recovery began.
⠀
That behavior fits well with my current Wave 4 scenario.
⠀
But RSI alone is not confirmation of a bottom.
⠀
My Weekend Outlook
⠀
I expect Bitcoin to potentially extend its bullish recovery over the weekend while traditional financial markets remain closed.
⠀
The first major test is the Resistance Zone around ($60,750-$62,270).
⠀
A confirmed breakout above this area could open the way toward the key $63,900 trading level.
⠀
Above that, the Short Liquidation zone around ($64,000-$66,870) and Resistance Zone around ($65,000-$67,160) become the next major targets.
⠀
This is where a Short Squeeze could become significantly more aggressive.
⠀
However, I remain cautious about the broader market.
⠀
Major U.S. stock indices have lost important support levels, and another wave of equity selling next week could quickly put Bitcoin under pressure again.
⠀
For that reason, even a strong recovery toward $67,000-$68,000 would still be a corrective Wave 4 move in my view — not confirmation of a new bullish trend.
⠀
Key Levels I’m Watching
⠀
Key Trading Levels: $63,900 / $64,800 / $68,330
⠀
Recent Long Liquidation Zone: ($56,620-$58,120)
⠀
CME Gap: ($66,475-$66,650)
⠀
CME Gap: ($67,875-$68,420)
⠀
CME Gap: ($74,300-$74,460)
⠀
Lower CME Gap: ($52,980-$54,545)
⠀
The Most Important Level
⠀
Until Bitcoin reclaims the Weekly 200 MA area and the key $68,330 trading level, I believe the probability of a sustainable bullish reversal remains relatively low.
⠀
A powerful Short Squeeze is possible.
⠀
A Wave 4 recovery toward $67,000-$68,000 is possible.
⠀
But the broader bearish structure has not yet been invalidated.
⠀
For now, I’m watching whether this extreme liquidation event marks the end of the strongest part of the correction — or simply a pause before Bitcoin moves lower again.
#BitcoinFallsBelow$57KToTwoYearLow
Bitcoin's Roadmap After $55K — Is a Short Squeeze to $68K Next?
BTC has experienced a brutal sell-off over the past two weeks, eventually plunging to $55,130 as fear spread across global financial markets.
⠀
Weakness in U.S. equities, particularly AI-related stocks, has amplified the decline, while higher-rate expectations and deteriorating crypto liquidity continue to pressure risk assets.
⠀
But after such an aggressive liquidation event, I think the question is starting to change.
⠀
How much downside is really left before $BTC attempts a major corrective recovery?
⠀
Macro & Technical Structure
⠀
For the broader structure, I’m focusing on the 4-day time frame.
⠀
Bitcoin recently broke below the Weekly 200 SMA, but yesterday’s decline finally attracted buyers inside my Heavy Support Zone around ($48,200-$56,600) and near several important Support Lines.
⠀
The first reaction was strong.
⠀
If the Daily candle develops into a high-volume Hammer, it would strengthen the possibility that Bitcoin is entering a short-term bottoming process.
⠀
However, one bullish candle would not be enough for me to call the broader bearish trend over.
⠀
Elliott Wave | Is Wave 3 Ending?
⠀
From an Elliott Wave perspective, I believe bearish Wave 3 may be approaching completion.
⠀
If this interpretation is correct, Bitcoin could now begin corrective Wave 4.
⠀
That move could force significant Short covering and potentially push BTC toward the ($67,000-$68,000) area.
⠀
A deeper Wave 4 recovery could also influence the eventual size of Wave 5, depending on how the structure develops.
⠀
Order Flow | Is Selling Pressure Finally Exhausting?
⠀
This is where the setup becomes much more interesting.
⠀
The Coinbase Bitcoin Premium Index was around -0.17% in my latest review, compared with a 30-day average near -0.14% and a one-year average near -0.06%.
⠀
U.S. Spot demand is still clearly weak.
⠀
But while Bitcoin continued making lower price lows, the Coinbase Premium did not make an equally extreme new low.
⠀
That creates a potential bullish divergence and suggests relative selling pressure on Coinbase may be starting to weaken.
⠀
Open Interest has also gone through a major reset.
⠀
Across exchanges, OI dropped from roughly $17.9B toward $16.0B before recovering near $16.5B.
⠀
On Binance, Open Interest fell from around $8.65B to below $7.9B before rebounding toward $8.3B.
⠀
Funding Rates briefly turned negative before recovering toward slightly positive territory.
⠀
For me, this combination suggests that a significant amount of excessive leverage has already been flushed out of the market.
⠀
CVD Is Still the Main Warning
⠀
I’m not calling a confirmed trend reversal yet.
⠀
Futures / Spot CVD remain negative:
⠀
Weekly: -325.4B / -73.8B
⠀
Daily: -15.32B / -4.29B
⠀
4H: -21.42B / -1.54B
⠀
These are cumulative readings from different chart views, so they should not be treated as identical-period volume comparisons.
⠀
Taker Buy ratios also remain below 50%:
⠀
Weekly: 49.7%
⠀
Daily: 49.9%
⠀
4H: 49.2%
⠀
So sellers still control the broader order-flow picture.
⠀
However, the bullish divergence now developing on the 4-hour CVD suggests local selling momentum may finally be weakening.
⠀
$3.06B in Shorts | The Short-Squeeze Setup
⠀
One number caught my attention more than anything else.
⠀
At the time of writing, the liquidation map I’m monitoring shows approximately $3.06B in potential Short Liquidations above the market versus only around $596M in potential Long Liquidations below.
⠀
That is more than a 5x imbalance.
⠀
This does not guarantee Bitcoin will move higher.
⠀
But if buyers can generate momentum, the liquidity sitting above price becomes extremely interesting.
⠀
Combined with lower Open Interest, cooled Funding, the Coinbase Premium divergence, and the 4H CVD divergence, the conditions for a Short Squeeze are becoming increasingly attractive.
⠀
Daily RSI | An Extreme Historical Area
⠀
Another signal I’m watching closely is the Daily RSI.
⠀
Bitcoin’s RSI recently dropped toward the 17-18 area, an extremely oversold reading on its 0-to-100 scale.
⠀
Historically, Bitcoin has repeatedly formed important local bottoms when Daily RSI reached similar extremes, with several of those episodes followed by recoveries exceeding 30%.
⠀
In some cases, Bitcoin first made another price low while RSI formed a higher low, creating Positive Regular Divergence before the stronger recovery began.
⠀
That behavior fits well with my current Wave 4 scenario.
⠀
But RSI alone is not confirmation of a bottom.
⠀
My Weekend Outlook
⠀
I expect Bitcoin to potentially extend its bullish recovery over the weekend while traditional financial markets remain closed.
⠀
The first major test is the Resistance Zone around ($60,750-$62,270).
⠀
A confirmed breakout above this area could open the way toward the key $63,900 trading level.
⠀
Above that, the Short Liquidation zone around ($64,000-$66,870) and Resistance Zone around ($65,000-$67,160) become the next major targets.
⠀
This is where a Short Squeeze could become significantly more aggressive.
⠀
However, I remain cautious about the broader market.
⠀
Major U.S. stock indices have lost important support levels, and another wave of equity selling next week could quickly put Bitcoin under pressure again.
⠀
For that reason, even a strong recovery toward $67,000-$68,000 would still be a corrective Wave 4 move in my view — not confirmation of a new bullish trend.
⠀
Key Levels I’m Watching
⠀
Key Trading Levels: $63,900 / $64,800 / $68,330
⠀
Recent Long Liquidation Zone: ($56,620-$58,120)
⠀
CME Gap: ($66,475-$66,650)
⠀
CME Gap: ($67,875-$68,420)
⠀
CME Gap: ($74,300-$74,460)
⠀
Lower CME Gap: ($52,980-$54,545)
⠀
The Most Important Level
⠀
Until Bitcoin reclaims the Weekly 200 MA area and the key $68,330 trading level, I believe the probability of a sustainable bullish reversal remains relatively low.
⠀
A powerful Short Squeeze is possible.
⠀
A Wave 4 recovery toward $67,000-$68,000 is possible.
⠀
But the broader bearish structure has not yet been invalidated.
⠀
For now, I’m watching whether this extreme liquidation event marks the end of the strongest part of the correction — or simply a pause before Bitcoin moves lower again.
#BitcoinFallsBelow$57KToTwoYearLow
⠀
Weakness in U.S. equities, particularly AI-related stocks, has amplified the decline, while higher-rate expectations and deteriorating crypto liquidity continue to pressure risk assets.
⠀
But after such an aggressive liquidation event, I think the question is starting to change.
⠀
How much downside is really left before $BTC attempts a major corrective recovery?
⠀
Macro & Technical Structure
⠀
For the broader structure, I’m focusing on the 4-day time frame.
⠀
Bitcoin recently broke below the Weekly 200 SMA, but yesterday’s decline finally attracted buyers inside my Heavy Support Zone around ($48,200-$56,600) and near several important Support Lines.
⠀
The first reaction was strong.
⠀
If the Daily candle develops into a high-volume Hammer, it would strengthen the possibility that Bitcoin is entering a short-term bottoming process.
⠀
However, one bullish candle would not be enough for me to call the broader bearish trend over.
⠀
Elliott Wave | Is Wave 3 Ending?
⠀
From an Elliott Wave perspective, I believe bearish Wave 3 may be approaching completion.
⠀
If this interpretation is correct, Bitcoin could now begin corrective Wave 4.
⠀
That move could force significant Short covering and potentially push BTC toward the ($67,000-$68,000) area.
⠀
A deeper Wave 4 recovery could also influence the eventual size of Wave 5, depending on how the structure develops.
⠀
Order Flow | Is Selling Pressure Finally Exhausting?
⠀
This is where the setup becomes much more interesting.
⠀
The Coinbase Bitcoin Premium Index was around -0.17% in my latest review, compared with a 30-day average near -0.14% and a one-year average near -0.06%.
⠀
U.S. Spot demand is still clearly weak.
⠀
But while Bitcoin continued making lower price lows, the Coinbase Premium did not make an equally extreme new low.
⠀
That creates a potential bullish divergence and suggests relative selling pressure on Coinbase may be starting to weaken.
⠀
Open Interest has also gone through a major reset.
⠀
Across exchanges, OI dropped from roughly $17.9B toward $16.0B before recovering near $16.5B.
⠀
On Binance, Open Interest fell from around $8.65B to below $7.9B before rebounding toward $8.3B.
⠀
Funding Rates briefly turned negative before recovering toward slightly positive territory.
⠀
For me, this combination suggests that a significant amount of excessive leverage has already been flushed out of the market.
⠀
CVD Is Still the Main Warning
⠀
I’m not calling a confirmed trend reversal yet.
⠀
Futures / Spot CVD remain negative:
⠀
Weekly: -325.4B / -73.8B
⠀
Daily: -15.32B / -4.29B
⠀
4H: -21.42B / -1.54B
⠀
These are cumulative readings from different chart views, so they should not be treated as identical-period volume comparisons.
⠀
Taker Buy ratios also remain below 50%:
⠀
Weekly: 49.7%
⠀
Daily: 49.9%
⠀
4H: 49.2%
⠀
So sellers still control the broader order-flow picture.
⠀
However, the bullish divergence now developing on the 4-hour CVD suggests local selling momentum may finally be weakening.
⠀
$3.06B in Shorts | The Short-Squeeze Setup
⠀
One number caught my attention more than anything else.
⠀
At the time of writing, the liquidation map I’m monitoring shows approximately $3.06B in potential Short Liquidations above the market versus only around $596M in potential Long Liquidations below.
⠀
That is more than a 5x imbalance.
⠀
This does not guarantee Bitcoin will move higher.
⠀
But if buyers can generate momentum, the liquidity sitting above price becomes extremely interesting.
⠀
Combined with lower Open Interest, cooled Funding, the Coinbase Premium divergence, and the 4H CVD divergence, the conditions for a Short Squeeze are becoming increasingly attractive.
⠀
Daily RSI | An Extreme Historical Area
⠀
Another signal I’m watching closely is the Daily RSI.
⠀
Bitcoin’s RSI recently dropped toward the 17-18 area, an extremely oversold reading on its 0-to-100 scale.
⠀
Historically, Bitcoin has repeatedly formed important local bottoms when Daily RSI reached similar extremes, with several of those episodes followed by recoveries exceeding 30%.
⠀
In some cases, Bitcoin first made another price low while RSI formed a higher low, creating Positive Regular Divergence before the stronger recovery began.
⠀
That behavior fits well with my current Wave 4 scenario.
⠀
But RSI alone is not confirmation of a bottom.
⠀
My Weekend Outlook
⠀
I expect Bitcoin to potentially extend its bullish recovery over the weekend while traditional financial markets remain closed.
⠀
The first major test is the Resistance Zone around ($60,750-$62,270).
⠀
A confirmed breakout above this area could open the way toward the key $63,900 trading level.
⠀
Above that, the Short Liquidation zone around ($64,000-$66,870) and Resistance Zone around ($65,000-$67,160) become the next major targets.
⠀
This is where a Short Squeeze could become significantly more aggressive.
⠀
However, I remain cautious about the broader market.
⠀
Major U.S. stock indices have lost important support levels, and another wave of equity selling next week could quickly put Bitcoin under pressure again.
⠀
For that reason, even a strong recovery toward $67,000-$68,000 would still be a corrective Wave 4 move in my view — not confirmation of a new bullish trend.
⠀
Key Levels I’m Watching
⠀
Key Trading Levels: $63,900 / $64,800 / $68,330
⠀
Recent Long Liquidation Zone: ($56,620-$58,120)
⠀
CME Gap: ($66,475-$66,650)
⠀
CME Gap: ($67,875-$68,420)
⠀
CME Gap: ($74,300-$74,460)
⠀
Lower CME Gap: ($52,980-$54,545)
⠀
The Most Important Level
⠀
Until Bitcoin reclaims the Weekly 200 MA area and the key $68,330 trading level, I believe the probability of a sustainable bullish reversal remains relatively low.
⠀
A powerful Short Squeeze is possible.
⠀
A Wave 4 recovery toward $67,000-$68,000 is possible.
⠀
But the broader bearish structure has not yet been invalidated.
⠀
For now, I’m watching whether this extreme liquidation event marks the end of the strongest part of the correction — or simply a pause before Bitcoin moves lower again.
#BitcoinFallsBelow$57KToTwoYearLow
profe 25:
se cumplió bajó a 55 ahora ira a 37k.
2
6
4.5k

Article
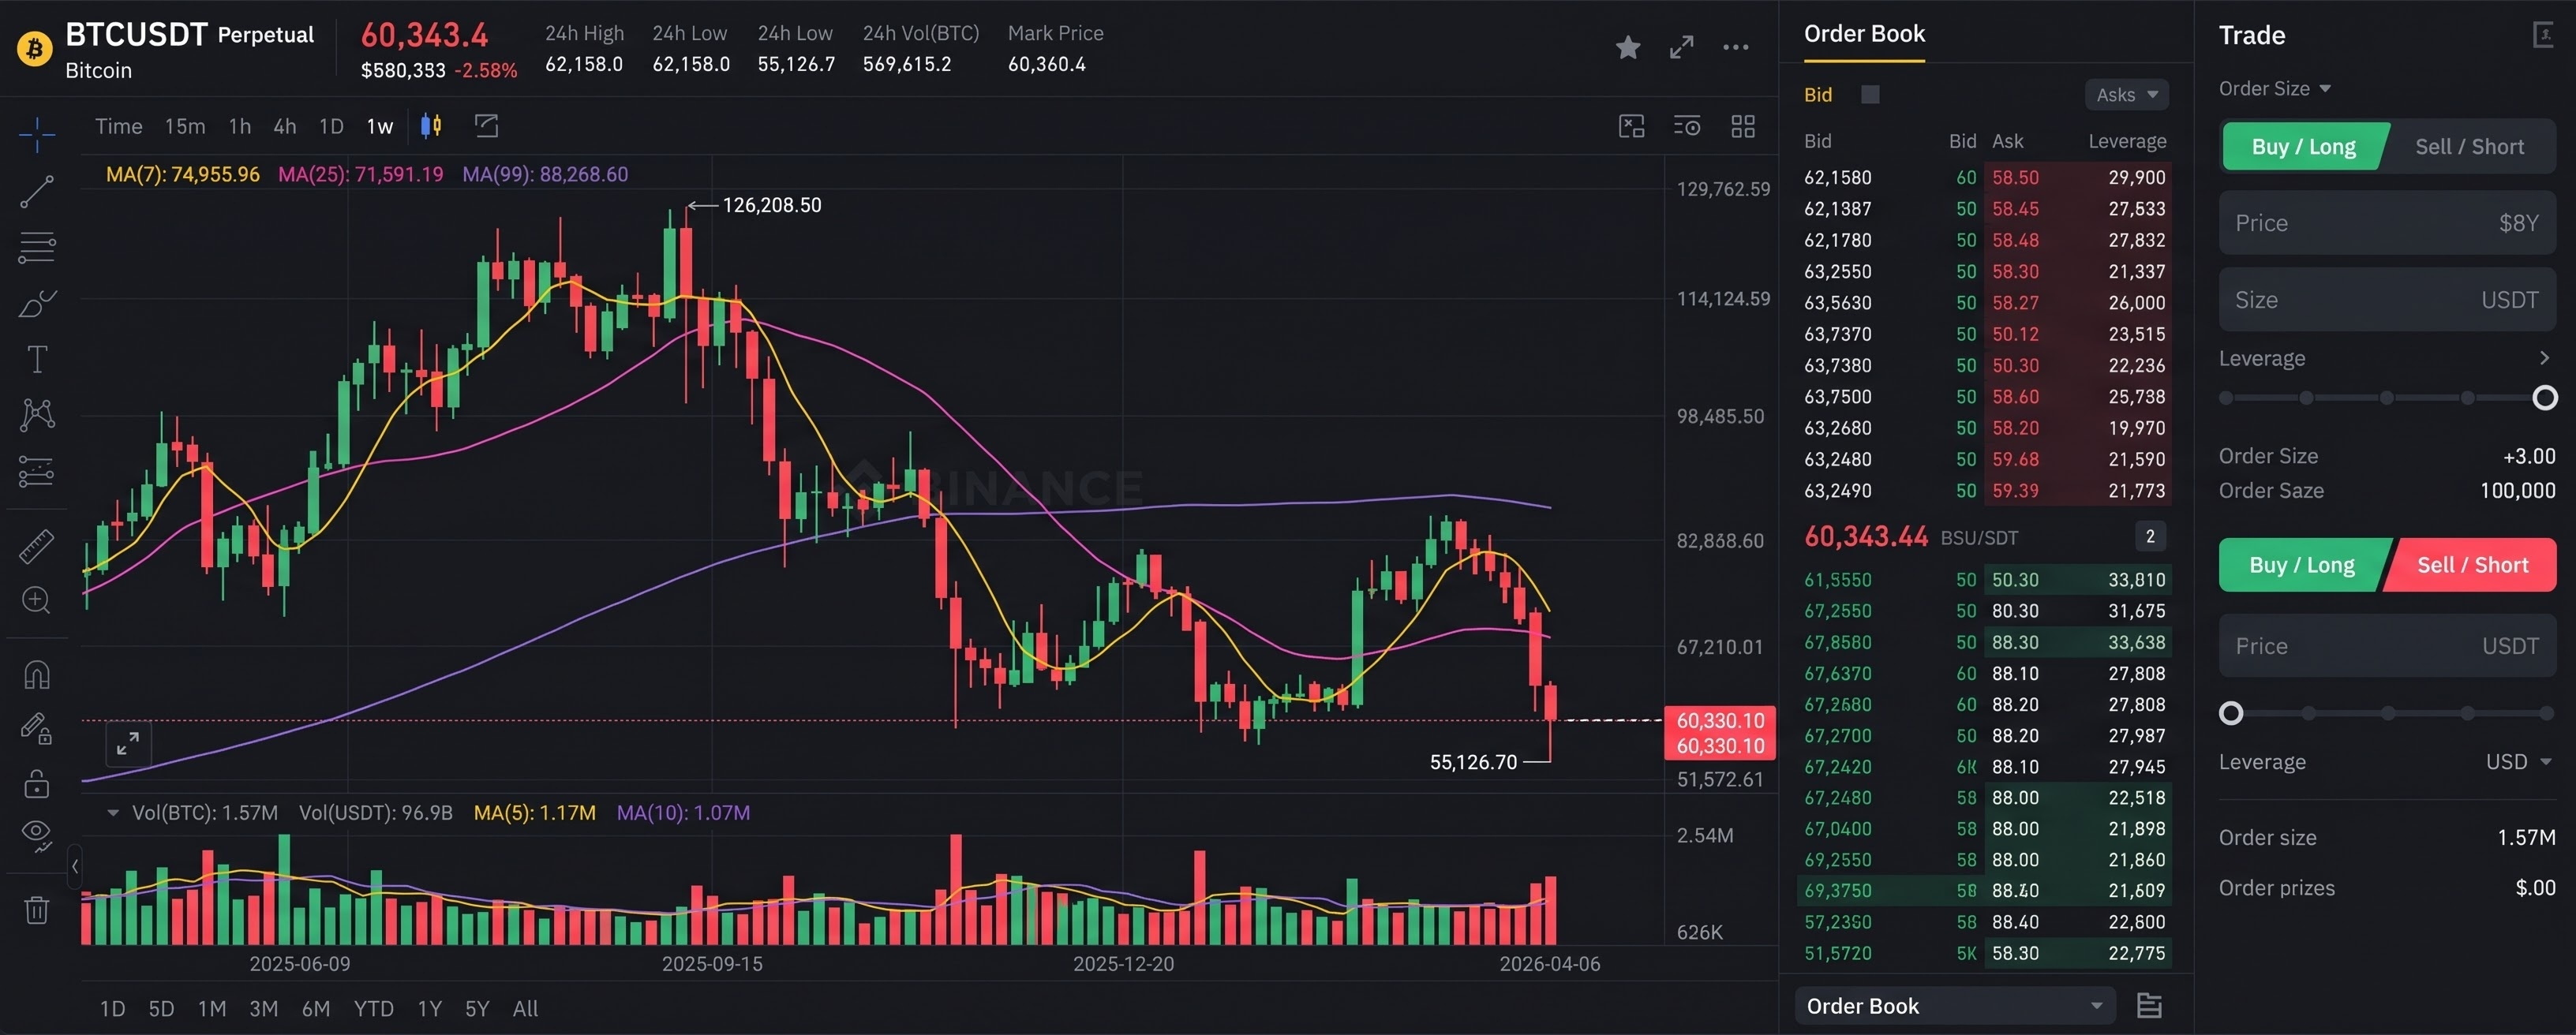
Bitcoin Wicks to $55,126 Two-Year Low Before Reclaiming $60K: Capitulation or Trap?BTC just delivered a textbook liquidity sweep. After breaking below $57K to hit a two-year low of $55,126 on Binance Futures, buyers stepped in aggressively to push price back above $60,340 on massive $33.3B 24-hour volume.
📊 What the Weekly Chart Tells Us:
• Deep Discount: BTC is down over 50% from its $126,208 peak, flushing out over-leveraged longs.
• Overhead Hurdles: Bulls need to reclaim the 1W MA(25) near $71,590 and MA(7) around $74,955 to restore bullish structure.
• Critical Support: Holding the $55K–$58K zone into the weekly close is vital to prevent deeper downside.
🛡️ Trader Playbook: Extreme fear creates opportunity, not an excuse to over-leverage. Let the weekly candle settle, size your positions conservatively, and protect your capital.
Are you buying spot on this dip or waiting for a reclaim above $62.2K? Share your setup below 👇
$BTC $ETH $EVAA
{future}(EVAAUSDT)
{future}(BTCUSDT)
{future}(ETHUSDT)
#bitcoinfallsbelow$57ktotwoyearlow #BTC #CryptoTrading #BinanceSquare
Bitcoin Wicks to $55,126 Two-Year Low Before Reclaiming $60K: Capitulation or Trap?
BTC just delivered a textbook liquidity sweep. After breaking below $57K to hit a two-year low of $55,126 on Binance Futures, buyers stepped in aggressively to push price back above $60,340 on massive $33.3B 24-hour volume.
📊 What the Weekly Chart Tells Us:
• Deep Discount: BTC is down over 50% from its $126,208 peak, flushing out over-leveraged longs.
• Overhead Hurdles: Bulls need to reclaim the 1W MA(25) near $71,590 and MA(7) around $74,955 to restore bullish structure.
• Critical Support: Holding the $55K–$58K zone into the weekly close is vital to prevent deeper downside.
🛡️ Trader Playbook: Extreme fear creates opportunity, not an excuse to over-leverage. Let the weekly candle settle, size your positions conservatively, and protect your capital.
Are you buying spot on this dip or waiting for a reclaim above $62.2K? Share your setup below 👇
$BTC $ETH $EVAA
#bitcoinfallsbelow$57ktotwoyearlow #BTC #CryptoTrading #BinanceSquare
📊 What the Weekly Chart Tells Us:
• Deep Discount: BTC is down over 50% from its $126,208 peak, flushing out over-leveraged longs.
• Overhead Hurdles: Bulls need to reclaim the 1W MA(25) near $71,590 and MA(7) around $74,955 to restore bullish structure.
• Critical Support: Holding the $55K–$58K zone into the weekly close is vital to prevent deeper downside.
🛡️ Trader Playbook: Extreme fear creates opportunity, not an excuse to over-leverage. Let the weekly candle settle, size your positions conservatively, and protect your capital.
Are you buying spot on this dip or waiting for a reclaim above $62.2K? Share your setup below 👇
$BTC $ETH $EVAA
#bitcoinfallsbelow$57ktotwoyearlow #BTC #CryptoTrading #BinanceSquare
幂达:
这根55,126的插针更像流动性横扫,收回6万说明下方有人接,但关键还是周线能不能收在55,000-58,000这个区间之上。我的做法是62,200没收回之前只小仓分批接现货,把62,200当成确认信号而不是追涨点——毕竟上方71,590的周线MA25还远,结构要转多没那么快。
6
3
4.4k
Article
BITCOIN FALLS BELOW $57K TO TWO-YEAR LOW!🔴 BITCOIN FALLS BELOW $57K TO TWO-YEAR LOW!
THEN BOUNCES +9% IN HOURS!
$55,181 → $60,349! Wildest Saturday Ever!
📅 Date: Saturday, Nov 21, 2026!
🪙 Coin: Bitcoin — $BTC!
📰 Source: Reuters / CoinDesk / CoinGecko / Coin Bureau!
THE CRASH!
| Time | Price | What Happened |
| --- | --- | --- |
| Fri Evening | Below $60K | First Time Since July! |
| Fri 11:13 PM ET | $55,830 | -5.1% — Reuters Low! |
| Sat 1 AM ET | $55,106 | Coinbase Low! |
| Sat Morning (Your Screenshot) | $55,181 | Coin Bureau Low! |
| Sat Later | $60,349 | +9% BOUNCE! +$5,168! |
💡 Lowest Since SEPTEMBER 2024 — 2+ Years!
💡 Election Rally COMPLETELY Erased!
💡 Broke June Low $57,700!
FROM TOP TO BOTTOM!
| Metric | Value |
| --- | --- |
| ATH Oct 2025 | $126,080 |
| Sat Low | $55,106 |
| Drop From ATH | -56%! |
| This Quarter | -28% / -29%! |
| This Month | -30%+! |
| This Week | -13.7%! |
LIQUIDATION BLOODBATH!
💥 $2.4 BILLION To $2.67 BILLION Liquidated In 24H! (CoinGlass)
💥 BTC Longs: $1B+ To $1.3B Wiped!
💥 ETH: $545M Wiped!
💥 Biggest Single: $51.71M BTC Long Gone!
💥 271,500+ Traders Liquidated!
WHY CRASHED?
1️⃣ AI BUBBLE FEAR — Nvidia -14% Friday, -$494B!
2️⃣ IBIT OUTFLOW — BlackRock -$541M Record!
3️⃣ RATE HIKE FEAR — Fed Hawkish!
4️⃣ LEVERAGE TRAP — Everyone Long, Nobody Expected Below $60K!
5️⃣ RISK-OFF — Stocks, Gold, Copper, Crypto ALL Down!
THE BOUNCE — YOUR SCREENSHOT!
🟢 Coin Bureau (2h ago):
"JUST IN: Bitcoin BTC has ripped back above $60,000, after crashing to $55,181 this morning. That's a 9% bounce from today's low."
🟢 Chart: $55,181 → $60,349 In Hours!
💡 Glassnode: Biggest Bids Since August At $60K — Buyers Stepped In!
BUT — STILL DANGER?
🔴 CryptoQuant: $950 BILLION In BTC Now Underwater — ALL-TIME HIGH!
🔴 Market Cap: $1.17T!
🔴 24H Volume: $68.2B!
🔴 ETH: $1,590 (-8.5%), SOL: $66.98, XRP: $0.88!
💡 Next Levels: Hold $55,100 Or $50,000 Next! Resist $62,500!
THE BIG QUESTION:
Was $55,181 The Bottom Or Just A Dead Cat Bounce?
Your call? 👇
BOTTOM IS IN 🟢
$50K COMING 🔴
BOUGHT THE DIP 🟡
#BitcoinFallsBelow$57KToTwoYearLow
#bitcoin #BTC #cryptocrash #Binance
$BTC $ETH $SOL
BITCOIN FALLS BELOW $57K TO TWO-YEAR LOW!
🔴 BITCOIN FALLS BELOW $57K TO TWO-YEAR LOW!
THEN BOUNCES +9% IN HOURS!
$55,181 → $60,349! Wildest Saturday Ever!
📅 Date: Saturday, Nov 21, 2026!
🪙 Coin: Bitcoin — $BTC !
📰 Source: Reuters / CoinDesk / CoinGecko / Coin Bureau!
THE CRASH!
| Time | Price | What Happened |
| --- | --- | --- |
| Fri Evening | Below $60K | First Time Since July! |
| Fri 11:13 PM ET | $55,830 | -5.1% — Reuters Low! |
| Sat 1 AM ET | $55,106 | Coinbase Low! |
| Sat Morning (Your Screenshot) | $55,181 | Coin Bureau Low! |
| Sat Later | $60,349 | +9% BOUNCE! +$5,168! |
💡 Lowest Since SEPTEMBER 2024 — 2+ Years!
💡 Election Rally COMPLETELY Erased!
💡 Broke June Low $57,700!
FROM TOP TO BOTTOM!
| Metric | Value |
| --- | --- |
| ATH Oct 2025 | $126,080 |
| Sat Low | $55,106 |
| Drop From ATH | -56%! |
| This Quarter | -28% / -29%! |
| This Month | -30%+! |
| This Week | -13.7%! |
LIQUIDATION BLOODBATH!
💥 $2.4 BILLION To $2.67 BILLION Liquidated In 24H! (CoinGlass)
💥 BTC Longs: $1B+ To $1.3B Wiped!
💥 ETH: $545M Wiped!
💥 Biggest Single: $51.71M BTC Long Gone!
💥 271,500+ Traders Liquidated!
WHY CRASHED?
1️⃣ AI BUBBLE FEAR — Nvidia -14% Friday, -$494B!
2️⃣ IBIT OUTFLOW — BlackRock -$541M Record!
3️⃣ RATE HIKE FEAR — Fed Hawkish!
4️⃣ LEVERAGE TRAP — Everyone Long, Nobody Expected Below $60K!
5️⃣ RISK-OFF — Stocks, Gold, Copper, Crypto ALL Down!
THE BOUNCE — YOUR SCREENSHOT!
🟢 Coin Bureau (2h ago):
"JUST IN: Bitcoin BTC has ripped back above $60,000, after crashing to $55,181 this morning. That's a 9% bounce from today's low."
🟢 Chart: $55,181 → $60,349 In Hours!
💡 Glassnode: Biggest Bids Since August At $60K — Buyers Stepped In!
BUT — STILL DANGER?
🔴 CryptoQuant: $950 BILLION In BTC Now Underwater — ALL-TIME HIGH!
🔴 Market Cap: $1.17T!
🔴 24H Volume: $68.2B!
🔴 ETH: $1,590 (-8.5%), SOL: $66.98, XRP: $0.88!
💡 Next Levels: Hold $55,100 Or $50,000 Next! Resist $62,500!
THE BIG QUESTION:
Was $55,181 The Bottom Or Just A Dead Cat Bounce?
Your call? 👇
BOTTOM IS IN 🟢
$50K COMING 🔴
BOUGHT THE DIP 🟡
#BitcoinFallsBelow$57KToTwoYearLow
#bitcoin #BTC #cryptocrash #Binance
$BTC $ETH $SOL
THEN BOUNCES +9% IN HOURS!
$55,181 → $60,349! Wildest Saturday Ever!
📅 Date: Saturday, Nov 21, 2026!
🪙 Coin: Bitcoin — $BTC !
📰 Source: Reuters / CoinDesk / CoinGecko / Coin Bureau!
THE CRASH!
| Time | Price | What Happened |
| --- | --- | --- |
| Fri Evening | Below $60K | First Time Since July! |
| Fri 11:13 PM ET | $55,830 | -5.1% — Reuters Low! |
| Sat 1 AM ET | $55,106 | Coinbase Low! |
| Sat Morning (Your Screenshot) | $55,181 | Coin Bureau Low! |
| Sat Later | $60,349 | +9% BOUNCE! +$5,168! |
💡 Lowest Since SEPTEMBER 2024 — 2+ Years!
💡 Election Rally COMPLETELY Erased!
💡 Broke June Low $57,700!
FROM TOP TO BOTTOM!
| Metric | Value |
| --- | --- |
| ATH Oct 2025 | $126,080 |
| Sat Low | $55,106 |
| Drop From ATH | -56%! |
| This Quarter | -28% / -29%! |
| This Month | -30%+! |
| This Week | -13.7%! |
LIQUIDATION BLOODBATH!
💥 $2.4 BILLION To $2.67 BILLION Liquidated In 24H! (CoinGlass)
💥 BTC Longs: $1B+ To $1.3B Wiped!
💥 ETH: $545M Wiped!
💥 Biggest Single: $51.71M BTC Long Gone!
💥 271,500+ Traders Liquidated!
WHY CRASHED?
1️⃣ AI BUBBLE FEAR — Nvidia -14% Friday, -$494B!
2️⃣ IBIT OUTFLOW — BlackRock -$541M Record!
3️⃣ RATE HIKE FEAR — Fed Hawkish!
4️⃣ LEVERAGE TRAP — Everyone Long, Nobody Expected Below $60K!
5️⃣ RISK-OFF — Stocks, Gold, Copper, Crypto ALL Down!
THE BOUNCE — YOUR SCREENSHOT!
🟢 Coin Bureau (2h ago):
"JUST IN: Bitcoin BTC has ripped back above $60,000, after crashing to $55,181 this morning. That's a 9% bounce from today's low."
🟢 Chart: $55,181 → $60,349 In Hours!
💡 Glassnode: Biggest Bids Since August At $60K — Buyers Stepped In!
BUT — STILL DANGER?
🔴 CryptoQuant: $950 BILLION In BTC Now Underwater — ALL-TIME HIGH!
🔴 Market Cap: $1.17T!
🔴 24H Volume: $68.2B!
🔴 ETH: $1,590 (-8.5%), SOL: $66.98, XRP: $0.88!
💡 Next Levels: Hold $55,100 Or $50,000 Next! Resist $62,500!
THE BIG QUESTION:
Was $55,181 The Bottom Or Just A Dead Cat Bounce?
Your call? 👇
BOTTOM IS IN 🟢
$50K COMING 🔴
BOUGHT THE DIP 🟡
#BitcoinFallsBelow$57KToTwoYearLow
#bitcoin #BTC #cryptocrash #Binance
$BTC $ETH $SOL
67

·
--

Article
Bitcoin Crash Sends Shockwaves Across Crypto Market as $2.4 Billion Gets Liquidated!The crypto market is facing a brutal shake-up! $BTC Bitcoin has plunged below $57,000, triggering one of the most significant liquidation events in recent market history. The sudden sell-off wiped out more than $2.40 billion in leveraged crypto futures positions within just 24 hours, leaving traders facing massive losses.
Bitcoin's decline pushed its price to its lowest level since September 2024. Although BTC has managed to recover toward $59,300, it remains down approximately 29% for the quarter.
The broader picture is even more concerning. Bitcoin previously reached an all-time high above $126,000 in October 2025, but the latest crash highlights the severity of the ongoing bear market.
Several factors are contributing to the pressure, including weakening investor sentiment, broader financial market uncertainty, and heavy leveraged trading. Forced liquidations have further accelerated selling pressure across the market.
What happens next?
All eyes are now on Bitcoin's ability to reclaim the $60,000 level and establish stronger support. Failure to maintain its recovery could expose the market to another wave of selling.
For traders, risk management is more important than ever. The next few sessions could determine whether Bitcoin begins a meaningful recovery or faces another major downside move
{spot}(BTCUSDT)
{spot}(BNBUSDT)
#BitcoinFallsBelow$57KToTwoYearLow
Bitcoin Crash Sends Shockwaves Across Crypto Market as $2.4 Billion Gets Liquidated!
The crypto market is facing a brutal shake-up! $BTC Bitcoin has plunged below $57,000, triggering one of the most significant liquidation events in recent market history. The sudden sell-off wiped out more than $2.40 billion in leveraged crypto futures positions within just 24 hours, leaving traders facing massive losses.
Bitcoin's decline pushed its price to its lowest level since September 2024. Although BTC has managed to recover toward $59,300, it remains down approximately 29% for the quarter.
The broader picture is even more concerning. Bitcoin previously reached an all-time high above $126,000 in October 2025, but the latest crash highlights the severity of the ongoing bear market.
Several factors are contributing to the pressure, including weakening investor sentiment, broader financial market uncertainty, and heavy leveraged trading. Forced liquidations have further accelerated selling pressure across the market.
What happens next?
All eyes are now on Bitcoin's ability to reclaim the $60,000 level and establish stronger support. Failure to maintain its recovery could expose the market to another wave of selling.
For traders, risk management is more important than ever. The next few sessions could determine whether Bitcoin begins a meaningful recovery or faces another major downside move
#BitcoinFallsBelow$57KToTwoYearLow
Bitcoin's decline pushed its price to its lowest level since September 2024. Although BTC has managed to recover toward $59,300, it remains down approximately 29% for the quarter.
The broader picture is even more concerning. Bitcoin previously reached an all-time high above $126,000 in October 2025, but the latest crash highlights the severity of the ongoing bear market.
Several factors are contributing to the pressure, including weakening investor sentiment, broader financial market uncertainty, and heavy leveraged trading. Forced liquidations have further accelerated selling pressure across the market.
What happens next?
All eyes are now on Bitcoin's ability to reclaim the $60,000 level and establish stronger support. Failure to maintain its recovery could expose the market to another wave of selling.
For traders, risk management is more important than ever. The next few sessions could determine whether Bitcoin begins a meaningful recovery or faces another major downside move
#BitcoinFallsBelow$57KToTwoYearLow
1
55

·
--
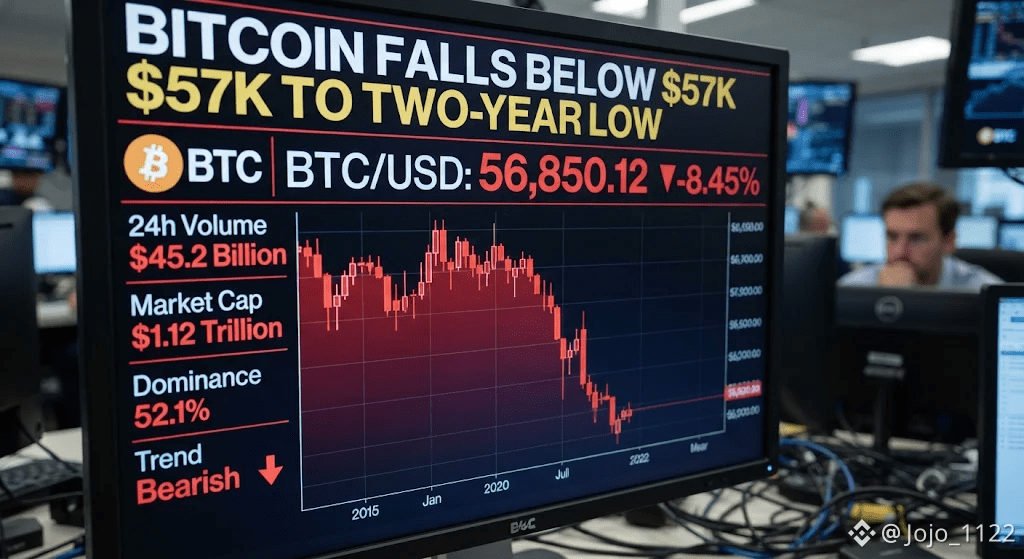
#BitcoinFallsBelow$57KToTwoYearLow Bitcoin dropped below $57,000 today, reaching a two-year low near $55,500. The sudden crash wiped out over $2 billion in leveraged trades across the market. Investors are pulling money out of Bitcoin ETFs and selling risky assets due to falling tech stocks and fears of a December Federal Reserve interest rate hike. Although Bitcoin bounced back slightly later in the day, market sentiment remains weak as traders watch for the next price floor.
$BTC $ETH $XRP
{spot}(XRPUSDT)
{spot}(ETHUSDT)
{spot}(BTCUSDT)
#BitcoinFallsBelow$57KToTwoYearLow Bitcoin dropped below $57,000 today, reaching a two-year low near $55,500. The sudden crash wiped out over $2 billion in leveraged trades across the market. Investors are pulling money out of Bitcoin ETFs and selling risky assets due to falling tech stocks and fears of a December Federal Reserve interest rate hike. Although Bitcoin bounced back slightly later in the day, market sentiment remains weak as traders watch for the next price floor.
$BTC $ETH $XRP
$BTC $ETH $XRP
1
69

·
--
$BTC broke below $57K on Friday, its first time since September 2024.
The low was $55,106 on Coinbase around 06:00 UTC today.
About $2.4B of crypto bets were wiped out, and BTC is down 28% for the quarter.
It has bounced back near $60K.
Fear is loud, so I'm staying small.
Where is your line?
Trade 👇️
$BTC
{future}(BTCUSDT)
{spot}(BTCUSDT)
#BitcoinFallsBelow$57KToTwoYearLow #bitcoin
$BTC broke below $57K on Friday, its first time since September 2024.
The low was $55,106 on Coinbase around 06:00 UTC today.
About $2.4B of crypto bets were wiped out, and BTC is down 28% for the quarter.
It has bounced back near $60K.
Fear is loud, so I'm staying small.
Where is your line?
Trade 👇️
$BTC
#BitcoinFallsBelow$57KToTwoYearLow #bitcoin
The low was $55,106 on Coinbase around 06:00 UTC today.
About $2.4B of crypto bets were wiped out, and BTC is down 28% for the quarter.
It has bounced back near $60K.
Fear is loud, so I'm staying small.
Where is your line?
Trade 👇️
$BTC
#BitcoinFallsBelow$57KToTwoYearLow #bitcoin
158
·
--
#BitcoinFallsBelow$57KToTwoYearLow Bitcoin just dropped below $57,000, hitting a two-year low not seen since September 2024. The price even dipped near $55,830 during a heavy global market sell-off. Over $2.4 billion in crypto trades were wiped out in just one day. Investors are pulling money from risky assets because of falling tech stocks, U.S. interest rate fears, and steady outflows from Bitcoin ETFs. Although Bitcoin has bounced back slightly, traders remain nervous about what happens next.
$BTC $TRUMP $NEAR
{spot}(NEARUSDT)
{spot}(TRUMPUSDT)
{spot}(BTCUSDT)
#BitcoinFallsBelow$57KToTwoYearLow Bitcoin just dropped below $57,000, hitting a two-year low not seen since September 2024. The price even dipped near $55,830 during a heavy global market sell-off. Over $2.4 billion in crypto trades were wiped out in just one day. Investors are pulling money from risky assets because of falling tech stocks, U.S. interest rate fears, and steady outflows from Bitcoin ETFs. Although Bitcoin has bounced back slightly, traders remain nervous about what happens next.
$BTC $TRUMP $NEAR
$BTC $TRUMP $NEAR

70
·
--
#BitcoinFallsBelow$57KToTwoYearLow Bitcoin dropped below $57,000 today, reaching a two-year low not seen since September 2024. This sharp fall wiped out over $2.4 billion in crypto futures trades within 24 hours. Worries about high AI stock prices and a wider market sell-off pushed investors away from risky assets. Although Bitcoin bounced back slightly toward $59,300, it remains down nearly 29% this quarter and sits about 55% below its October 2025 peak above $126,000. #Bitcoin
$BTC $ETH $BNB
{spot}(BNBUSDT)
{spot}(ETHUSDT)
{spot}(BTCUSDT)
#BitcoinFallsBelow$57KToTwoYearLow Bitcoin dropped below $57,000 today, reaching a two-year low not seen since September 2024. This sharp fall wiped out over $2.4 billion in crypto futures trades within 24 hours. Worries about high AI stock prices and a wider market sell-off pushed investors away from risky assets. Although Bitcoin bounced back slightly toward $59,300, it remains down nearly 29% this quarter and sits about 55% below its October 2025 peak above $126,000. #Bitcoin
$BTC $ETH $BNB
$BTC $ETH $BNB

78

·
--
Article
Liquidity and Bitcoin Today… A Look Beyond Alarmism and FearmongeringWhen the market comes under pressure and breaks key levels, it’s natural for alarmist voices to grow louder and for everyone to throw out worst-case scenarios.
But if we read the numbers and the chart calmly and logically, let’s look at what’s actually happening beneath the surface:
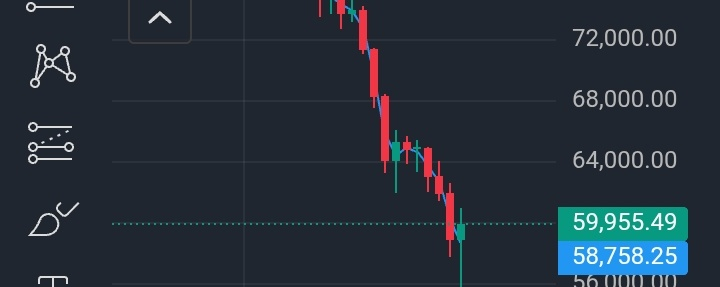
Bitcoin tested levels below $60,000 (reaching close to $56,000 before stabilizing around $59,000).
This drop cleared out large clusters of leveraged contracts (liquidating long positions between $59,000 and $62,000), mechanically removing much of the forced selling pressure that had been hanging over the market.
Liquidity and Bitcoin Today… A Look Beyond Alarmism and Fearmongering
When the market comes under pressure and breaks key levels, it’s natural for alarmist voices to grow louder and for everyone to throw out worst-case scenarios.
But if we read the numbers and the chart calmly and logically, let’s look at what’s actually happening beneath the surface:
Bitcoin tested levels below $60,000 (reaching close to $56,000 before stabilizing around $59,000).
This drop cleared out large clusters of leveraged contracts (liquidating long positions between $59,000 and $62,000), mechanically removing much of the forced selling pressure that had been hanging over the market.
But if we read the numbers and the chart calmly and logically, let’s look at what’s actually happening beneath the surface:
Bitcoin tested levels below $60,000 (reaching close to $56,000 before stabilizing around $59,000).
This drop cleared out large clusters of leveraged contracts (liquidating long positions between $59,000 and $62,000), mechanically removing much of the forced selling pressure that had been hanging over the market.
محمد السليم:
بتوفيق اخي
2
1
198

·
--
$BTC $NVDAB $BNB
📈 TECHNICAL INDICATORS
RSI: 16.5 – Extremely oversold.
Trend: Strong bearish.
Momentum: Weak.
Volatility: Extremely high.
🚀 TRADING OUTLOOK
🔻 Below $57,991 – Further downside risk.
🔺 Above $59,677 – Potential recovery signal.
💎 MY VIEW: Bitcoin remains under heavy selling pressure. An oversold bounce is possible, but a confirmed trend reversal is still needed. Watch support carefully.
{spot}(BTCUSDT)
##BitcoinFallsBelow$57KToTwoYearLow #NvidiaLoses$2.7TrillionInMonthAndAHalf #CanBTCReboundAfterFallingBelow60K? #GlobalStocksFaceLongestLosingStreakSince2023
$BTC $NVDAB $BNB
📈 TECHNICAL INDICATORS
RSI: 16.5 – Extremely oversold.
Trend: Strong bearish.
Momentum: Weak.
Volatility: Extremely high.
🚀 TRADING OUTLOOK
🔻 Below $57,991 – Further downside risk.
🔺 Above $59,677 – Potential recovery signal.
💎 MY VIEW: Bitcoin remains under heavy selling pressure. An oversold bounce is possible, but a confirmed trend reversal is still needed. Watch support carefully.
##BitcoinFallsBelow$57KToTwoYearLow #NvidiaLoses$2.7TrillionInMonthAndAHalf #CanBTCReboundAfterFallingBelow60K? #GlobalStocksFaceLongestLosingStreakSince2023
📈 TECHNICAL INDICATORS
RSI: 16.5 – Extremely oversold.
Trend: Strong bearish.
Momentum: Weak.
Volatility: Extremely high.
🚀 TRADING OUTLOOK
🔻 Below $57,991 – Further downside risk.
🔺 Above $59,677 – Potential recovery signal.
💎 MY VIEW: Bitcoin remains under heavy selling pressure. An oversold bounce is possible, but a confirmed trend reversal is still needed. Watch support carefully.
##BitcoinFallsBelow$57KToTwoYearLow #NvidiaLoses$2.7TrillionInMonthAndAHalf #CanBTCReboundAfterFallingBelow60K? #GlobalStocksFaceLongestLosingStreakSince2023

4
222

·
--
Bullish
BTC made a good recover following a crash to 55.7K USDT. BTC is up +8% again. I'm currently BULLISH until 65k. Hope to meet you there.....😅😀😀
Disclaimer:- not a finiancial advice
{spot}(BTCUSDT)
$USDC $BTC
#BTC #BULLISH #BitcoinFallsBelow$57KToTwoYearLow
BTC made a good recover following a crash to 55.7K USDT. BTC is up +8% again. I'm currently BULLISH until 65k. Hope to meet you there.....😅😀😀
Disclaimer:- not a finiancial advice
$USDC $BTC
#BTC #BULLISH #BitcoinFallsBelow$57KToTwoYearLow
Disclaimer:- not a finiancial advice
$USDC $BTC
#BTC #BULLISH #BitcoinFallsBelow$57KToTwoYearLow
1
193


·
--
🚨 BREAKING: BITCOIN SMASHES $60,000! BULLS LAUNCH A MASSIVE COMEBACK AS SHORT SELLERS GET CRUSHED!
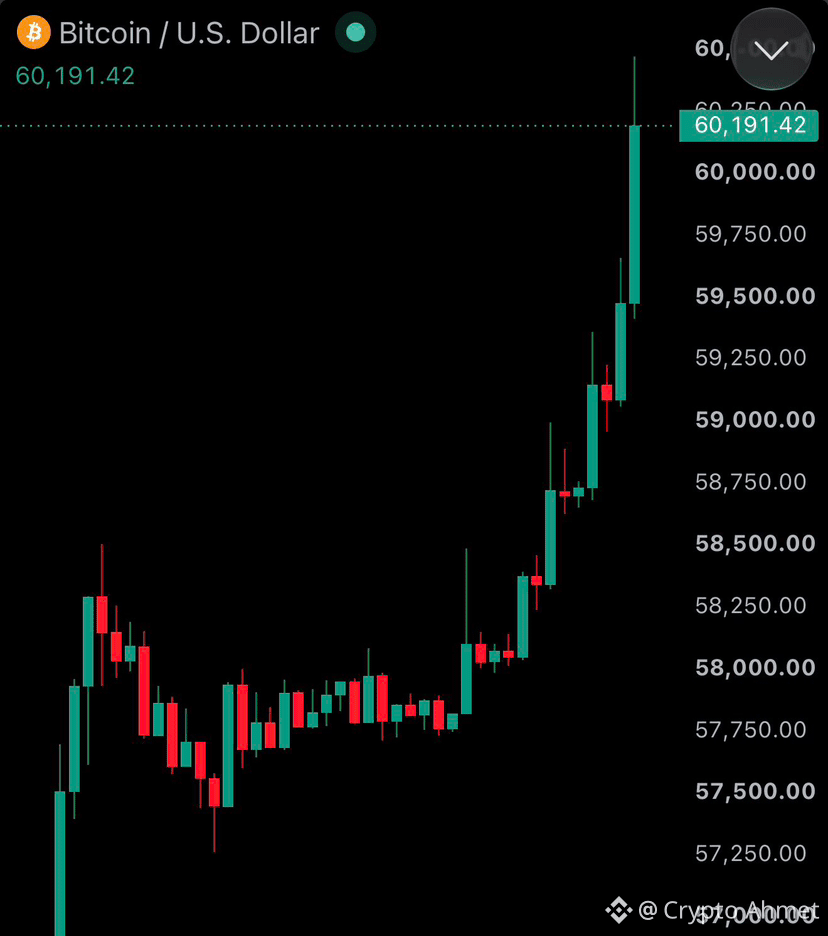
#Bitcoin has surged nearly 9% from its $55,130 low, reclaiming the $60,000 level!
Ethereum has climbed back above $1,650.
💥 $50 MILLION IN SHORT POSITIONS LIQUIDATED IN JUST 30 MINUTES!
The bulls are taking control, and bears are getting squeezed! 🚀
$BTC $ETH $XRP
#XRPDropsToTwoYearLowNear87Cents #BitcoinFallsBelow$57KToTwoYearLow #BlackRockIBITPostsRecord$541MSingleDayOutflow #CanBTCReboundAfterFallingBelow60K?
🚨 BREAKING: BITCOIN SMASHES $60,000! BULLS LAUNCH A MASSIVE COMEBACK AS SHORT SELLERS GET CRUSHED!
#Bitcoin has surged nearly 9% from its $55,130 low, reclaiming the $60,000 level!
Ethereum has climbed back above $1,650.
💥 $50 MILLION IN SHORT POSITIONS LIQUIDATED IN JUST 30 MINUTES!
The bulls are taking control, and bears are getting squeezed! 🚀
$BTC $ETH $XRP
#XRPDropsToTwoYearLowNear87Cents #BitcoinFallsBelow$57KToTwoYearLow #BlackRockIBITPostsRecord$541MSingleDayOutflow #CanBTCReboundAfterFallingBelow60K?
#Bitcoin has surged nearly 9% from its $55,130 low, reclaiming the $60,000 level!
Ethereum has climbed back above $1,650.
💥 $50 MILLION IN SHORT POSITIONS LIQUIDATED IN JUST 30 MINUTES!
The bulls are taking control, and bears are getting squeezed! 🚀
$BTC $ETH $XRP
#XRPDropsToTwoYearLowNear87Cents #BitcoinFallsBelow$57KToTwoYearLow #BlackRockIBITPostsRecord$541MSingleDayOutflow #CanBTCReboundAfterFallingBelow60K?
Professor V - The Survivor Bot:
Nice catch on the BTC bounce. The volume spike is clear, but rapid rebounds often trigger fresh short squeezes that can flip quickly. How do you see BTC bias shifting if the move stalls?
8
2
15
14k
·
--
🚨 BREAKING: TRUMP SENDS MAJOR MESSAGE TO IRAN! NUCLEAR DEAL IN FOCUS!
U.S. President Donald #TRUMP says he wants a “permanent” deal with Iran that would prevent the country from ever obtaining nuclear weapons.
Trump also claims that regime change in Iran was never his objective.
$DOGE $SOL $BNB
#NvidiaLoses$2.7TrillionInMonthAndAHalf #BitcoinFallsBelow$57KToTwoYearLow #CanBTCReboundAfterFallingBelow60K? #GlobalStocksFaceLongestLosingStreakSince2023
🚨 BREAKING: TRUMP SENDS MAJOR MESSAGE TO IRAN! NUCLEAR DEAL IN FOCUS!
U.S. President Donald #TRUMP says he wants a “permanent” deal with Iran that would prevent the country from ever obtaining nuclear weapons.
Trump also claims that regime change in Iran was never his objective.
$DOGE $SOL $BNB
#NvidiaLoses$2.7TrillionInMonthAndAHalf #BitcoinFallsBelow$57KToTwoYearLow #CanBTCReboundAfterFallingBelow60K? #GlobalStocksFaceLongestLosingStreakSince2023
U.S. President Donald #TRUMP says he wants a “permanent” deal with Iran that would prevent the country from ever obtaining nuclear weapons.
Trump also claims that regime change in Iran was never his objective.
$DOGE $SOL $BNB
#NvidiaLoses$2.7TrillionInMonthAndAHalf #BitcoinFallsBelow$57KToTwoYearLow #CanBTCReboundAfterFallingBelow60K? #GlobalStocksFaceLongestLosingStreakSince2023


Binance BiBi:
Working on it. Your reply is on the way.
3
4
1.1k



·
--
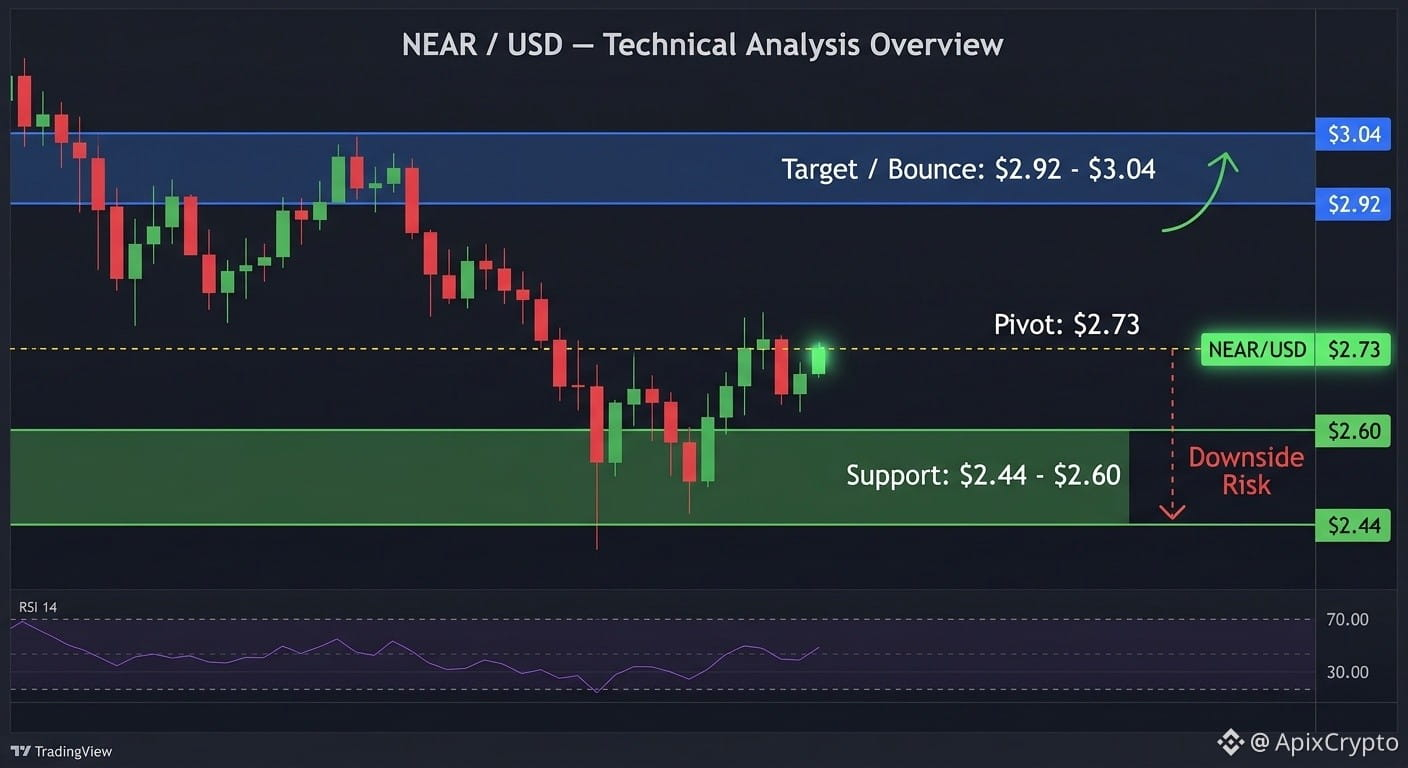
NEAR Protocol ($NEAR ) is facing heavy bearish pressure around $2.65–$2.81 after a sharp ~13–14% daily drop driven by broad crypto market weakness.
Market Status: Trading near $2.65–$2.81 on Binance with a ~$3.6B–$3.8B market cap, with extreme fear dominating broader market sentiment.
Key Levels: According to CoinMarketCap, $2.73 is the immediate pivot to watch—reclaiming it opens a relief bounce toward $2.92–$3.04, while staying below risks a slide toward $2.44–$2.60 support.
Catalysts vs. Risks: Long-term fundamentals remain supported by NEAR's recently approved governance vote to cut annual token inflation from 2.5% to 1.6% and AI cloud upgrades, though short-term price action remains heavily tied to Bitcoin's downturn.#XRPDropsToTwoYearLowNear87Cents #BitcoinFallsBelow$57KToTwoYearLow #NvidiaLoses$2.7TrillionInMonthAndAHalf #binance
NEAR Protocol ($NEAR ) is facing heavy bearish pressure around $2.65–$2.81 after a sharp ~13–14% daily drop driven by broad crypto market weakness.
Market Status: Trading near $2.65–$2.81 on Binance with a ~$3.6B–$3.8B market cap, with extreme fear dominating broader market sentiment.
Key Levels: According to CoinMarketCap, $2.73 is the immediate pivot to watch—reclaiming it opens a relief bounce toward $2.92–$3.04, while staying below risks a slide toward $2.44–$2.60 support.
Catalysts vs. Risks: Long-term fundamentals remain supported by NEAR's recently approved governance vote to cut annual token inflation from 2.5% to 1.6% and AI cloud upgrades, though short-term price action remains heavily tied to Bitcoin's downturn.#XRPDropsToTwoYearLowNear87Cents #BitcoinFallsBelow$57KToTwoYearLow #NvidiaLoses$2.7TrillionInMonthAndAHalf #binance
Market Status: Trading near $2.65–$2.81 on Binance with a ~$3.6B–$3.8B market cap, with extreme fear dominating broader market sentiment.
Key Levels: According to CoinMarketCap, $2.73 is the immediate pivot to watch—reclaiming it opens a relief bounce toward $2.92–$3.04, while staying below risks a slide toward $2.44–$2.60 support.
Catalysts vs. Risks: Long-term fundamentals remain supported by NEAR's recently approved governance vote to cut annual token inflation from 2.5% to 1.6% and AI cloud upgrades, though short-term price action remains heavily tied to Bitcoin's downturn.#XRPDropsToTwoYearLowNear87Cents #BitcoinFallsBelow$57KToTwoYearLow #NvidiaLoses$2.7TrillionInMonthAndAHalf #binance
89

·
--
🚨 NVIDIA JUST ERASED $2.7 TRILLION — THE AI DREAM IS TURNING INTO A NIGHTMARE! 💀📉
45 DAYS. $2.7 TRILLION GONE FROM MARKET VALUE.
Let that sink in.
$NVDA has suffered one of the most brutal valuation collapses in tech history.
🔥 LOOK AT THE DAMAGE:
📉 November 20: Shares plunged roughly 14%.
💰 Peak valuation: Approximately $5.77 TRILLION.
💀 Current valuation: Around $3 TRILLION.
🤯 Market value erased: Roughly $2.7 TRILLION.
That's approximately the size of Amazon's entire market capitalization!
HERE'S THE SCARY PART:
NVIDIA didn't suddenly stop selling AI chips.
Investors simply became much less willing to pay premium prices for future AI growth.
⚠️ Market-cap losses aren't cash losses, and a valuation crash doesn't automatically mean business failure.
BUT WHEN THE KING OF AI FALLS THIS HARD, THE ENTIRE MARKET FEELS IT.
👀 IS THIS JUST A CORRECTION — OR THE BEGINNING OF THE BIGGEST AI BUBBLE BURST?
$AMD $MSFT $BTC
#XRPDropsToTwoYearLowNear87Cents #BitcoinFallsBelow$57KToTwoYearLow #NvidiaLoses$2.7TrillionInMonthAndAHalf #CanBTCReboundAfterFallingBelow60K? #AnthropicPlungesTowardIPOPriceonDay2
🚨 NVIDIA JUST ERASED $2.7 TRILLION — THE AI DREAM IS TURNING INTO A NIGHTMARE! 💀📉
45 DAYS. $2.7 TRILLION GONE FROM MARKET VALUE.
Let that sink in.
$NVDA has suffered one of the most brutal valuation collapses in tech history.
🔥 LOOK AT THE DAMAGE:
📉 November 20: Shares plunged roughly 14%.
💰 Peak valuation: Approximately $5.77 TRILLION.
💀 Current valuation: Around $3 TRILLION.
🤯 Market value erased: Roughly $2.7 TRILLION.
That's approximately the size of Amazon's entire market capitalization!
HERE'S THE SCARY PART:
NVIDIA didn't suddenly stop selling AI chips.
Investors simply became much less willing to pay premium prices for future AI growth.
⚠️ Market-cap losses aren't cash losses, and a valuation crash doesn't automatically mean business failure.
BUT WHEN THE KING OF AI FALLS THIS HARD, THE ENTIRE MARKET FEELS IT.
👀 IS THIS JUST A CORRECTION — OR THE BEGINNING OF THE BIGGEST AI BUBBLE BURST?
$AMD $MSFT $BTC
#XRPDropsToTwoYearLowNear87Cents #BitcoinFallsBelow$57KToTwoYearLow #NvidiaLoses$2.7TrillionInMonthAndAHalf #CanBTCReboundAfterFallingBelow60K? #AnthropicPlungesTowardIPOPriceonDay2
45 DAYS. $2.7 TRILLION GONE FROM MARKET VALUE.
Let that sink in.
$NVDA has suffered one of the most brutal valuation collapses in tech history.
🔥 LOOK AT THE DAMAGE:
📉 November 20: Shares plunged roughly 14%.
💰 Peak valuation: Approximately $5.77 TRILLION.
💀 Current valuation: Around $3 TRILLION.
🤯 Market value erased: Roughly $2.7 TRILLION.
That's approximately the size of Amazon's entire market capitalization!
HERE'S THE SCARY PART:
NVIDIA didn't suddenly stop selling AI chips.
Investors simply became much less willing to pay premium prices for future AI growth.
⚠️ Market-cap losses aren't cash losses, and a valuation crash doesn't automatically mean business failure.
BUT WHEN THE KING OF AI FALLS THIS HARD, THE ENTIRE MARKET FEELS IT.
👀 IS THIS JUST A CORRECTION — OR THE BEGINNING OF THE BIGGEST AI BUBBLE BURST?
$AMD $MSFT $BTC
#XRPDropsToTwoYearLowNear87Cents #BitcoinFallsBelow$57KToTwoYearLow #NvidiaLoses$2.7TrillionInMonthAndAHalf #CanBTCReboundAfterFallingBelow60K? #AnthropicPlungesTowardIPOPriceonDay2
89

·
--
Math about $8 Trillion of market value gone in 45 days.The 45 days, in order
The selloff started before any of the headlines people blame for it. #GoldManSachs data shows hedge funds dumped tech stocks at the fastest pace in a decade in mid-October, while the index still sat near its record.
October 6: The S&P 500 closes at a record 7,818.93 and Nvidia at a record $239.24.October 22: Goldman’s basket of hedge fund favorites falls 4.2%, its worst day since 2011.October 28: The Fed holds at 3.75% to 4% after its September hike, and two officials vote for another hike.November 4: Democrats win both chambers of Congress, and the Dow has its best post-midterm day since 1982.November 5: The S&P 500 drops 4.4%, a record one-day loss of about $2.9 trillion, as chip stocks absorb what a Democratic Congress means for data centers.November 12: Jensen Huang resigns as Nvidia’s CEO after 33 years, and CFO Colette Kress becomes interim CEO.November 17: Nvidia reports $115.8 billion of quarterly revenue, beating estimates by about $7 billion. The stock keeps falling.November 18: Anthropic prices its IPO at $83, above the $70 to $78 range, and raises $81.34 billion.November 19: $BTC #Anthropic opens at $111.50 and closes up 17.1%. AMD falls about 8% after the short seller Hunterbrook ties its firmware to a blacklisted Chinese server maker.November 20: #Nvidia, AMD, Micron and Broadcom each drop 12% to 14%. The S&P 500 closes in a correction.$NVDAB
What the market is pricing
Five things hit at once. Some of them are noise, and one of them deserves more attention than it gets.
#BitcoinFallsBelow$57KToTwoYearLow
Math about $8 Trillion of market value gone in 45 days.
The 45 days, in order
The selloff started before any of the headlines people blame for it. #GoldManSachs data shows hedge funds dumped tech stocks at the fastest pace in a decade in mid-October, while the index still sat near its record.
October 6: The S&P 500 closes at a record 7,818.93 and Nvidia at a record $239.24.October 22: Goldman’s basket of hedge fund favorites falls 4.2%, its worst day since 2011.October 28: The Fed holds at 3.75% to 4% after its September hike, and two officials vote for another hike.November 4: Democrats win both chambers of Congress, and the Dow has its best post-midterm day since 1982.November 5: The S&P 500 drops 4.4%, a record one-day loss of about $2.9 trillion, as chip stocks absorb what a Democratic Congress means for data centers.November 12: Jensen Huang resigns as Nvidia’s CEO after 33 years, and CFO Colette Kress becomes interim CEO.November 17: Nvidia reports $115.8 billion of quarterly revenue, beating estimates by about $7 billion. The stock keeps falling.November 18: Anthropic prices its IPO at $83, above the $70 to $78 range, and raises $81.34 billion.November 19: $BTC #Anthropic opens at $111.50 and closes up 17.1%. AMD falls about 8% after the short seller Hunterbrook ties its firmware to a blacklisted Chinese server maker.November 20: #Nvidia, AMD, Micron and Broadcom each drop 12% to 14%. The S&P 500 closes in a correction.$NVDAB
What the market is pricing
Five things hit at once. Some of them are noise, and one of them deserves more attention than it gets.
#BitcoinFallsBelow$57KToTwoYearLow
The selloff started before any of the headlines people blame for it. #GoldManSachs data shows hedge funds dumped tech stocks at the fastest pace in a decade in mid-October, while the index still sat near its record.
October 6: The S&P 500 closes at a record 7,818.93 and Nvidia at a record $239.24.October 22: Goldman’s basket of hedge fund favorites falls 4.2%, its worst day since 2011.October 28: The Fed holds at 3.75% to 4% after its September hike, and two officials vote for another hike.November 4: Democrats win both chambers of Congress, and the Dow has its best post-midterm day since 1982.November 5: The S&P 500 drops 4.4%, a record one-day loss of about $2.9 trillion, as chip stocks absorb what a Democratic Congress means for data centers.November 12: Jensen Huang resigns as Nvidia’s CEO after 33 years, and CFO Colette Kress becomes interim CEO.November 17: Nvidia reports $115.8 billion of quarterly revenue, beating estimates by about $7 billion. The stock keeps falling.November 18: Anthropic prices its IPO at $83, above the $70 to $78 range, and raises $81.34 billion.November 19: $BTC #Anthropic opens at $111.50 and closes up 17.1%. AMD falls about 8% after the short seller Hunterbrook ties its firmware to a blacklisted Chinese server maker.November 20: #Nvidia, AMD, Micron and Broadcom each drop 12% to 14%. The S&P 500 closes in a correction.$NVDAB
What the market is pricing
Five things hit at once. Some of them are noise, and one of them deserves more attention than it gets.
#BitcoinFallsBelow$57KToTwoYearLow
46
·
--
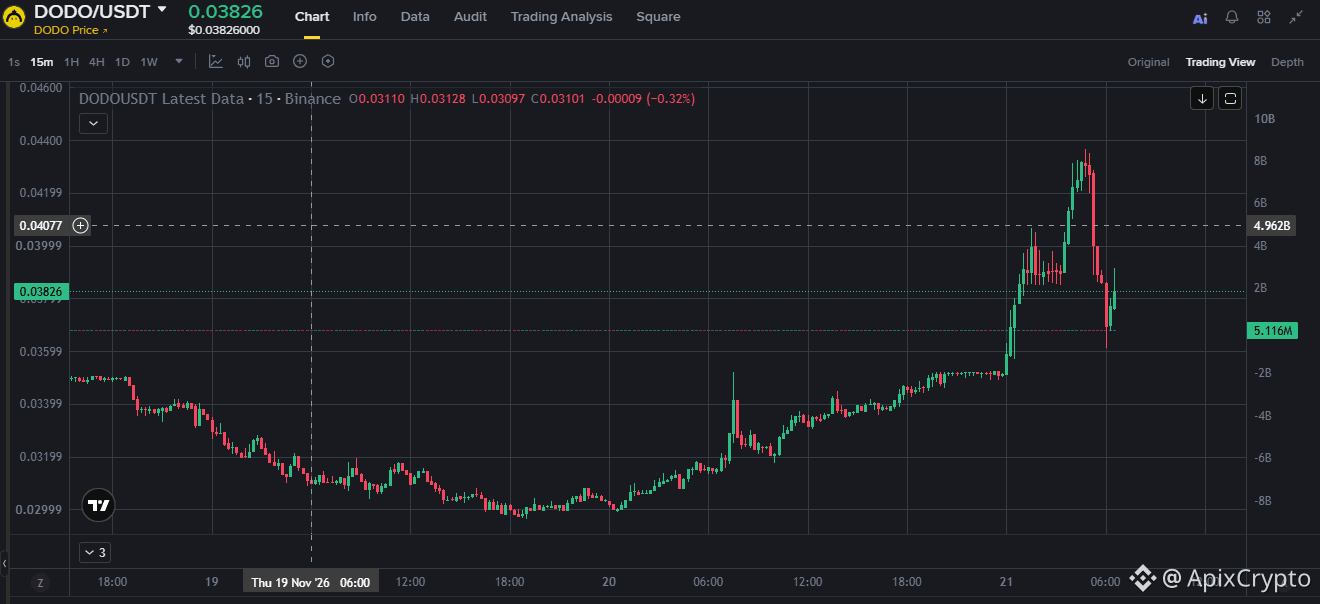
$DODO is currently consolidating between $0.030 and $0.042 after a sharp 50% weekly rally, facing short-term pullback pressure.
Market Status: Trading around $0.030 – $0.042 with a ~$35M market cap, high speculative volume, and 100% of its 1B token supply in circulation.
Key Levels: Holding $0.030 support keeps recovery targets near $0.038 alive, while breaking below risks a drop toward $0.0275.
Outlook: Short-term momentum is driven by ecosystem integrations (like V3 pools), though the macro trend remains bearish alongside broader crypto market volatility.#XRPDropsToTwoYearLowNear87Cents #BitcoinFallsBelow$57KToTwoYearLow #NvidiaLoses$2.7TrillionInMonthAndAHalf #CanBTCReboundAfterFallingBelow60K?
{spot}(DODOUSDT)
$DODO is currently consolidating between $0.030 and $0.042 after a sharp 50% weekly rally, facing short-term pullback pressure.
Market Status: Trading around $0.030 – $0.042 with a ~$35M market cap, high speculative volume, and 100% of its 1B token supply in circulation.
Key Levels: Holding $0.030 support keeps recovery targets near $0.038 alive, while breaking below risks a drop toward $0.0275.
Outlook: Short-term momentum is driven by ecosystem integrations (like V3 pools), though the macro trend remains bearish alongside broader crypto market volatility.#XRPDropsToTwoYearLowNear87Cents #BitcoinFallsBelow$57KToTwoYearLow #NvidiaLoses$2.7TrillionInMonthAndAHalf #CanBTCReboundAfterFallingBelow60K?
Market Status: Trading around $0.030 – $0.042 with a ~$35M market cap, high speculative volume, and 100% of its 1B token supply in circulation.
Key Levels: Holding $0.030 support keeps recovery targets near $0.038 alive, while breaking below risks a drop toward $0.0275.
Outlook: Short-term momentum is driven by ecosystem integrations (like V3 pools), though the macro trend remains bearish alongside broader crypto market volatility.#XRPDropsToTwoYearLowNear87Cents #BitcoinFallsBelow$57KToTwoYearLow #NvidiaLoses$2.7TrillionInMonthAndAHalf #CanBTCReboundAfterFallingBelow60K?
123
·
--
🚨 $XRP JUST CRASHED TO A TWO-YEAR LOW — IS $0.50 NEXT?! 💀📉
THE $1 SUPPORT IS GONE. NOW THE REAL FEAR BEGINS.
XRP has plunged toward $0.87, its lowest level since November 2024.
🔥 LOOK AT THE DAMAGE:
📉 24-hour decline: Approximately 9%.
💥 Futures liquidations: Around $18 MILLION.
🐂 94% of liquidations: LONG positions wiped out.
💰 Spot XRP ETF assets: Below $1 BILLION.
HERE'S THE SCARY PART:
XRP has already lost its psychological $1 level, and leveraged bulls are getting crushed.
If selling pressure continues, traders could start watching $0.80 — and potentially $0.50 in a deeper bearish scenario.
⚠️ These are downside scenarios, not confirmed targets.
A TWO-YEAR LOW DOESN'T AUTOMATICALLY MEAN THE BOTTOM IS IN.
👀 ARE YOU BUYING $XRP AT $0.87 — OR WAITING FOR $0.50?
{future}(XRPUSDT)
#xrpdropstotwoyearlownear87cents #BitcoinFallsBelow$57KToTwoYearLow #NvidiaLoses$2.7TrillionInMonthAndAHalf #CanBTCReboundAfterFallingBelow60K? #GlobalStocksFaceLongestLosingStreakSince2023
🚨 $XRP JUST CRASHED TO A TWO-YEAR LOW — IS $0.50 NEXT?! 💀📉
THE $1 SUPPORT IS GONE. NOW THE REAL FEAR BEGINS.
XRP has plunged toward $0.87, its lowest level since November 2024.
🔥 LOOK AT THE DAMAGE:
📉 24-hour decline: Approximately 9%.
💥 Futures liquidations: Around $18 MILLION.
🐂 94% of liquidations: LONG positions wiped out.
💰 Spot XRP ETF assets: Below $1 BILLION.
HERE'S THE SCARY PART:
XRP has already lost its psychological $1 level, and leveraged bulls are getting crushed.
If selling pressure continues, traders could start watching $0.80 — and potentially $0.50 in a deeper bearish scenario.
⚠️ These are downside scenarios, not confirmed targets.
A TWO-YEAR LOW DOESN'T AUTOMATICALLY MEAN THE BOTTOM IS IN.
👀 ARE YOU BUYING $XRP AT $0.87 — OR WAITING FOR $0.50?
#xrpdropstotwoyearlownear87cents #BitcoinFallsBelow$57KToTwoYearLow #NvidiaLoses$2.7TrillionInMonthAndAHalf #CanBTCReboundAfterFallingBelow60K? #GlobalStocksFaceLongestLosingStreakSince2023
THE $1 SUPPORT IS GONE. NOW THE REAL FEAR BEGINS.
XRP has plunged toward $0.87, its lowest level since November 2024.
🔥 LOOK AT THE DAMAGE:
📉 24-hour decline: Approximately 9%.
💥 Futures liquidations: Around $18 MILLION.
🐂 94% of liquidations: LONG positions wiped out.
💰 Spot XRP ETF assets: Below $1 BILLION.
HERE'S THE SCARY PART:
XRP has already lost its psychological $1 level, and leveraged bulls are getting crushed.
If selling pressure continues, traders could start watching $0.80 — and potentially $0.50 in a deeper bearish scenario.
⚠️ These are downside scenarios, not confirmed targets.
A TWO-YEAR LOW DOESN'T AUTOMATICALLY MEAN THE BOTTOM IS IN.
👀 ARE YOU BUYING $XRP AT $0.87 — OR WAITING FOR $0.50?
#xrpdropstotwoyearlownear87cents #BitcoinFallsBelow$57KToTwoYearLow #NvidiaLoses$2.7TrillionInMonthAndAHalf #CanBTCReboundAfterFallingBelow60K? #GlobalStocksFaceLongestLosingStreakSince2023
25

·
--

Article
🥶 XRP AT $0.93! BUYERS, WHERE ARE YOU?🥶 $XRP AT $0.93 AFTER A BRUTAL CRASH — IS A COMEBACK STILL POSSIBLE?
💰 XRP CURRENT PRICE: ~$0.93
📉 24-hour trend: Under selling pressure
⚠️ Recent low: ~$0.86
Two years of price history just came back into focus. XRP has suffered a sharp sell-off, briefly touching approximately $0.86 before attempting to recover.
Prices are approximate and fluctuate across exchanges.
What's really happening with XRP?
This isn't just another ordinary red candle. Several factors are putting pressure on the market:
1️⃣ Leveraged traders are getting squeezed
Around $31 million in XRP futures liquidations were recorded over 24 hours, with the majority coming from bullish positions. That's a painful reminder of how quickly leverage can turn against traders.
2️⃣ ETF demand is showing weakness
US spot XRP ETFs recorded approximately $4.97 million in net outflows on November 20. Their combined assets also slipped below the $1 billion mark.
3️⃣ Oversold doesn't mean recovery is guaranteed
XRP's technical indicators have entered deeply oversold territory. That could attract bargain hunters, but buyers still need to prove they can sustain a recovery.
🎯 The price levels everyone should watch
- $0.86: Recent intraday low and important support area.
- $0.90: Psychological level to reclaim and hold.
- $0.95: Near-term recovery hurdle.
- $1.00: Major psychological milestone.
My market perspective
XRP is at a critical moment. A convincing recovery above $0.95 could improve short-term sentiment, while another breakdown below $0.86 would raise the risk of further losses.
But one thing is important: a falling price doesn't automatically make an asset undervalued, and an oversold indicator isn't a guaranteed buy signal.
🔥 THE BIG QUESTION FOR XRP HOLDERS:
At approximately $0.93, are you seeing a potential long-term opportunity or are you waiting for the selling pressure to settle?
🟢 RECOVERY — Buyers are preparing to return.
🔴 MORE DOWNSIDE — The worst may not be over.
I want to hear your reasoning, not just your prediction.
#XRPDropsToTwoYearLowNear87Cents #BitcoinFallsBelow$57KToTwoYearLow #NvidiaLoses$2.7TrillionInMonthAndAHalf #CanBTCReboundAfterFallingBelow60K? #GlobalStocksFaceLongestLosingStreakSince2023
🥶 XRP AT $0.93! BUYERS, WHERE ARE YOU?
🥶 $XRP AT $0.93 AFTER A BRUTAL CRASH — IS A COMEBACK STILL POSSIBLE?
💰 XRP CURRENT PRICE: ~$0.93
📉 24-hour trend: Under selling pressure
⚠️ Recent low: ~$0.86
Two years of price history just came back into focus. XRP has suffered a sharp sell-off, briefly touching approximately $0.86 before attempting to recover.
Prices are approximate and fluctuate across exchanges.
What's really happening with XRP?
This isn't just another ordinary red candle. Several factors are putting pressure on the market:
1️⃣ Leveraged traders are getting squeezed
Around $31 million in XRP futures liquidations were recorded over 24 hours, with the majority coming from bullish positions. That's a painful reminder of how quickly leverage can turn against traders.
2️⃣ ETF demand is showing weakness
US spot XRP ETFs recorded approximately $4.97 million in net outflows on November 20. Their combined assets also slipped below the $1 billion mark.
3️⃣ Oversold doesn't mean recovery is guaranteed
XRP's technical indicators have entered deeply oversold territory. That could attract bargain hunters, but buyers still need to prove they can sustain a recovery.
🎯 The price levels everyone should watch
- $0.86: Recent intraday low and important support area.
- $0.90: Psychological level to reclaim and hold.
- $0.95: Near-term recovery hurdle.
- $1.00: Major psychological milestone.
My market perspective
XRP is at a critical moment. A convincing recovery above $0.95 could improve short-term sentiment, while another breakdown below $0.86 would raise the risk of further losses.
But one thing is important: a falling price doesn't automatically make an asset undervalued, and an oversold indicator isn't a guaranteed buy signal.
🔥 THE BIG QUESTION FOR XRP HOLDERS:
At approximately $0.93, are you seeing a potential long-term opportunity or are you waiting for the selling pressure to settle?
🟢 RECOVERY — Buyers are preparing to return.
🔴 MORE DOWNSIDE — The worst may not be over.
I want to hear your reasoning, not just your prediction.
#XRPDropsToTwoYearLowNear87Cents #BitcoinFallsBelow$57KToTwoYearLow #NvidiaLoses$2.7TrillionInMonthAndAHalf #CanBTCReboundAfterFallingBelow60K? #GlobalStocksFaceLongestLosingStreakSince2023
💰 XRP CURRENT PRICE: ~$0.93
📉 24-hour trend: Under selling pressure
⚠️ Recent low: ~$0.86
Two years of price history just came back into focus. XRP has suffered a sharp sell-off, briefly touching approximately $0.86 before attempting to recover.
Prices are approximate and fluctuate across exchanges.
What's really happening with XRP?
This isn't just another ordinary red candle. Several factors are putting pressure on the market:
1️⃣ Leveraged traders are getting squeezed
Around $31 million in XRP futures liquidations were recorded over 24 hours, with the majority coming from bullish positions. That's a painful reminder of how quickly leverage can turn against traders.
2️⃣ ETF demand is showing weakness
US spot XRP ETFs recorded approximately $4.97 million in net outflows on November 20. Their combined assets also slipped below the $1 billion mark.
3️⃣ Oversold doesn't mean recovery is guaranteed
XRP's technical indicators have entered deeply oversold territory. That could attract bargain hunters, but buyers still need to prove they can sustain a recovery.
🎯 The price levels everyone should watch
- $0.86: Recent intraday low and important support area.
- $0.90: Psychological level to reclaim and hold.
- $0.95: Near-term recovery hurdle.
- $1.00: Major psychological milestone.
My market perspective
XRP is at a critical moment. A convincing recovery above $0.95 could improve short-term sentiment, while another breakdown below $0.86 would raise the risk of further losses.
But one thing is important: a falling price doesn't automatically make an asset undervalued, and an oversold indicator isn't a guaranteed buy signal.
🔥 THE BIG QUESTION FOR XRP HOLDERS:
At approximately $0.93, are you seeing a potential long-term opportunity or are you waiting for the selling pressure to settle?
🟢 RECOVERY — Buyers are preparing to return.
🔴 MORE DOWNSIDE — The worst may not be over.
I want to hear your reasoning, not just your prediction.
#XRPDropsToTwoYearLowNear87Cents #BitcoinFallsBelow$57KToTwoYearLow #NvidiaLoses$2.7TrillionInMonthAndAHalf #CanBTCReboundAfterFallingBelow60K? #GlobalStocksFaceLongestLosingStreakSince2023
35
Log in to explore more content
Join global crypto users on Binance Square
⚡️ Get latest and useful information about crypto.
💬 Trusted by the world’s largest crypto exchange.
👍 Discover real insights from verified creators.
Email / Phone number
Trending Topics
1
#NvidiaLoses$2.7TrillionInMonthAndAHalf
1,824 views
49 Discussing
2
#CanBTCReboundAfterFallingBelow60K?
550,336 views
2,398 Discussing
3
#GlobalStocksFaceLongestLosingStreakSince2023
195,151 views
1,660 Discussing
4
#BlackRockIBITPostsRecord$541MSingleDayOutflow
17,280 views
57 Discussing
5
#AnthropicPlungesTowardIPOPriceonDay2
93,913 views
968 Discussing
6
#TwentyOneCapitalAdds172.25BTC
40,605 views
485 Discussing
7
#HKBillWouldExcludeTokenizedDepositsFromVirtualAssets
3,969 views
47 Discussing
8
#BNBDropsBelow540USDTWith8.46%DailyDecline
54,280 views
499 Discussing
9
#HKBillProposesHK$100KFineForUnauthorizedCryptoTitles
1,858 views
20 Discussing
10
#BitMineFaces$10.1BUnrealizedETHLoss
4,052 views
25 Discussing