
#bigpump
bigpump
663,995 views
271 Discussing
Hot
Latest

·
--
Article
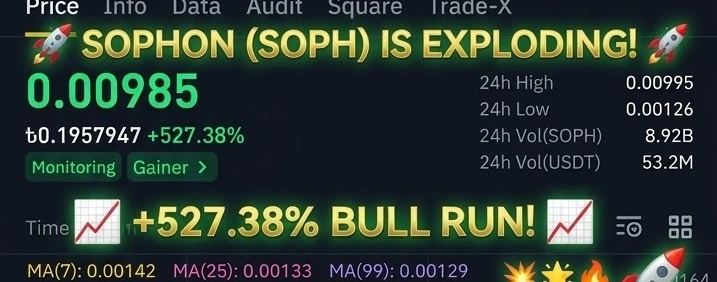
$SOPH treade idea$SOPH Based on the 1-hour (1h) Binance chart for SOPH/USDT, price has experienced an aggressive vertical breakout (+18.05% to 0.00157), accompanied by a massive spike in volume (314M SOPH on the current candle).
However, chasing green candles at this stage carries extreme risk—both technically and fundamentally.
1. Technical Snapshot (1h Chart)
Extreme Overbought Conditions: RSI(6) is at 97.62 and KDJ (J-line) is at 89.62. Readings this high indicate severe exhaustion and a very high probability of a sharp pullback or consolidation before any further upside.
Extended from Moving Averages: The current price (0.00157) is far above the EMA(7) at 0.00144, Supertrend(10,3) at 0.00138, and EMA(25) at 0.00135. Price rarely stays this far detached from short-term moving averages for long.
Immediate Resistance: The local wick high sits right above at 0.00162.
2. Crucial Fundamental Warning
Before entering any position on SOPH, be aware of major upcoming events affecting its liquidity and utility:
Mainnet Shutdown: Sophon has announced plans to close its Layer 2 mainnet on November 30, 2026 (with a user withdrawal deadline of November 25) as it pivots to consumer apps on Base.
Exchange Delistings: Major exchanges like Upbit are ending SOPH trading around November 16, 2026, which can trigger sudden volatility and liquidity drops.
3. Potential Trade Setups
Because buying directly at 0.00157 leaves you vulnerable to an immediate RSI cooldown, consider waiting for one of these two structured setups rather than FOMO-buying the top:
Setup A: Pullback / Retest Long (Safer Momentum Play)
Wait for the 1h RSI to cool down from 97+ and for price to retest broken resistance as new support.
Entry Zone: 0.00142 – 0.00145 (aligns with the rising EMA(7) and MA(7) and the previous breakout body).
Stop-Loss: 0.00134 (just below the EMA(25) and Supertrend support).
Take-Profit Targets:
TP1: 0.00160 (retest of the 24h high)
TP2: 0.00172 (psychological extension if volume stays elevated)
)
Setup B: Rejection Scalp Short (Counter-Trend / High Risk)
If price fails to break above the 0.00162 high and prints a bearish rejection candle (like a shooting star or bearish engulfing on the 15m/1h chart) while RSI starts curving down:
Entry Zone: 0.00158 – 0.00161 (only on confirmed rejection).
Stop-Loss: 0.00166 (strict stop above the wick high in case of a short squeeze).
Take-Profit Targets:
TP1: 0.00145 (EMA(7) mean reversion)
TP2: 0.00138 (Supertrend support)
)
Key Takeaway: Keep position sizes small and use strict stop-losses. Sudden pumps on tokens facing delistings or chain shutdowns are often driven by short squeezes and can retrace 100% of their gains just as quickly.
#ProfitableTrades #bigpump #WHEALS #BullRunAhead
{spot}(DODOUSDT)
{spot}(XRPUSDT)
$SOPH treade idea
$SOPH Based on the 1-hour (1h) Binance chart for SOPH/USDT, price has experienced an aggressive vertical breakout (+18.05% to 0.00157), accompanied by a massive spike in volume (314M SOPH on the current candle).
However, chasing green candles at this stage carries extreme risk—both technically and fundamentally.
1. Technical Snapshot (1h Chart)
Extreme Overbought Conditions: RSI(6) is at 97.62 and KDJ (J-line) is at 89.62. Readings this high indicate severe exhaustion and a very high probability of a sharp pullback or consolidation before any further upside.
Extended from Moving Averages: The current price (0.00157) is far above the EMA(7) at 0.00144, Supertrend(10,3) at 0.00138, and EMA(25) at 0.00135. Price rarely stays this far detached from short-term moving averages for long.
Immediate Resistance: The local wick high sits right above at 0.00162.
2. Crucial Fundamental Warning
Before entering any position on SOPH, be aware of major upcoming events affecting its liquidity and utility:
Mainnet Shutdown: Sophon has announced plans to close its Layer 2 mainnet on November 30, 2026 (with a user withdrawal deadline of November 25) as it pivots to consumer apps on Base.
Exchange Delistings: Major exchanges like Upbit are ending SOPH trading around November 16, 2026, which can trigger sudden volatility and liquidity drops.
3. Potential Trade Setups
Because buying directly at 0.00157 leaves you vulnerable to an immediate RSI cooldown, consider waiting for one of these two structured setups rather than FOMO-buying the top:
Setup A: Pullback / Retest Long (Safer Momentum Play)
Wait for the 1h RSI to cool down from 97+ and for price to retest broken resistance as new support.
Entry Zone: 0.00142 – 0.00145 (aligns with the rising EMA(7) and MA(7) and the previous breakout body).
Stop-Loss: 0.00134 (just below the EMA(25) and Supertrend support).
Take-Profit Targets:
TP1: 0.00160 (retest of the 24h high)
TP2: 0.00172 (psychological extension if volume stays elevated)
)
Setup B: Rejection Scalp Short (Counter-Trend / High Risk)
If price fails to break above the 0.00162 high and prints a bearish rejection candle (like a shooting star or bearish engulfing on the 15m/1h chart) while RSI starts curving down:
Entry Zone: 0.00158 – 0.00161 (only on confirmed rejection).
Stop-Loss: 0.00166 (strict stop above the wick high in case of a short squeeze).
Take-Profit Targets:
TP1: 0.00145 (EMA(7) mean reversion)
TP2: 0.00138 (Supertrend support)
)
Key Takeaway: Keep position sizes small and use strict stop-losses. Sudden pumps on tokens facing delistings or chain shutdowns are often driven by short squeezes and can retrace 100% of their gains just as quickly.
#ProfitableTrades #bigpump #WHEALS #BullRunAhead
However, chasing green candles at this stage carries extreme risk—both technically and fundamentally.
1. Technical Snapshot (1h Chart)
Extreme Overbought Conditions: RSI(6) is at 97.62 and KDJ (J-line) is at 89.62. Readings this high indicate severe exhaustion and a very high probability of a sharp pullback or consolidation before any further upside.
Extended from Moving Averages: The current price (0.00157) is far above the EMA(7) at 0.00144, Supertrend(10,3) at 0.00138, and EMA(25) at 0.00135. Price rarely stays this far detached from short-term moving averages for long.
Immediate Resistance: The local wick high sits right above at 0.00162.
2. Crucial Fundamental Warning
Before entering any position on SOPH, be aware of major upcoming events affecting its liquidity and utility:
Mainnet Shutdown: Sophon has announced plans to close its Layer 2 mainnet on November 30, 2026 (with a user withdrawal deadline of November 25) as it pivots to consumer apps on Base.
Exchange Delistings: Major exchanges like Upbit are ending SOPH trading around November 16, 2026, which can trigger sudden volatility and liquidity drops.
3. Potential Trade Setups
Because buying directly at 0.00157 leaves you vulnerable to an immediate RSI cooldown, consider waiting for one of these two structured setups rather than FOMO-buying the top:
Setup A: Pullback / Retest Long (Safer Momentum Play)
Wait for the 1h RSI to cool down from 97+ and for price to retest broken resistance as new support.
Entry Zone: 0.00142 – 0.00145 (aligns with the rising EMA(7) and MA(7) and the previous breakout body).
Stop-Loss: 0.00134 (just below the EMA(25) and Supertrend support).
Take-Profit Targets:
TP1: 0.00160 (retest of the 24h high)
TP2: 0.00172 (psychological extension if volume stays elevated)
)
Setup B: Rejection Scalp Short (Counter-Trend / High Risk)
If price fails to break above the 0.00162 high and prints a bearish rejection candle (like a shooting star or bearish engulfing on the 15m/1h chart) while RSI starts curving down:
Entry Zone: 0.00158 – 0.00161 (only on confirmed rejection).
Stop-Loss: 0.00166 (strict stop above the wick high in case of a short squeeze).
Take-Profit Targets:
TP1: 0.00145 (EMA(7) mean reversion)
TP2: 0.00138 (Supertrend support)
)
Key Takeaway: Keep position sizes small and use strict stop-losses. Sudden pumps on tokens facing delistings or chain shutdowns are often driven by short squeezes and can retrace 100% of their gains just as quickly.
#ProfitableTrades #bigpump #WHEALS #BullRunAhead
1
200

🚀 $LIGHT $LUMIA $RECALL READY TO BLAST OFF IN BIG PUMP! 📈
📊 Smart money is stacking liquidity at key order blocks, and the volume surge on the 4H chart screams a whale‑driven push. 🦈 The recent price action has ripped through minor resistance, leaving a clean path for a bullish wave to ride. ⚡
💡 Sellers are scrambling to protect positions while buyers line up for the next wave—don’t let the lull fool you, the engine is revving. 💬 Are you set to ride the surge or watching from the sidelines? 👇
⚠️ Not financial advice. Always manage your risk. 🛡️
🏷️ #LIGHT #BigPump #BullRun #Crypto
🚀 💎
🚀 $LIGHT $LUMIA $RECALL READY TO BLAST OFF IN BIG PUMP! 📈
📊 Smart money is stacking liquidity at key order blocks, and the volume surge on the 4H chart screams a whale‑driven push. 🦈 The recent price action has ripped through minor resistance, leaving a clean path for a bullish wave to ride. ⚡
💡 Sellers are scrambling to protect positions while buyers line up for the next wave—don’t let the lull fool you, the engine is revving. 💬 Are you set to ride the surge or watching from the sidelines? 👇
⚠️ Not financial advice. Always manage your risk. 🛡️
🏷️ #LIGHT #BigPump #BullRun #Crypto
🚀 💎
📊 Smart money is stacking liquidity at key order blocks, and the volume surge on the 4H chart screams a whale‑driven push. 🦈 The recent price action has ripped through minor resistance, leaving a clean path for a bullish wave to ride. ⚡
💡 Sellers are scrambling to protect positions while buyers line up for the next wave—don’t let the lull fool you, the engine is revving. 💬 Are you set to ride the surge or watching from the sidelines? 👇
⚠️ Not financial advice. Always manage your risk. 🛡️
🏷️ #LIGHT #BigPump #BullRun #Crypto
🚀 💎

31

·
--
Bullish
1
1
253


·
--
Bullish
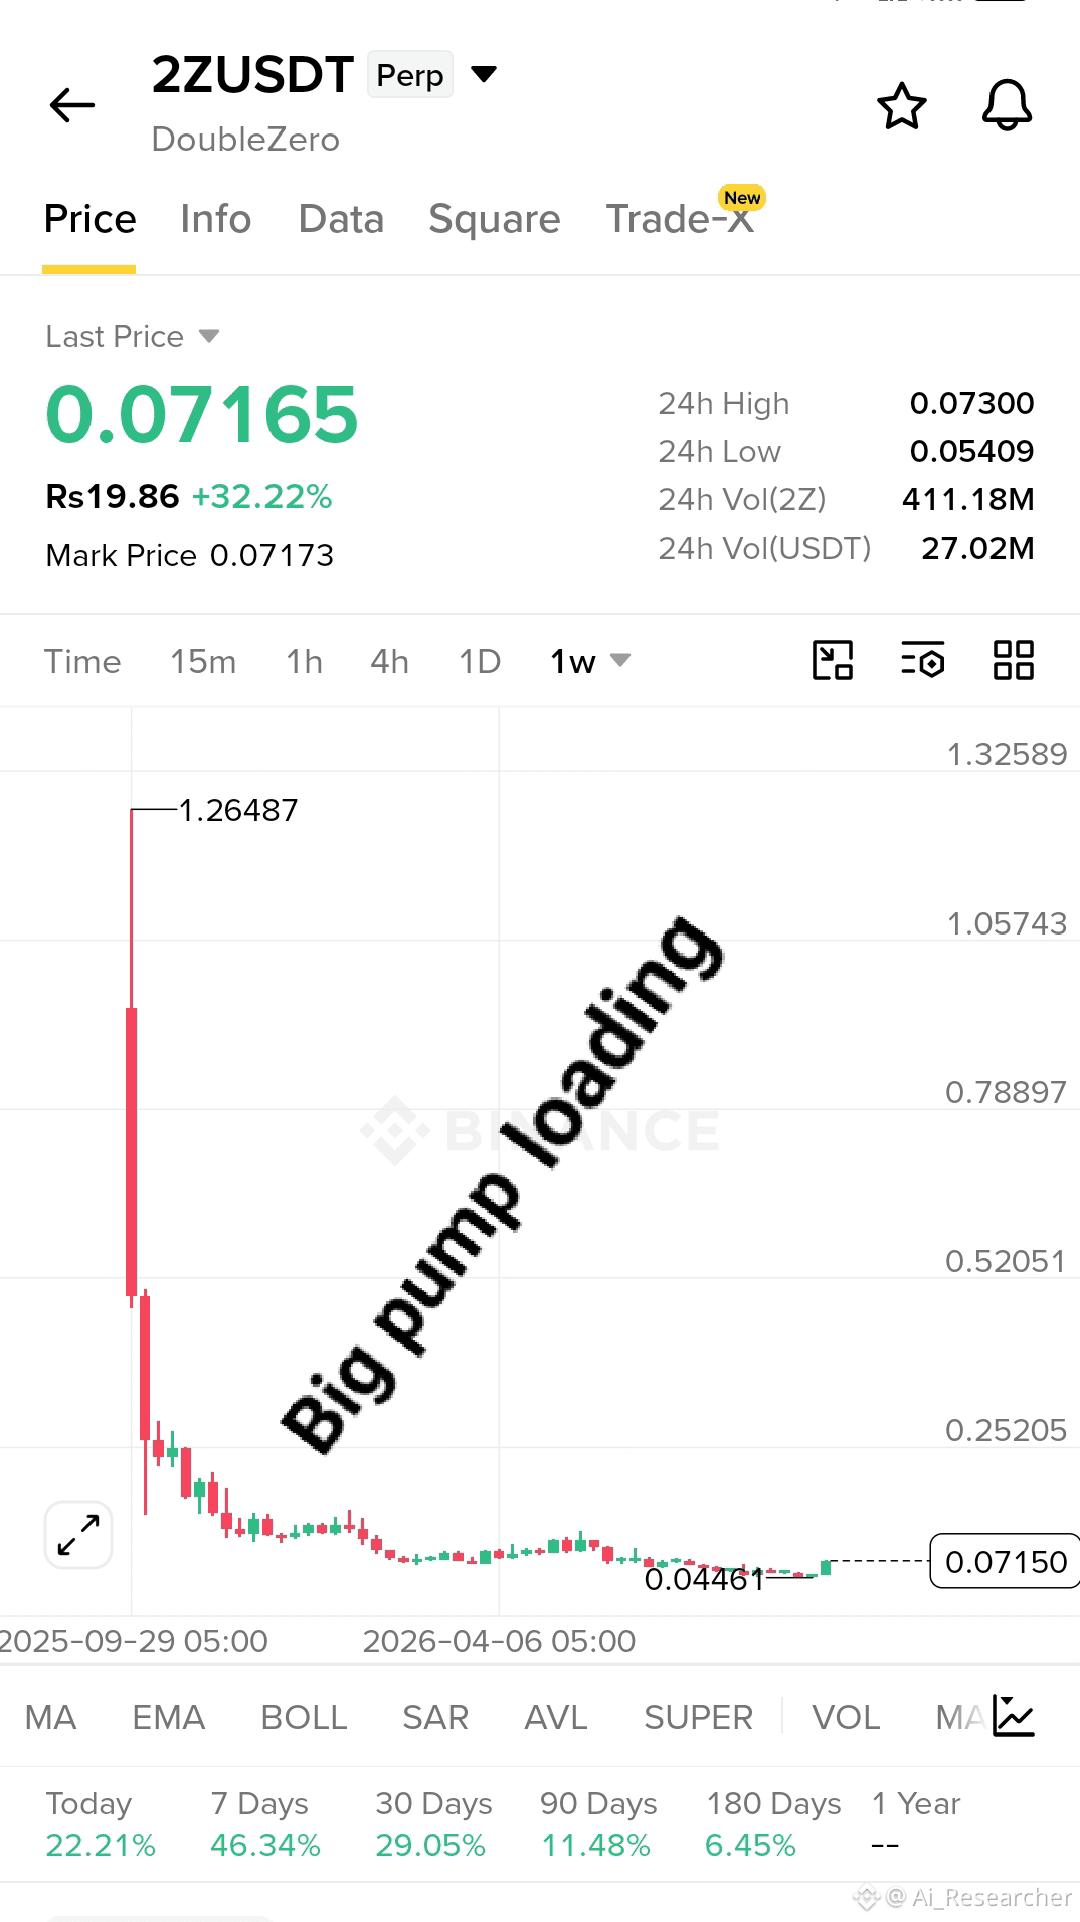
$2Z will hit 1$ 🚀🎯 Sooooon 😱🔥💰••••+$
Sooooon #BIGPUMP 💹 loading.... +🚀💥✨📊
Long-term accumulation is building… 👀
Next Target 🎯 1$
Don’t miss this move… 🚨
Trade $2Z Here 👇
{future}(2ZUSDT)
$2Z will hit 1$ 🚀🎯 Sooooon 😱🔥💰••••+$
Sooooon #BIGPUMP 💹 loading.... +🚀💥✨📊
Long-term accumulation is building… 👀
Next Target 🎯 1$
Don’t miss this move… 🚨
Trade $2Z Here 👇
Sooooon #BIGPUMP 💹 loading.... +🚀💥✨📊
Long-term accumulation is building… 👀
Next Target 🎯 1$
Don’t miss this move… 🚨
Trade $2Z Here 👇
1
93


·
--
Bullish
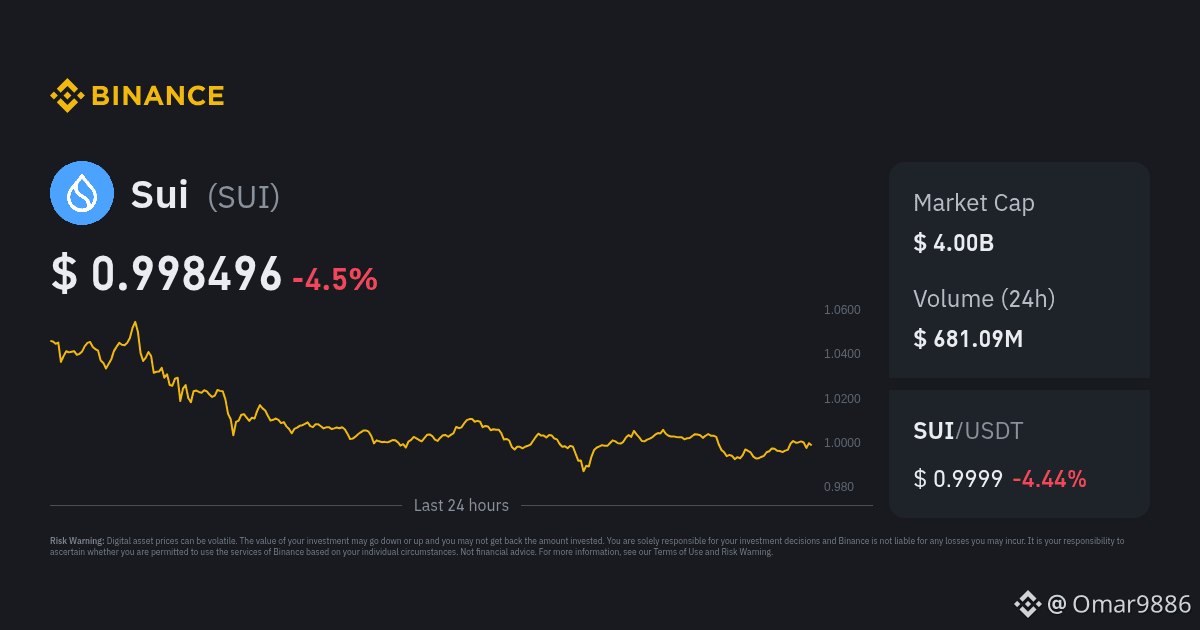
SUI the next big star:
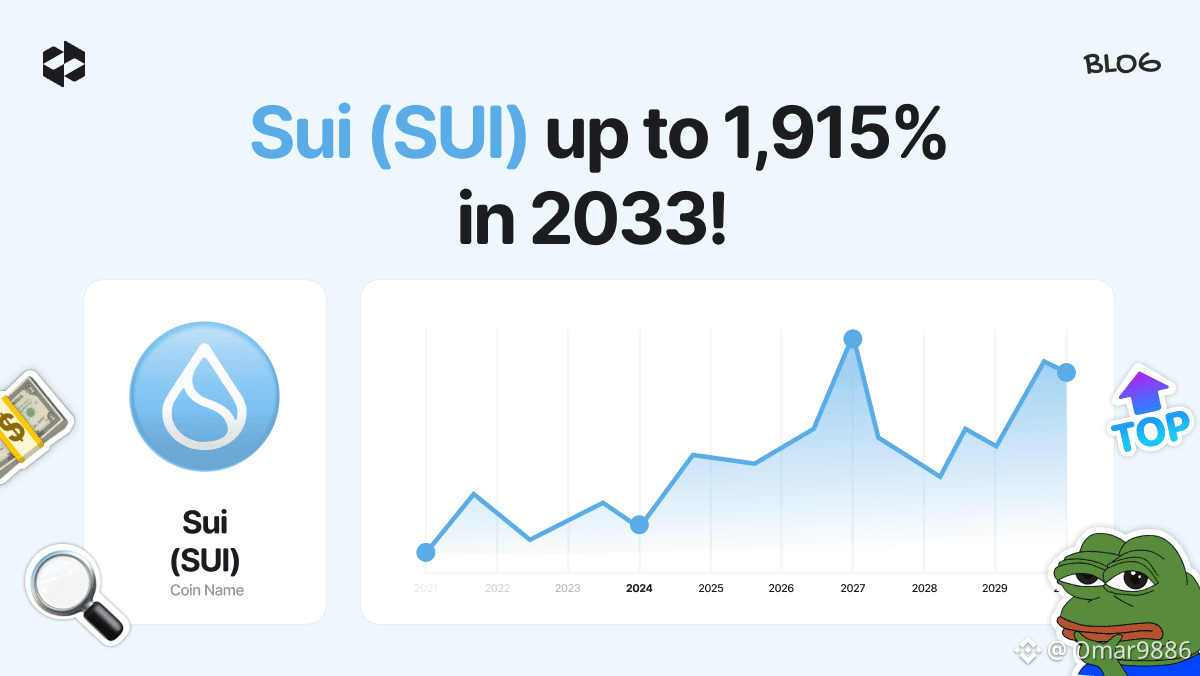
Sui (SUI) price predictions for 2026 range from a conservative low of approximately \(\$0.76\) to a high-end projection of \(\$9.26\) depending on the market sentiment. Over the long term, models project SUI could reach between $3.40 and $18.20 by 2030, heavily reliant on broader crypto market trends and network adoption.
$SUI at $1.81
24h high $1.89
24h low $1.73
SUI holding trend support nicely while traders re-enter near current levels. Momentum setup remains attractive. ⚡
#SUI🔥 #NextGenAltcoins #Bigpump
SUI the next big star:
Sui (SUI) price predictions for 2026 range from a conservative low of approximately \(\$0.76\) to a high-end projection of \(\$9.26\) depending on the market sentiment. Over the long term, models project SUI could reach between $3.40 and $18.20 by 2030, heavily reliant on broader crypto market trends and network adoption.
$SUI at $1.81
24h high $1.89
24h low $1.73
SUI holding trend support nicely while traders re-enter near current levels. Momentum setup remains attractive. ⚡
#SUI🔥 #NextGenAltcoins #Bigpump
Sui (SUI) price predictions for 2026 range from a conservative low of approximately \(\$0.76\) to a high-end projection of \(\$9.26\) depending on the market sentiment. Over the long term, models project SUI could reach between $3.40 and $18.20 by 2030, heavily reliant on broader crypto market trends and network adoption.
$SUI at $1.81
24h high $1.89
24h low $1.73
SUI holding trend support nicely while traders re-enter near current levels. Momentum setup remains attractive. ⚡
#SUI🔥 #NextGenAltcoins #Bigpump
135


Article
SYN/USDT Shows Strong Bullish Momentum on Binance$SYN Shows Strong Bullish Momentum on Binance
{spot}(SYNUSDT)
$SYN is attracting significant attention on Binance after posting impressive gains and maintaining strong bullish momentum. At the time of writing, SYN is trading around $0.1614, representing a daily increase of more than 21%. The token recently reached a 24-hour high of $0.1972, highlighting strong buying interest from traders.
Technical indicators suggest that SYN remains in an upward trend. The price is trading above key moving averages, including the 7-day, 25-day, and 99-day averages, which is generally considered a positive sign for market sentiment. Trading volume has also increased, indicating active participation from both short-term traders and long-term investors.
The order book shows relatively balanced market activity, with buyers maintaining a slight advantage. This suggests that demand remains healthy despite recent volatility. If bullish momentum continues, SYN could attempt another move toward recent resistance levels. However, traders should remain cautious, as profit-taking after strong rallies can lead to temporary pullbacks.
Performance data shows SYN has delivered exceptional returns over multiple timeframes, including gains of over 400% in the past seven days. While the trend remains positive, risk management and proper research are essential before making any investment decisions.
Disclaimer: This article is for informational purposes only and not financial advice.
#SYN #IranMandatesHormuzShipInsurance #BitcoinNetworkActivityNearAllTimeHigh #Bigpump
SYN/USDT Shows Strong Bullish Momentum on Binance
$SYN Shows Strong Bullish Momentum on Binance
$SYN is attracting significant attention on Binance after posting impressive gains and maintaining strong bullish momentum. At the time of writing, SYN is trading around $0.1614, representing a daily increase of more than 21%. The token recently reached a 24-hour high of $0.1972, highlighting strong buying interest from traders.
Technical indicators suggest that SYN remains in an upward trend. The price is trading above key moving averages, including the 7-day, 25-day, and 99-day averages, which is generally considered a positive sign for market sentiment. Trading volume has also increased, indicating active participation from both short-term traders and long-term investors.
The order book shows relatively balanced market activity, with buyers maintaining a slight advantage. This suggests that demand remains healthy despite recent volatility. If bullish momentum continues, SYN could attempt another move toward recent resistance levels. However, traders should remain cautious, as profit-taking after strong rallies can lead to temporary pullbacks.
Performance data shows SYN has delivered exceptional returns over multiple timeframes, including gains of over 400% in the past seven days. While the trend remains positive, risk management and proper research are essential before making any investment decisions.
Disclaimer: This article is for informational purposes only and not financial advice.
#SYN #IranMandatesHormuzShipInsurance #BitcoinNetworkActivityNearAllTimeHigh #Bigpump
$SYN is attracting significant attention on Binance after posting impressive gains and maintaining strong bullish momentum. At the time of writing, SYN is trading around $0.1614, representing a daily increase of more than 21%. The token recently reached a 24-hour high of $0.1972, highlighting strong buying interest from traders.
Technical indicators suggest that SYN remains in an upward trend. The price is trading above key moving averages, including the 7-day, 25-day, and 99-day averages, which is generally considered a positive sign for market sentiment. Trading volume has also increased, indicating active participation from both short-term traders and long-term investors.
The order book shows relatively balanced market activity, with buyers maintaining a slight advantage. This suggests that demand remains healthy despite recent volatility. If bullish momentum continues, SYN could attempt another move toward recent resistance levels. However, traders should remain cautious, as profit-taking after strong rallies can lead to temporary pullbacks.
Performance data shows SYN has delivered exceptional returns over multiple timeframes, including gains of over 400% in the past seven days. While the trend remains positive, risk management and proper research are essential before making any investment decisions.
Disclaimer: This article is for informational purposes only and not financial advice.
#SYN #IranMandatesHormuzShipInsurance #BitcoinNetworkActivityNearAllTimeHigh #Bigpump
1
200

·
--
Bullish
Price Action Analysis for Coin #PUMP
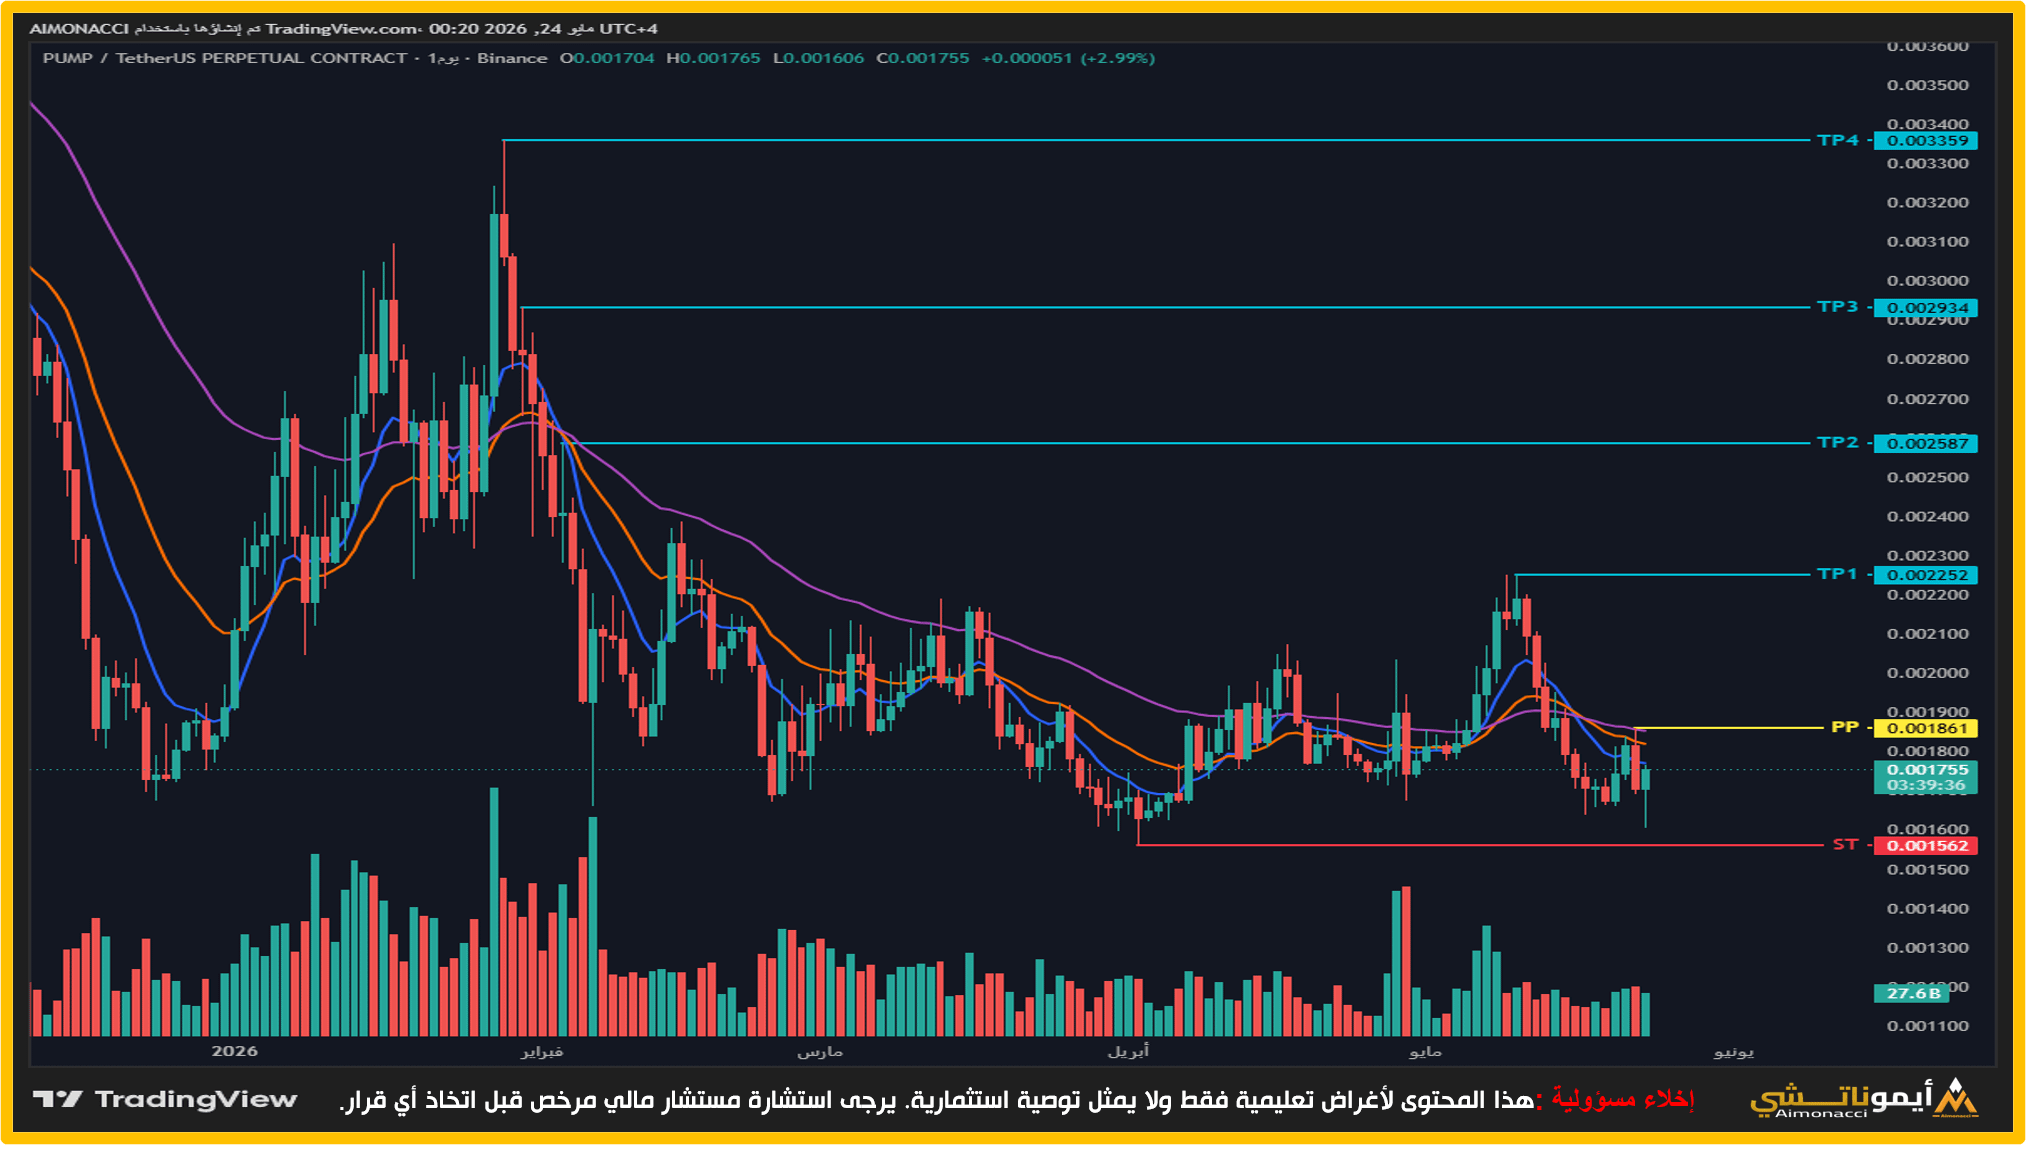
The chart $PUMP shows sideways trading with a bearish tilt on the daily timeframe, with the price currently sitting at $0.001755, below the moving averages that are negatively influencing the short-term trend. The price is attempting to build a support base near the recent low to regain equilibrium, and according to the Fibonacci tool, the upcoming movement levels are outlined as follows:
Pivot Point (PP): Located at $0.001861, breaking and stabilizing above this level is the key to breaking free and shifting to a bullish path.
Target Resistance Levels: If the pivot point is breached, subsequent upward targets are distributed at TP1: $0.002252, then TP2: $0.002587, followed by TP3: $0.002934, up to TP4: $0.003359.
Key Support Level: The level ST: $0.001562 acts as a major protective wall and the last safety valve to prevent further price bleed.
The most likely scenario is continued tight fluctuations below the pivot point, with anticipation of a breakout to initiate a rapid rebound wave.
#PUMP #BigPump #Crypto #AIMONACCI
Price Action Analysis for Coin #PUMP
The chart $PUMP shows sideways trading with a bearish tilt on the daily timeframe, with the price currently sitting at $0.001755, below the moving averages that are negatively influencing the short-term trend. The price is attempting to build a support base near the recent low to regain equilibrium, and according to the Fibonacci tool, the upcoming movement levels are outlined as follows:
Pivot Point (PP): Located at $0.001861, breaking and stabilizing above this level is the key to breaking free and shifting to a bullish path.
Target Resistance Levels: If the pivot point is breached, subsequent upward targets are distributed at TP1: $0.002252, then TP2: $0.002587, followed by TP3: $0.002934, up to TP4: $0.003359.
Key Support Level: The level ST: $0.001562 acts as a major protective wall and the last safety valve to prevent further price bleed.
The most likely scenario is continued tight fluctuations below the pivot point, with anticipation of a breakout to initiate a rapid rebound wave.
#PUMP #BigPump #Crypto #AIMONACCI
The chart $PUMP shows sideways trading with a bearish tilt on the daily timeframe, with the price currently sitting at $0.001755, below the moving averages that are negatively influencing the short-term trend. The price is attempting to build a support base near the recent low to regain equilibrium, and according to the Fibonacci tool, the upcoming movement levels are outlined as follows:
Pivot Point (PP): Located at $0.001861, breaking and stabilizing above this level is the key to breaking free and shifting to a bullish path.
Target Resistance Levels: If the pivot point is breached, subsequent upward targets are distributed at TP1: $0.002252, then TP2: $0.002587, followed by TP3: $0.002934, up to TP4: $0.003359.
Key Support Level: The level ST: $0.001562 acts as a major protective wall and the last safety valve to prevent further price bleed.
The most likely scenario is continued tight fluctuations below the pivot point, with anticipation of a breakout to initiate a rapid rebound wave.
#PUMP #BigPump #Crypto #AIMONACCI
1
3
2.6k

·
--
Bullish
BUY Signal $IOTA
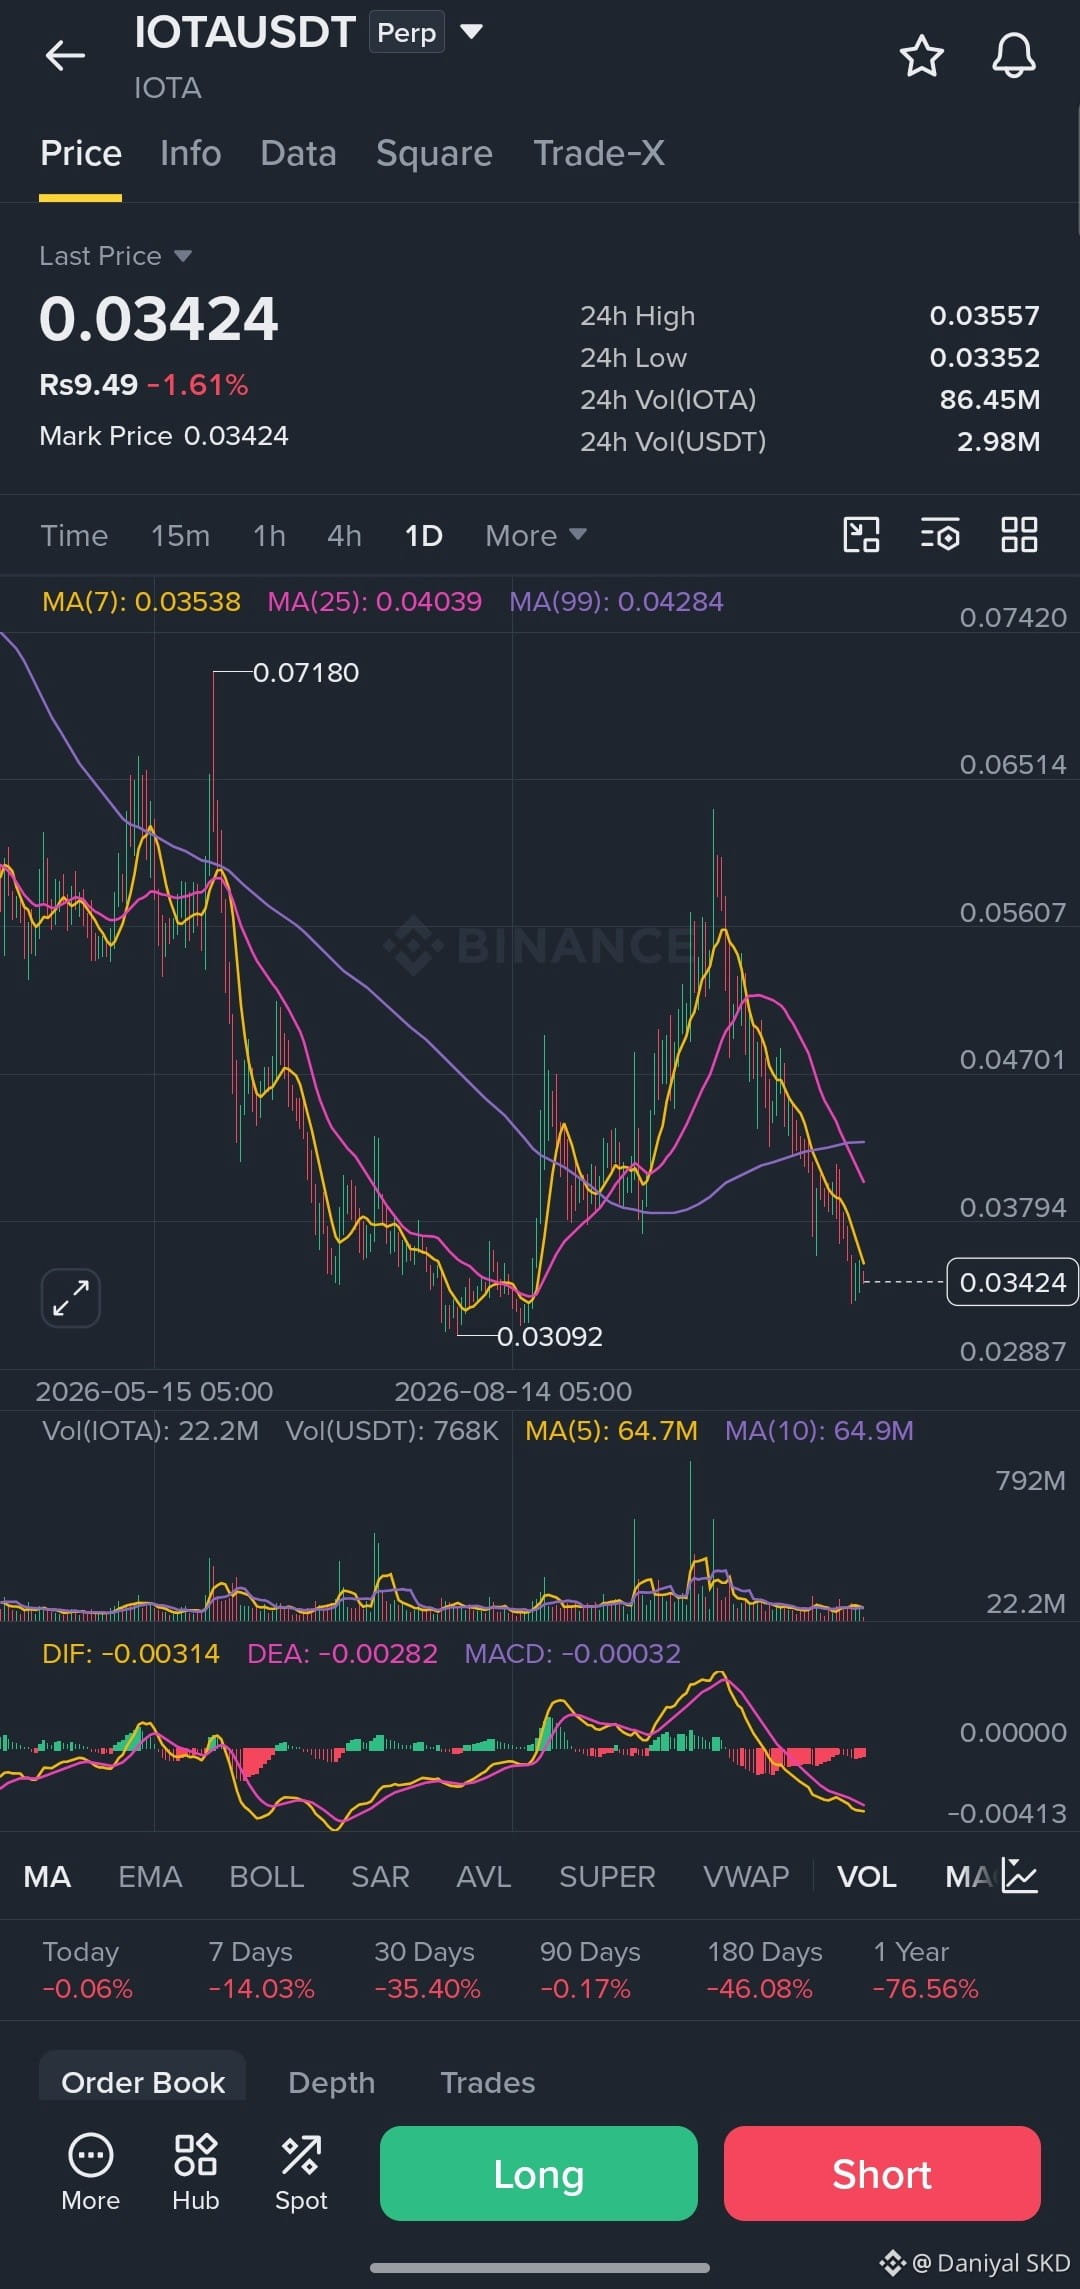
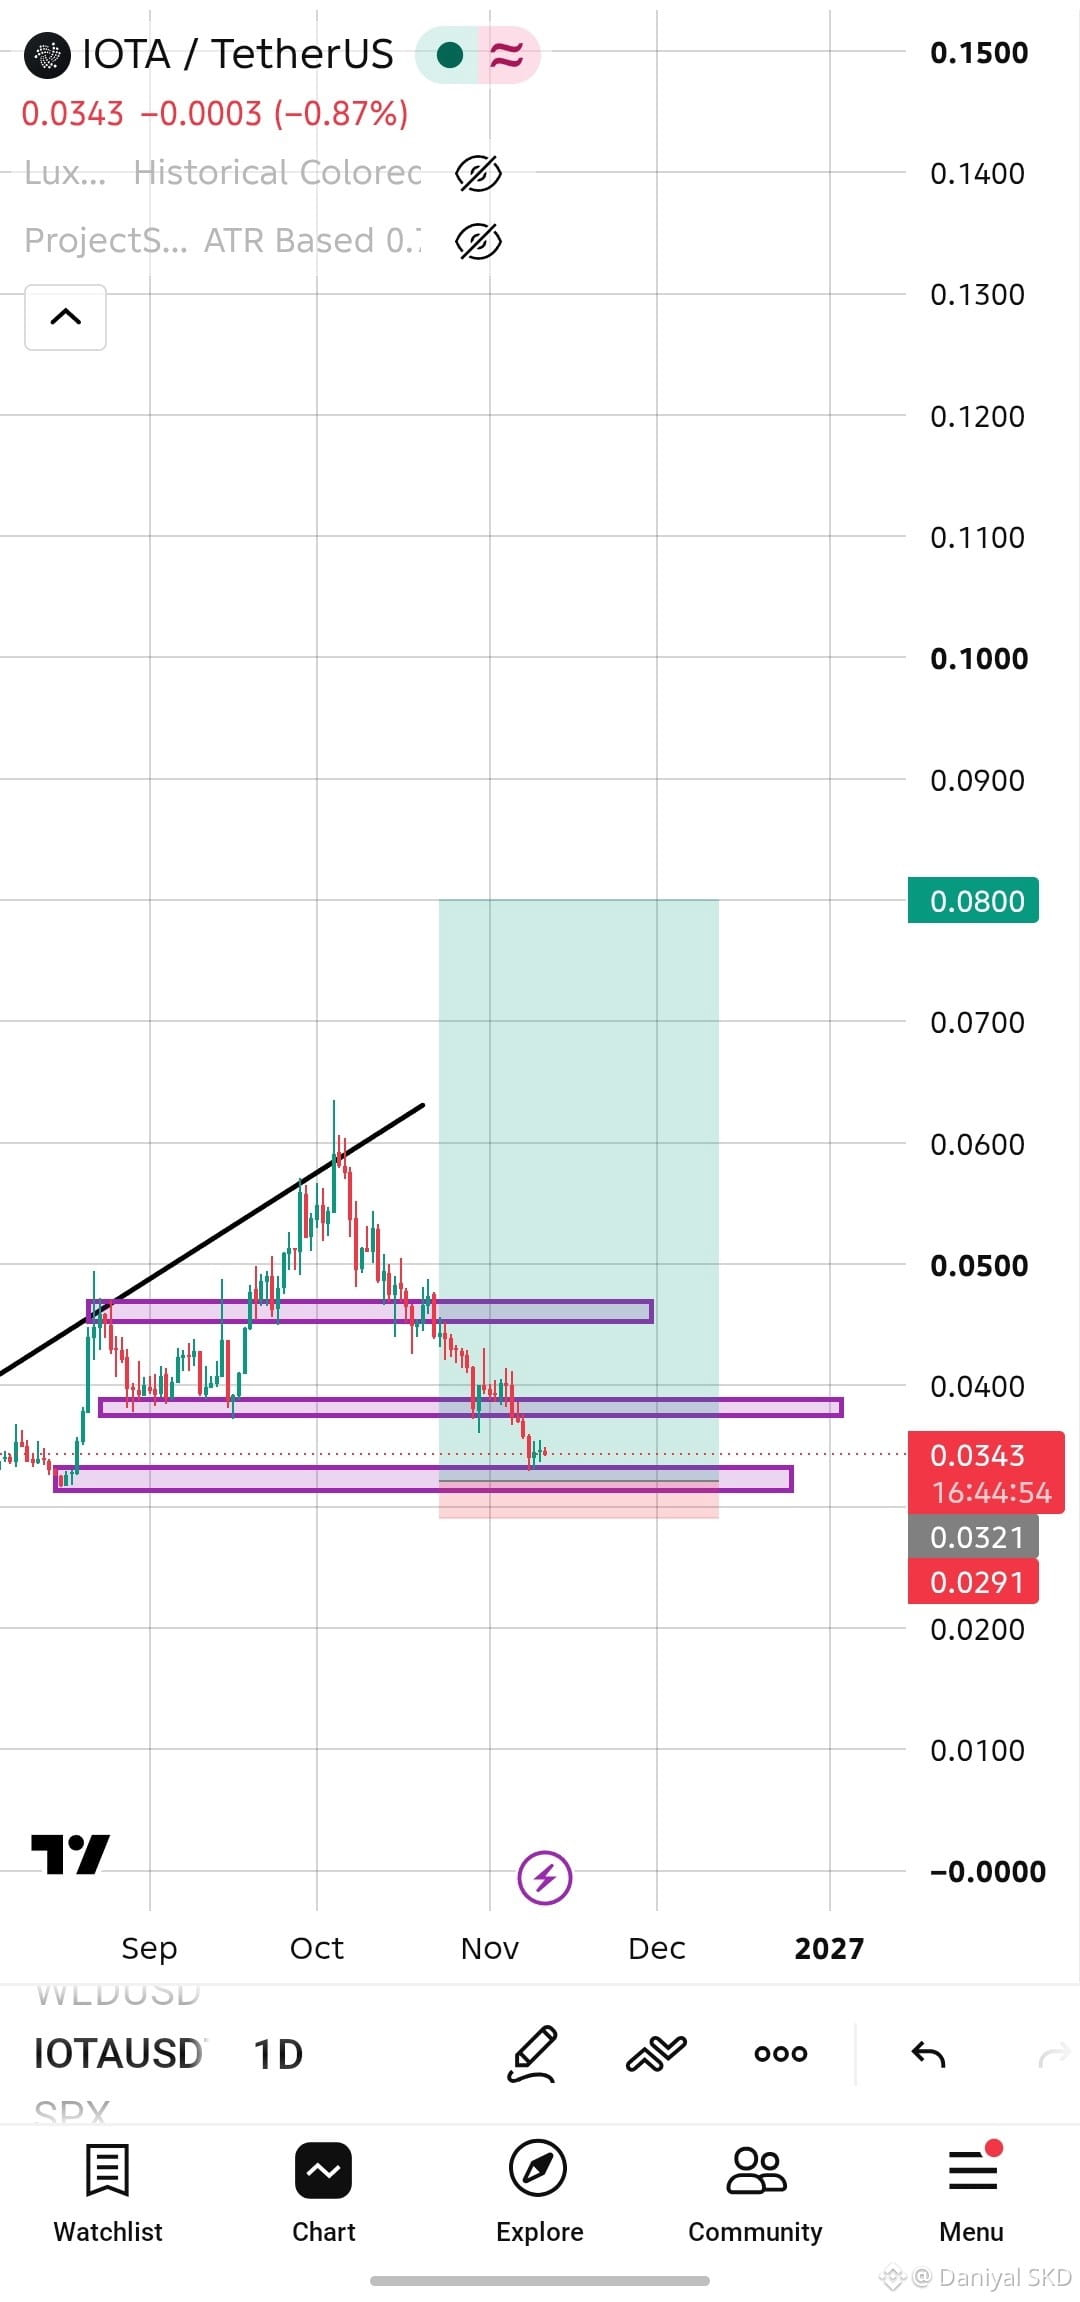
IOTA eyes a quick rebound as buyers test the near‑term support
ENTRY: 0.032 to 0.034
SL: 0.3
TP 1:0.038
TP 2:0.0.045
TP 3:0.06
TP 4:0.08
The provided daily chart for IOTA/TetherUS (IOTA/USDT) shows the cryptocurrency trading at 0.0343 down 0.87%, following a pullback from its local peak near 0.0600 in October. Price action has broken below previous horizontal support zones and is currently testing a lower demand area marked around the 0.0321–0.0343 range. The overlaid long trade setup highlights a bullish entry with a tight stop-loss placed just beneath recent lows and a higher profit target extending toward 0.0800.
{spot}(IOTAUSDT)
#iota #longpositions #Binance #Bigpump
BUY Signal $IOTA
IOTA eyes a quick rebound as buyers test the near‑term support
ENTRY: 0.032 to 0.034
SL: 0.3
TP 1:0.038
TP 2:0.0.045
TP 3:0.06
TP 4:0.08
The provided daily chart for IOTA/TetherUS (IOTA/USDT) shows the cryptocurrency trading at 0.0343 down 0.87%, following a pullback from its local peak near 0.0600 in October. Price action has broken below previous horizontal support zones and is currently testing a lower demand area marked around the 0.0321–0.0343 range. The overlaid long trade setup highlights a bullish entry with a tight stop-loss placed just beneath recent lows and a higher profit target extending toward 0.0800.
#iota #longpositions #Binance #Bigpump
IOTA eyes a quick rebound as buyers test the near‑term support
ENTRY: 0.032 to 0.034
SL: 0.3
TP 1:0.038
TP 2:0.0.045
TP 3:0.06
TP 4:0.08
The provided daily chart for IOTA/TetherUS (IOTA/USDT) shows the cryptocurrency trading at 0.0343 down 0.87%, following a pullback from its local peak near 0.0600 in October. Price action has broken below previous horizontal support zones and is currently testing a lower demand area marked around the 0.0321–0.0343 range. The overlaid long trade setup highlights a bullish entry with a tight stop-loss placed just beneath recent lows and a higher profit target extending toward 0.0800.
#iota #longpositions #Binance #Bigpump
2
238

·
--
Bullish
BINANCE SPOT GAINERS TODAY - REAL STRENGTH SHOWING!
While Alpha is doing 200% pumps, Binance Spot Gainers are showing sustainable moves. This is where real traders focus.
*Top 5 Spot Gainers:*
*CHIP +20.67%* - USD.AI leading. AI narrative is still king. Breaking 0.051 with volume = bullish continuation.
*SYN +18.73%* - Synapse is back. Cross-chain narrative pumping after long accumulation. Old gem waking up.
*PARTI +16.77%* - Particle Network, modular L1 hype. Holding 0.038 strong, shows buyers stepping in.
*BANK +15.81%* - Lorenzo Protocol, BTC restaking narrative. Steady climb, not a fake wick.
*KORUB +13.60%* - Leveraged Korea index, risk-on signal. When these pump, market confidence is high.
*My Trader Reading:*
Spot gainers +15-20% are more reliable than Alpha's 200%. This shows fresh liquidity entering real projects, not just low-float manipulation.
CHIP and SYN are showing trend continuation, PARTI and BANK are in accumulation breakout zone.
*What's Next:* If BTC holds, these can do another 20-30% leg. If BTC dips, they will hold better than Alpha coins.
I am rotating some Alpha profits into CHIP and SYN for safer swing.
Spot > Alpha for holding, Alpha > Spot for quick flips.
$CHIP
{future}(CHIPUSDT)
$SYN
{spot}(SYNUSDT)
$PARTI
{spot}(PARTIUSDT)
#spot_Signal
#GAINERS
#Bigpump
#ProfitableTrades
#skills
@heyi
@eggtartcake_grape
@haoge666
@happy-cute-seal
@sanmageshuai
@OmenX-Official
@Square-Creator-e02686919
@BNBAZ
@RyanZachBoi
@Square-Creator-a81959bd4d1b
@ZGdingyuanying
@XG297174
BINANCE SPOT GAINERS TODAY - REAL STRENGTH SHOWING!
While Alpha is doing 200% pumps, Binance Spot Gainers are showing sustainable moves. This is where real traders focus.
*Top 5 Spot Gainers:*
*CHIP +20.67%* - USD.AI leading. AI narrative is still king. Breaking 0.051 with volume = bullish continuation.
*SYN +18.73%* - Synapse is back. Cross-chain narrative pumping after long accumulation. Old gem waking up.
*PARTI +16.77%* - Particle Network, modular L1 hype. Holding 0.038 strong, shows buyers stepping in.
*BANK +15.81%* - Lorenzo Protocol, BTC restaking narrative. Steady climb, not a fake wick.
*KORUB +13.60%* - Leveraged Korea index, risk-on signal. When these pump, market confidence is high.
*My Trader Reading:*
Spot gainers +15-20% are more reliable than Alpha's 200%. This shows fresh liquidity entering real projects, not just low-float manipulation.
CHIP and SYN are showing trend continuation, PARTI and BANK are in accumulation breakout zone.
*What's Next:* If BTC holds, these can do another 20-30% leg. If BTC dips, they will hold better than Alpha coins.
I am rotating some Alpha profits into CHIP and SYN for safer swing.
Spot > Alpha for holding, Alpha > Spot for quick flips.
$CHIP
$SYN
$PARTI
#spot_Signal
#GAINERS
#Bigpump
#ProfitableTrades
#skills
@Yi He
@Eggtartcake
@交易员张张子
@快乐的小海豹
@三马哥
@OmenX Official
@阿嗨资本
@安子弟
@老郑睡不醒
@渴死鱼_半年3w-100w实盘已开
@加密门徒-预言机
@K线人生飞哥
While Alpha is doing 200% pumps, Binance Spot Gainers are showing sustainable moves. This is where real traders focus.
*Top 5 Spot Gainers:*
*CHIP +20.67%* - USD.AI leading. AI narrative is still king. Breaking 0.051 with volume = bullish continuation.
*SYN +18.73%* - Synapse is back. Cross-chain narrative pumping after long accumulation. Old gem waking up.
*PARTI +16.77%* - Particle Network, modular L1 hype. Holding 0.038 strong, shows buyers stepping in.
*BANK +15.81%* - Lorenzo Protocol, BTC restaking narrative. Steady climb, not a fake wick.
*KORUB +13.60%* - Leveraged Korea index, risk-on signal. When these pump, market confidence is high.
*My Trader Reading:*
Spot gainers +15-20% are more reliable than Alpha's 200%. This shows fresh liquidity entering real projects, not just low-float manipulation.
CHIP and SYN are showing trend continuation, PARTI and BANK are in accumulation breakout zone.
*What's Next:* If BTC holds, these can do another 20-30% leg. If BTC dips, they will hold better than Alpha coins.
I am rotating some Alpha profits into CHIP and SYN for safer swing.
Spot > Alpha for holding, Alpha > Spot for quick flips.
$CHIP
$SYN
$PARTI
#spot_Signal
#GAINERS
#Bigpump
#ProfitableTrades
#skills
@Yi He
@Eggtartcake
@交易员张张子
@快乐的小海豹
@三马哥
@OmenX Official
@阿嗨资本
@安子弟
@老郑睡不醒
@渴死鱼_半年3w-100w实盘已开
@加密门徒-预言机
@K线人生飞哥
1
299

·
--
$SAGA
alert Telegram PUMP!
target 1: 0.01980 $
target 2: 0.02456 $
target 3: 0.03560 $
target 4: LONG long long 😍😍😍 #CryptoAlert #Saga #Bigpump
$SAGA
alert Telegram PUMP!
target 1: 0.01980 $
target 2: 0.02456 $
target 3: 0.03560 $
target 4: LONG long long 😍😍😍 #CryptoAlert #Saga #Bigpump
alert Telegram PUMP!
target 1: 0.01980 $
target 2: 0.02456 $
target 3: 0.03560 $
target 4: LONG long long 😍😍😍 #CryptoAlert #Saga #Bigpump
3
1
481


·
--
$TUT 🌪️
🚀 You may or may not believe it, but I believe $TUT has the potential to see significant growth in the near future. 📈
If you haven’t added $TUT to your portfolio yet, this could be a good time to start paying attention. 🔥
One piece of advice: instead of trading on futures, consider buying and holding it on the spot market. Spot investing generally avoids liquidation risk and can be a more comfortable approach for long-term holders. 💎
As always, do your own research and manage your risk wisely. ✅
#TUTAlert #BNBChain. #crypto #DOYOR #Bigpump 🌪️
Not financial advice. ⚠️
$TUT 🌪️
🚀 You may or may not believe it, but I believe $TUT has the potential to see significant growth in the near future. 📈
If you haven’t added $TUT to your portfolio yet, this could be a good time to start paying attention. 🔥
One piece of advice: instead of trading on futures, consider buying and holding it on the spot market. Spot investing generally avoids liquidation risk and can be a more comfortable approach for long-term holders. 💎
As always, do your own research and manage your risk wisely. ✅
#TUTAlert #BNBChain. #crypto #DOYOR #Bigpump 🌪️
Not financial advice. ⚠️
🚀 You may or may not believe it, but I believe $TUT has the potential to see significant growth in the near future. 📈
If you haven’t added $TUT to your portfolio yet, this could be a good time to start paying attention. 🔥
One piece of advice: instead of trading on futures, consider buying and holding it on the spot market. Spot investing generally avoids liquidation risk and can be a more comfortable approach for long-term holders. 💎
As always, do your own research and manage your risk wisely. ✅
#TUTAlert #BNBChain. #crypto #DOYOR #Bigpump 🌪️
Not financial advice. ⚠️
2
362


·
--
Bullish
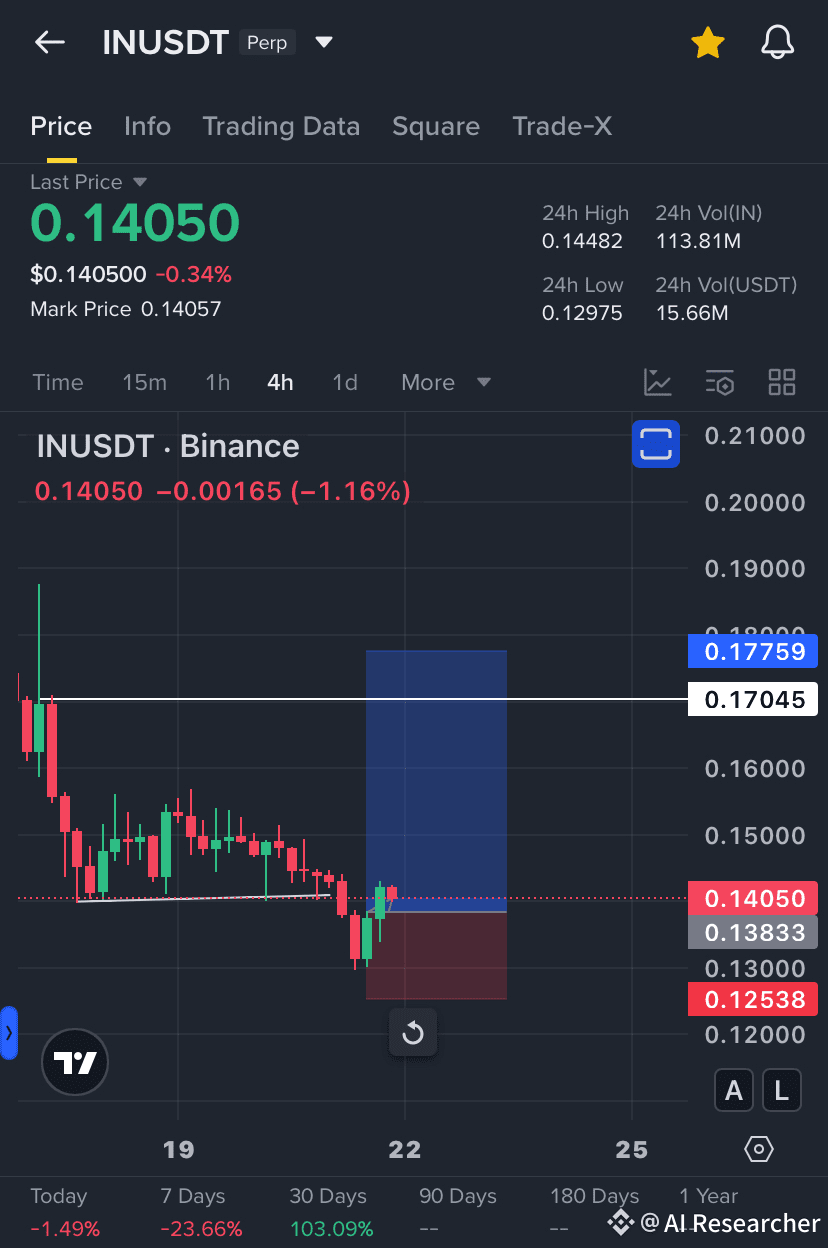
$INUSDT – Reversal Loading 🚀
After a healthy correction, $IN looks ready to bounce back strong.
The structure shows clear accumulation and a potential move toward the $0.17–$0.18 zone next.
Smart traders accumulate when the noise is high and the chart is quiet.
Momentum is shifting this could be the start of the next leg up.
Keep your eyes on $IN , this one might surprise the market soon 👀
#IN #Bigpump
$INUSDT – Reversal Loading 🚀
After a healthy correction, $IN looks ready to bounce back strong.
The structure shows clear accumulation and a potential move toward the $0.17–$0.18 zone next.
Smart traders accumulate when the noise is high and the chart is quiet.
Momentum is shifting this could be the start of the next leg up.
Keep your eyes on $IN , this one might surprise the market soon 👀
#IN #Bigpump
After a healthy correction, $IN looks ready to bounce back strong.
The structure shows clear accumulation and a potential move toward the $0.17–$0.18 zone next.
Smart traders accumulate when the noise is high and the chart is quiet.
Momentum is shifting this could be the start of the next leg up.
Keep your eyes on $IN , this one might surprise the market soon 👀
#IN #Bigpump
2
1
6
3.2k

·
--
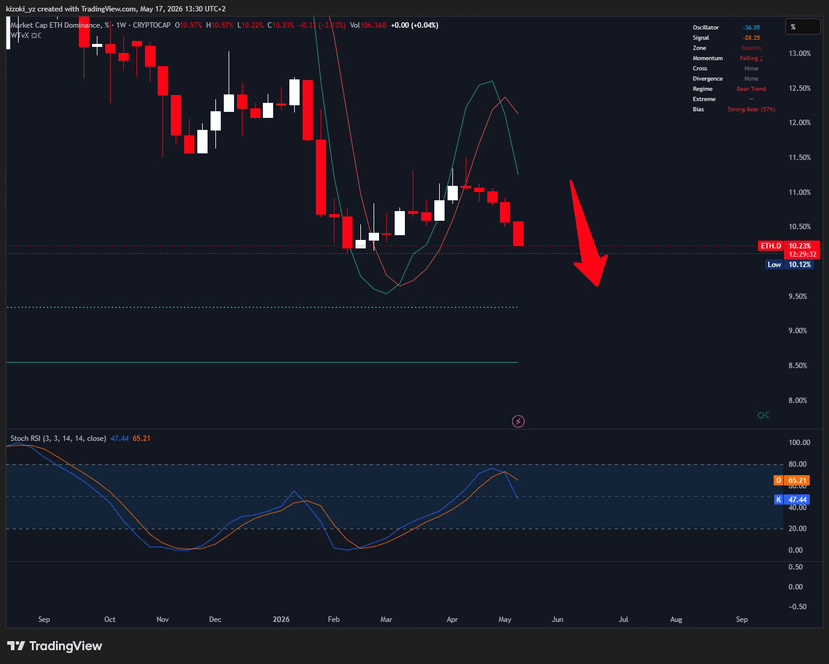
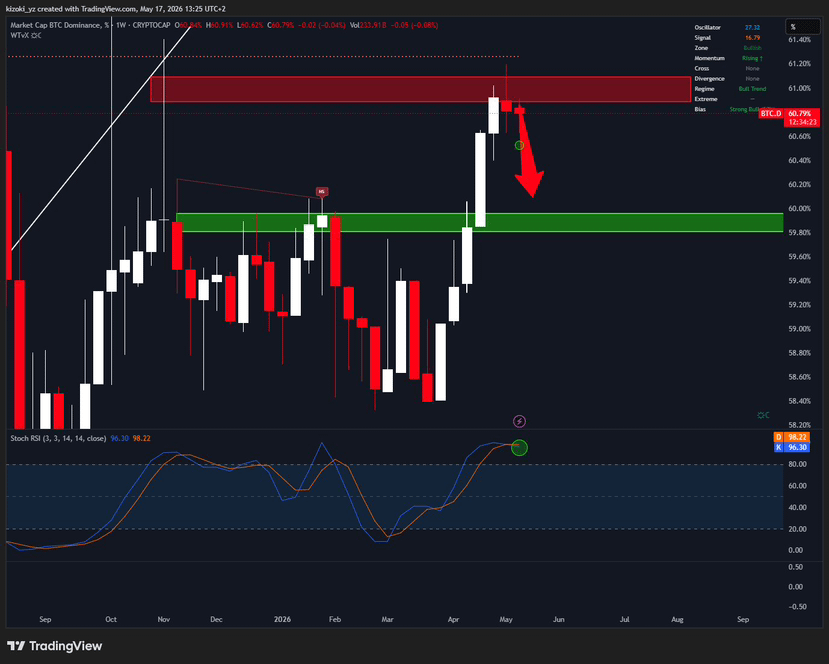
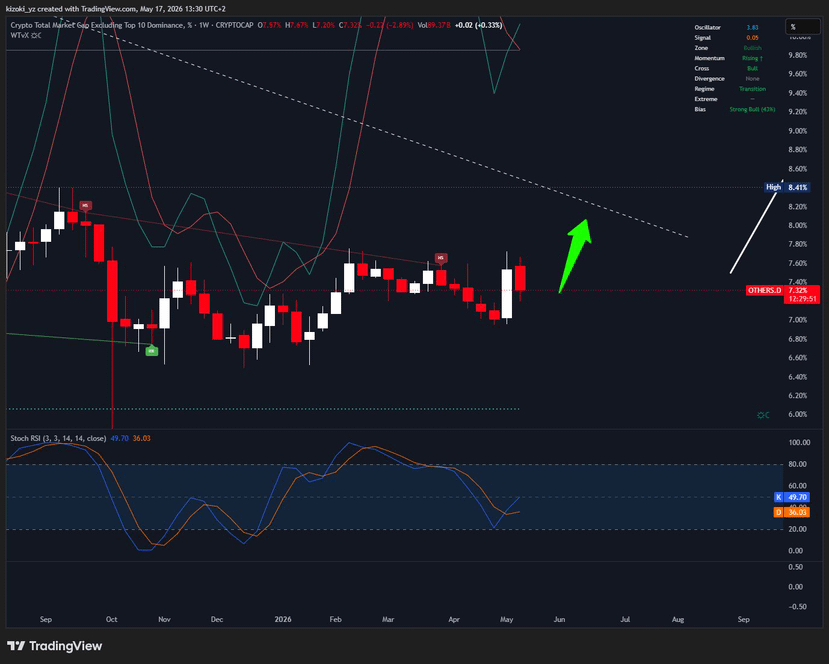
Altcoins are set to dominate over Ethereum and Bitcoin. The roles of Ethereum and Bitcoin will lessen during this period, and dominance will shift back to altcoins. This isn't just my opinion; the dominance indicators are speaking. Choose your coins wisely, and I'll help you with this—just follow me 😉 because you'll find coins that will skyrocket in profit percentages, and you'll feel like you're late to the party. Simply look for coins that are in a sell saturation on the weekly timeframe.
Among them are $AIA and $LYN
#Bigpump
{alpha}(560x302dfaf2cdbe51a18d97186a7384e87cf599877d)
{alpha}(560x53ec33cd4fa46b9eced9ca3f6db626c5ffcd55cc)
Altcoins are set to dominate over Ethereum and Bitcoin. The roles of Ethereum and Bitcoin will lessen during this period, and dominance will shift back to altcoins. This isn't just my opinion; the dominance indicators are speaking. Choose your coins wisely, and I'll help you with this—just follow me 😉 because you'll find coins that will skyrocket in profit percentages, and you'll feel like you're late to the party. Simply look for coins that are in a sell saturation on the weekly timeframe.
Among them are $AIA and $LYN
#Bigpump
Among them are $AIA and $LYN
#Bigpump
554

Log in to explore more content
Join global crypto users on Binance Square
⚡️ Get latest and useful information about crypto.
💬 Trusted by the world’s largest crypto exchange.
👍 Discover real insights from verified creators.
Email / Phone number
Trending Topics
1
#CryptoSelloffTriggersMultipleWhaleLiquidations
853 views
64 Discussing
2
#USSpotXRPETFsSeeLargestWeeklyOutflowIn8Months
43,148 views
510 Discussing
3
#WillFOMCMinutesReinforceRateHikeExpectations?
402 views
18 Discussing
4
#BitcoinActiveSupplyInProfitDropsBelow45%
101,003 views
917 Discussing
5
#TONStrategyReports$23.97MQ3NetLoss
11,903 views
63 Discussing
6
#KavaSaysAbnormalActivityLimitedToKavaLend
65,454 views
509 Discussing
7
#WORPTLetsTouristsConvertCryptoToThaiBaht
12,885 views
147 Discussing
8
#WhoWillSucceedJensenHuangatNvidia?
217,008 views
1,847 Discussing
9
#WhatWillDriveCryptoandStocks’NextRebound?
652,030 views
3,670 Discussing
10
#TradFiForBeginners
760,612 views
4,631 Discussing