

#btcbulish
btcbulish
19,455 views
131 Discussing
Hot
Latest

·
--
Bullish
$BTC
{spot}(BTCUSDT)
— will it go down or keep printing points? It's still pointing UP.
Context Engine read
1H BULL (no BOS/CHoCH — running hot)
4H BULL + fresh confirmed 4H BULL BOS (broke 81,934)
15M neutral (cooling from the RSI-94 blow-off wick)
1H RSI 94.4 — extreme overbought
The honest structural answer: the 4H BULL BOS just confirmed — that's a real, sustained break signal (engine +52 MODERATE, buy-lean). On every timeframe except the overbought RSI at the very top, $BTC is bull — the tape is telling you the next likely move is still up (target extension), not downgments.
The one thing that can flip it down = the 15M closing back below its swing low. Watch these gates:
- 15M break < ~85,400 (bear CHoCH) → first sign the blow-off is rolling over
- 1H bear break < 81,935 (the swing it just cracked) → if that goes, the 4H BOS argument collapses and shorts get interesting.
Until one of those prints, buy-the-dip beats sell-the-top here — the engine won't bless a short into bull 1H+4H, and neither do I.
One flag since you're in this market: your open position is a BTC short at 86,012, no SL, TP 82,000 (last check iterated ~86,534 ⇒ you're now underwater ~0.6% + fees, and $BTC just printed a bull BOS against your side). The engine's read is unambiguously against holding that short right now — protect it (stop to breakeven or above the 1H swing 86,340) or exit, because the only way to 82,000 from here is that 15M break you don't yet have. I'll keep the loop armed and ping you the moment that 15M bear trigger actually fires — that's the level that turns your read from "hoping" into "tradeable."
Not financial advice — and not a green sell, just an honest read of a short that's fighting the 4H structure. Want me to log the BTC 15M-break trigger (85,400) to the watch so we get the ping automatically?
#BTCBULISH , #btcbullrun #BTCbullMarket
{future}(BTCUSDT)
$BTC
— will it go down or keep printing points? It's still pointing UP.
Context Engine read
1H BULL (no BOS/CHoCH — running hot)
4H BULL + fresh confirmed 4H BULL BOS (broke 81,934)
15M neutral (cooling from the RSI-94 blow-off wick)
1H RSI 94.4 — extreme overbought
The honest structural answer: the 4H BULL BOS just confirmed — that's a real, sustained break signal (engine +52 MODERATE, buy-lean). On every timeframe except the overbought RSI at the very top, $BTC is bull — the tape is telling you the next likely move is still up (target extension), not downgments.
The one thing that can flip it down = the 15M closing back below its swing low. Watch these gates:
- 15M break < ~85,400 (bear CHoCH) → first sign the blow-off is rolling over
- 1H bear break < 81,935 (the swing it just cracked) → if that goes, the 4H BOS argument collapses and shorts get interesting.
Until one of those prints, buy-the-dip beats sell-the-top here — the engine won't bless a short into bull 1H+4H, and neither do I.
One flag since you're in this market: your open position is a BTC short at 86,012, no SL, TP 82,000 (last check iterated ~86,534 ⇒ you're now underwater ~0.6% + fees, and $BTC just printed a bull BOS against your side). The engine's read is unambiguously against holding that short right now — protect it (stop to breakeven or above the 1H swing 86,340) or exit, because the only way to 82,000 from here is that 15M break you don't yet have. I'll keep the loop armed and ping you the moment that 15M bear trigger actually fires — that's the level that turns your read from "hoping" into "tradeable."
Not financial advice — and not a green sell, just an honest read of a short that's fighting the 4H structure. Want me to log the BTC 15M-break trigger (85,400) to the watch so we get the ping automatically?
#BTCBULISH , #btcbullrun #BTCbullMarket
— will it go down or keep printing points? It's still pointing UP.
Context Engine read
1H BULL (no BOS/CHoCH — running hot)
4H BULL + fresh confirmed 4H BULL BOS (broke 81,934)
15M neutral (cooling from the RSI-94 blow-off wick)
1H RSI 94.4 — extreme overbought
The honest structural answer: the 4H BULL BOS just confirmed — that's a real, sustained break signal (engine +52 MODERATE, buy-lean). On every timeframe except the overbought RSI at the very top, $BTC is bull — the tape is telling you the next likely move is still up (target extension), not downgments.
The one thing that can flip it down = the 15M closing back below its swing low. Watch these gates:
- 15M break < ~85,400 (bear CHoCH) → first sign the blow-off is rolling over
- 1H bear break < 81,935 (the swing it just cracked) → if that goes, the 4H BOS argument collapses and shorts get interesting.
Until one of those prints, buy-the-dip beats sell-the-top here — the engine won't bless a short into bull 1H+4H, and neither do I.
One flag since you're in this market: your open position is a BTC short at 86,012, no SL, TP 82,000 (last check iterated ~86,534 ⇒ you're now underwater ~0.6% + fees, and $BTC just printed a bull BOS against your side). The engine's read is unambiguously against holding that short right now — protect it (stop to breakeven or above the 1H swing 86,340) or exit, because the only way to 82,000 from here is that 15M break you don't yet have. I'll keep the loop armed and ping you the moment that 15M bear trigger actually fires — that's the level that turns your read from "hoping" into "tradeable."
Not financial advice — and not a green sell, just an honest read of a short that's fighting the 4H structure. Want me to log the BTC 15M-break trigger (85,400) to the watch so we get the ping automatically?
#BTCBULISH , #btcbullrun #BTCbullMarket
87

Article
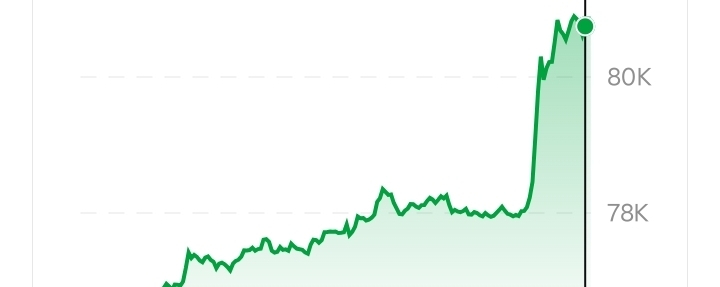
₿ Bitcoin (BTC) Price & Candlesti₿ Bitcoin (BTC) Price & Candlestick Analysis — September 18, 2026Bitcoin is currently trading around $80,864, after a strong move higher today. BTC has traded as high as approximately $80,944, while the intraday low is around $76,205.
The latest price action shows strong buying interest, but Bitcoin is also approaching an important resistance area. This makes the next few candles particularly important for traders.
🕯️ What Is the Current Candle Telling Us?
The latest price action shows a strong bullish move from the mid-$76K area toward the $80K zone.
A large bullish candle generally indicates that buyers are currently stronger than sellers during that period. However, one candle alone cannot confirm a long-term trend.
Traders should watch:
Candle + Volume + Support/Resistance + Momentum
rather than relying on the candle alone.
📊 Key Support Levels
Important areas to watch include:
🔹 $79,500–$80,000 — immediate breakout/retest zone
🔹 $76,000–$75,000 — important short-term support
🔹 $73,800 area — deeper technical support
Recent technical analysis has highlighted approximately $75,000 as an important support area. A sustained move below this zone would weaken the current bullish structure.
🚀 Key Resistance Levels
Bitcoin is now testing an important resistance region around:
🔸 $80,000–$80,900 — current resistance area
🔸 $82,000–$82,200 — next potential technical target
🔸 $85,000 — higher resistance/target zone
A clean breakout should ideally be supported by strong trading volume and a candle close above resistance.
📈 Bullish Scenario
If Bitcoin produces a strong candle close above the $80K–$81K region and successfully holds that area as support, traders may watch the next zones around $82K and potentially $85K.
The key point is confirmation.
A quick move above resistance followed by a rejection is different from a sustained breakout.
📉 Bearish Scenario
If BTC is rejected from the current resistance zone and falls below $75K–$76K, the market could enter another correction.
A break below major support would make lower levels increasingly important, including the area around $73.8K.
This does not mean Bitcoin must fall; it simply identifies levels traders may monitor if selling pressure increases.
🧠 RSI & Momentum
Momentum indicators should be watched alongside the candles.
Recent analysis has shown that Bitcoin's short-term momentum can become overheated after a sharp rally. One recent report noted hourly RSI moving into overbought territory while BTC was near resistance.
An overbought RSI does not automatically mean “sell.”
It means price has moved strongly and traders should watch for either:
✅ continued momentum
or
⚠️ a pullback/consolidation.
📦 Volume Is Important
A breakout with increasing volume is generally more convincing than a breakout occurring on weak volume.
For example:
Price ↑ + Volume ↑ = stronger confirmation
while:
Price ↑ + Volume ↓ = breakout needs more caution
Volume should therefore be checked whenever Bitcoin approaches major resistance.
🕯️ Candlestick Signals to Watch
Bullish Signal
A strong bullish candle closes above resistance and the following candle holds the breakout level.
Bearish Rejection
Price moves above resistance but closes back below it with a noticeable upper wick.
Doji
A doji can show indecision between buyers and sellers.
Bullish Engulfing
A large bullish candle completely covers the previous smaller bearish candle and can indicate increasing buying pressure.
Bearish Engulfing
A large bearish candle covers the previous bullish candle and can indicate increasing selling pressure.
Remember: no candlestick pattern guarantees the next price movement.
🔮 Bitcoin Price Outlook
Instead of giving one guaranteed prediction, traders can consider different scenarios.
Bullish scenario:
BTC holds above $80K → breakout confirmation → $82K → $85K area becomes important.
Sideways scenario:
BTC remains between approximately $75K and $81K while buyers and sellers fight for control.
Bearish scenario:
BTC loses $75K–$76K support → deeper correction becomes possible.
These are technical scenarios, not guaranteed price predictions.
🔥 What Should Traders Watch Next?
The most important things to monitor are:
Daily candle close
$80K–$81K resistance
$75K–$76K support
Trading volume
RSI momentum
MACD direction
Bitcoin dominance
Overall crypto market sentiment
ETF/institutional flows
Major global economic and central-bank news
⚠️ Risk Management
Bitcoin can move thousands of dollars in a short period.
Never assume that a green candle means the price must continue rising.
Before entering a trade, consider:
• Entry price
• Stop-loss level
• Take-profit levels
• Position size
• Trading fees
• Your personal risk tolerance
Never trade with money you cannot afford to lose.
🎯 Final Takeaway
Bitcoin's current structure is being tested around the $80K–$81K resistance area after today's strong move.
The next important question is not simply:
“Will Bitcoin go up?”
The better question is:
“Can Bitcoin break resistance and hold it as support?”
A confirmed breakout, strong volume and successful retest would provide stronger technical evidence than a temporary move above resistance.
On the other hand, rejection from resistance followed by a loss of major support would indicate that traders should pay closer attention to downside levels.
Watch the candle. Watch the volume. Respect the support and resistance. Manage your risk.
#Bitcoin #BTC #Crypto #Binance #BitcoinAnalysis #BTCUSDT #CryptoTrading #TechnicalAnalysis #Candlestick #BitcoinPrice ck Analysis — September 18, 2026
Bitcoin is currently trading around $80,864, after a strong move higher today. BTC has traded as high as approximately $80,944, while the intraday low is around $76,205.
The latest price action shows strong buying interest, but Bitcoin is also approaching an important resistance area. This makes the next few candles particularly important for traders.
🕯️ What Is the Current Candle Telling Us?
The latest price action shows a strong bullish move from the mid-$76K area toward the $80K zone.
A large bullish candle generally indicates that buyers are currently stronger than sellers during that period. However, one candle alone cannot confirm a long-term trend.
Traders should watch:
Candle + Volume + Support/Resistance + Momentum
rather than relying on the candle alone.
📊 Key Support Levels
Important areas to watch include:
🔹 $79,500–$80,000 — immediate breakout/retest zone
🔹 $76,000–$75,000 — important short-term support
🔹 $73,800 area — deeper technical support
Recent technical analysis has highlighted approximately $75,000 as an important support area. A sustained move below this zone would weaken the current bullish structure.
🚀 Key Resistance Levels
Bitcoin is now testing an important resistance region around:
🔸 $80,000–$80,900 — current resistance area
🔸 $82,000–$82,200 — next potential technical target
🔸 $85,000 — higher resistance/target zone
A clean breakout should ideally be supported by strong trading volume and a candle close above resistance.
📈 Bullish Scenario
If Bitcoin produces a strong candle close above the $80K–$81K region and successfully holds that area as support, traders may watch the next zones around $82K and potentially $85K.
The key point is confirmation.
A quick move above resistance followed by a rejection is different from a sustained breakout.
📉 Bearish Scenario
If BTC is rejected from the current resistance zone and falls below $75K–$76K, the market could enter another correction.
A break below major support would make lower levels increasingly important, including the area around $73.8K.
This does not mean Bitcoin must fall; it simply identifies levels traders may monitor if selling pressure increases.
🧠 RSI & Momentum
Momentum indicators should be watched alongside the candles.
Recent analysis has shown that Bitcoin's short-term momentum can become overheated after a sharp rally. One recent report noted hourly RSI moving into overbought territory while BTC was near resistance.
An overbought RSI does not automatically mean “sell.”
It means price has moved strongly and traders should watch for either:
✅ continued momentum
or
⚠️ a pullback/consolidation.
📦 Volume Is Important
A breakout with increasing volume is generally more convincing than a breakout occurring on weak volume.
For example:
Price ↑ + Volume ↑ = stronger confirmation
while:
Price ↑ + Volume ↓ = breakout needs more caution
Volume should therefore be checked whenever Bitcoin approaches major resistance.
🕯️ Candlestick Signals to Watch
Bullish Signal
A strong bullish candle closes above resistance and the following candle holds the breakout level.
Bearish Rejection
Price moves above resistance but closes back below it with a noticeable upper wick.
Doji
A doji can show indecision between buyers and sellers.
Bullish Engulfing
A large bullish candle completely covers the previous smaller bearish candle and can indicate increasing buying pressure.
Bearish Engulfing
A large bearish candle covers the previous bullish candle and can indicate increasing selling pressure.
Remember: no candlestick pattern guarantees the next price movement.
🔮 Bitcoin Price Outlook
Instead of giving one guaranteed prediction, traders can consider different scenarios.
Bullish scenario:
BTC holds above $80K → breakout confirmation → $82K → $85K area becomes important.
Sideways scenario:
BTC remains between approximately $75K and $81K while buyers and sellers fight for control.
Bearish scenario:
BTC loses $75K–$76K support → deeper correction becomes possible.
These are technical scenarios, not guaranteed price predictions.
🔥 What Should Traders Watch Next?
The most important things to monitor are:
Daily candle close
$80K–$81K resistance
$75K–$76K support
Trading volume
RSI momentum
MACD direction
Bitcoin dominance
Overall crypto market sentiment
ETF/institutional flows
Major global economic and central-bank news
⚠️ Risk Management
Bitcoin can move thousands of dollars in a short period.
Never assume that a green candle means the price must continue rising.
Before entering a trade, consider:
• Entry price
• Stop-loss level
• Take-profit levels
• Position size
• Trading fees
• Your personal risk tolerance
Never trade with money you cannot afford to lose.
🎯 Final Takeaway
Bitcoin's current structure is being tested around the $80K–$81K resistance area after today's strong move.
The next important question is not simply:
“Will Bitcoin go up?”
The better question is:
“Can Bitcoin break resistance and hold it as support?”
A confirmed breakout, strong volume and successful retest would provide stronger technical evidence than a temporary move above resistance.
On the other hand, rejection from resistance followed by a loss of major support would indicate that traders should pay closer attention to downside levels.
Watch the candle. Watch the volume. Respect the support and resistance. Manage your risk.
#Bitcoin #BTC #Crypto #Binance #BitcoinAnalysis #BTCUSDT #CryptoTrading #TechnicalAnalysis #Candlestick #BitcoinPrice #BTCBreaks80K #BTC走势分析 #BTCBULISH
₿ Bitcoin (BTC) Price & Candlesti₿ Bitcoin (BTC) Price & Candlestick Analysis — September 18, 2026
Bitcoin is currently trading around $80,864, after a strong move higher today. BTC has traded as high as approximately $80,944, while the intraday low is around $76,205.
The latest price action shows strong buying interest, but Bitcoin is also approaching an important resistance area. This makes the next few candles particularly important for traders.
🕯️ What Is the Current Candle Telling Us?
The latest price action shows a strong bullish move from the mid-$76K area toward the $80K zone.
A large bullish candle generally indicates that buyers are currently stronger than sellers during that period. However, one candle alone cannot confirm a long-term trend.
Traders should watch:
Candle + Volume + Support/Resistance + Momentum
rather than relying on the candle alone.
📊 Key Support Levels
Important areas to watch include:
🔹 $79,500–$80,000 — immediate breakout/retest zone
🔹 $76,000–$75,000 — important short-term support
🔹 $73,800 area — deeper technical support
Recent technical analysis has highlighted approximately $75,000 as an important support area. A sustained move below this zone would weaken the current bullish structure.
🚀 Key Resistance Levels
Bitcoin is now testing an important resistance region around:
🔸 $80,000–$80,900 — current resistance area
🔸 $82,000–$82,200 — next potential technical target
🔸 $85,000 — higher resistance/target zone
A clean breakout should ideally be supported by strong trading volume and a candle close above resistance.
📈 Bullish Scenario
If Bitcoin produces a strong candle close above the $80K–$81K region and successfully holds that area as support, traders may watch the next zones around $82K and potentially $85K.
The key point is confirmation.
A quick move above resistance followed by a rejection is different from a sustained breakout.
📉 Bearish Scenario
If BTC is rejected from the current resistance zone and falls below $75K–$76K, the market could enter another correction.
A break below major support would make lower levels increasingly important, including the area around $73.8K.
This does not mean Bitcoin must fall; it simply identifies levels traders may monitor if selling pressure increases.
🧠 RSI & Momentum
Momentum indicators should be watched alongside the candles.
Recent analysis has shown that Bitcoin's short-term momentum can become overheated after a sharp rally. One recent report noted hourly RSI moving into overbought territory while BTC was near resistance.
An overbought RSI does not automatically mean “sell.”
It means price has moved strongly and traders should watch for either:
✅ continued momentum
or
⚠️ a pullback/consolidation.
📦 Volume Is Important
A breakout with increasing volume is generally more convincing than a breakout occurring on weak volume.
For example:
Price ↑ + Volume ↑ = stronger confirmation
while:
Price ↑ + Volume ↓ = breakout needs more caution
Volume should therefore be checked whenever Bitcoin approaches major resistance.
🕯️ Candlestick Signals to Watch
Bullish Signal
A strong bullish candle closes above resistance and the following candle holds the breakout level.
Bearish Rejection
Price moves above resistance but closes back below it with a noticeable upper wick.
Doji
A doji can show indecision between buyers and sellers.
Bullish Engulfing
A large bullish candle completely covers the previous smaller bearish candle and can indicate increasing buying pressure.
Bearish Engulfing
A large bearish candle covers the previous bullish candle and can indicate increasing selling pressure.
Remember: no candlestick pattern guarantees the next price movement.
🔮 Bitcoin Price Outlook
Instead of giving one guaranteed prediction, traders can consider different scenarios.
Bullish scenario:
BTC holds above $80K → breakout confirmation → $82K → $85K area becomes important.
Sideways scenario:
BTC remains between approximately $75K and $81K while buyers and sellers fight for control.
Bearish scenario:
BTC loses $75K–$76K support → deeper correction becomes possible.
These are technical scenarios, not guaranteed price predictions.
🔥 What Should Traders Watch Next?
The most important things to monitor are:
Daily candle close
$80K–$81K resistance
$75K–$76K support
Trading volume
RSI momentum
MACD direction
Bitcoin dominance
Overall crypto market sentiment
ETF/institutional flows
Major global economic and central-bank news
⚠️ Risk Management
Bitcoin can move thousands of dollars in a short period.
Never assume that a green candle means the price must continue rising.
Before entering a trade, consider:
• Entry price
• Stop-loss level
• Take-profit levels
• Position size
• Trading fees
• Your personal risk tolerance
Never trade with money you cannot afford to lose.
🎯 Final Takeaway
Bitcoin's current structure is being tested around the $80K–$81K resistance area after today's strong move.
The next important question is not simply:
“Will Bitcoin go up?”
The better question is:
“Can Bitcoin break resistance and hold it as support?”
A confirmed breakout, strong volume and successful retest would provide stronger technical evidence than a temporary move above resistance.
On the other hand, rejection from resistance followed by a loss of major support would indicate that traders should pay closer attention to downside levels.
Watch the candle. Watch the volume. Respect the support and resistance. Manage your risk.
#Bitcoin #BTC #Crypto #Binance #BitcoinAnalysis #BTCUSDT #CryptoTrading #TechnicalAnalysis #Candlestick #BitcoinPrice ck Analysis — September 18, 2026
Bitcoin is currently trading around $80,864, after a strong move higher today. BTC has traded as high as approximately $80,944, while the intraday low is around $76,205.
The latest price action shows strong buying interest, but Bitcoin is also approaching an important resistance area. This makes the next few candles particularly important for traders.
🕯️ What Is the Current Candle Telling Us?
The latest price action shows a strong bullish move from the mid-$76K area toward the $80K zone.
A large bullish candle generally indicates that buyers are currently stronger than sellers during that period. However, one candle alone cannot confirm a long-term trend.
Traders should watch:
Candle + Volume + Support/Resistance + Momentum
rather than relying on the candle alone.
📊 Key Support Levels
Important areas to watch include:
🔹 $79,500–$80,000 — immediate breakout/retest zone
🔹 $76,000–$75,000 — important short-term support
🔹 $73,800 area — deeper technical support
Recent technical analysis has highlighted approximately $75,000 as an important support area. A sustained move below this zone would weaken the current bullish structure.
🚀 Key Resistance Levels
Bitcoin is now testing an important resistance region around:
🔸 $80,000–$80,900 — current resistance area
🔸 $82,000–$82,200 — next potential technical target
🔸 $85,000 — higher resistance/target zone
A clean breakout should ideally be supported by strong trading volume and a candle close above resistance.
📈 Bullish Scenario
If Bitcoin produces a strong candle close above the $80K–$81K region and successfully holds that area as support, traders may watch the next zones around $82K and potentially $85K.
The key point is confirmation.
A quick move above resistance followed by a rejection is different from a sustained breakout.
📉 Bearish Scenario
If BTC is rejected from the current resistance zone and falls below $75K–$76K, the market could enter another correction.
A break below major support would make lower levels increasingly important, including the area around $73.8K.
This does not mean Bitcoin must fall; it simply identifies levels traders may monitor if selling pressure increases.
🧠 RSI & Momentum
Momentum indicators should be watched alongside the candles.
Recent analysis has shown that Bitcoin's short-term momentum can become overheated after a sharp rally. One recent report noted hourly RSI moving into overbought territory while BTC was near resistance.
An overbought RSI does not automatically mean “sell.”
It means price has moved strongly and traders should watch for either:
✅ continued momentum
or
⚠️ a pullback/consolidation.
📦 Volume Is Important
A breakout with increasing volume is generally more convincing than a breakout occurring on weak volume.
For example:
Price ↑ + Volume ↑ = stronger confirmation
while:
Price ↑ + Volume ↓ = breakout needs more caution
Volume should therefore be checked whenever Bitcoin approaches major resistance.
🕯️ Candlestick Signals to Watch
Bullish Signal
A strong bullish candle closes above resistance and the following candle holds the breakout level.
Bearish Rejection
Price moves above resistance but closes back below it with a noticeable upper wick.
Doji
A doji can show indecision between buyers and sellers.
Bullish Engulfing
A large bullish candle completely covers the previous smaller bearish candle and can indicate increasing buying pressure.
Bearish Engulfing
A large bearish candle covers the previous bullish candle and can indicate increasing selling pressure.
Remember: no candlestick pattern guarantees the next price movement.
🔮 Bitcoin Price Outlook
Instead of giving one guaranteed prediction, traders can consider different scenarios.
Bullish scenario:
BTC holds above $80K → breakout confirmation → $82K → $85K area becomes important.
Sideways scenario:
BTC remains between approximately $75K and $81K while buyers and sellers fight for control.
Bearish scenario:
BTC loses $75K–$76K support → deeper correction becomes possible.
These are technical scenarios, not guaranteed price predictions.
🔥 What Should Traders Watch Next?
The most important things to monitor are:
Daily candle close
$80K–$81K resistance
$75K–$76K support
Trading volume
RSI momentum
MACD direction
Bitcoin dominance
Overall crypto market sentiment
ETF/institutional flows
Major global economic and central-bank news
⚠️ Risk Management
Bitcoin can move thousands of dollars in a short period.
Never assume that a green candle means the price must continue rising.
Before entering a trade, consider:
• Entry price
• Stop-loss level
• Take-profit levels
• Position size
• Trading fees
• Your personal risk tolerance
Never trade with money you cannot afford to lose.
🎯 Final Takeaway
Bitcoin's current structure is being tested around the $80K–$81K resistance area after today's strong move.
The next important question is not simply:
“Will Bitcoin go up?”
The better question is:
“Can Bitcoin break resistance and hold it as support?”
A confirmed breakout, strong volume and successful retest would provide stronger technical evidence than a temporary move above resistance.
On the other hand, rejection from resistance followed by a loss of major support would indicate that traders should pay closer attention to downside levels.
Watch the candle. Watch the volume. Respect the support and resistance. Manage your risk.
#Bitcoin #BTC #Crypto #Binance #BitcoinAnalysis #BTCUSDT #CryptoTrading #TechnicalAnalysis #Candlestick #BitcoinPrice #BTCBreaks80K #BTC走势分析 #BTCBULISH
The latest price action shows strong buying interest, but Bitcoin is also approaching an important resistance area. This makes the next few candles particularly important for traders.
🕯️ What Is the Current Candle Telling Us?
The latest price action shows a strong bullish move from the mid-$76K area toward the $80K zone.
A large bullish candle generally indicates that buyers are currently stronger than sellers during that period. However, one candle alone cannot confirm a long-term trend.
Traders should watch:
Candle + Volume + Support/Resistance + Momentum
rather than relying on the candle alone.
📊 Key Support Levels
Important areas to watch include:
🔹 $79,500–$80,000 — immediate breakout/retest zone
🔹 $76,000–$75,000 — important short-term support
🔹 $73,800 area — deeper technical support
Recent technical analysis has highlighted approximately $75,000 as an important support area. A sustained move below this zone would weaken the current bullish structure.
🚀 Key Resistance Levels
Bitcoin is now testing an important resistance region around:
🔸 $80,000–$80,900 — current resistance area
🔸 $82,000–$82,200 — next potential technical target
🔸 $85,000 — higher resistance/target zone
A clean breakout should ideally be supported by strong trading volume and a candle close above resistance.
📈 Bullish Scenario
If Bitcoin produces a strong candle close above the $80K–$81K region and successfully holds that area as support, traders may watch the next zones around $82K and potentially $85K.
The key point is confirmation.
A quick move above resistance followed by a rejection is different from a sustained breakout.
📉 Bearish Scenario
If BTC is rejected from the current resistance zone and falls below $75K–$76K, the market could enter another correction.
A break below major support would make lower levels increasingly important, including the area around $73.8K.
This does not mean Bitcoin must fall; it simply identifies levels traders may monitor if selling pressure increases.
🧠 RSI & Momentum
Momentum indicators should be watched alongside the candles.
Recent analysis has shown that Bitcoin's short-term momentum can become overheated after a sharp rally. One recent report noted hourly RSI moving into overbought territory while BTC was near resistance.
An overbought RSI does not automatically mean “sell.”
It means price has moved strongly and traders should watch for either:
✅ continued momentum
or
⚠️ a pullback/consolidation.
📦 Volume Is Important
A breakout with increasing volume is generally more convincing than a breakout occurring on weak volume.
For example:
Price ↑ + Volume ↑ = stronger confirmation
while:
Price ↑ + Volume ↓ = breakout needs more caution
Volume should therefore be checked whenever Bitcoin approaches major resistance.
🕯️ Candlestick Signals to Watch
Bullish Signal
A strong bullish candle closes above resistance and the following candle holds the breakout level.
Bearish Rejection
Price moves above resistance but closes back below it with a noticeable upper wick.
Doji
A doji can show indecision between buyers and sellers.
Bullish Engulfing
A large bullish candle completely covers the previous smaller bearish candle and can indicate increasing buying pressure.
Bearish Engulfing
A large bearish candle covers the previous bullish candle and can indicate increasing selling pressure.
Remember: no candlestick pattern guarantees the next price movement.
🔮 Bitcoin Price Outlook
Instead of giving one guaranteed prediction, traders can consider different scenarios.
Bullish scenario:
BTC holds above $80K → breakout confirmation → $82K → $85K area becomes important.
Sideways scenario:
BTC remains between approximately $75K and $81K while buyers and sellers fight for control.
Bearish scenario:
BTC loses $75K–$76K support → deeper correction becomes possible.
These are technical scenarios, not guaranteed price predictions.
🔥 What Should Traders Watch Next?
The most important things to monitor are:
Daily candle close
$80K–$81K resistance
$75K–$76K support
Trading volume
RSI momentum
MACD direction
Bitcoin dominance
Overall crypto market sentiment
ETF/institutional flows
Major global economic and central-bank news
⚠️ Risk Management
Bitcoin can move thousands of dollars in a short period.
Never assume that a green candle means the price must continue rising.
Before entering a trade, consider:
• Entry price
• Stop-loss level
• Take-profit levels
• Position size
• Trading fees
• Your personal risk tolerance
Never trade with money you cannot afford to lose.
🎯 Final Takeaway
Bitcoin's current structure is being tested around the $80K–$81K resistance area after today's strong move.
The next important question is not simply:
“Will Bitcoin go up?”
The better question is:
“Can Bitcoin break resistance and hold it as support?”
A confirmed breakout, strong volume and successful retest would provide stronger technical evidence than a temporary move above resistance.
On the other hand, rejection from resistance followed by a loss of major support would indicate that traders should pay closer attention to downside levels.
Watch the candle. Watch the volume. Respect the support and resistance. Manage your risk.
#Bitcoin #BTC #Crypto #Binance #BitcoinAnalysis #BTCUSDT #CryptoTrading #TechnicalAnalysis #Candlestick #BitcoinPrice ck Analysis — September 18, 2026
Bitcoin is currently trading around $80,864, after a strong move higher today. BTC has traded as high as approximately $80,944, while the intraday low is around $76,205.
The latest price action shows strong buying interest, but Bitcoin is also approaching an important resistance area. This makes the next few candles particularly important for traders.
🕯️ What Is the Current Candle Telling Us?
The latest price action shows a strong bullish move from the mid-$76K area toward the $80K zone.
A large bullish candle generally indicates that buyers are currently stronger than sellers during that period. However, one candle alone cannot confirm a long-term trend.
Traders should watch:
Candle + Volume + Support/Resistance + Momentum
rather than relying on the candle alone.
📊 Key Support Levels
Important areas to watch include:
🔹 $79,500–$80,000 — immediate breakout/retest zone
🔹 $76,000–$75,000 — important short-term support
🔹 $73,800 area — deeper technical support
Recent technical analysis has highlighted approximately $75,000 as an important support area. A sustained move below this zone would weaken the current bullish structure.
🚀 Key Resistance Levels
Bitcoin is now testing an important resistance region around:
🔸 $80,000–$80,900 — current resistance area
🔸 $82,000–$82,200 — next potential technical target
🔸 $85,000 — higher resistance/target zone
A clean breakout should ideally be supported by strong trading volume and a candle close above resistance.
📈 Bullish Scenario
If Bitcoin produces a strong candle close above the $80K–$81K region and successfully holds that area as support, traders may watch the next zones around $82K and potentially $85K.
The key point is confirmation.
A quick move above resistance followed by a rejection is different from a sustained breakout.
📉 Bearish Scenario
If BTC is rejected from the current resistance zone and falls below $75K–$76K, the market could enter another correction.
A break below major support would make lower levels increasingly important, including the area around $73.8K.
This does not mean Bitcoin must fall; it simply identifies levels traders may monitor if selling pressure increases.
🧠 RSI & Momentum
Momentum indicators should be watched alongside the candles.
Recent analysis has shown that Bitcoin's short-term momentum can become overheated after a sharp rally. One recent report noted hourly RSI moving into overbought territory while BTC was near resistance.
An overbought RSI does not automatically mean “sell.”
It means price has moved strongly and traders should watch for either:
✅ continued momentum
or
⚠️ a pullback/consolidation.
📦 Volume Is Important
A breakout with increasing volume is generally more convincing than a breakout occurring on weak volume.
For example:
Price ↑ + Volume ↑ = stronger confirmation
while:
Price ↑ + Volume ↓ = breakout needs more caution
Volume should therefore be checked whenever Bitcoin approaches major resistance.
🕯️ Candlestick Signals to Watch
Bullish Signal
A strong bullish candle closes above resistance and the following candle holds the breakout level.
Bearish Rejection
Price moves above resistance but closes back below it with a noticeable upper wick.
Doji
A doji can show indecision between buyers and sellers.
Bullish Engulfing
A large bullish candle completely covers the previous smaller bearish candle and can indicate increasing buying pressure.
Bearish Engulfing
A large bearish candle covers the previous bullish candle and can indicate increasing selling pressure.
Remember: no candlestick pattern guarantees the next price movement.
🔮 Bitcoin Price Outlook
Instead of giving one guaranteed prediction, traders can consider different scenarios.
Bullish scenario:
BTC holds above $80K → breakout confirmation → $82K → $85K area becomes important.
Sideways scenario:
BTC remains between approximately $75K and $81K while buyers and sellers fight for control.
Bearish scenario:
BTC loses $75K–$76K support → deeper correction becomes possible.
These are technical scenarios, not guaranteed price predictions.
🔥 What Should Traders Watch Next?
The most important things to monitor are:
Daily candle close
$80K–$81K resistance
$75K–$76K support
Trading volume
RSI momentum
MACD direction
Bitcoin dominance
Overall crypto market sentiment
ETF/institutional flows
Major global economic and central-bank news
⚠️ Risk Management
Bitcoin can move thousands of dollars in a short period.
Never assume that a green candle means the price must continue rising.
Before entering a trade, consider:
• Entry price
• Stop-loss level
• Take-profit levels
• Position size
• Trading fees
• Your personal risk tolerance
Never trade with money you cannot afford to lose.
🎯 Final Takeaway
Bitcoin's current structure is being tested around the $80K–$81K resistance area after today's strong move.
The next important question is not simply:
“Will Bitcoin go up?”
The better question is:
“Can Bitcoin break resistance and hold it as support?”
A confirmed breakout, strong volume and successful retest would provide stronger technical evidence than a temporary move above resistance.
On the other hand, rejection from resistance followed by a loss of major support would indicate that traders should pay closer attention to downside levels.
Watch the candle. Watch the volume. Respect the support and resistance. Manage your risk.
#Bitcoin #BTC #Crypto #Binance #BitcoinAnalysis #BTCUSDT #CryptoTrading #TechnicalAnalysis #Candlestick #BitcoinPrice #BTCBreaks80K #BTC走势分析 #BTCBULISH
58

·
--
Bullish
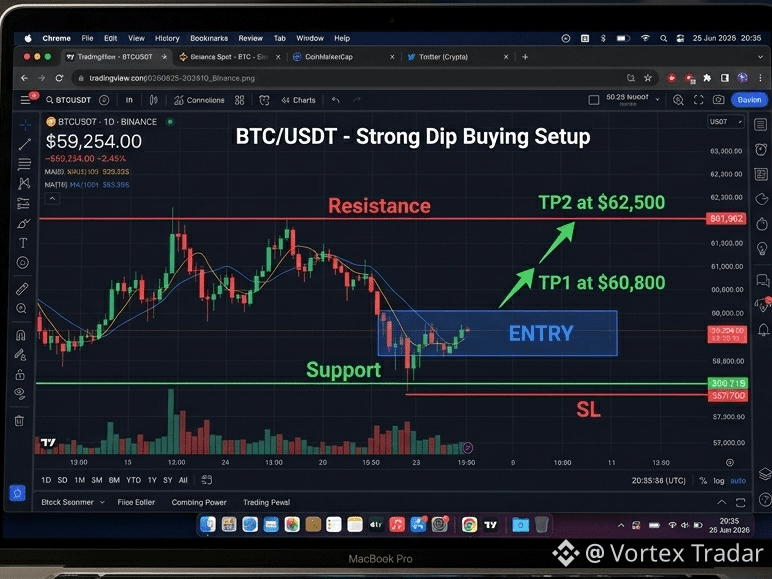
🚨 STRONG DIP BUYING ALERT 🚨
$BTC is testing key support after a sharp 24h pullback from $61,962 to $58,115 now sitting at $59,254. This is a textbook accumulation zone where smart money enters.
Levels to Watch:
Support: $58,115 to $57,900 (Strong demand zone)
Resistance: $60,500 | $61,962
Entry: $59,000 to $59,400 (Current zone)
TP1: $60,800
TP2: $62,500+
SL: $57,700 (tight risk)
Whales and institutions are heavily accumulating on this dip. The 24h volume is solid and we are seeing strong bullish reaction candles forming right at the daily support. RSI is approaching oversold territory on the 1H/4H classic setup for a powerful relief rally.
This move mirrors previous successful dip buying opportunities in this cycle. $BTC has repeatedly defended these major zones before blasting higher.
Don’t miss the reload zone. Position smart, manage risk, and let the bulls take control again.
Who is buying this $BTC dip Drop your entry below 👇
#Bitcoin #BTC #Crypto #BTCBULISH
{spot}(BTCUSDT)
🚨 STRONG DIP BUYING ALERT 🚨
$BTC is testing key support after a sharp 24h pullback from $61,962 to $58,115 now sitting at $59,254. This is a textbook accumulation zone where smart money enters.
Levels to Watch:
Support: $58,115 to $57,900 (Strong demand zone)
Resistance: $60,500 | $61,962
Entry: $59,000 to $59,400 (Current zone)
TP1: $60,800
TP2: $62,500+
SL: $57,700 (tight risk)
Whales and institutions are heavily accumulating on this dip. The 24h volume is solid and we are seeing strong bullish reaction candles forming right at the daily support. RSI is approaching oversold territory on the 1H/4H classic setup for a powerful relief rally.
This move mirrors previous successful dip buying opportunities in this cycle. $BTC has repeatedly defended these major zones before blasting higher.
Don’t miss the reload zone. Position smart, manage risk, and let the bulls take control again.
Who is buying this $BTC dip Drop your entry below 👇
#Bitcoin #BTC #Crypto #BTCBULISH
$BTC is testing key support after a sharp 24h pullback from $61,962 to $58,115 now sitting at $59,254. This is a textbook accumulation zone where smart money enters.
Levels to Watch:
Support: $58,115 to $57,900 (Strong demand zone)
Resistance: $60,500 | $61,962
Entry: $59,000 to $59,400 (Current zone)
TP1: $60,800
TP2: $62,500+
SL: $57,700 (tight risk)
Whales and institutions are heavily accumulating on this dip. The 24h volume is solid and we are seeing strong bullish reaction candles forming right at the daily support. RSI is approaching oversold territory on the 1H/4H classic setup for a powerful relief rally.
This move mirrors previous successful dip buying opportunities in this cycle. $BTC has repeatedly defended these major zones before blasting higher.
Don’t miss the reload zone. Position smart, manage risk, and let the bulls take control again.
Who is buying this $BTC dip Drop your entry below 👇
#Bitcoin #BTC #Crypto #BTCBULISH
49

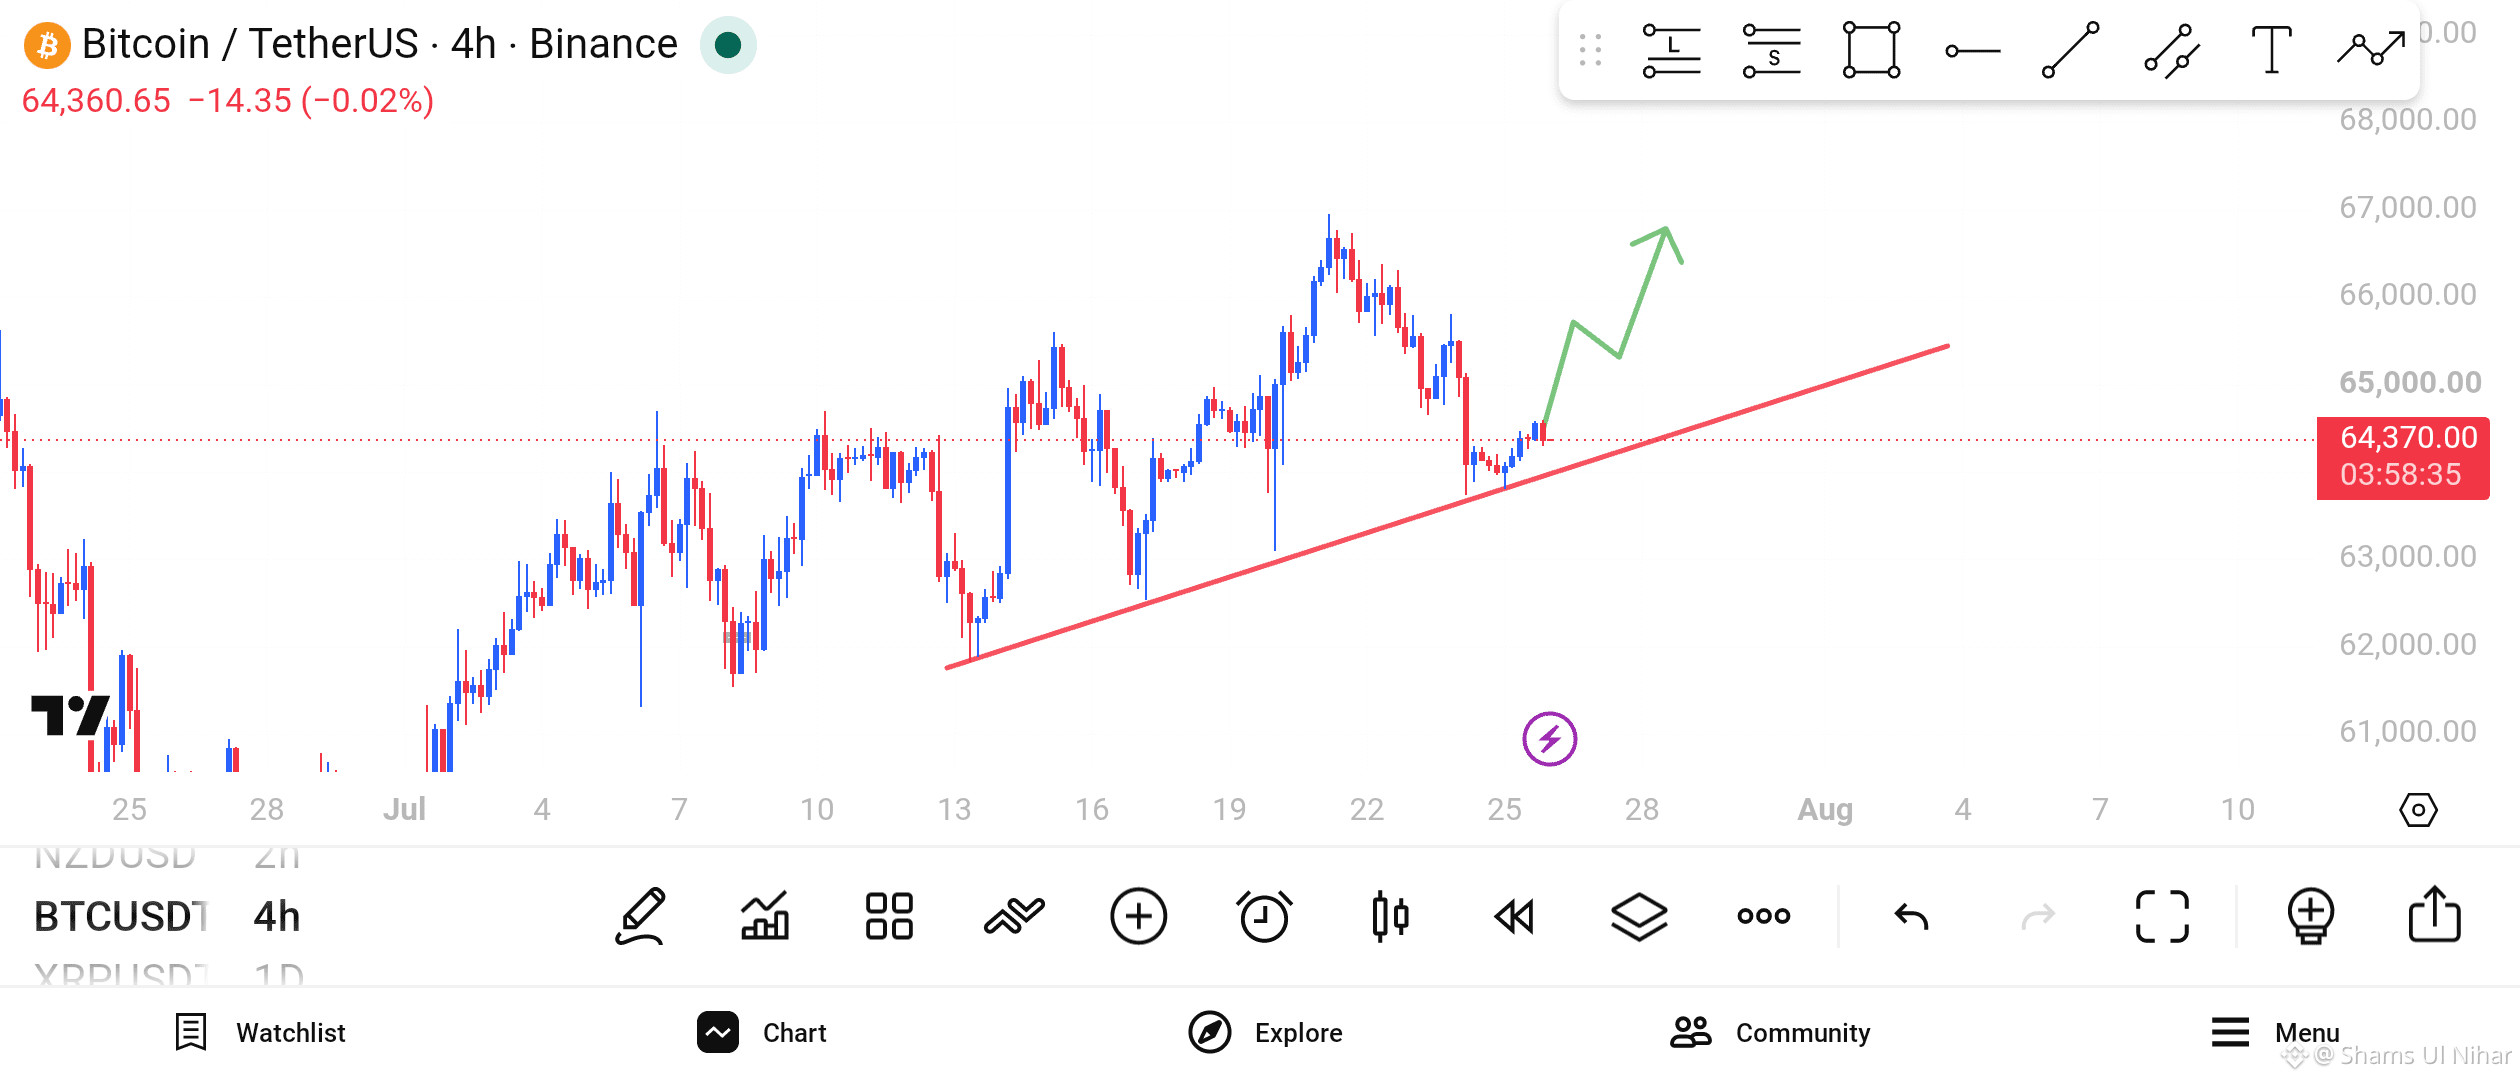
$BTC BTC/USDT 4H – Bullish Outlook: 💎. Bitcoin is respecting a rising trendline, indicating buyers are defending higher lows. 💎. A successful hold above the trendline could trigger a continuation toward $65,500, followed by $66,500–67,000.
💎. The overall market structure remains bullish as long as the ascending support is intact.
💎 .A break below the trendline could lead to a pullback toward the $63,500–63,000 support zone before the next move.#BTC #BTCBULISH
$BTC BTC/USDT 4H – Bullish Outlook: 💎. Bitcoin is respecting a rising trendline, indicating buyers are defending higher lows. 💎. A successful hold above the trendline could trigger a continuation toward $65,500, followed by $66,500–67,000.
💎. The overall market structure remains bullish as long as the ascending support is intact.
💎 .A break below the trendline could lead to a pullback toward the $63,500–63,000 support zone before the next move.#BTC #BTCBULISH
💎. The overall market structure remains bullish as long as the ascending support is intact.
💎 .A break below the trendline could lead to a pullback toward the $63,500–63,000 support zone before the next move.#BTC #BTCBULISH
22

·
--
Bullish
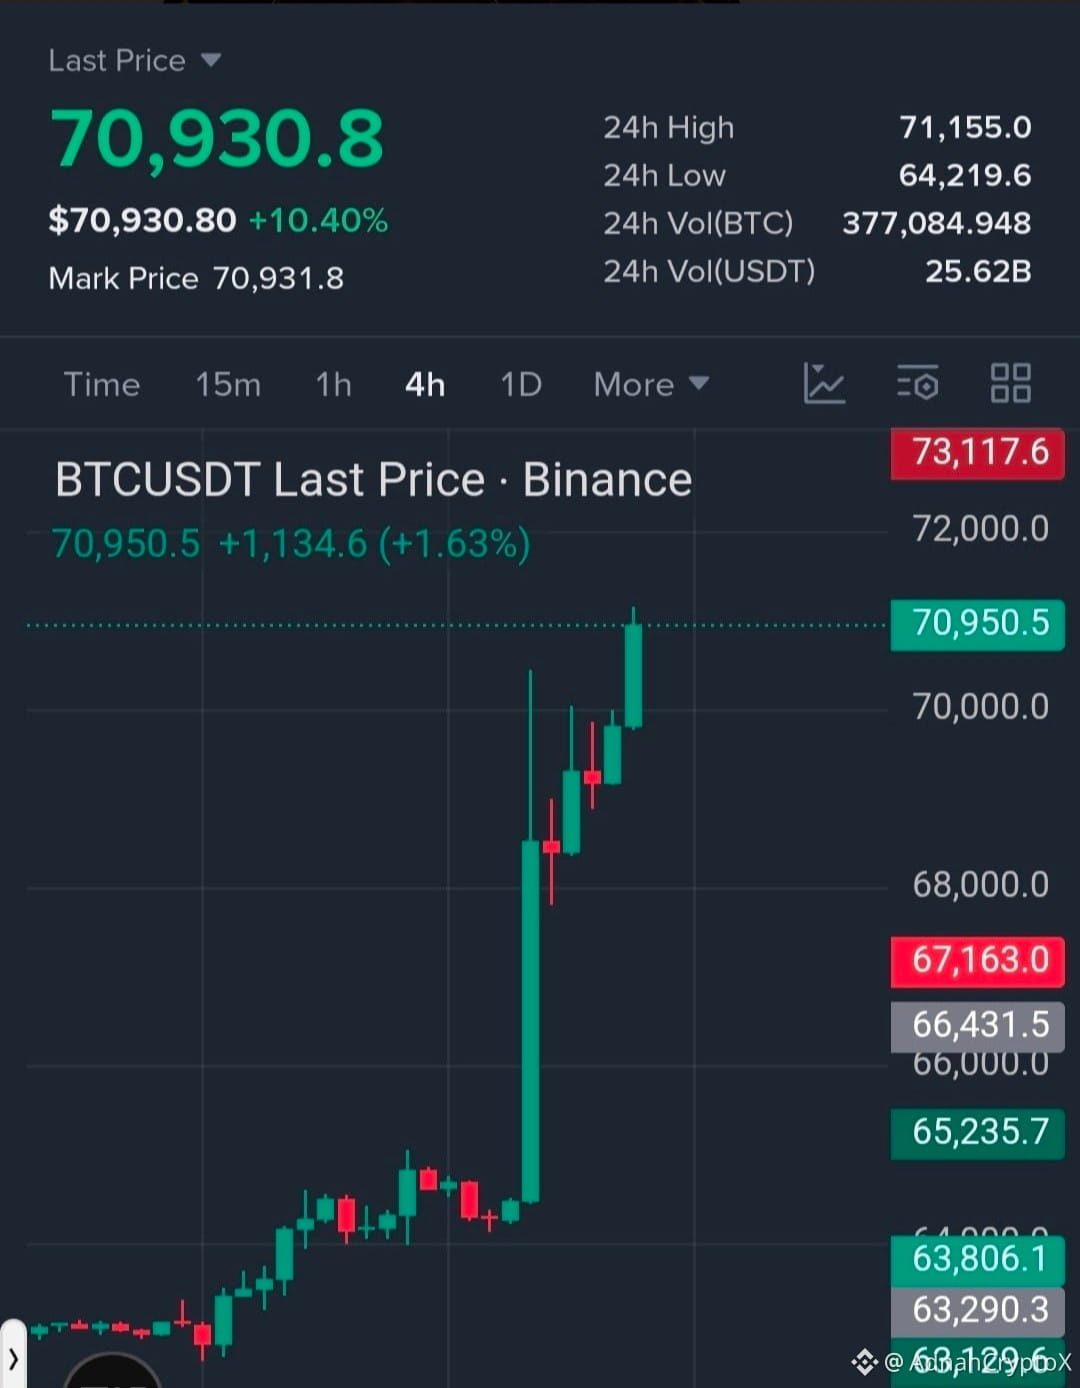
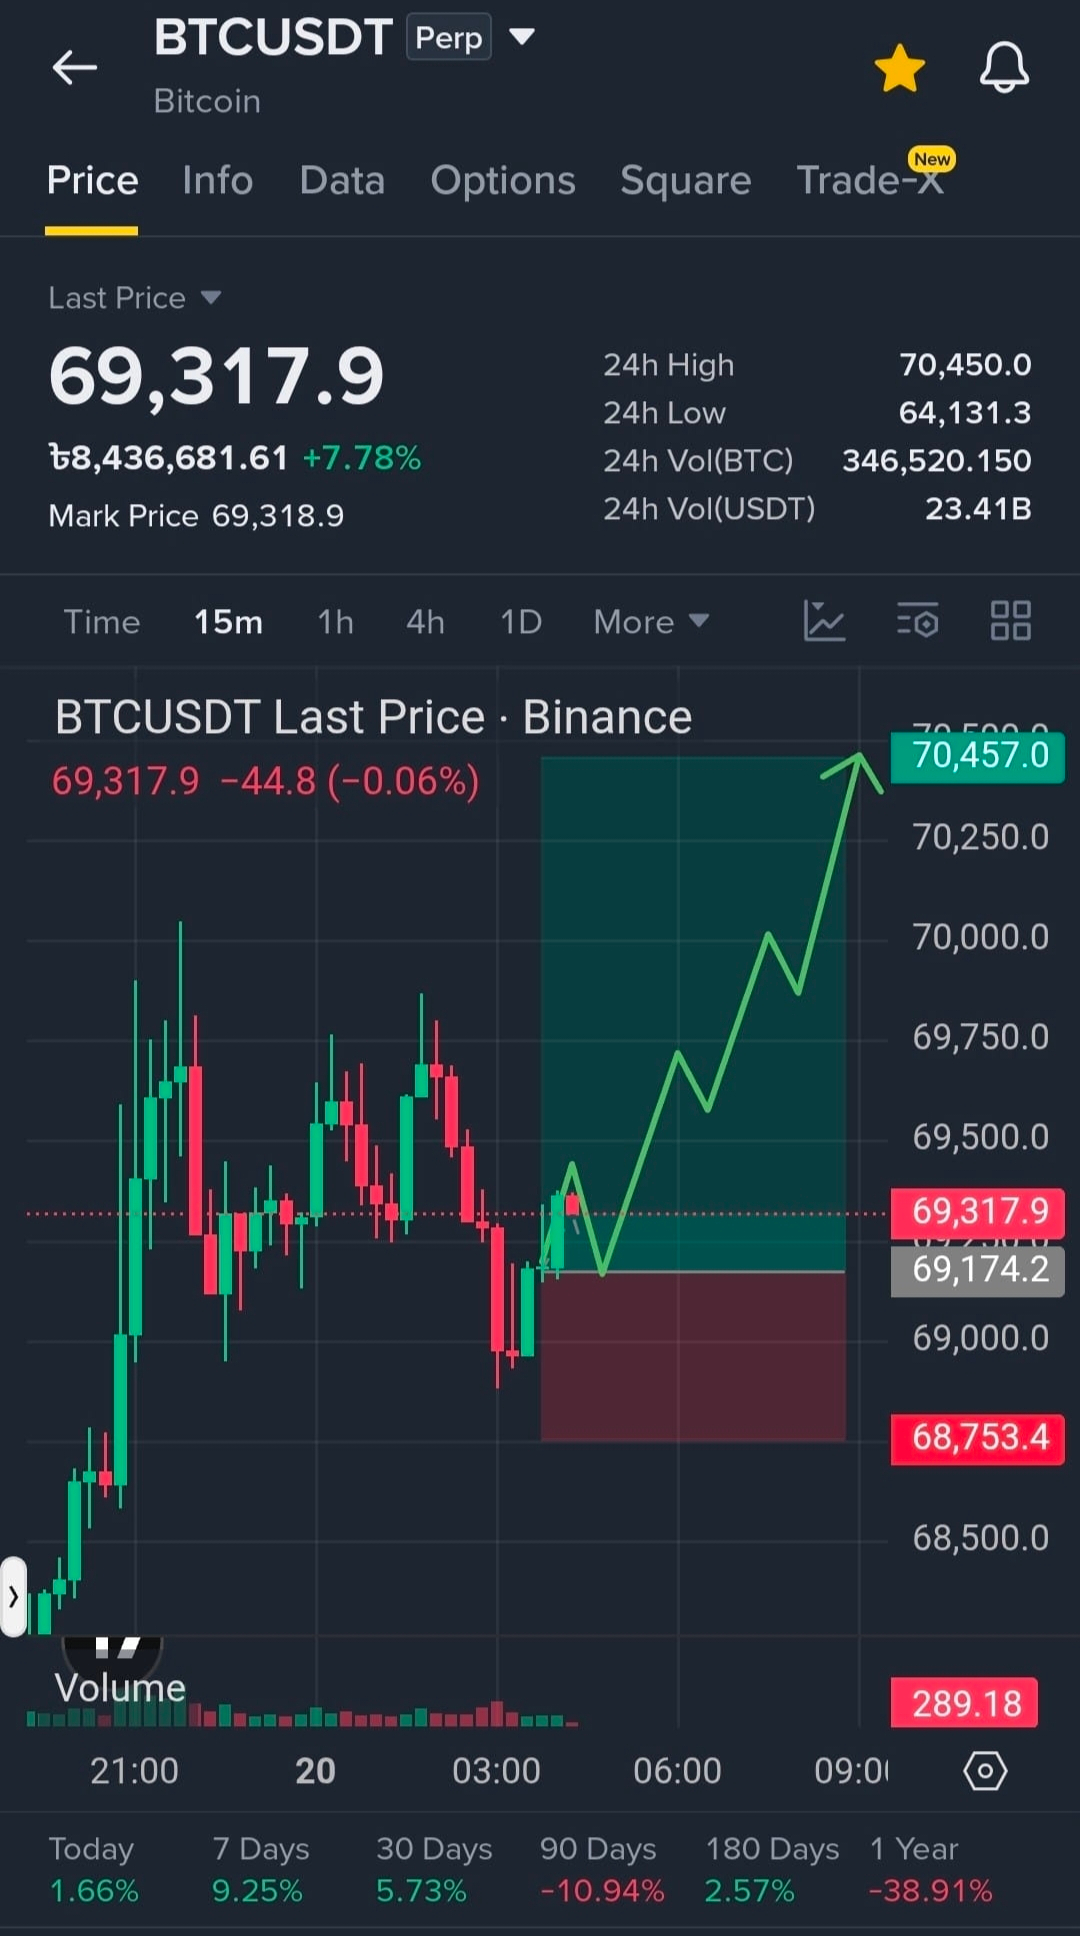
BUY LONG NOW $BTC WITH 20x
{future}(BTCUSDT)
LEVERAGE ISOLATED...🔥🔥
Entry Zone: $70,700 - $71,000
TP 1: $71,500
TP 2: $72,000
TP 3: $72,600
TP 4: $73,100
SL: $69,750
Click Below To Take Trade Now ...👇
#BTCUSDT #BTC #bullishBTC #BTCBULISH
BUY LONG NOW $BTC WITH 20x
LEVERAGE ISOLATED...🔥🔥
Entry Zone: $70,700 - $71,000
TP 1: $71,500
TP 2: $72,000
TP 3: $72,600
TP 4: $73,100
SL: $69,750
Click Below To Take Trade Now ...👇
#BTCUSDT #BTC #bullishBTC #BTCBULISH
LEVERAGE ISOLATED...🔥🔥
Entry Zone: $70,700 - $71,000
TP 1: $71,500
TP 2: $72,000
TP 3: $72,600
TP 4: $73,100
SL: $69,750
Click Below To Take Trade Now ...👇
#BTCUSDT #BTC #bullishBTC #BTCBULISH
1
87

#BTCBULISH
My assessment:
Probability of a move above $65,000 this week: Moderate (about 40%)
Probability of remaining between $58,000 and $63,000: Higher (about 60%), unless a major news event changes market sentiment.
If you're trading, keep a close watch on the $60,000 level—it is currently the key support area. This is an analysis, not a guarantee, since Bitcoin prices can change rapidly.
#BTCBULISH
My assessment:
Probability of a move above $65,000 this week: Moderate (about 40%)
Probability of remaining between $58,000 and $63,000: Higher (about 60%), unless a major news event changes market sentiment.
If you're trading, keep a close watch on the $60,000 level—it is currently the key support area. This is an analysis, not a guarantee, since Bitcoin prices can change rapidly.
My assessment:
Probability of a move above $65,000 this week: Moderate (about 40%)
Probability of remaining between $58,000 and $63,000: Higher (about 60%), unless a major news event changes market sentiment.
If you're trading, keep a close watch on the $60,000 level—it is currently the key support area. This is an analysis, not a guarantee, since Bitcoin prices can change rapidly.
105

$BTC and $ETH ETFs are seeing strong inflows.
$BTC
Both ETFs have maintained a multi-day positive inflow streak.
This shows that investors are putting money back into the crypto market.
Institutional interest in Bitcoin and Ethereum appears to be growing again.
Could these inflows be a signal of the next crypto rally?
However, market volatility is still high.
So, investors should not make decisions based only on ETF inflows.
What do you think — will BTC and ETH move higher next?
#BTCBULISH #ETHETFS #SenateTalksDelayCLARITYActVote #DowFalls464Points
{spot}(BTCUSDT)
{spot}(ETHUSDT)
$BTC and $ETH ETFs are seeing strong inflows.
$BTC
Both ETFs have maintained a multi-day positive inflow streak.
This shows that investors are putting money back into the crypto market.
Institutional interest in Bitcoin and Ethereum appears to be growing again.
Could these inflows be a signal of the next crypto rally?
However, market volatility is still high.
So, investors should not make decisions based only on ETF inflows.
What do you think — will BTC and ETH move higher next?
#BTCBULISH #ETHETFS #SenateTalksDelayCLARITYActVote #DowFalls464Points
$BTC
Both ETFs have maintained a multi-day positive inflow streak.
This shows that investors are putting money back into the crypto market.
Institutional interest in Bitcoin and Ethereum appears to be growing again.
Could these inflows be a signal of the next crypto rally?
However, market volatility is still high.
So, investors should not make decisions based only on ETF inflows.
What do you think — will BTC and ETH move higher next?
#BTCBULISH #ETHETFS #SenateTalksDelayCLARITYActVote #DowFalls464Points
120

·
--
Bitcoin is more than just a digital asset.
It represents a new way of thinking about money and ownership.
Still bullish on the long-term vision of BTC. 💎
#BTCBULISH #BTC走势分析 #USIranTradeTankerStrikesEscalate
Bitcoin is more than just a digital asset.
It represents a new way of thinking about money and ownership.
Still bullish on the long-term vision of BTC. 💎
#BTCBULISH #BTC走势分析 #USIranTradeTankerStrikesEscalate
It represents a new way of thinking about money and ownership.
Still bullish on the long-term vision of BTC. 💎
#BTCBULISH #BTC走势分析 #USIranTradeTankerStrikesEscalate
57
·
--
Bullish
BTC LONG $BTC #BTCBULISH $BTC
BTC RETURN TOWARDS THE 110000$BTC
BTC SIGNAL
ENTRY 77500$
TP1 80000$
TP2 90000$
TP3 100000$
SL 70000$
BTC LONG $BTC #BTCBULISH $BTC
BTC RETURN TOWARDS THE 110000$BTC
BTC SIGNAL
ENTRY 77500$
TP1 80000$
TP2 90000$
TP3 100000$
SL 70000$
BTC RETURN TOWARDS THE 110000$BTC
BTC SIGNAL
ENTRY 77500$
TP1 80000$
TP2 90000$
TP3 100000$
SL 70000$

Pepe
From Hot-Trader-Creator-Corner
2
2
39


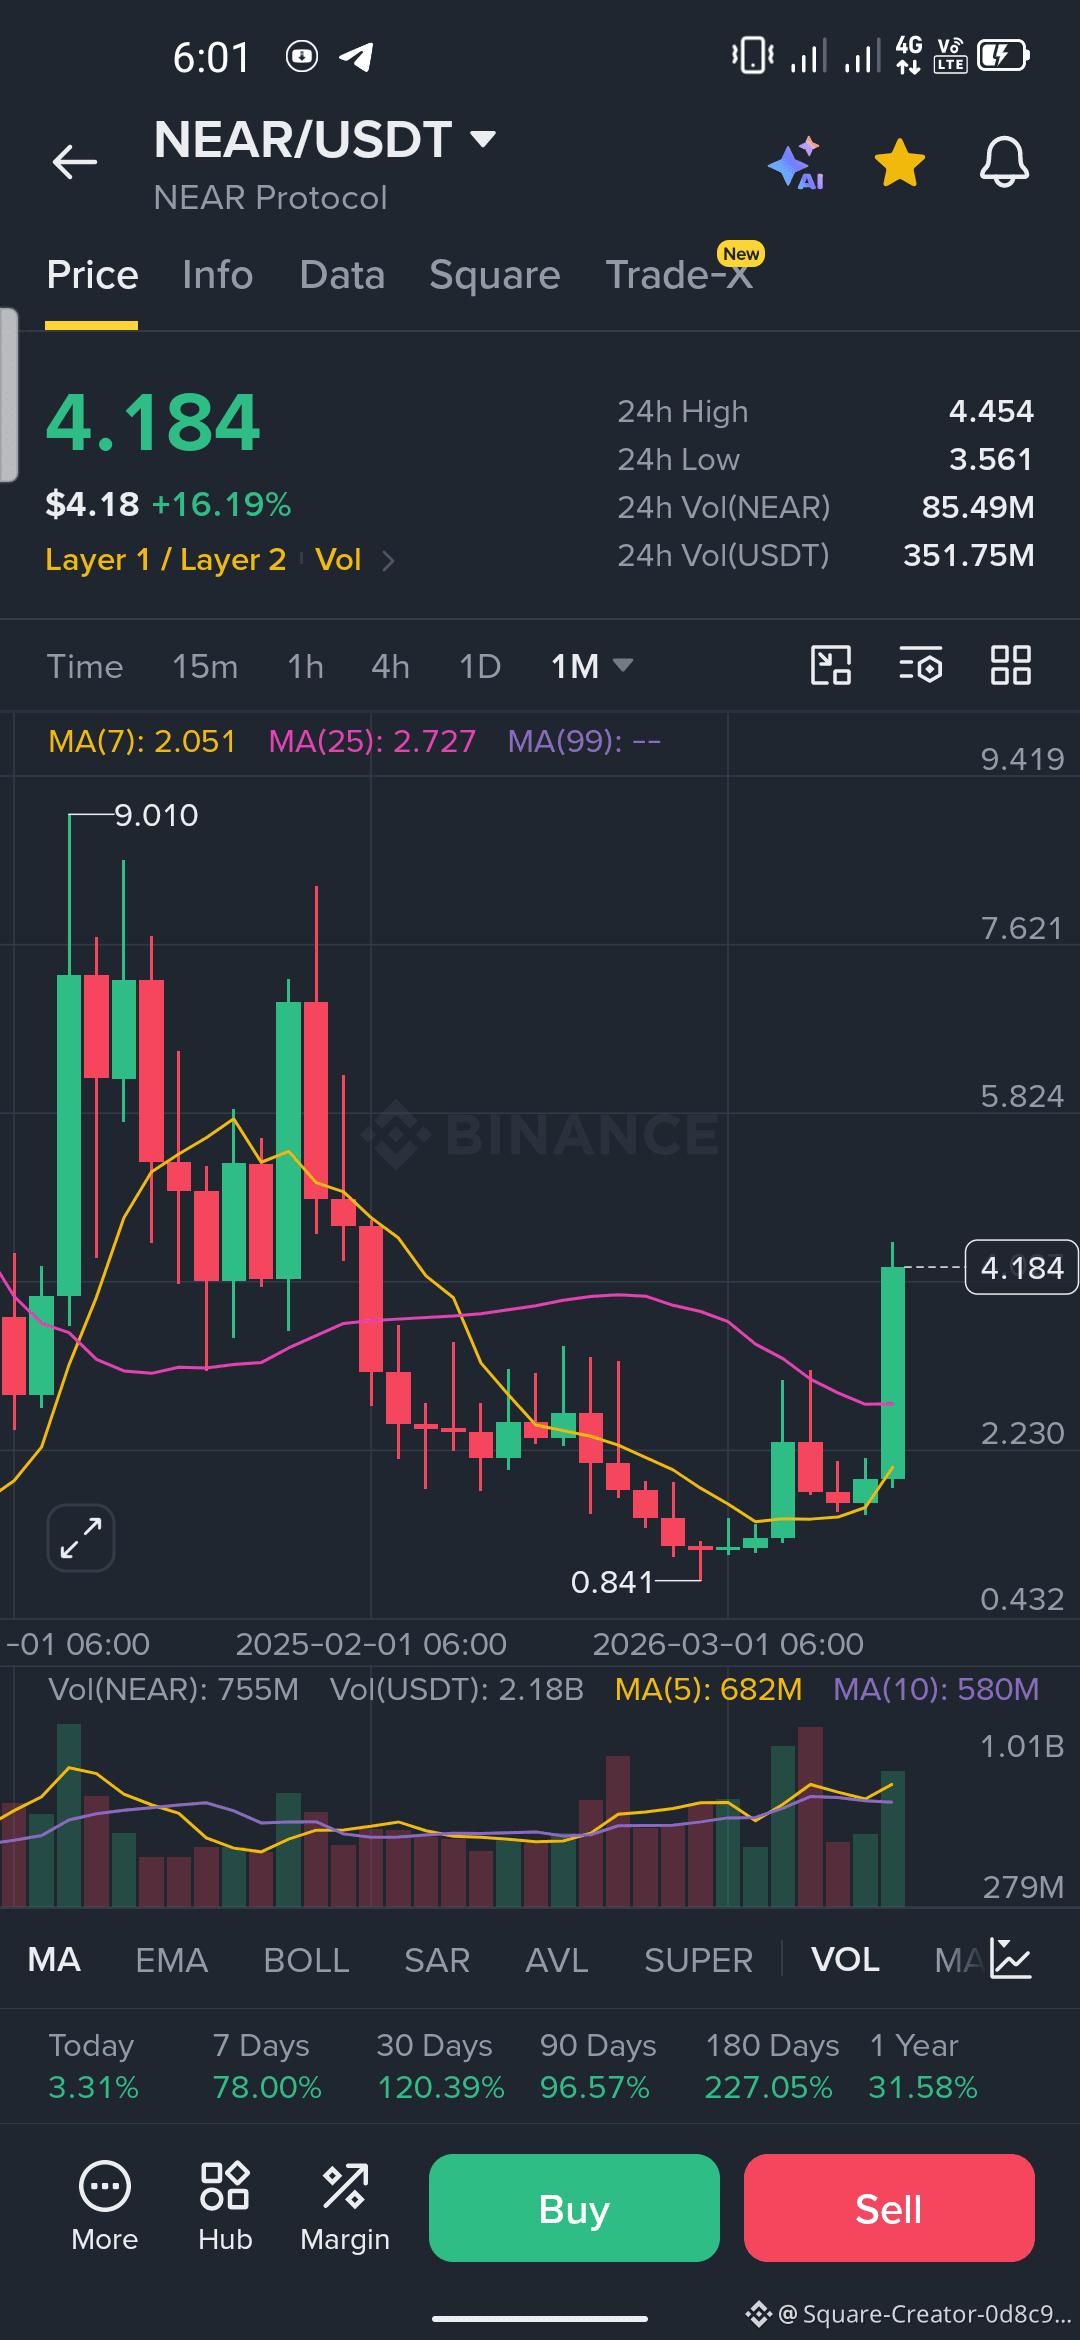
Monthly chart broke out. MA cross done,NEAR120% in 30days still hooding ✨☠️
Those who laughed are now regretting taking it back.🤘#NearBullish #StockHoldings #BTCBULISH
Monthly chart broke out. MA cross done,NEAR120% in 30days still hooding ✨☠️
Those who laughed are now regretting taking it back.🤘#NearBullish #StockHoldings #BTCBULISH
Those who laughed are now regretting taking it back.🤘#NearBullish #StockHoldings #BTCBULISH
104


·
--
Bullish
#btc BTC pumping up to $90K.
Expecting a rejection inside the $90K - $92K zone.
IMO BTC will dump down to $45K - $50K.
What's your view? Bullish or Bearish? 👇
#BTC #Bitcoin #TradingView #BTCBULISH 🐳
#btc BTC pumping up to $90K.
Expecting a rejection inside the $90K - $92K zone.
IMO BTC will dump down to $45K - $50K.
What's your view? Bullish or Bearish? 👇
#BTC #Bitcoin #TradingView #BTCBULISH 🐳
Expecting a rejection inside the $90K - $92K zone.
IMO BTC will dump down to $45K - $50K.
What's your view? Bullish or Bearish? 👇
#BTC #Bitcoin #TradingView #BTCBULISH 🐳
84

·
--
Bullish
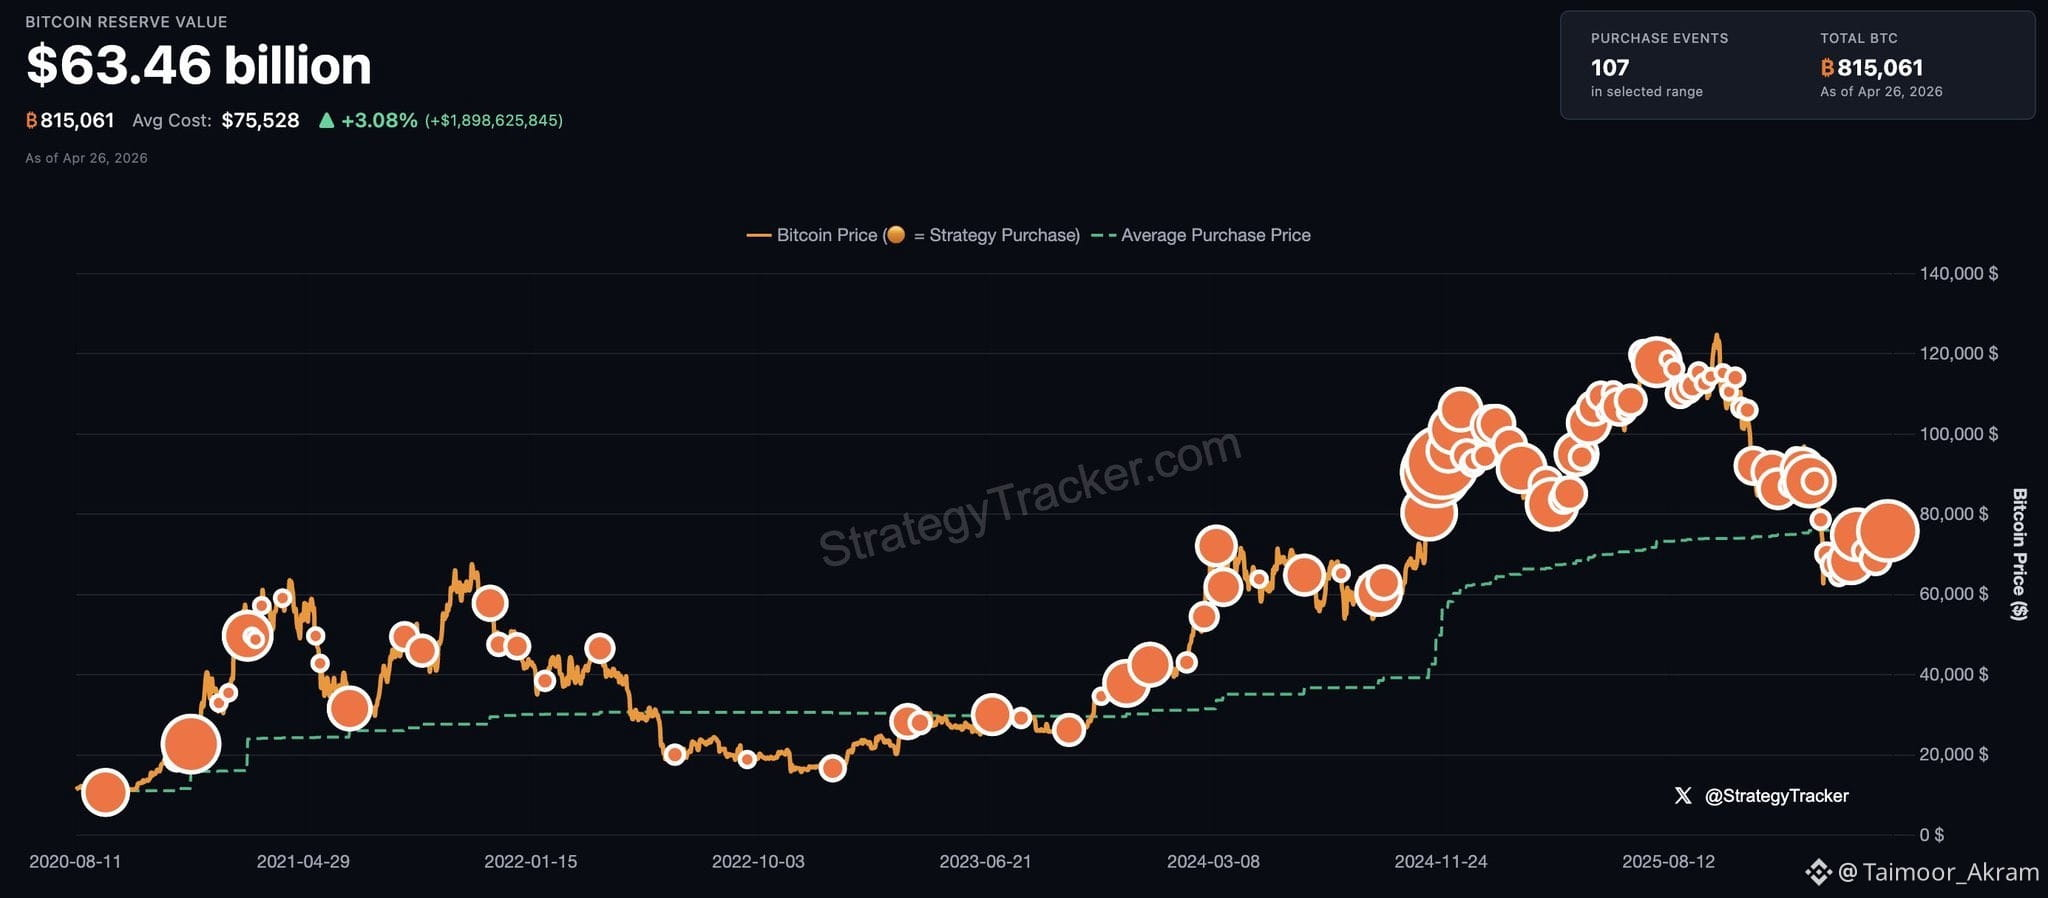
$BTC JUST IN: Michael Saylor hints at buying more Bitcoin.
"The ₿eat Goes On." follow me all friends like and comments share
{spot}(BTCUSDT)
#BTC #BTCBuyZones #BTCBULISH
$BTC JUST IN: Michael Saylor hints at buying more Bitcoin.
"The ₿eat Goes On." follow me all friends like and comments share
#BTC #BTCBuyZones #BTCBULISH
"The ₿eat Goes On." follow me all friends like and comments share
#BTC #BTCBuyZones #BTCBULISH
1
84

·
--
Bullish
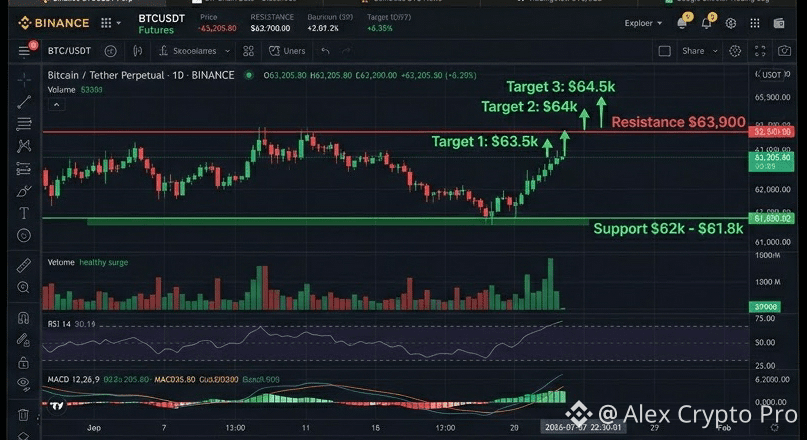
🚨 $BTC Reclaiming $63K Institutions Are Buying This Dip Aggressively 🚨
$BTC is stabilizing above key support with massive institutional inflows signaling the bottom is in. Those still on the fence are about to miss the next major leg up time is running out.
Key Technical Levels:
• Support: $62,000 – $61,800
• Resistance: $63,900
• Targets: $64,000 → $64,500 → $65,000+
Institutions continue loading $BTC amid ETF demand and macro stabilization. The current consolidation is the final window before momentum explodes higher.
Delaying entry means paying premium prices later while early movers secure life changing returns. Open BTC long positions on Binance right now don't watch from the sidelines as the bull run accelerates. Act today or regret tomorrow.
#bitcoin #BTC #crypto #btcbreakout #BTCBULISH
{spot}(BTCUSDT)
{spot}(SOLUSDT)
{spot}(XRPUSDT)
🚨 $BTC Reclaiming $63K Institutions Are Buying This Dip Aggressively 🚨
$BTC is stabilizing above key support with massive institutional inflows signaling the bottom is in. Those still on the fence are about to miss the next major leg up time is running out.
Key Technical Levels:
• Support: $62,000 – $61,800
• Resistance: $63,900
• Targets: $64,000 → $64,500 → $65,000+
Institutions continue loading $BTC amid ETF demand and macro stabilization. The current consolidation is the final window before momentum explodes higher.
Delaying entry means paying premium prices later while early movers secure life changing returns. Open BTC long positions on Binance right now don't watch from the sidelines as the bull run accelerates. Act today or regret tomorrow.
#bitcoin #BTC #crypto #btcbreakout #BTCBULISH
$BTC is stabilizing above key support with massive institutional inflows signaling the bottom is in. Those still on the fence are about to miss the next major leg up time is running out.
Key Technical Levels:
• Support: $62,000 – $61,800
• Resistance: $63,900
• Targets: $64,000 → $64,500 → $65,000+
Institutions continue loading $BTC amid ETF demand and macro stabilization. The current consolidation is the final window before momentum explodes higher.
Delaying entry means paying premium prices later while early movers secure life changing returns. Open BTC long positions on Binance right now don't watch from the sidelines as the bull run accelerates. Act today or regret tomorrow.
#bitcoin #BTC #crypto #btcbreakout #BTCBULISH
122
·
--
Bullish
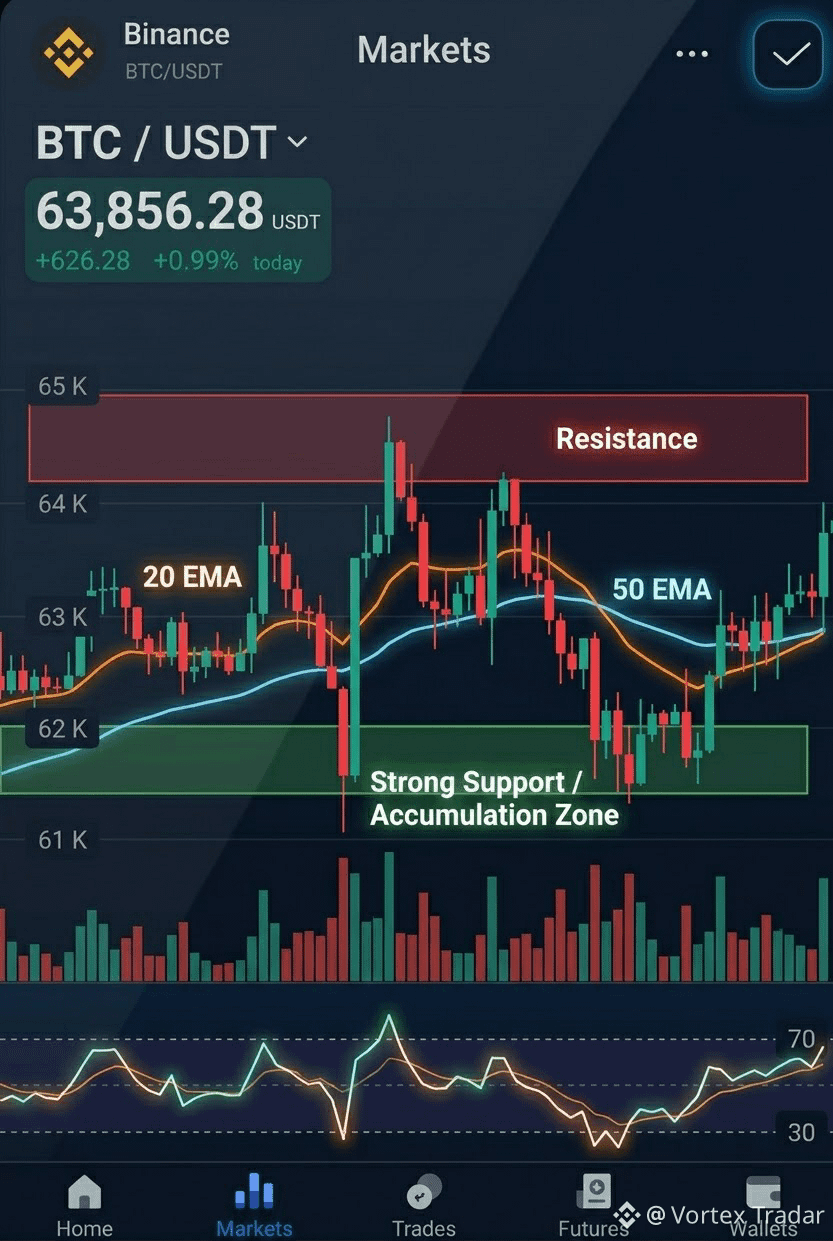
🚨 $BTC holding strong above $63K is this the calm before the next leg up 🚨
$BTC is showing solid resilience up nearly 1% today and 2% this week. After a volatile period price has reclaimed the 63K-64K zone with buyers stepping in on dips. Market sentiment is cautiously optimistic as BTC eyes higher highs.
Technical Analysis:
Strong support at $62,800-$63,200
Key resistance at $64,500-$65K.
RSI is around 55-60 neutral with room to run. 20 EMA crossing above 50 EMA signals bullish trend. Volume has been healthy on green candles confirming buyer interest. Overall uptrend intact.
Trade Setup: Entry Zone: $63,500-$63,800 Target 1: $64,500 Target 2: $65,200 Target 3: $66,000 Stop Loss: $62,700 R:R Ratio: 1:3+
Trading Tip: Always size your position so a stop loss hit doesn't exceed 1-2% of your portfolio. Patience beats FOMO.
What is your $BTC outlook Comment "BULLISH" if you are holding Type "LONG" if you're buying dips. Comment "READY" for more setups.
#bitcoin #BTC #crypto #BTCBULISH #TechnicalAnalysis
{spot}(BTCUSDT)
{spot}(BNBUSDT)
{spot}(SOLUSDT)
🚨 $BTC holding strong above $63K is this the calm before the next leg up 🚨
$BTC is showing solid resilience up nearly 1% today and 2% this week. After a volatile period price has reclaimed the 63K-64K zone with buyers stepping in on dips. Market sentiment is cautiously optimistic as BTC eyes higher highs.
Technical Analysis:
Strong support at $62,800-$63,200
Key resistance at $64,500-$65K.
RSI is around 55-60 neutral with room to run. 20 EMA crossing above 50 EMA signals bullish trend. Volume has been healthy on green candles confirming buyer interest. Overall uptrend intact.
Trade Setup: Entry Zone: $63,500-$63,800 Target 1: $64,500 Target 2: $65,200 Target 3: $66,000 Stop Loss: $62,700 R:R Ratio: 1:3+
Trading Tip: Always size your position so a stop loss hit doesn't exceed 1-2% of your portfolio. Patience beats FOMO.
What is your $BTC outlook Comment "BULLISH" if you are holding Type "LONG" if you're buying dips. Comment "READY" for more setups.
#bitcoin #BTC #crypto #BTCBULISH #TechnicalAnalysis
$BTC is showing solid resilience up nearly 1% today and 2% this week. After a volatile period price has reclaimed the 63K-64K zone with buyers stepping in on dips. Market sentiment is cautiously optimistic as BTC eyes higher highs.
Technical Analysis:
Strong support at $62,800-$63,200
Key resistance at $64,500-$65K.
RSI is around 55-60 neutral with room to run. 20 EMA crossing above 50 EMA signals bullish trend. Volume has been healthy on green candles confirming buyer interest. Overall uptrend intact.
Trade Setup: Entry Zone: $63,500-$63,800 Target 1: $64,500 Target 2: $65,200 Target 3: $66,000 Stop Loss: $62,700 R:R Ratio: 1:3+
Trading Tip: Always size your position so a stop loss hit doesn't exceed 1-2% of your portfolio. Patience beats FOMO.
What is your $BTC outlook Comment "BULLISH" if you are holding Type "LONG" if you're buying dips. Comment "READY" for more setups.
#bitcoin #BTC #crypto #BTCBULISH #TechnicalAnalysis
125

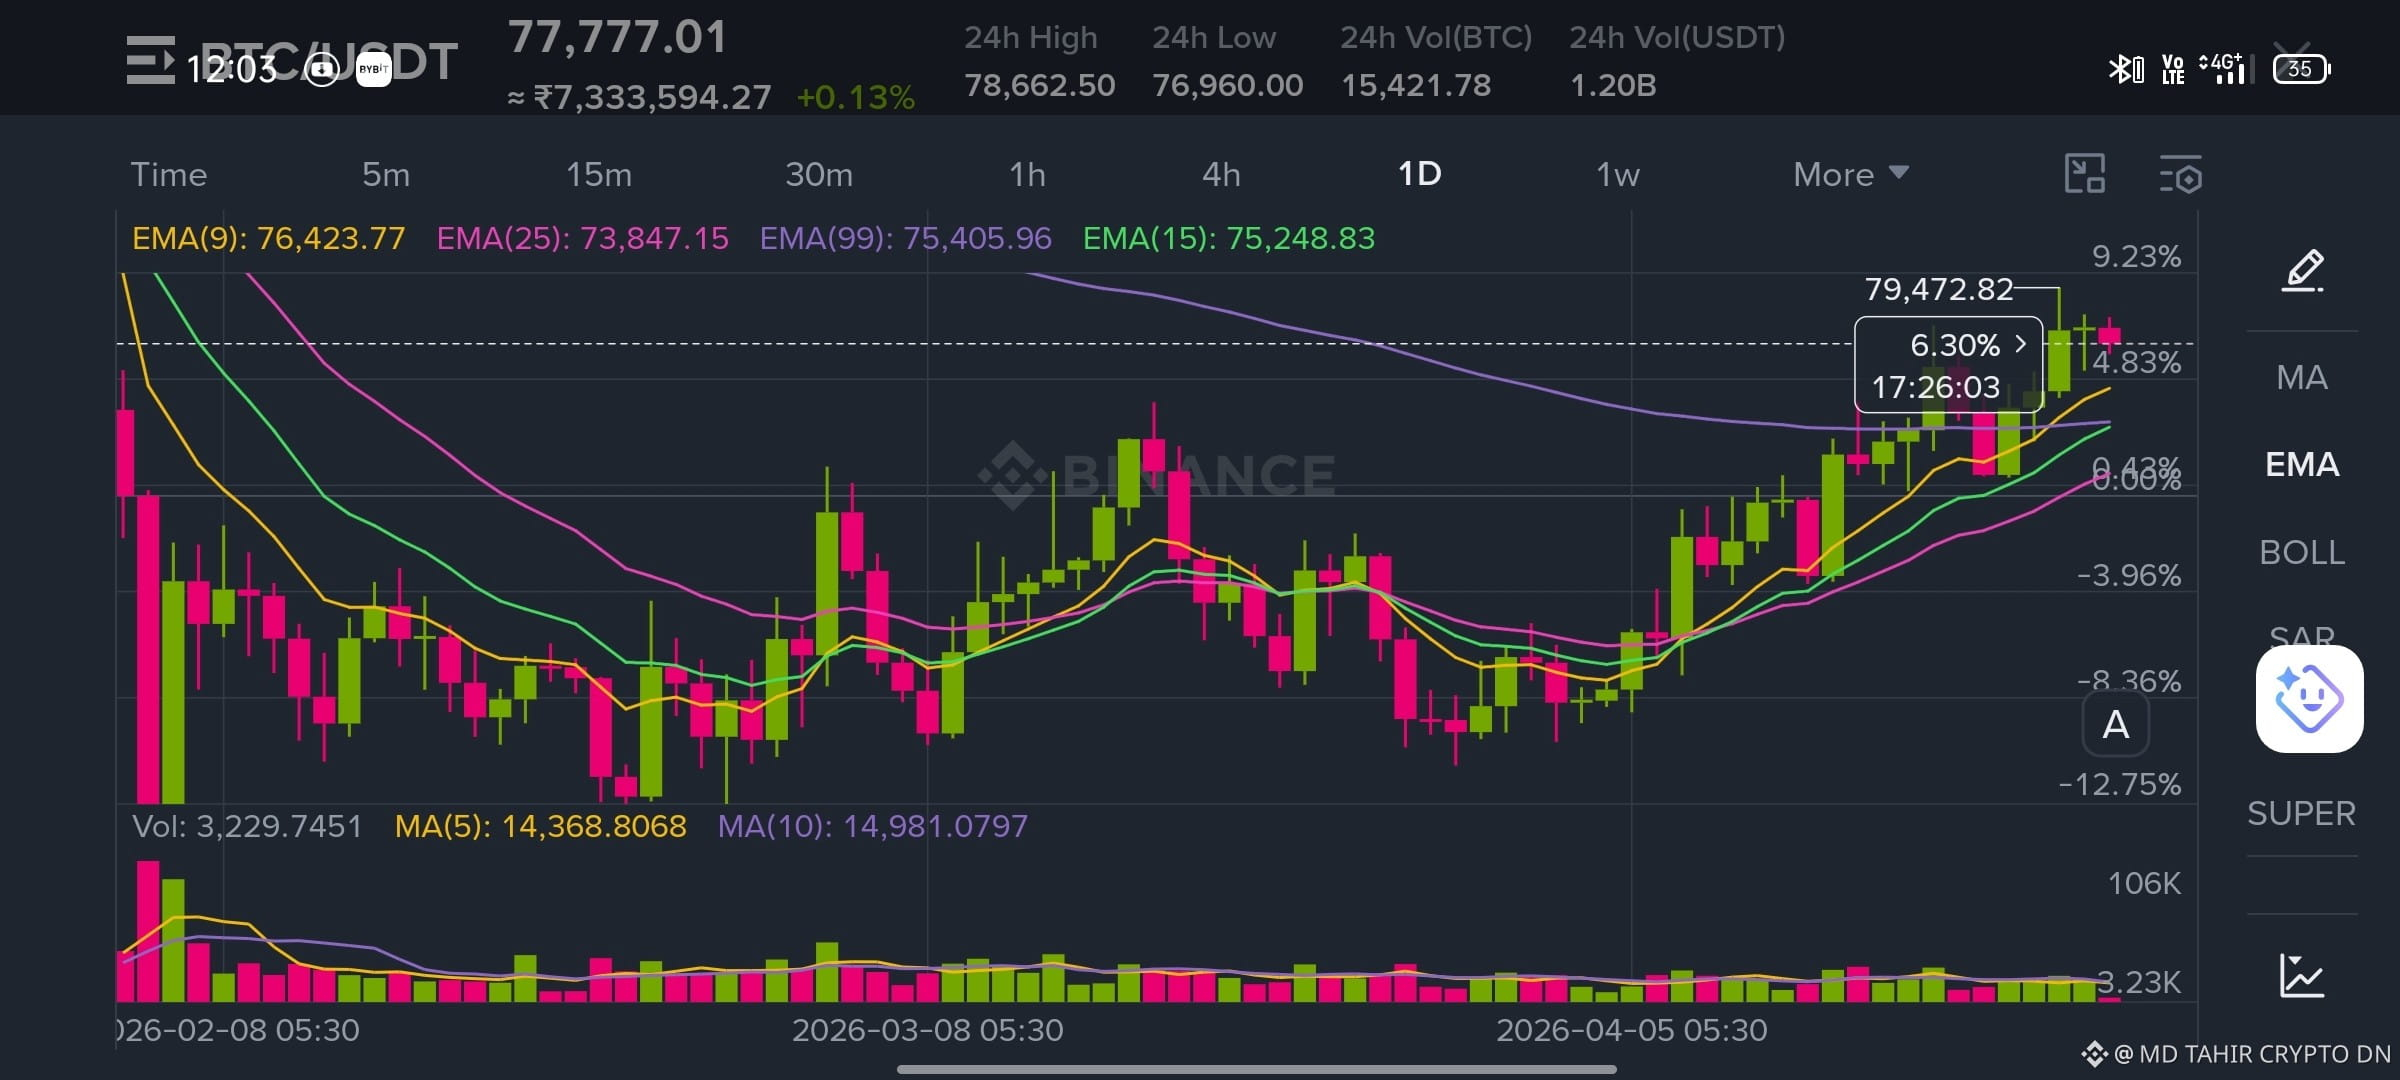
$BTC bullish big move don't miss buy now #BTCBULISH
$BTC bullish big move don't miss buy now #BTCBULISH
81

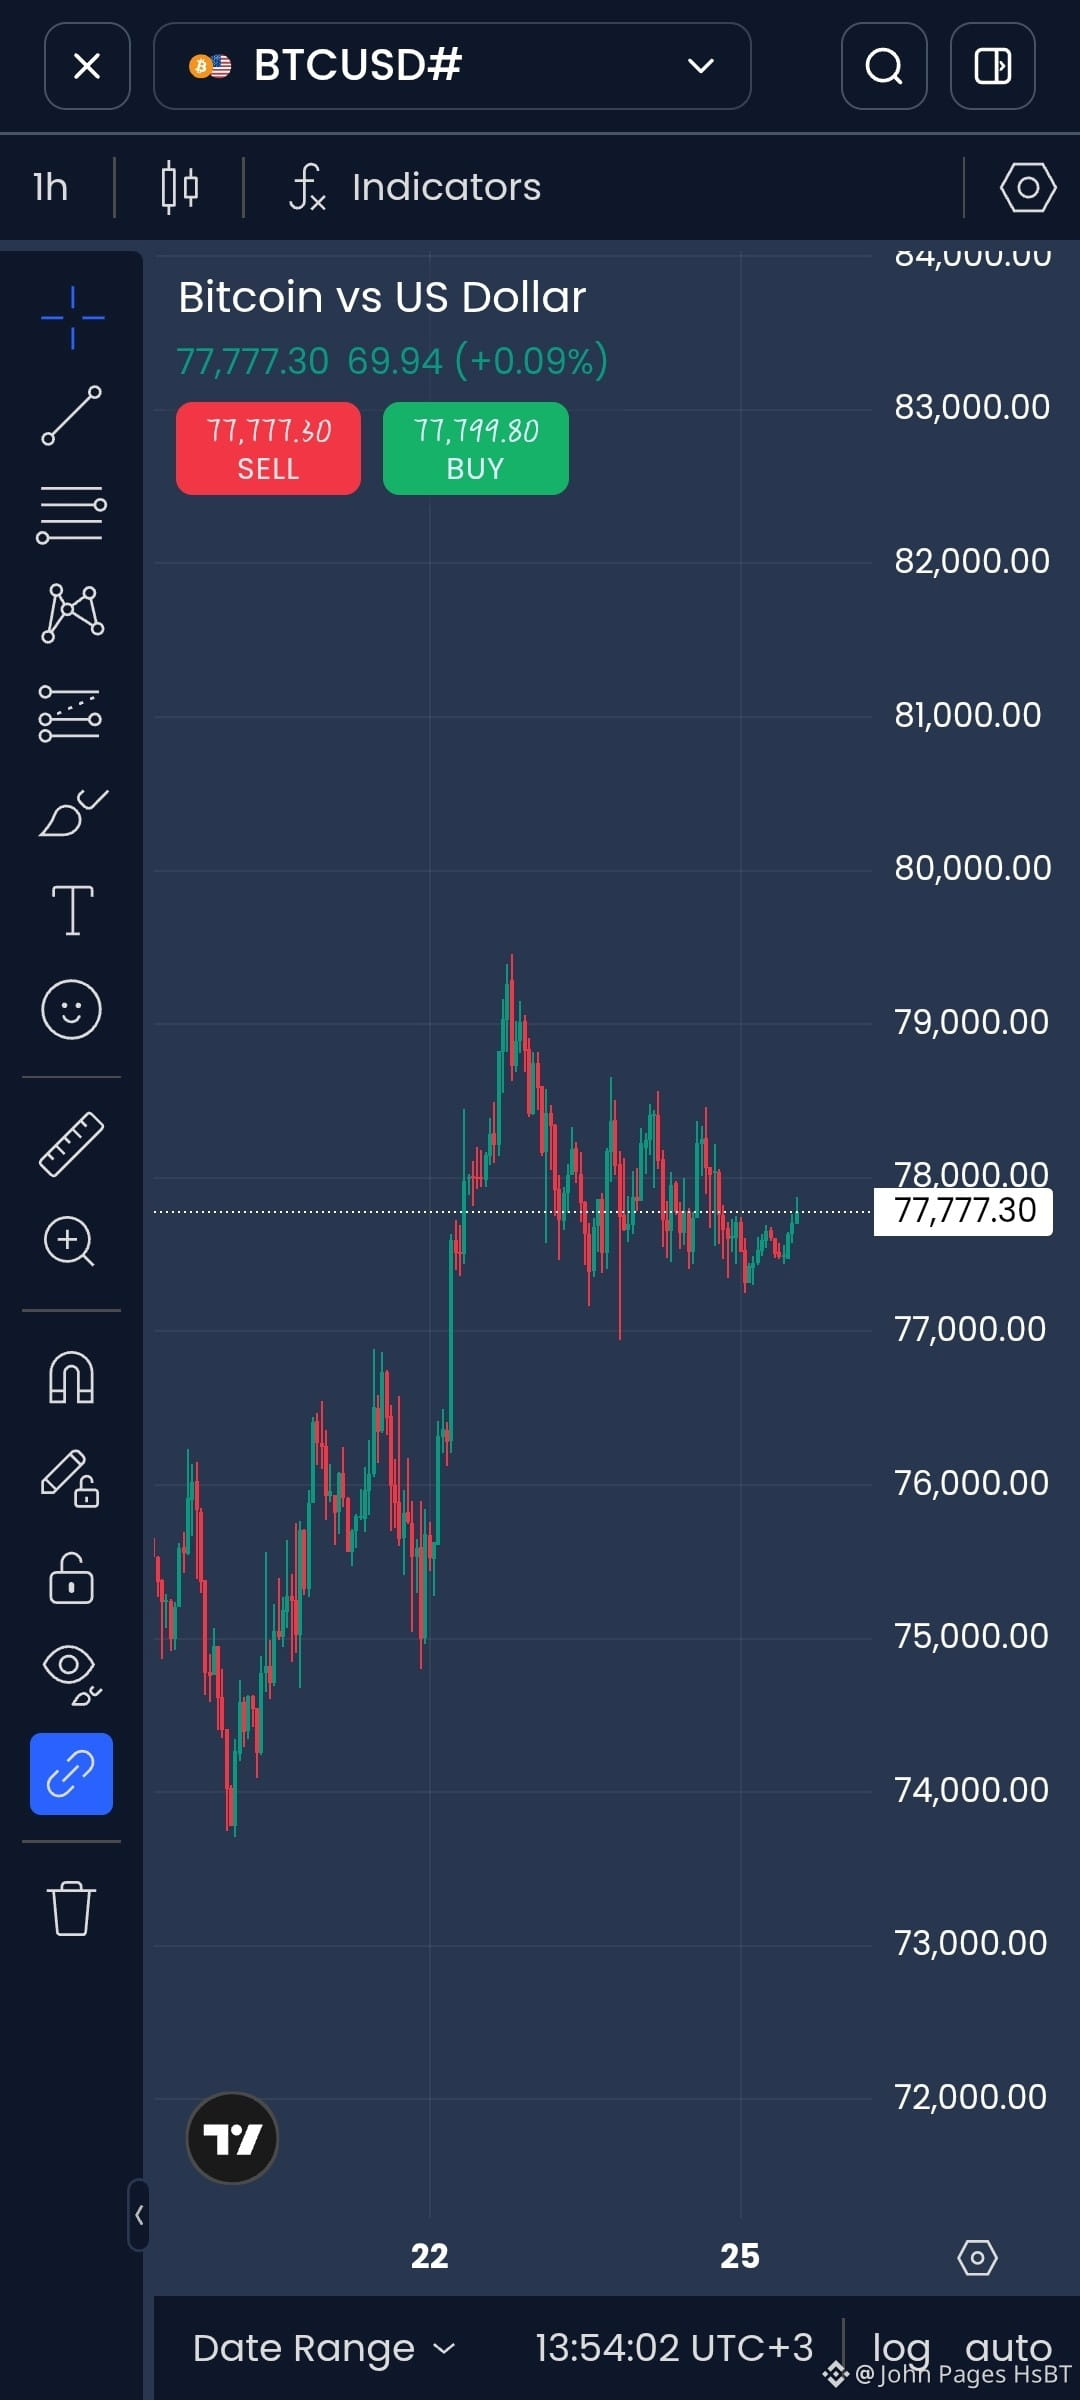
💵💲 I had said yesterday that BTC is going to reach 80k and see today BTC has almost reached 80k#BTC☀️ #BTCBULISH #BTC80K #cypto .
💵💲 I had said yesterday that BTC is going to reach 80k and see today BTC has almost reached 80k#BTC☀️ #BTCBULISH #BTC80K #cypto .
8
138

·
--
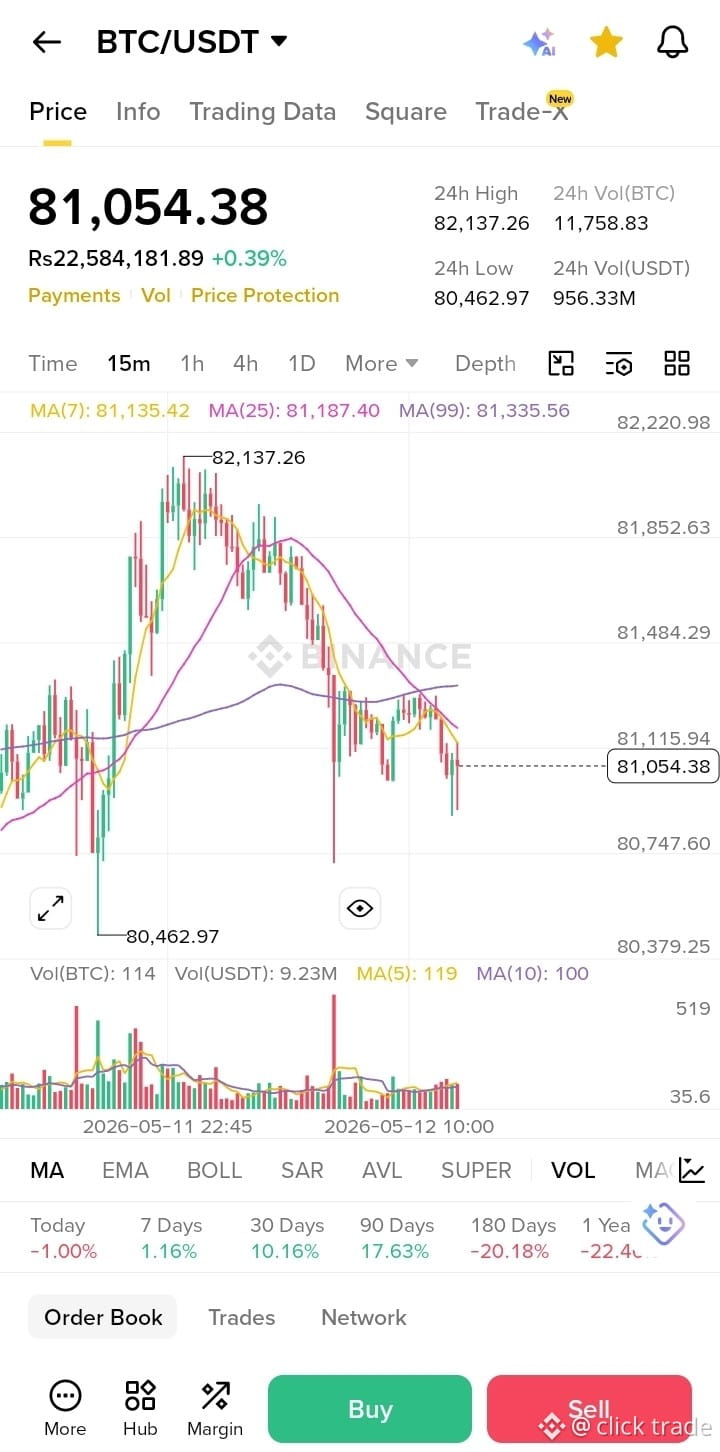
$BTC BTC/USDT on Binance is 81061.20 USDT right now, up ~0.39% vs the 24h open (80746.02). 24h range: 80462.97 – 82137.26.#BTCBULISH #BinanceOnline
$BTC BTC/USDT on Binance is 81061.20 USDT right now, up ~0.39% vs the 24h open (80746.02). 24h range: 80462.97 – 82137.26.#BTCBULISH #BinanceOnline
57
Log in to explore more content
Join global crypto users on Binance Square
⚡️ Get latest and useful information about crypto.
💬 Trusted by the world’s largest crypto exchange.
👍 Discover real insights from verified creators.
Email / Phone number
Trending Topics
1
#AnthropicIPOProspectusCouldValueItOver$2T
494 views
31 Discussing
2
#HackersDrainOver12.4MXRPFromDCENTWallets
4,615 views
204 Discussing
3
#SECSaysDecentralizedTokenBuybacksNotInvestmentContracts
161 views
9 Discussing
4
#UKFCAWinsCourtOrderToRecover851400Pounds
60,314 views
1,108 Discussing
5
#ChainlinkLaunchesCCIP2WithEnterpriseVerification
69,615 views
1,232 Discussing
6
#GoldFallsTo$4144
22,738 views
182 Discussing
7
#QNTFallsOver40%FromMorningHigh
119,521 views
1,600 Discussing
8
#USDTAdds845900HoldersInPast7Days
35,426 views
623 Discussing
9
#KospiFalls2.7%SamsungSKHynixDropOver5%
45,036 views
719 Discussing
10
#BitgetCEOConfirms$388MStolenInHack
6,275 views
46 Discussing