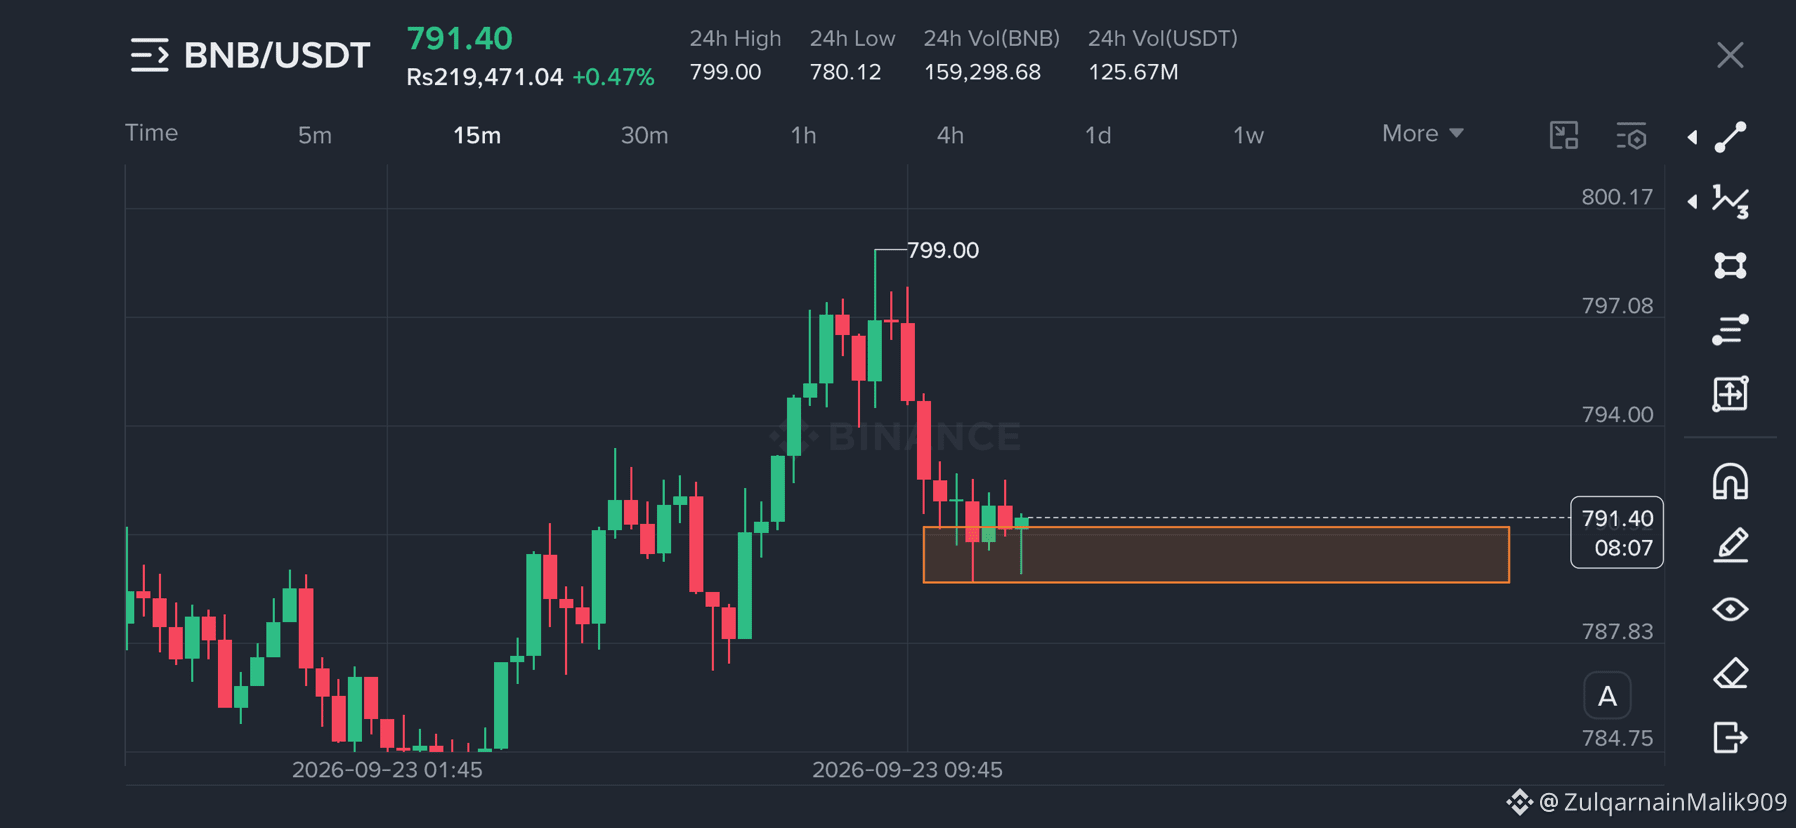
BNB/USDT Analysis (4h Chart)
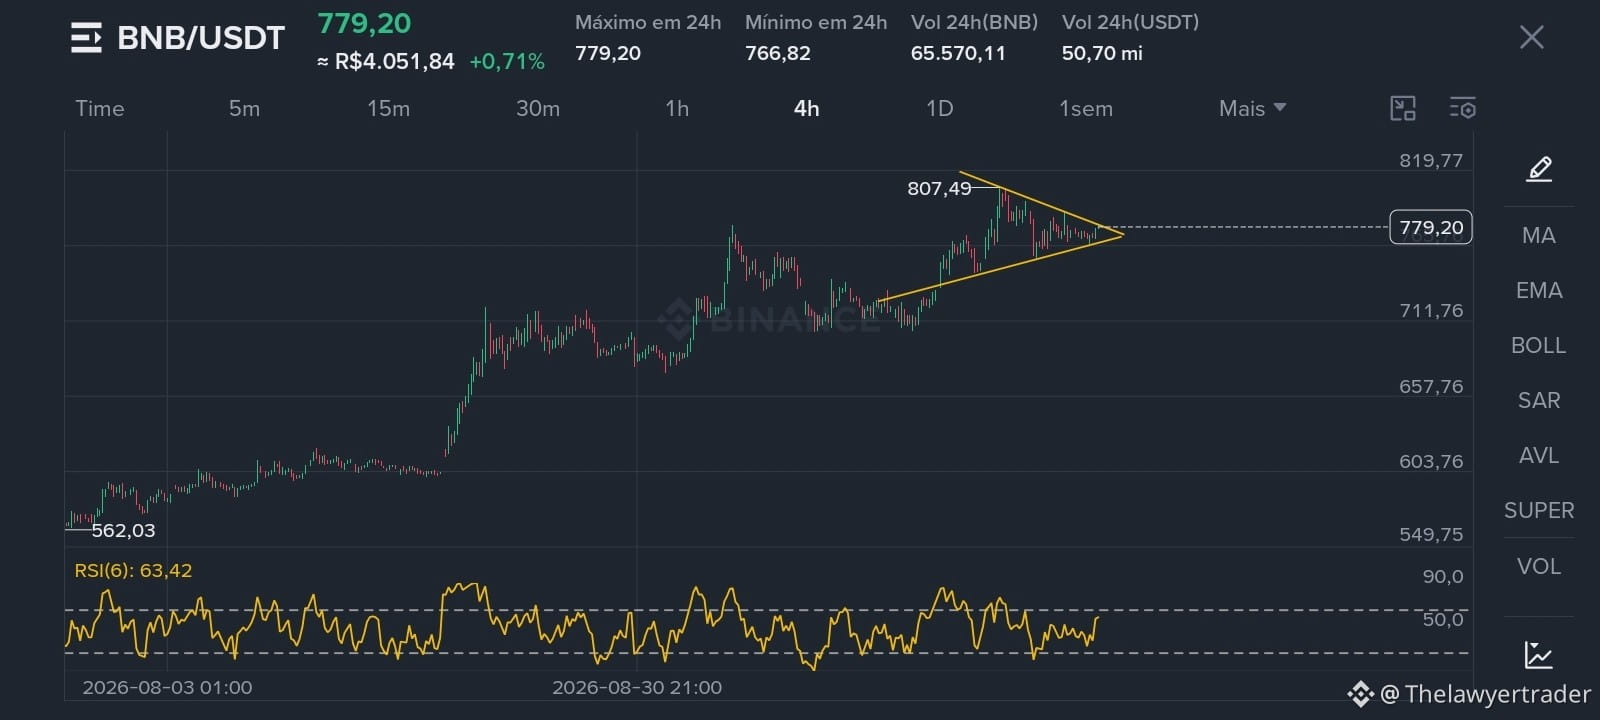
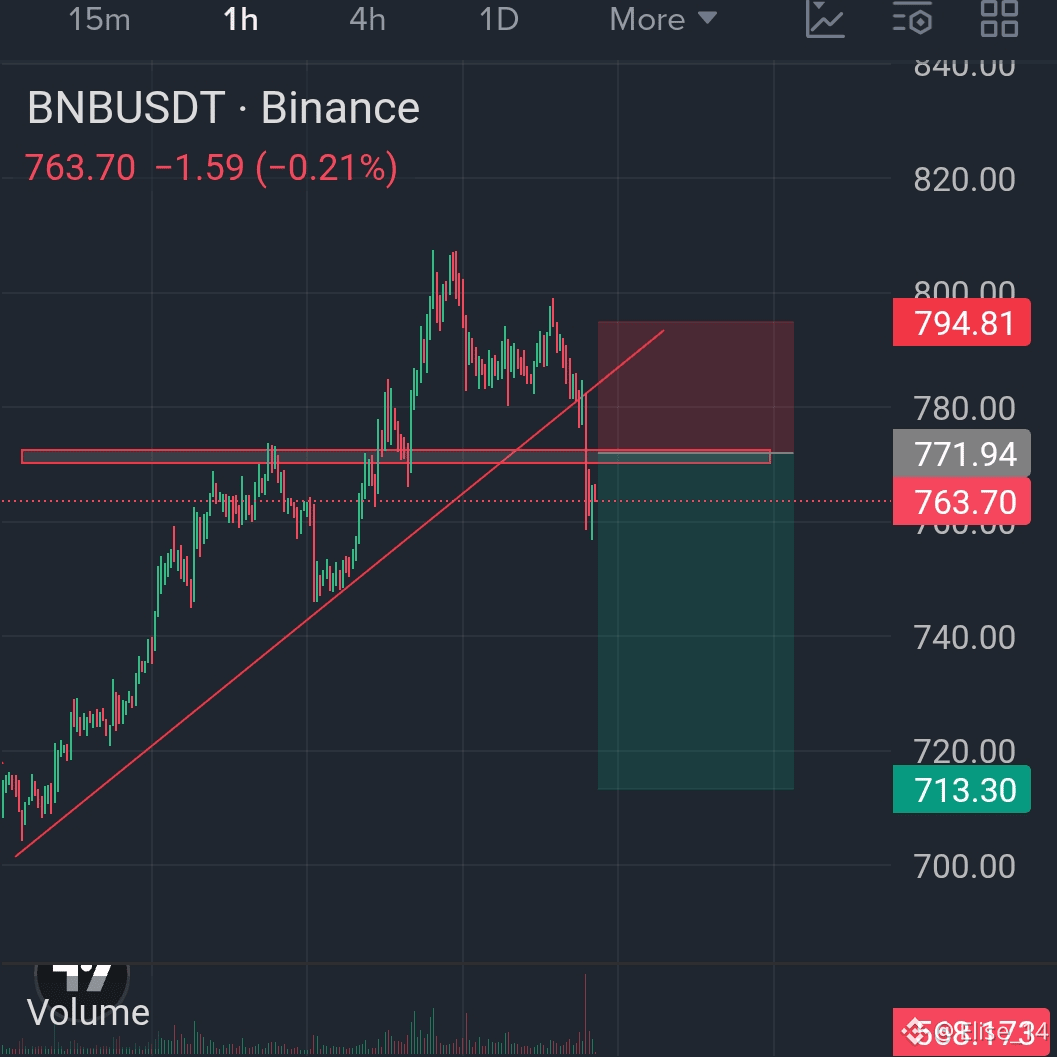
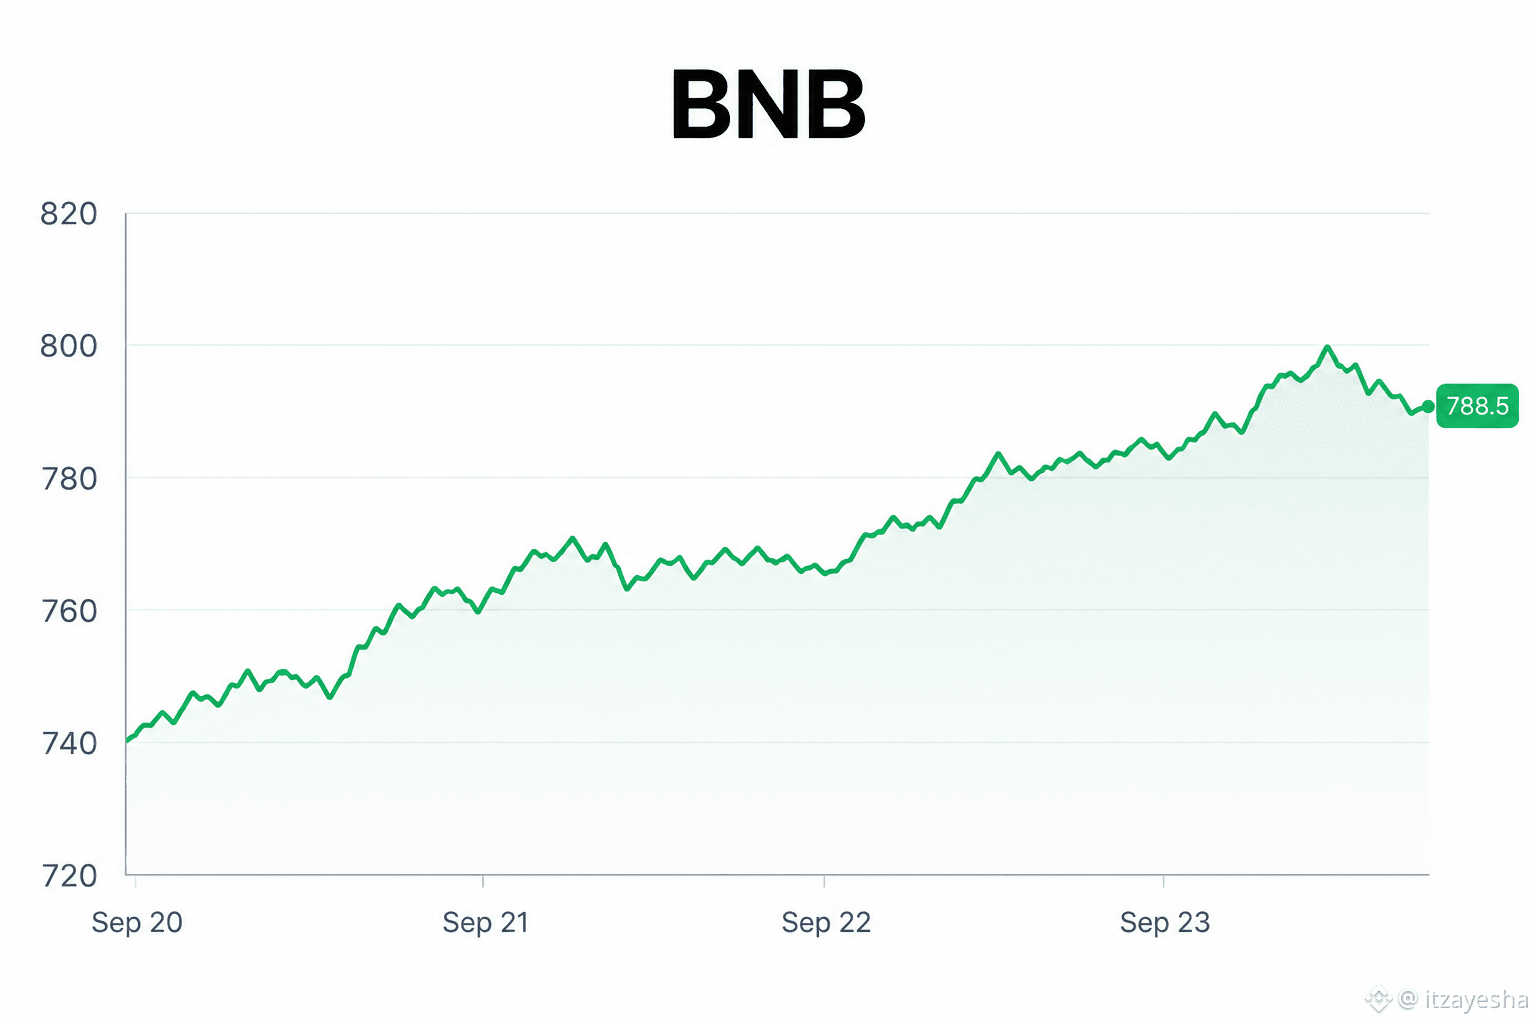
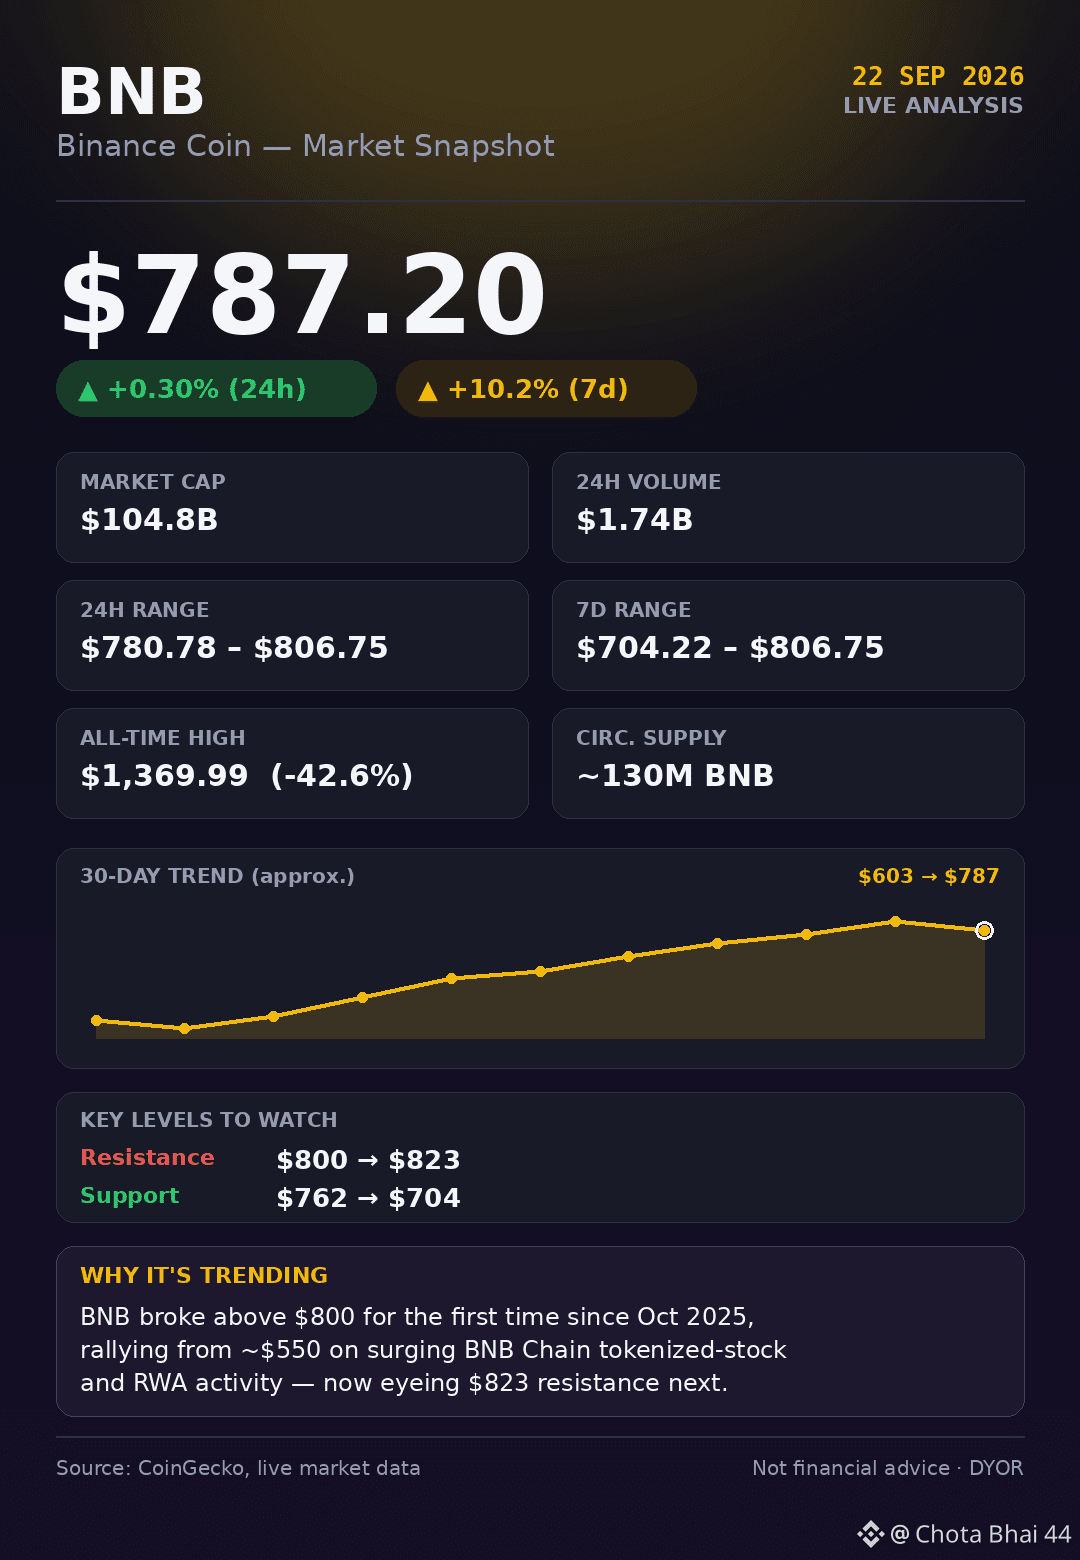
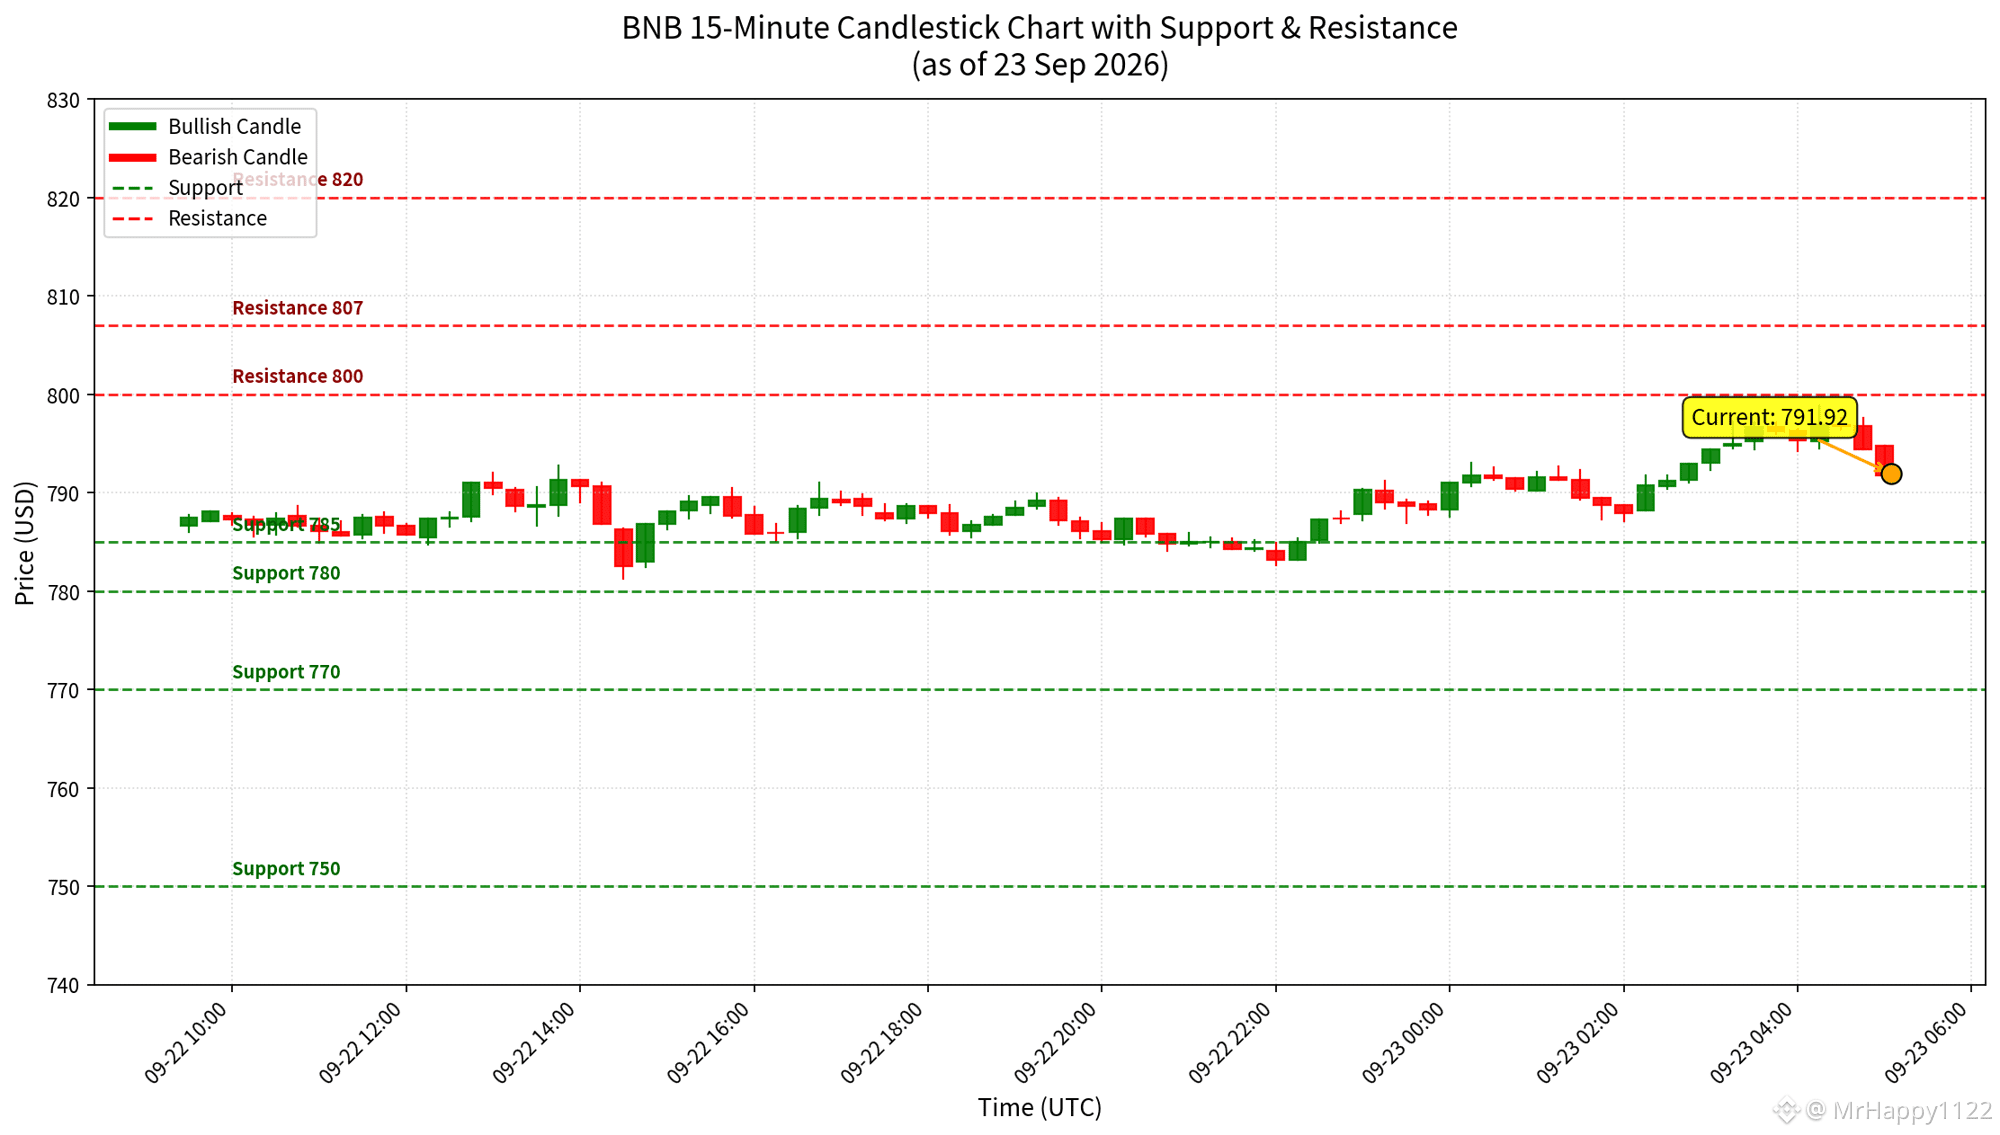
BNB is trading at 779.20, operating within a symmetrical triangle (with an ascending triangle bias) formed near the local top of 807.49. This pattern indicates consolidation and volatility compression—i.e., the market is accumulating energy before a directional breakout.
The asset is coming from a clear uptrend from the base at 562.03, and the current moment is a decision point. A breakout above the triangle’s upper resistance, with a close above 807.49, would pave the way for the continuation of the uptrend, while a loss of the lower support would signal a deeper correction.
The RSI(6) at 63.42 reinforces the bullish scenario, showing buying strength without yet being in an overbought zone, leaving room for further movement.
Pattern probability: the ascending triangle configuration within an uptrend context has a higher likelihood of breaking upward, favoring the continuation of the move. Still, it is a consolidation pattern, and confirmation only occurs after a close outside the figure.
⚠️ Analysis based only on the chart, not investment advice. Always assess your own risk.
#bnb #BNBToken $BNB