
#avgob
avgob
2,077 views
181 Discussing
Hot
Latest

·
--
Silicon Surge? Broadcom’s AVGOB Gains Steam on Binance Spot 🚀
Broadcom Inc tokenized share (AVGOB/USDT) is trading at $362.48 on Binance Spot, up 3.63 % over the past 24 h. $AVGOB reflects the chip‑maker’s solid earnings backdrop and the broader semiconductor sector’s resilience, keeping investor interest alive despite neutral market sentiment.
Price action – $AVGOB posted a firm rally, breaking above the $355‑$360 range and testing higher levels. The move is driven by sector‑wide optimism rather than specific news.
Key levels – Immediate support holds near $350.00, while the nearest resistance caps around $380.00. A mid‑range pivot sits at $362.50, acting as a short‑term fulcrum for intraday traders.
Short outlook – The analyst angle remains cautious. The recent rise looks stretched relative to recent volatility, and a pullback toward the $350 support zone could test buying strength before any further upside. Traders should watch volume and price action for signs of reversal.
#AVGOB #Broadcom #BinanceSquare
Silicon Surge? Broadcom’s AVGOB Gains Steam on Binance Spot 🚀
Broadcom Inc tokenized share (AVGOB/USDT) is trading at $362.48 on Binance Spot, up 3.63 % over the past 24 h. $AVGOB reflects the chip‑maker’s solid earnings backdrop and the broader semiconductor sector’s resilience, keeping investor interest alive despite neutral market sentiment.
Price action – $AVGOB posted a firm rally, breaking above the $355‑$360 range and testing higher levels. The move is driven by sector‑wide optimism rather than specific news.
Key levels – Immediate support holds near $350.00, while the nearest resistance caps around $380.00. A mid‑range pivot sits at $362.50, acting as a short‑term fulcrum for intraday traders.
Short outlook – The analyst angle remains cautious. The recent rise looks stretched relative to recent volatility, and a pullback toward the $350 support zone could test buying strength before any further upside. Traders should watch volume and price action for signs of reversal.
#AVGOB #Broadcom #BinanceSquare
Broadcom Inc tokenized share (AVGOB/USDT) is trading at $362.48 on Binance Spot, up 3.63 % over the past 24 h. $AVGOB reflects the chip‑maker’s solid earnings backdrop and the broader semiconductor sector’s resilience, keeping investor interest alive despite neutral market sentiment.
Price action – $AVGOB posted a firm rally, breaking above the $355‑$360 range and testing higher levels. The move is driven by sector‑wide optimism rather than specific news.
Key levels – Immediate support holds near $350.00, while the nearest resistance caps around $380.00. A mid‑range pivot sits at $362.50, acting as a short‑term fulcrum for intraday traders.
Short outlook – The analyst angle remains cautious. The recent rise looks stretched relative to recent volatility, and a pullback toward the $350 support zone could test buying strength before any further upside. Traders should watch volume and price action for signs of reversal.
#AVGOB #Broadcom #BinanceSquare

·
--
$AVGOB +3.04% | $BNCB +2.92% | $JUP +2.57%
#AVGOB nudged up to $358.05, gaining +3.04% on $3.1 M of volume. The price rise is modest but the trading flow suggests enough interest to keep the move alive.
#BNCB climbed to $3.52, up +2.92% with $1.6 M changing hands. Lower volume relative to AVGOB may mean a tighter support level ahead.
#JUP ticked higher to $0.2675, up +2.57% on $2.4 M volume. Its mid‑range liquidity could help sustain the advance.
📌 Watch how JUP’s volume outpaces BNCB despite a smaller % gain; it could become the quiet driver of the trio’s momentum.
#Write2Earn #Binance
$AVGOB +3.04% | $BNCB +2.92% | $JUP +2.57%
#AVGOB nudged up to $358.05, gaining +3.04% on $3.1 M of volume. The price rise is modest but the trading flow suggests enough interest to keep the move alive.
#BNCB climbed to $3.52, up +2.92% with $1.6 M changing hands. Lower volume relative to AVGOB may mean a tighter support level ahead.
#JUP ticked higher to $0.2675, up +2.57% on $2.4 M volume. Its mid‑range liquidity could help sustain the advance.
📌 Watch how JUP’s volume outpaces BNCB despite a smaller % gain; it could become the quiet driver of the trio’s momentum.
#Write2Earn #Binance
#AVGOB nudged up to $358.05, gaining +3.04% on $3.1 M of volume. The price rise is modest but the trading flow suggests enough interest to keep the move alive.
#BNCB climbed to $3.52, up +2.92% with $1.6 M changing hands. Lower volume relative to AVGOB may mean a tighter support level ahead.
#JUP ticked higher to $0.2675, up +2.57% on $2.4 M volume. Its mid‑range liquidity could help sustain the advance.
📌 Watch how JUP’s volume outpaces BNCB despite a smaller % gain; it could become the quiet driver of the trio’s momentum.
#Write2Earn #Binance
14
·
--
$AVGOB +4.28% | $USUAL +4.25% | $MARSCOIN +3.77%
#AVGOB nudged up to $353.73, gaining +4.28% on $3.4 M volume.
#USUAL rose to $0.0106, up +4.25% with $2.8 M traded.
#MARSCOIN ticked higher to $0.0330, climbing +3.77% on $1.7 M volume.
📊 The similar % gains but noticeably lower volume for MARSCOIN suggest its rally could be more fragile than the others.
#Write2Earn #Binance
$AVGOB +4.28% | $USUAL +4.25% | $MARSCOIN +3.77%
#AVGOB nudged up to $353.73, gaining +4.28% on $3.4 M volume.
#USUAL rose to $0.0106, up +4.25% with $2.8 M traded.
#MARSCOIN ticked higher to $0.0330, climbing +3.77% on $1.7 M volume.
📊 The similar % gains but noticeably lower volume for MARSCOIN suggest its rally could be more fragile than the others.
#Write2Earn #Binance
#AVGOB nudged up to $353.73, gaining +4.28% on $3.4 M volume.
#USUAL rose to $0.0106, up +4.25% with $2.8 M traded.
#MARSCOIN ticked higher to $0.0330, climbing +3.77% on $1.7 M volume.
📊 The similar % gains but noticeably lower volume for MARSCOIN suggest its rally could be more fragile than the others.
#Write2Earn #Binance
19

·
--
📊 Today's Market Analysis – November 18, 2026
🚗 $TSLAB (Tesla): Trading around $381.29, with positive weekly momentum. The stock is holding investor attention as buyers watch for another breakout. Monitor the $385 resistance zone.
🤖 $AVGOB (Broadcom): Trading near $347.78, up approximately 4.31% in 24 hours. Strong buying activity reflects growing interest in AI chips and semiconductor technology.
💡 $LITEB (Lumentum): Trading around $584.71, up approximately 9.58% in 24 hours. Strong momentum and trading activity are attracting attention, although volatility remains high.
🔥 Market Outlook: AVGOB and LITEB are showing encouraging momentum, while TSLAB maintains a positive weekly trend. Watch volume, confirm breakouts, and manage risk wisely.
#TSLAB #AVGOB #LITEB #Tesla #Broadcom #Lumentum #AI #MarketAnalysis #Trading
{spot}(TSLABUSDT)
{spot}(AVGOBUSDT)
{spot}(LITEBUSDT)
📊 Today's Market Analysis – November 18, 2026
🚗 $TSLAB (Tesla): Trading around $381.29, with positive weekly momentum. The stock is holding investor attention as buyers watch for another breakout. Monitor the $385 resistance zone.
🤖 $AVGOB (Broadcom): Trading near $347.78, up approximately 4.31% in 24 hours. Strong buying activity reflects growing interest in AI chips and semiconductor technology.
💡 $LITEB (Lumentum): Trading around $584.71, up approximately 9.58% in 24 hours. Strong momentum and trading activity are attracting attention, although volatility remains high.
🔥 Market Outlook: AVGOB and LITEB are showing encouraging momentum, while TSLAB maintains a positive weekly trend. Watch volume, confirm breakouts, and manage risk wisely.
#TSLAB #AVGOB #LITEB #Tesla #Broadcom #Lumentum #AI #MarketAnalysis #Trading
🚗 $TSLAB (Tesla): Trading around $381.29, with positive weekly momentum. The stock is holding investor attention as buyers watch for another breakout. Monitor the $385 resistance zone.
🤖 $AVGOB (Broadcom): Trading near $347.78, up approximately 4.31% in 24 hours. Strong buying activity reflects growing interest in AI chips and semiconductor technology.
💡 $LITEB (Lumentum): Trading around $584.71, up approximately 9.58% in 24 hours. Strong momentum and trading activity are attracting attention, although volatility remains high.
🔥 Market Outlook: AVGOB and LITEB are showing encouraging momentum, while TSLAB maintains a positive weekly trend. Watch volume, confirm breakouts, and manage risk wisely.
#TSLAB #AVGOB #LITEB #Tesla #Broadcom #Lumentum #AI #MarketAnalysis #Trading

·
--
$AVGOB +5.85% | $ATM +5.72% | $SOPH +5.16%
#AVGOB trades at $351.08, up +5.85% on $1.5 M volume. The price push suggests renewed interest, though the modest turnover means the move could be fragile.
#ATM is priced at $0.7210, climbing +5.72% with $2.4 M changing hands. Momentum is strong, yet the token’s thin liquidity may limit how far it can run.
#SOPH sits at $0.00102000, gaining +5.16% on a solid $4.5 M of volume. The higher activity hints at broader participation, but a pullback is still possible.
📈 Watching the disparity in volume may reveal which of these gains can hold up beyond today’s swing.
#Write2Earn #Binance
$AVGOB +5.85% | $ATM +5.72% | $SOPH +5.16%
#AVGOB trades at $351.08, up +5.85% on $1.5 M volume. The price push suggests renewed interest, though the modest turnover means the move could be fragile.
#ATM is priced at $0.7210, climbing +5.72% with $2.4 M changing hands. Momentum is strong, yet the token’s thin liquidity may limit how far it can run.
#SOPH sits at $0.00102000, gaining +5.16% on a solid $4.5 M of volume. The higher activity hints at broader participation, but a pullback is still possible.
📈 Watching the disparity in volume may reveal which of these gains can hold up beyond today’s swing.
#Write2Earn #Binance
#AVGOB trades at $351.08, up +5.85% on $1.5 M volume. The price push suggests renewed interest, though the modest turnover means the move could be fragile.
#ATM is priced at $0.7210, climbing +5.72% with $2.4 M changing hands. Momentum is strong, yet the token’s thin liquidity may limit how far it can run.
#SOPH sits at $0.00102000, gaining +5.16% on a solid $4.5 M of volume. The higher activity hints at broader participation, but a pullback is still possible.
📈 Watching the disparity in volume may reveal which of these gains can hold up beyond today’s swing.
#Write2Earn #Binance
8

·
--
📉 AVGOB short-term bearish, 340 level under pressure
On November 20, before the U.S. market opened, Broadcom (AVGO) was down 1.77% at around $340.51 at 09:02 ET, extending Thursday’s 2.09% decline. At the same time, Nvidia was down 2.22% and AMD 4.42%, with chip stocks broadly under pressure. Stock performance (https://stockanalysis.com/stocks/avgo/history/) · Premarket trading (https://www.stocktitan.net/articles/stock-market-today-live-november-20-2026)
A public Binance AVGOB/USDT snapshot showed a price of around 340–342 USDT, well below the previous high of 369.39, with 24-hour trading volume of about $1.58 million. Spot snapshot (https://www.coingecko.com/en/coins/broadcom-bstocks-tokenized-stock) · Trading range (https://www.cexscan.com/coin-summary?symbol=AVGOB)
Bearish outlook for the next 4–24 hours. A break below 340 could see prices fall to 330–328 USDT; resistance on a rebound is at 345–347. Watch the U.S. market open and the final Michigan Consumer Sentiment reading at 10:00 ET. The bearish outlook is invalidated if the token holds above 347 on increased volume and Broadcom regains Thursday’s closing price. Data schedule (https://www.sca.isr.umich.edu/)
#AVGOB #AVGO #半导体 #美股 #RWA
📉 AVGOB short-term bearish, 340 level under pressure
On November 20, before the U.S. market opened, Broadcom (AVGO) was down 1.77% at around $340.51 at 09:02 ET, extending Thursday’s 2.09% decline. At the same time, Nvidia was down 2.22% and AMD 4.42%, with chip stocks broadly under pressure. Stock performance (https://stockanalysis.com/stocks/avgo/history/) · Premarket trading (https://www.stocktitan.net/articles/stock-market-today-live-november-20-2026)
A public Binance AVGOB/USDT snapshot showed a price of around 340–342 USDT, well below the previous high of 369.39, with 24-hour trading volume of about $1.58 million. Spot snapshot (https://www.coingecko.com/en/coins/broadcom-bstocks-tokenized-stock) · Trading range (https://www.cexscan.com/coin-summary?symbol=AVGOB)
Bearish outlook for the next 4–24 hours. A break below 340 could see prices fall to 330–328 USDT; resistance on a rebound is at 345–347. Watch the U.S. market open and the final Michigan Consumer Sentiment reading at 10:00 ET. The bearish outlook is invalidated if the token holds above 347 on increased volume and Broadcom regains Thursday’s closing price. Data schedule (https://www.sca.isr.umich.edu/)
#AVGOB #AVGO #半导体 #美股 #RWA
On November 20, before the U.S. market opened, Broadcom (AVGO) was down 1.77% at around $340.51 at 09:02 ET, extending Thursday’s 2.09% decline. At the same time, Nvidia was down 2.22% and AMD 4.42%, with chip stocks broadly under pressure. Stock performance (https://stockanalysis.com/stocks/avgo/history/) · Premarket trading (https://www.stocktitan.net/articles/stock-market-today-live-november-20-2026)
A public Binance AVGOB/USDT snapshot showed a price of around 340–342 USDT, well below the previous high of 369.39, with 24-hour trading volume of about $1.58 million. Spot snapshot (https://www.coingecko.com/en/coins/broadcom-bstocks-tokenized-stock) · Trading range (https://www.cexscan.com/coin-summary?symbol=AVGOB)
Bearish outlook for the next 4–24 hours. A break below 340 could see prices fall to 330–328 USDT; resistance on a rebound is at 345–347. Watch the U.S. market open and the final Michigan Consumer Sentiment reading at 10:00 ET. The bearish outlook is invalidated if the token holds above 347 on increased volume and Broadcom regains Thursday’s closing price. Data schedule (https://www.sca.isr.umich.edu/)
#AVGOB #AVGO #半导体 #美股 #RWA
2
·
--
📉 AVGOB short-term outlook is bearish; 340 USDT is the first key level
The November 20 market snapshot shows Binance spot AVGOBUSDT retreating from an intraday high of 369.39 to 343.39 USDT, down 3.54% over 24 hours, with approximately $2 million in trading volume. Trading snapshot (https://beforepump.com/coin/) · Intraday range (https://www.cexscan.com/coin-summary?symbol=AVGOB)
Broadcom shares (AVGO) surged and then retreated on Thursday, closing at $346.65, down 2.09%, and continued to fall in after-hours trading. Anthropic rose on its first day as a public company, while the Philadelphia Semiconductor Index fell 2.41% over the same period, putting pressure on the sector. Broadcom quote (https://finance.yahoo.com/quote/AVGO/) · Philadelphia Semiconductor Index (https://indexes.nasdaqomx.com/Index/History/SOX) · First day of trading (https://apnews.com/article/c4c3f4878b12989347f8a930ed813dad)
Over the next 4–24 hours, AVGOB is more likely to first retest 340–342 USDT. A break below 340 could accelerate the decline. The first rebound target is 347–349 USDT; the short-term bearish outlook would be invalidated if chip stocks rebound together after the U.S. market opens and the token’s hourly candle closes and holds above 349.
#AVGOB #AVGO #半导体 #Tokenized U.S. stocks
📉 AVGOB short-term outlook is bearish; 340 USDT is the first key level
The November 20 market snapshot shows Binance spot AVGOBUSDT retreating from an intraday high of 369.39 to 343.39 USDT, down 3.54% over 24 hours, with approximately $2 million in trading volume. Trading snapshot (https://beforepump.com/coin/) · Intraday range (https://www.cexscan.com/coin-summary?symbol=AVGOB)
Broadcom shares (AVGO) surged and then retreated on Thursday, closing at $346.65, down 2.09%, and continued to fall in after-hours trading. Anthropic rose on its first day as a public company, while the Philadelphia Semiconductor Index fell 2.41% over the same period, putting pressure on the sector. Broadcom quote (https://finance.yahoo.com/quote/AVGO/) · Philadelphia Semiconductor Index (https://indexes.nasdaqomx.com/Index/History/SOX) · First day of trading (https://apnews.com/article/c4c3f4878b12989347f8a930ed813dad)
Over the next 4–24 hours, AVGOB is more likely to first retest 340–342 USDT. A break below 340 could accelerate the decline. The first rebound target is 347–349 USDT; the short-term bearish outlook would be invalidated if chip stocks rebound together after the U.S. market opens and the token’s hourly candle closes and holds above 349.
#AVGOB #AVGO #半导体 #Tokenized U.S. stocks
The November 20 market snapshot shows Binance spot AVGOBUSDT retreating from an intraday high of 369.39 to 343.39 USDT, down 3.54% over 24 hours, with approximately $2 million in trading volume. Trading snapshot (https://beforepump.com/coin/) · Intraday range (https://www.cexscan.com/coin-summary?symbol=AVGOB)
Broadcom shares (AVGO) surged and then retreated on Thursday, closing at $346.65, down 2.09%, and continued to fall in after-hours trading. Anthropic rose on its first day as a public company, while the Philadelphia Semiconductor Index fell 2.41% over the same period, putting pressure on the sector. Broadcom quote (https://finance.yahoo.com/quote/AVGO/) · Philadelphia Semiconductor Index (https://indexes.nasdaqomx.com/Index/History/SOX) · First day of trading (https://apnews.com/article/c4c3f4878b12989347f8a930ed813dad)
Over the next 4–24 hours, AVGOB is more likely to first retest 340–342 USDT. A break below 340 could accelerate the decline. The first rebound target is 347–349 USDT; the short-term bearish outlook would be invalidated if chip stocks rebound together after the U.S. market opens and the token’s hourly candle closes and holds above 349.
#AVGOB #AVGO #半导体 #Tokenized U.S. stocks


$AVGOB: Quality Gates Over Spam Volume
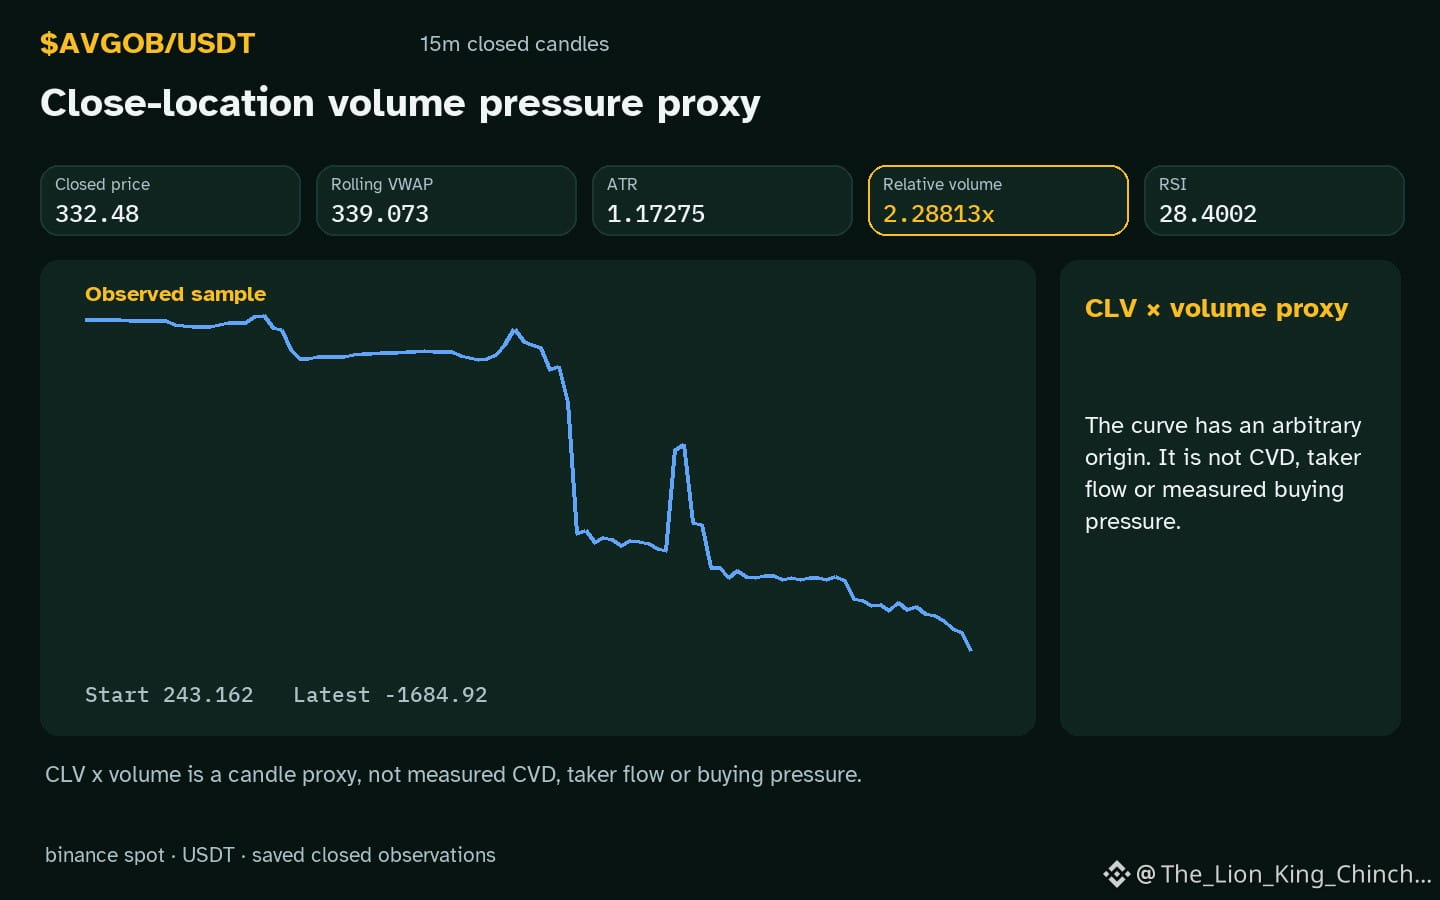
Does $AVGOB data support posting only when evidence qualifies? We observe an hourly down direction with volume above baseline. Price stands below local support at 334.23.
The Dilemma
Write to Earn models often reward frequency. This creates pressure to publish before analysis matures. A useful gate checks if the claim is specific and verifiable. Here, the observation is precise: a down move with relative volume 2.29x baseline. The RSI reading is 28.4. These facts anchor the post. Vague predictions fail this gate.
The Trade-off
Posting less means missing out on potential engagement. However, spam erodes reader trust. A counterexample is relevant: if we post a bullish claim without a resistance test, we mix opinion with data. That weakens the analysis. The self-check asks if each sentence links to supplied facts. If not, remove it.
A Rule Worth Testing
Use a simple filter. Ask: can I point to a specific candle or indicator? For $AVGOB, the local range is defined by 334.23 and 338.88. The daily change is -1.8712%. If these facts do not change the decision, do not post. This respects the reader. It treats content as evidence, not noise. Future closed candles may weaken or confirm this view relative to 335.963. Reassess when price closes above 338.88.
Probabilistic market research, not a recommendation or guaranteed return.
The comparison to keep in mind: $ETH has hourly direction down and volume above its baseline; $GLMR has hourly direction up and volume not above its baseline. This alone does not establish correlation.
#AVGOB #ETH #GLMR #CryptoCommunity #CryptoLearning
$AVGOB : Quality Gates Over Spam Volume
Does $AVGOB data support posting only when evidence qualifies? We observe an hourly down direction with volume above baseline. Price stands below local support at 334.23.
The Dilemma
Write to Earn models often reward frequency. This creates pressure to publish before analysis matures. A useful gate checks if the claim is specific and verifiable. Here, the observation is precise: a down move with relative volume 2.29x baseline. The RSI reading is 28.4. These facts anchor the post. Vague predictions fail this gate.
The Trade-off
Posting less means missing out on potential engagement. However, spam erodes reader trust. A counterexample is relevant: if we post a bullish claim without a resistance test, we mix opinion with data. That weakens the analysis. The self-check asks if each sentence links to supplied facts. If not, remove it.
A Rule Worth Testing
Use a simple filter. Ask: can I point to a specific candle or indicator? For $AVGOB , the local range is defined by 334.23 and 338.88. The daily change is -1.8712%. If these facts do not change the decision, do not post. This respects the reader. It treats content as evidence, not noise. Future closed candles may weaken or confirm this view relative to 335.963. Reassess when price closes above 338.88.
Probabilistic market research, not a recommendation or guaranteed return.
The comparison to keep in mind: $ETH has hourly direction down and volume above its baseline; $GLMR has hourly direction up and volume not above its baseline. This alone does not establish correlation.
#AVGOB #ETH #GLMR #CryptoCommunity #CryptoLearning
Does $AVGOB data support posting only when evidence qualifies? We observe an hourly down direction with volume above baseline. Price stands below local support at 334.23.
The Dilemma
Write to Earn models often reward frequency. This creates pressure to publish before analysis matures. A useful gate checks if the claim is specific and verifiable. Here, the observation is precise: a down move with relative volume 2.29x baseline. The RSI reading is 28.4. These facts anchor the post. Vague predictions fail this gate.
The Trade-off
Posting less means missing out on potential engagement. However, spam erodes reader trust. A counterexample is relevant: if we post a bullish claim without a resistance test, we mix opinion with data. That weakens the analysis. The self-check asks if each sentence links to supplied facts. If not, remove it.
A Rule Worth Testing
Use a simple filter. Ask: can I point to a specific candle or indicator? For $AVGOB , the local range is defined by 334.23 and 338.88. The daily change is -1.8712%. If these facts do not change the decision, do not post. This respects the reader. It treats content as evidence, not noise. Future closed candles may weaken or confirm this view relative to 335.963. Reassess when price closes above 338.88.
Probabilistic market research, not a recommendation or guaranteed return.
The comparison to keep in mind: $ETH has hourly direction down and volume above its baseline; $GLMR has hourly direction up and volume not above its baseline. This alone does not establish correlation.
#AVGOB #ETH #GLMR #CryptoCommunity #CryptoLearning
21

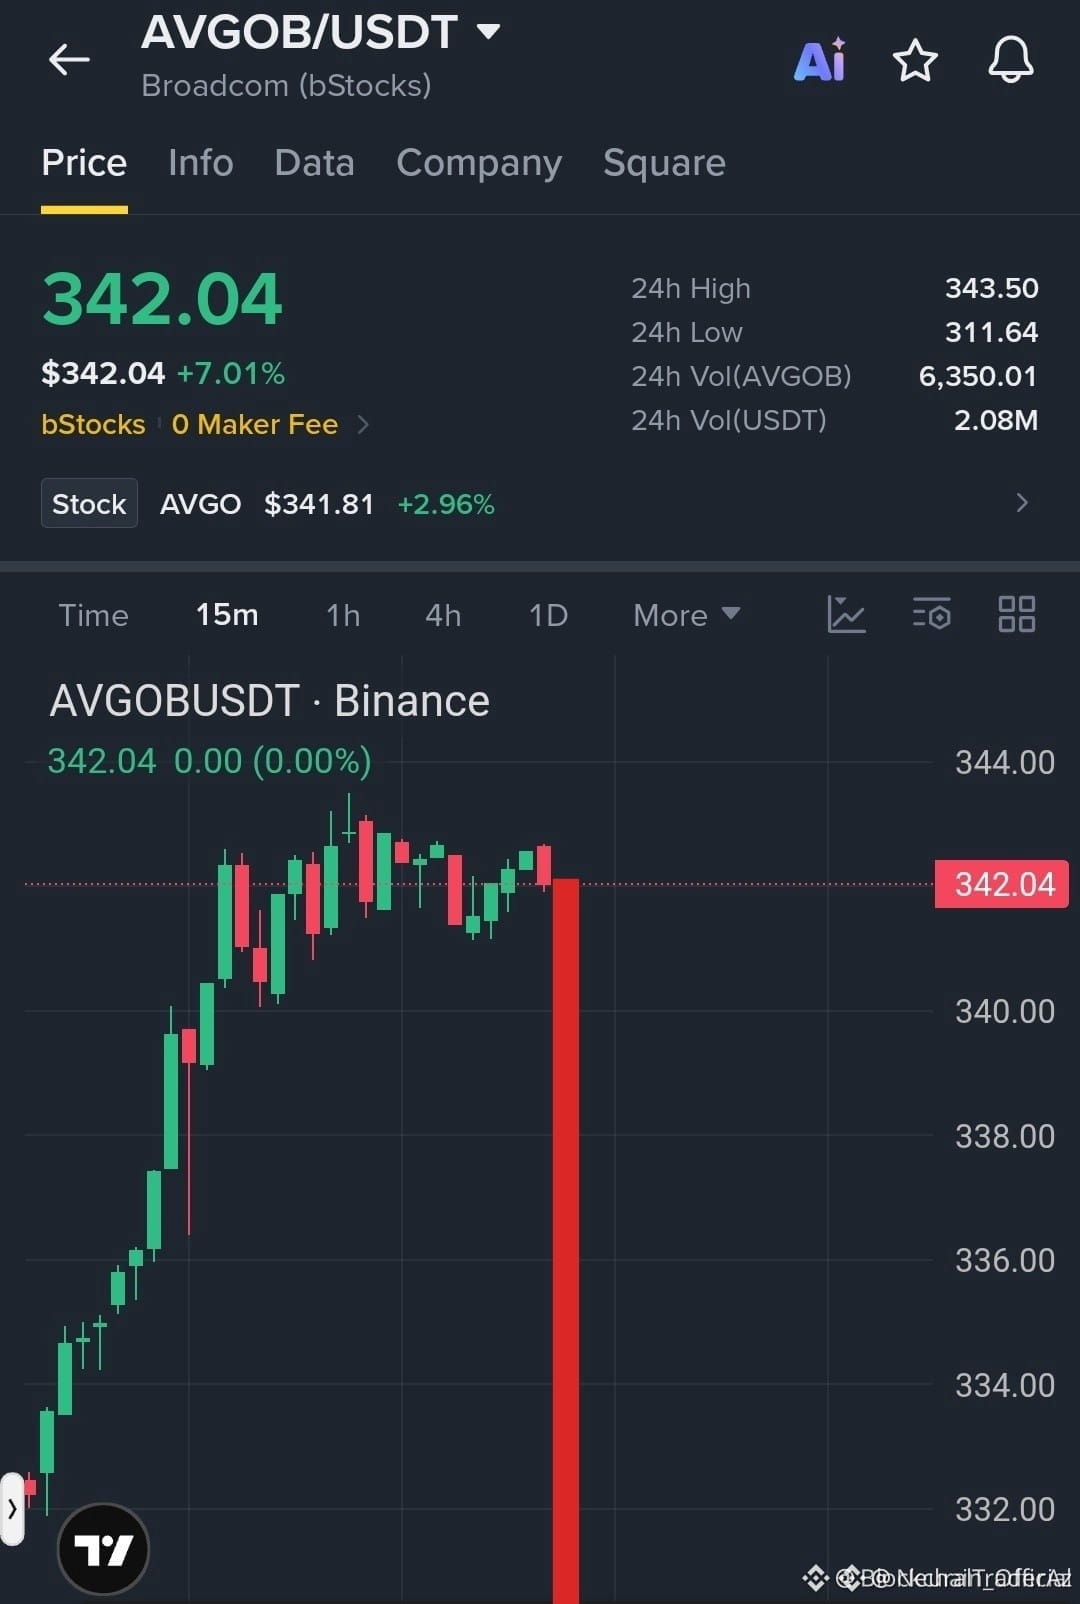
🚨 $AVGOB FACES A SHARP REJECTION AT KEY RESISTANCE AS SELLERS STEP IN! 📉
Entry: $342.00 – $343.00 ⚡
Target 1: $340.00 🎯
Target 2: $337.00 🎯
Target 3: $334.00 🚀
Stop Loss: $345.00 🛑
Price action on the higher timeframe reveals aggressive supply absorption right into the $343.00 institutional resistance zone. The formation of this sharp rejection candle confirms that smart money is actively distributing inventory and trapping late retail longs. 📊
As long as the $345.00 invalidation level holds firm, expect descending order flow to systematically target lower liquidity pools and inefficiency zones. ⚡
💬 Are you positioning for this downside continuation or waiting for a deeper retest? 👇
⚠️ Not financial advice. Always manage your risk. 🛡️
🏷️ #AVGOB #ShortSetup #PriceAction #Crypto
🔥 🦈
🚨 $AVGOB FACES A SHARP REJECTION AT KEY RESISTANCE AS SELLERS STEP IN! 📉
Entry: $342.00 – $343.00 ⚡
Target 1: $340.00 🎯
Target 2: $337.00 🎯
Target 3: $334.00 🚀
Stop Loss: $345.00 🛑
Price action on the higher timeframe reveals aggressive supply absorption right into the $343.00 institutional resistance zone. The formation of this sharp rejection candle confirms that smart money is actively distributing inventory and trapping late retail longs. 📊
As long as the $345.00 invalidation level holds firm, expect descending order flow to systematically target lower liquidity pools and inefficiency zones. ⚡
💬 Are you positioning for this downside continuation or waiting for a deeper retest? 👇
⚠️ Not financial advice. Always manage your risk. 🛡️
🏷️ #AVGOB #ShortSetup #PriceAction #Crypto
🔥 🦈
Entry: $342.00 – $343.00 ⚡
Target 1: $340.00 🎯
Target 2: $337.00 🎯
Target 3: $334.00 🚀
Stop Loss: $345.00 🛑
Price action on the higher timeframe reveals aggressive supply absorption right into the $343.00 institutional resistance zone. The formation of this sharp rejection candle confirms that smart money is actively distributing inventory and trapping late retail longs. 📊
As long as the $345.00 invalidation level holds firm, expect descending order flow to systematically target lower liquidity pools and inefficiency zones. ⚡
💬 Are you positioning for this downside continuation or waiting for a deeper retest? 👇
⚠️ Not financial advice. Always manage your risk. 🛡️
🏷️ #AVGOB #ShortSetup #PriceAction #Crypto
🔥 🦈
1

$AVGOB Current price: approximately $335–$338
24-hour change: approximately +0.5%
Market capitalization: approximately $8.9 million
24-hour volume: approximately $0.8–$1.67 million
7-day performance: positive according to some market data providers.
AVGOB (Broadcom Tokenized bStocks) is showing positive short-term movement.
📊 Market Highlights:
Price: Around $335–$338
24H Change: Approximately +0.5%
Market Cap: Around $8.9M
Intraday Range: $333.57–$341.35
🕯️ Technical Watch: The market is showing a small recovery, but traders should watch whether price can move above the recent intraday high.
📈 A sustained move above $341.35 could indicate stronger bullish momentum. A move below $333.57 could indicate renewed selling pressure.
⚠️ Important: AVGOB represents tokenized Broadcom stock exposure. It is not a regular cryptocurrency, and its price can be affected by Broadcom shares and token-market liquidity.
🔥 Watch the candles. Watch the volume. Stay informed!
#AVGOB
#BroadcomEarnings
#BroadcomDellAIResults
##broadcom_avgo
$AVGOB Current price: approximately $335–$338
24-hour change: approximately +0.5%
Market capitalization: approximately $8.9 million
24-hour volume: approximately $0.8–$1.67 million
7-day performance: positive according to some market data providers.
AVGOB (Broadcom Tokenized bStocks) is showing positive short-term movement.
📊 Market Highlights:
Price: Around $335–$338
24H Change: Approximately +0.5%
Market Cap: Around $8.9M
Intraday Range: $333.57–$341.35
🕯️ Technical Watch: The market is showing a small recovery, but traders should watch whether price can move above the recent intraday high.
📈 A sustained move above $341.35 could indicate stronger bullish momentum. A move below $333.57 could indicate renewed selling pressure.
⚠️ Important: AVGOB represents tokenized Broadcom stock exposure. It is not a regular cryptocurrency, and its price can be affected by Broadcom shares and token-market liquidity.
🔥 Watch the candles. Watch the volume. Stay informed!
#AVGOB
#BroadcomEarnings
#BroadcomDellAIResults
##broadcom_avgo
24-hour change: approximately +0.5%
Market capitalization: approximately $8.9 million
24-hour volume: approximately $0.8–$1.67 million
7-day performance: positive according to some market data providers.
AVGOB (Broadcom Tokenized bStocks) is showing positive short-term movement.
📊 Market Highlights:
Price: Around $335–$338
24H Change: Approximately +0.5%
Market Cap: Around $8.9M
Intraday Range: $333.57–$341.35
🕯️ Technical Watch: The market is showing a small recovery, but traders should watch whether price can move above the recent intraday high.
📈 A sustained move above $341.35 could indicate stronger bullish momentum. A move below $333.57 could indicate renewed selling pressure.
⚠️ Important: AVGOB represents tokenized Broadcom stock exposure. It is not a regular cryptocurrency, and its price can be affected by Broadcom shares and token-market liquidity.
🔥 Watch the candles. Watch the volume. Stay informed!
#AVGOB
#BroadcomEarnings
#BroadcomDellAIResults
##broadcom_avgo

107

·
--
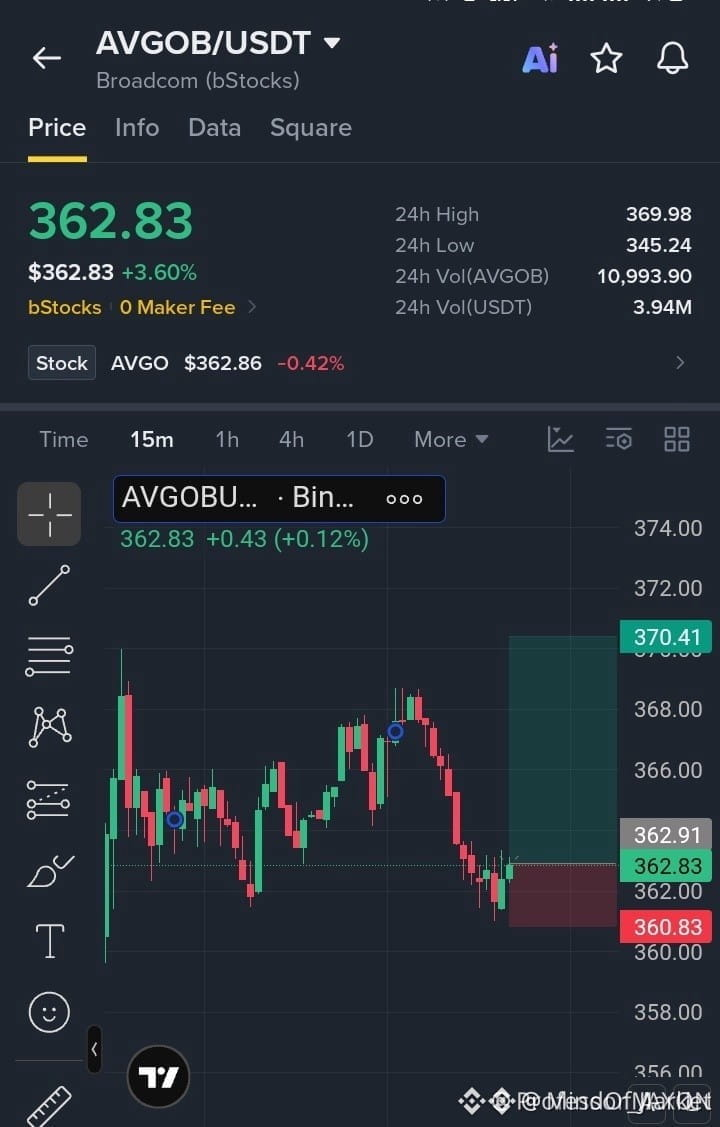
🦈 $AVGOB RECLAIMING KEY SUPPORT AS SMART MONEY TARGETS HIGHER LIQUIDITY POCKETS ⚡
Entry: 362.00–363.00 ⚡
Target: 370.41 🚀
Stop Loss: 360.83 ⚠️
Price action has successfully defended the 361.00 to 362.00 demand zone, aggressively absorbing residual sell-side pressure and shifting the order flow balance back to buyers. 📊 A sustained acceptance above 363.00 confirms the structural shift, clearing a clean path for an institutional expansion toward upper liquidity pools. 💡 Are you scaling in right here within the entry zone, or waiting for a minor intraday retest before positioning? 🤔
⚠️ Not financial advice. Always manage your risk. 🛡️
🏷️ #AVGOB #LongSetup #OrderFlow #Crypto #SmartMoney
🦈 ⚡
🦈 $AVGOB RECLAIMING KEY SUPPORT AS SMART MONEY TARGETS HIGHER LIQUIDITY POCKETS ⚡
Entry: 362.00–363.00 ⚡
Target: 370.41 🚀
Stop Loss: 360.83 ⚠️
Price action has successfully defended the 361.00 to 362.00 demand zone, aggressively absorbing residual sell-side pressure and shifting the order flow balance back to buyers. 📊 A sustained acceptance above 363.00 confirms the structural shift, clearing a clean path for an institutional expansion toward upper liquidity pools. 💡 Are you scaling in right here within the entry zone, or waiting for a minor intraday retest before positioning? 🤔
⚠️ Not financial advice. Always manage your risk. 🛡️
🏷️ #AVGOB #LongSetup #OrderFlow #Crypto #SmartMoney
🦈 ⚡
Entry: 362.00–363.00 ⚡
Target: 370.41 🚀
Stop Loss: 360.83 ⚠️
Price action has successfully defended the 361.00 to 362.00 demand zone, aggressively absorbing residual sell-side pressure and shifting the order flow balance back to buyers. 📊 A sustained acceptance above 363.00 confirms the structural shift, clearing a clean path for an institutional expansion toward upper liquidity pools. 💡 Are you scaling in right here within the entry zone, or waiting for a minor intraday retest before positioning? 🤔
⚠️ Not financial advice. Always manage your risk. 🛡️
🏷️ #AVGOB #LongSetup #OrderFlow #Crypto #SmartMoney
🦈 ⚡
1

🚨 $AVGOB DEFENDING THE SUPPORT FLOOR AS BULLS RECLAIM MOMENTUM FOR THE NEXT LEG UP! 💥
Entry: 362.00–363.00 ⚡
Target: 365.00, 367.50, 370.41 🚀
Stop Loss: 360.83 ⚠️
Buyers just absorbed the sell pressure at the 361.00 to 362.00 demand pocket, flipping the local narrative right back in favor of the bulls. 📊 Volume is quietly building up as price tests the crucial 363.00 threshold for a clean breakout confirmation.
This is where impatient sellers get trapped and high-conviction momentum traders step in to front-run the liquidity cascade toward higher targets. 💡 Are you positioned for this continuation or waiting for a deeper retest? 👇
⚠️ Not financial advice. Always manage your risk. 🛡️
🏷️ #AVGOB #LongSetup #Crypto #Breakout
🔥 💎
🚨 $AVGOB DEFENDING THE SUPPORT FLOOR AS BULLS RECLAIM MOMENTUM FOR THE NEXT LEG UP! 💥
Entry: 362.00–363.00 ⚡
Target: 365.00, 367.50, 370.41 🚀
Stop Loss: 360.83 ⚠️
Buyers just absorbed the sell pressure at the 361.00 to 362.00 demand pocket, flipping the local narrative right back in favor of the bulls. 📊 Volume is quietly building up as price tests the crucial 363.00 threshold for a clean breakout confirmation.
This is where impatient sellers get trapped and high-conviction momentum traders step in to front-run the liquidity cascade toward higher targets. 💡 Are you positioned for this continuation or waiting for a deeper retest? 👇
⚠️ Not financial advice. Always manage your risk. 🛡️
🏷️ #AVGOB #LongSetup #Crypto #Breakout
🔥 💎
Entry: 362.00–363.00 ⚡
Target: 365.00, 367.50, 370.41 🚀
Stop Loss: 360.83 ⚠️
Buyers just absorbed the sell pressure at the 361.00 to 362.00 demand pocket, flipping the local narrative right back in favor of the bulls. 📊 Volume is quietly building up as price tests the crucial 363.00 threshold for a clean breakout confirmation.
This is where impatient sellers get trapped and high-conviction momentum traders step in to front-run the liquidity cascade toward higher targets. 💡 Are you positioned for this continuation or waiting for a deeper retest? 👇
⚠️ Not financial advice. Always manage your risk. 🛡️
🏷️ #AVGOB #LongSetup #Crypto #Breakout
🔥 💎
$AVGOB: AVGOB: How Fast Rallies Can Trigger Informational Cascades
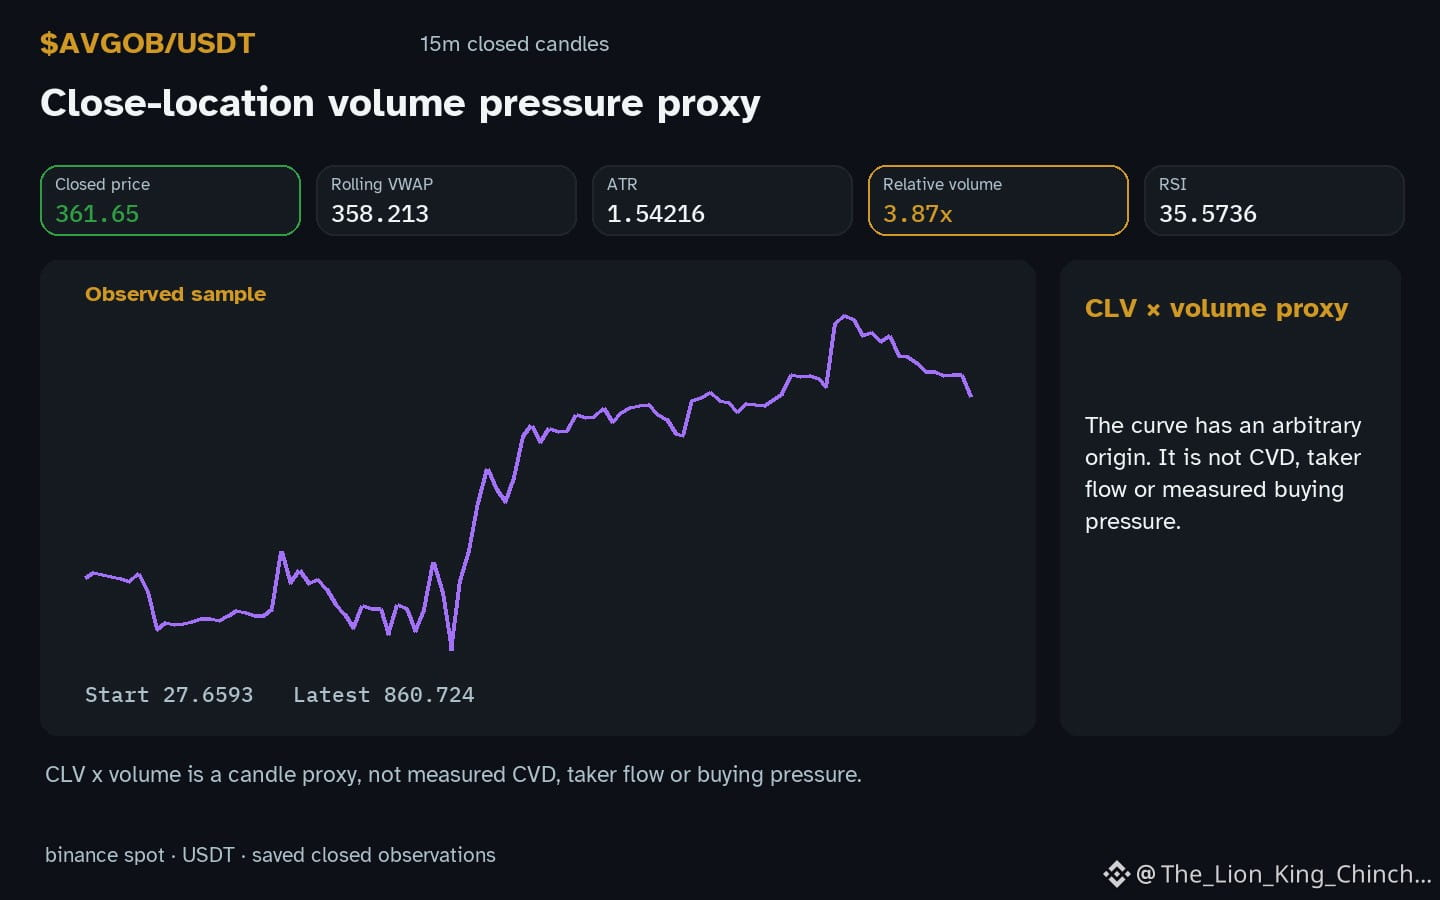
$AVGOB: AVGOB shows an hourly direction down while volume sits above baseline. Why might a rapid rally still lead to a cascade of buying despite the negative price move?
A common assumption is that price momentum alone drives trader attention. When a candle rises quickly, observers may anchor on the upward move and ignore the broader downtrend. This anchoring bias can create an informational cascade: each participant assumes the prior trader had a reason to buy, so they follow without independent analysis. The observation of relative volume 3.87x baseline supports the idea that many eyes are on the market, yet the direction remains down.
A counterexample to consider is a scenario where the same volume surge occurs during a clear downtrend and price continues falling. In that case, the cascade may be broken by loss aversion, as traders become reluctant to add to a losing position. The RSI 35.6 can serve as a signal of overextension, but it does not prove a cascade.
What could change the reading? A future closed hourly candle showing a sustained upward move with RSI moving into neutral territory would weaken the cascade hypothesis. Conversely, a sharp reversal back down with volume returning to baseline would suggest the rally was a brief attention spike rather than a true cascade.
Practical self‑check: before assuming a cascade, pause and ask whether you are reacting to the price move itself or to the perceived actions of others. Compare the current volume level to the baseline and note if the RSI is extreme. If both are high, consider stepping back and gathering independent evidence before adding to the position.
Probabilistic market research, not a recommendation or guaranteed return.
The comparison to keep in mind: $BTC has hourly direction down and volume not above its baseline; $BARD has hourly direction up and volume not above its baseline. This alone does not establish correlation.
#AVGOB #BTC
$AVGOB : AVGOB: How Fast Rallies Can Trigger Informational Cascades
$AVGOB : AVGOB shows an hourly direction down while volume sits above baseline. Why might a rapid rally still lead to a cascade of buying despite the negative price move?
A common assumption is that price momentum alone drives trader attention. When a candle rises quickly, observers may anchor on the upward move and ignore the broader downtrend. This anchoring bias can create an informational cascade: each participant assumes the prior trader had a reason to buy, so they follow without independent analysis. The observation of relative volume 3.87x baseline supports the idea that many eyes are on the market, yet the direction remains down.
A counterexample to consider is a scenario where the same volume surge occurs during a clear downtrend and price continues falling. In that case, the cascade may be broken by loss aversion, as traders become reluctant to add to a losing position. The RSI 35.6 can serve as a signal of overextension, but it does not prove a cascade.
What could change the reading? A future closed hourly candle showing a sustained upward move with RSI moving into neutral territory would weaken the cascade hypothesis. Conversely, a sharp reversal back down with volume returning to baseline would suggest the rally was a brief attention spike rather than a true cascade.
Practical self‑check: before assuming a cascade, pause and ask whether you are reacting to the price move itself or to the perceived actions of others. Compare the current volume level to the baseline and note if the RSI is extreme. If both are high, consider stepping back and gathering independent evidence before adding to the position.
Probabilistic market research, not a recommendation or guaranteed return.
The comparison to keep in mind: $BTC has hourly direction down and volume not above its baseline; $BARD has hourly direction up and volume not above its baseline. This alone does not establish correlation.
#AVGOB #BTC
$AVGOB : AVGOB shows an hourly direction down while volume sits above baseline. Why might a rapid rally still lead to a cascade of buying despite the negative price move?
A common assumption is that price momentum alone drives trader attention. When a candle rises quickly, observers may anchor on the upward move and ignore the broader downtrend. This anchoring bias can create an informational cascade: each participant assumes the prior trader had a reason to buy, so they follow without independent analysis. The observation of relative volume 3.87x baseline supports the idea that many eyes are on the market, yet the direction remains down.
A counterexample to consider is a scenario where the same volume surge occurs during a clear downtrend and price continues falling. In that case, the cascade may be broken by loss aversion, as traders become reluctant to add to a losing position. The RSI 35.6 can serve as a signal of overextension, but it does not prove a cascade.
What could change the reading? A future closed hourly candle showing a sustained upward move with RSI moving into neutral territory would weaken the cascade hypothesis. Conversely, a sharp reversal back down with volume returning to baseline would suggest the rally was a brief attention spike rather than a true cascade.
Practical self‑check: before assuming a cascade, pause and ask whether you are reacting to the price move itself or to the perceived actions of others. Compare the current volume level to the baseline and note if the RSI is extreme. If both are high, consider stepping back and gathering independent evidence before adding to the position.
Probabilistic market research, not a recommendation or guaranteed return.
The comparison to keep in mind: $BTC has hourly direction down and volume not above its baseline; $BARD has hourly direction up and volume not above its baseline. This alone does not establish correlation.
#AVGOB #BTC
31
·
--
Broadcom bStock Holds Steady Amid Chip Cycle Calm 🌐
Price action – $AVGOB is trading at $363.18 on Binance Spot (AVGOB/USDT), up 3.27 % over the past 24 hours.
Why it matters – Broadcom remains a bellwether in semiconductor infrastructure as data‑center and networking demand steadies, keeping investor focus on its stock.
Key levels – Immediate resistance sits near $368.00, with a stronger ceiling around $375.00. Mid‑range bias is at $370.00, acting as a potential swing point. The nearest support cluster is at $360.00, followed by a deeper floor near $352.00, which held during the last pullback.
Outlook – Neutral. The bStock is likely to consolidate within the $360‑$375 range until a decisive break confirms a new direction. Traders should monitor volume spikes for breakout cues.
#AVGOB #Broadcom #BinanceSquare
Broadcom bStock Holds Steady Amid Chip Cycle Calm 🌐
Price action – $AVGOB is trading at $363.18 on Binance Spot (AVGOB/USDT), up 3.27 % over the past 24 hours.
Why it matters – Broadcom remains a bellwether in semiconductor infrastructure as data‑center and networking demand steadies, keeping investor focus on its stock.
Key levels – Immediate resistance sits near $368.00, with a stronger ceiling around $375.00. Mid‑range bias is at $370.00, acting as a potential swing point. The nearest support cluster is at $360.00, followed by a deeper floor near $352.00, which held during the last pullback.
Outlook – Neutral. The bStock is likely to consolidate within the $360‑$375 range until a decisive break confirms a new direction. Traders should monitor volume spikes for breakout cues.
#AVGOB #Broadcom #BinanceSquare
Price action – $AVGOB is trading at $363.18 on Binance Spot (AVGOB/USDT), up 3.27 % over the past 24 hours.
Why it matters – Broadcom remains a bellwether in semiconductor infrastructure as data‑center and networking demand steadies, keeping investor focus on its stock.
Key levels – Immediate resistance sits near $368.00, with a stronger ceiling around $375.00. Mid‑range bias is at $370.00, acting as a potential swing point. The nearest support cluster is at $360.00, followed by a deeper floor near $352.00, which held during the last pullback.
Outlook – Neutral. The bStock is likely to consolidate within the $360‑$375 range until a decisive break confirms a new direction. Traders should monitor volume spikes for breakout cues.
#AVGOB #Broadcom #BinanceSquare
26

·
--
$HUMA +3.52% | $AVGOB +3.45% | $MEGA +3.35%
#HUMA slipped to $0.00793, up +3.52% on $3.5 M volume. Its PayFi network claim hints at niche demand, though adoption remains unproven.
#AVGOB rose to $364.61, up +3.45% with $3.8 M traded. The modest bump follows a steady‑state price range, suggesting a quiet accumulation.
#MEGA climbed to $0.0454, up +3.35% on $4.2 M volume. The rise is modest but the volume edge may signal growing interest among low‑cap traders.
Watch the volume‑price relationship for MEGA; a sustained lift could precede a broader move.
#Write2Earn #Binance
$HUMA +3.52% | $AVGOB +3.45% | $MEGA +3.35%
#HUMA slipped to $0.00793, up +3.52% on $3.5 M volume. Its PayFi network claim hints at niche demand, though adoption remains unproven.
#AVGOB rose to $364.61, up +3.45% with $3.8 M traded. The modest bump follows a steady‑state price range, suggesting a quiet accumulation.
#MEGA climbed to $0.0454, up +3.35% on $4.2 M volume. The rise is modest but the volume edge may signal growing interest among low‑cap traders.
Watch the volume‑price relationship for MEGA; a sustained lift could precede a broader move.
#Write2Earn #Binance
#HUMA slipped to $0.00793, up +3.52% on $3.5 M volume. Its PayFi network claim hints at niche demand, though adoption remains unproven.
#AVGOB rose to $364.61, up +3.45% with $3.8 M traded. The modest bump follows a steady‑state price range, suggesting a quiet accumulation.
#MEGA climbed to $0.0454, up +3.35% on $4.2 M volume. The rise is modest but the volume edge may signal growing interest among low‑cap traders.
Watch the volume‑price relationship for MEGA; a sustained lift could precede a broader move.
#Write2Earn #Binance
7
·
--
$AVGOB +4.37% | $SOXSB +4.21% | $ONE +4.12%
#AVGOB nudged up to $362.93, gaining 4.37% on $4.4 M of volume. The modest boost suggests some buying interest but the dollar‑scale price could temper broader appeal.
#SOXSB rose to $46.51, up 4.21% with a relatively hefty $17.9 M of turnover. The strong volume may be supporting the move, hinting at a short‑term momentum play.
#ONE ticked higher to $0.00156800, climbing 4.12% on $13.1 M of activity. Despite the tiny price, the solid volume shows traders are paying attention.
Watch for any shift in volume patterns; a sudden drop could reveal whether these gains are sustainable.
#Write2Earn #Binance
$AVGOB +4.37% | $SOXSB +4.21% | $ONE +4.12%
#AVGOB nudged up to $362.93, gaining 4.37% on $4.4 M of volume. The modest boost suggests some buying interest but the dollar‑scale price could temper broader appeal.
#SOXSB rose to $46.51, up 4.21% with a relatively hefty $17.9 M of turnover. The strong volume may be supporting the move, hinting at a short‑term momentum play.
#ONE ticked higher to $0.00156800, climbing 4.12% on $13.1 M of activity. Despite the tiny price, the solid volume shows traders are paying attention.
Watch for any shift in volume patterns; a sudden drop could reveal whether these gains are sustainable.
#Write2Earn #Binance
#AVGOB nudged up to $362.93, gaining 4.37% on $4.4 M of volume. The modest boost suggests some buying interest but the dollar‑scale price could temper broader appeal.
#SOXSB rose to $46.51, up 4.21% with a relatively hefty $17.9 M of turnover. The strong volume may be supporting the move, hinting at a short‑term momentum play.
#ONE ticked higher to $0.00156800, climbing 4.12% on $13.1 M of activity. Despite the tiny price, the solid volume shows traders are paying attention.
Watch for any shift in volume patterns; a sudden drop could reveal whether these gains are sustainable.
#Write2Earn #Binance
8
·
--
$AVGOB +2.73% | $GOOGLB +2.61% | $RNDR +2.58%
#AVGOB nudged up to $364.35, gaining +2.73% on $4.4 M of trade. The modest volume suggests a steady, if limited, interest.
#GOOGLB rose to $300.84, up +2.61% with a solid $22.7 M flowing through. That heavier turnover could give it a bit more momentum than its peers.
#RNDR slipped slightly higher to $7.03, marking +2.58% on $1.6 M volume. The lower trade size hints at a quieter market for the token.
📈 Keep an eye on GOOGLB’s volume edge; if it stays ahead, the price may keep its upward bias.
#Write2Earn #Binance
$AVGOB +2.73% | $GOOGLB +2.61% | $RNDR +2.58%
#AVGOB nudged up to $364.35, gaining +2.73% on $4.4 M of trade. The modest volume suggests a steady, if limited, interest.
#GOOGLB rose to $300.84, up +2.61% with a solid $22.7 M flowing through. That heavier turnover could give it a bit more momentum than its peers.
#RNDR slipped slightly higher to $7.03, marking +2.58% on $1.6 M volume. The lower trade size hints at a quieter market for the token.
📈 Keep an eye on GOOGLB’s volume edge; if it stays ahead, the price may keep its upward bias.
#Write2Earn #Binance
#AVGOB nudged up to $364.35, gaining +2.73% on $4.4 M of trade. The modest volume suggests a steady, if limited, interest.
#GOOGLB rose to $300.84, up +2.61% with a solid $22.7 M flowing through. That heavier turnover could give it a bit more momentum than its peers.
#RNDR slipped slightly higher to $7.03, marking +2.58% on $1.6 M volume. The lower trade size hints at a quieter market for the token.
📈 Keep an eye on GOOGLB’s volume edge; if it stays ahead, the price may keep its upward bias.
#Write2Earn #Binance
·
--
$AVGOB +3.32% | $TOMO +3.22% | $BEB +3.10%
#AVGOB trades at $356.06, up +3.32% on $3.2 M of volume. The modest rise hints at renewed buying pressure after a quiet session.
#TOMO is priced at $1.38, gaining +3.22% with $1.1 M traded. Activity remains low‑key, but the upward tick suggests some short‑term optimism.
#BEB sits at $206.58, climbing +3.10% on $3.0 M of volume. The price move is supported by a solid turnover, which could help sustain momentum.
📈 Watch whether the parallel volume lifts across these assets translate into broader stability or if they fizzle out quickly.
#Write2Earn #Binance
$AVGOB +3.32% | $TOMO +3.22% | $BEB +3.10%
#AVGOB trades at $356.06, up +3.32% on $3.2 M of volume. The modest rise hints at renewed buying pressure after a quiet session.
#TOMO is priced at $1.38, gaining +3.22% with $1.1 M traded. Activity remains low‑key, but the upward tick suggests some short‑term optimism.
#BEB sits at $206.58, climbing +3.10% on $3.0 M of volume. The price move is supported by a solid turnover, which could help sustain momentum.
📈 Watch whether the parallel volume lifts across these assets translate into broader stability or if they fizzle out quickly.
#Write2Earn #Binance
#AVGOB trades at $356.06, up +3.32% on $3.2 M of volume. The modest rise hints at renewed buying pressure after a quiet session.
#TOMO is priced at $1.38, gaining +3.22% with $1.1 M traded. Activity remains low‑key, but the upward tick suggests some short‑term optimism.
#BEB sits at $206.58, climbing +3.10% on $3.0 M of volume. The price move is supported by a solid turnover, which could help sustain momentum.
📈 Watch whether the parallel volume lifts across these assets translate into broader stability or if they fizzle out quickly.
#Write2Earn #Binance
·
--
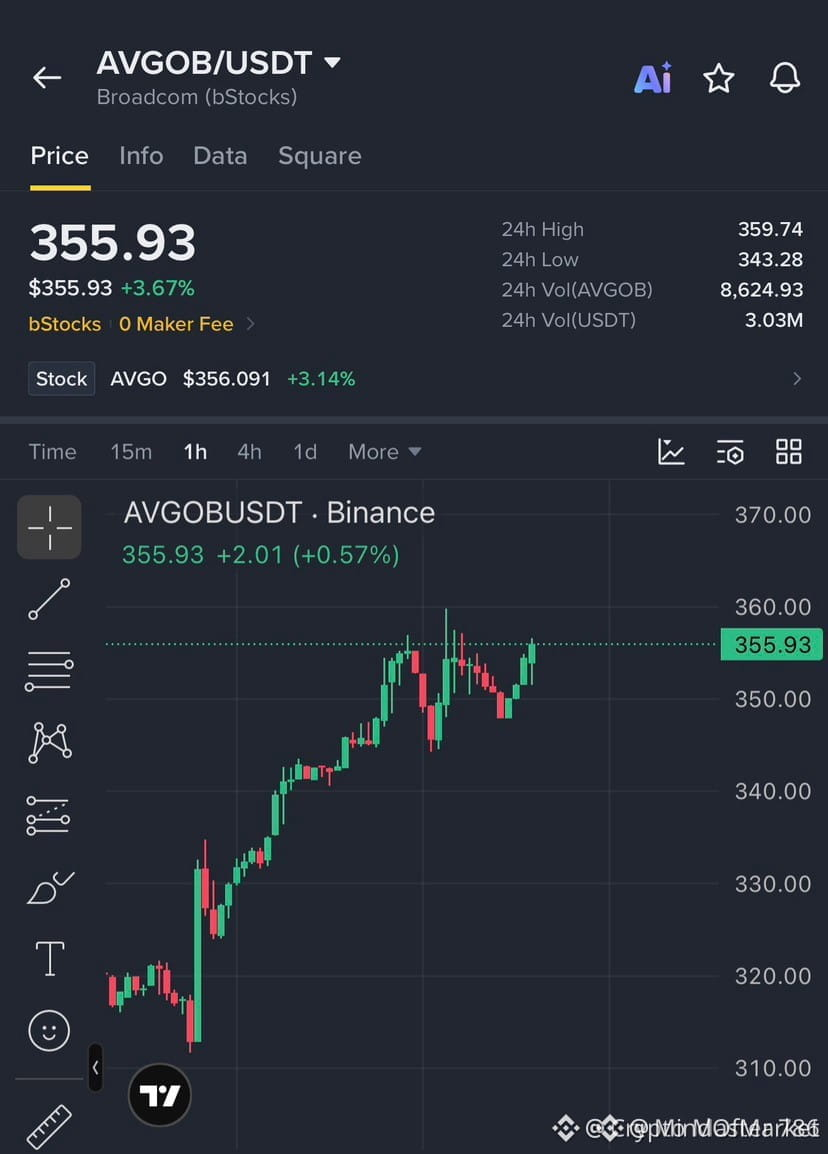
🦈 $AVGOB RECLAIMING THE 350 HANDLE AS SMART MONEY DEFENDS THE HOURLY SUPPORT ZONE ⚡
Entry: 350.00 ⚡
Target: 355.93 / 359.74 / 370.00 🚀
Stop Loss: 345.00 ⚠️
Price action has swept local liquidity pools before aggressively recovering above the 350 threshold, signaling heavy institutional accumulation at key structural demand zones 💡. Order flow dynamics across lower timeframes support this continuation thesis as passive sell-side liquidity gets systematically cleared out by aggressive buyers 📊.
💬 Are you positioning directly for the hourly retest confirmation or waiting for a structural shift before committing risk? 👇
⚠️ Not financial advice. Always manage your risk. 🛡️
🏷️ #AVGOB #SmartMoney #PriceAction #Crypto
🔥 💎
🦈 $AVGOB RECLAIMING THE 350 HANDLE AS SMART MONEY DEFENDS THE HOURLY SUPPORT ZONE ⚡
Entry: 350.00 ⚡
Target: 355.93 / 359.74 / 370.00 🚀
Stop Loss: 345.00 ⚠️
Price action has swept local liquidity pools before aggressively recovering above the 350 threshold, signaling heavy institutional accumulation at key structural demand zones 💡. Order flow dynamics across lower timeframes support this continuation thesis as passive sell-side liquidity gets systematically cleared out by aggressive buyers 📊.
💬 Are you positioning directly for the hourly retest confirmation or waiting for a structural shift before committing risk? 👇
⚠️ Not financial advice. Always manage your risk. 🛡️
🏷️ #AVGOB #SmartMoney #PriceAction #Crypto
🔥 💎
Entry: 350.00 ⚡
Target: 355.93 / 359.74 / 370.00 🚀
Stop Loss: 345.00 ⚠️
Price action has swept local liquidity pools before aggressively recovering above the 350 threshold, signaling heavy institutional accumulation at key structural demand zones 💡. Order flow dynamics across lower timeframes support this continuation thesis as passive sell-side liquidity gets systematically cleared out by aggressive buyers 📊.
💬 Are you positioning directly for the hourly retest confirmation or waiting for a structural shift before committing risk? 👇
⚠️ Not financial advice. Always manage your risk. 🛡️
🏷️ #AVGOB #SmartMoney #PriceAction #Crypto
🔥 💎

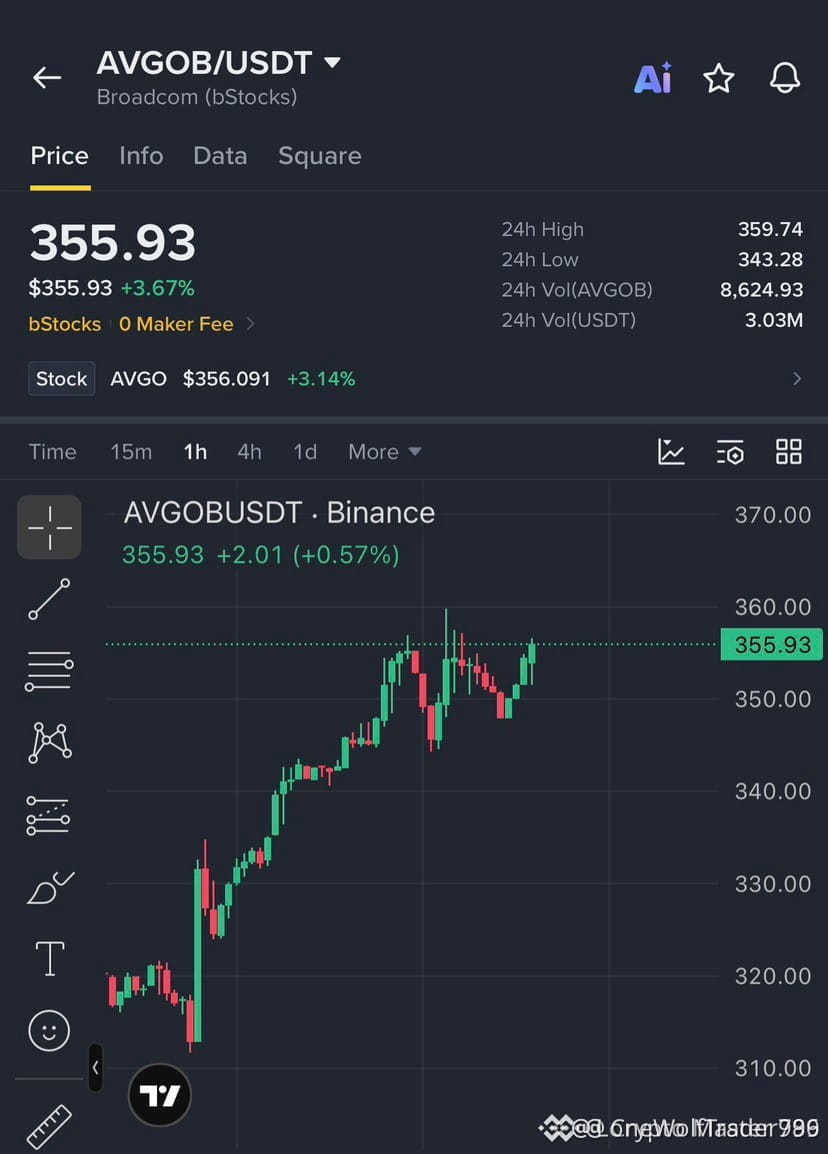
🚨 $AVGOB RECLAIMS KEY PSYCHOLOGICAL LEVEL AS BUYERS DEFEND THE DIP 💥
Entry: 350.00 ⚡
Target: 355.93 / 359.74 / 370.00 🚀
Stop Loss: 345.00 ⚠️
Bulls are flexing their muscles after a sharp flush, dragging $AVGOB cleanly back above the crucial 350 handle. 📊 Order flow shows aggressive spot absorption on every hourly pullback, signaling that smart money refuses to let lower prices stick. ⚡
Patience is key for a confirmed hourly retest to validate structural continuation toward our laddered upside targets. 💡 Are you entering on the initial touch of support or waiting for confirmation candles to close? 👇
⚠️ Not financial advice. Always manage your risk. 🛡️
🏷️ #AVGOB #LongSetup #Breakout #Crypto
🔥 💎
🚨 $AVGOB RECLAIMS KEY PSYCHOLOGICAL LEVEL AS BUYERS DEFEND THE DIP 💥
Entry: 350.00 ⚡
Target: 355.93 / 359.74 / 370.00 🚀
Stop Loss: 345.00 ⚠️
Bulls are flexing their muscles after a sharp flush, dragging $AVGOB cleanly back above the crucial 350 handle. 📊 Order flow shows aggressive spot absorption on every hourly pullback, signaling that smart money refuses to let lower prices stick. ⚡
Patience is key for a confirmed hourly retest to validate structural continuation toward our laddered upside targets. 💡 Are you entering on the initial touch of support or waiting for confirmation candles to close? 👇
⚠️ Not financial advice. Always manage your risk. 🛡️
🏷️ #AVGOB #LongSetup #Breakout #Crypto
🔥 💎
Entry: 350.00 ⚡
Target: 355.93 / 359.74 / 370.00 🚀
Stop Loss: 345.00 ⚠️
Bulls are flexing their muscles after a sharp flush, dragging $AVGOB cleanly back above the crucial 350 handle. 📊 Order flow shows aggressive spot absorption on every hourly pullback, signaling that smart money refuses to let lower prices stick. ⚡
Patience is key for a confirmed hourly retest to validate structural continuation toward our laddered upside targets. 💡 Are you entering on the initial touch of support or waiting for confirmation candles to close? 👇
⚠️ Not financial advice. Always manage your risk. 🛡️
🏷️ #AVGOB #LongSetup #Breakout #Crypto
🔥 💎
Log in to explore more content
Join global crypto users on Binance Square
⚡️ Get latest and useful information about crypto.
💬 Trusted by the world’s largest crypto exchange.
👍 Discover real insights from verified creators.
Email / Phone number
Trending Topics
1
#CanBTCReboundAfterFallingBelow60K?
176,142 views
851 Discussing
2
#GlobalStocksFaceLongestLosingStreakSince2023
69,948 views
708 Discussing
3
#AnthropicPlungesTowardIPOPriceonDay2
29,862 views
341 Discussing
4
#CFTCStaffInvestigatedTrumpMemeCoinThenBackedOff
0 views
17 Discussing
5
#BNBDropsBelow540USDTWith8.46%DailyDecline
4,707 views
96 Discussing
6
#HKBillProposesHK$100KFineForUnauthorizedCryptoTitles
32 views
7 Discussing
7
#BitMineFaces$10.1BUnrealizedETHLoss
165 views
11 Discussing
8
#StrategyReports$35BNetReserves
95 views
9 Discussing
9
#MorganStanleyEndsAnthropicStockSupportAfterOneDay
2,569 views
64 Discussing
10
#CryptoBilisAttackerMoves25000ETHToTornadoCash
4,021 views
60 Discussing