

#analisiskripto
analisiskripto
2,957 views
21 Discussing
Hot
Latest

🌳 $FOREST : Surging +217% — Strong Bullish Momentum Emerges!
📊 Key Data
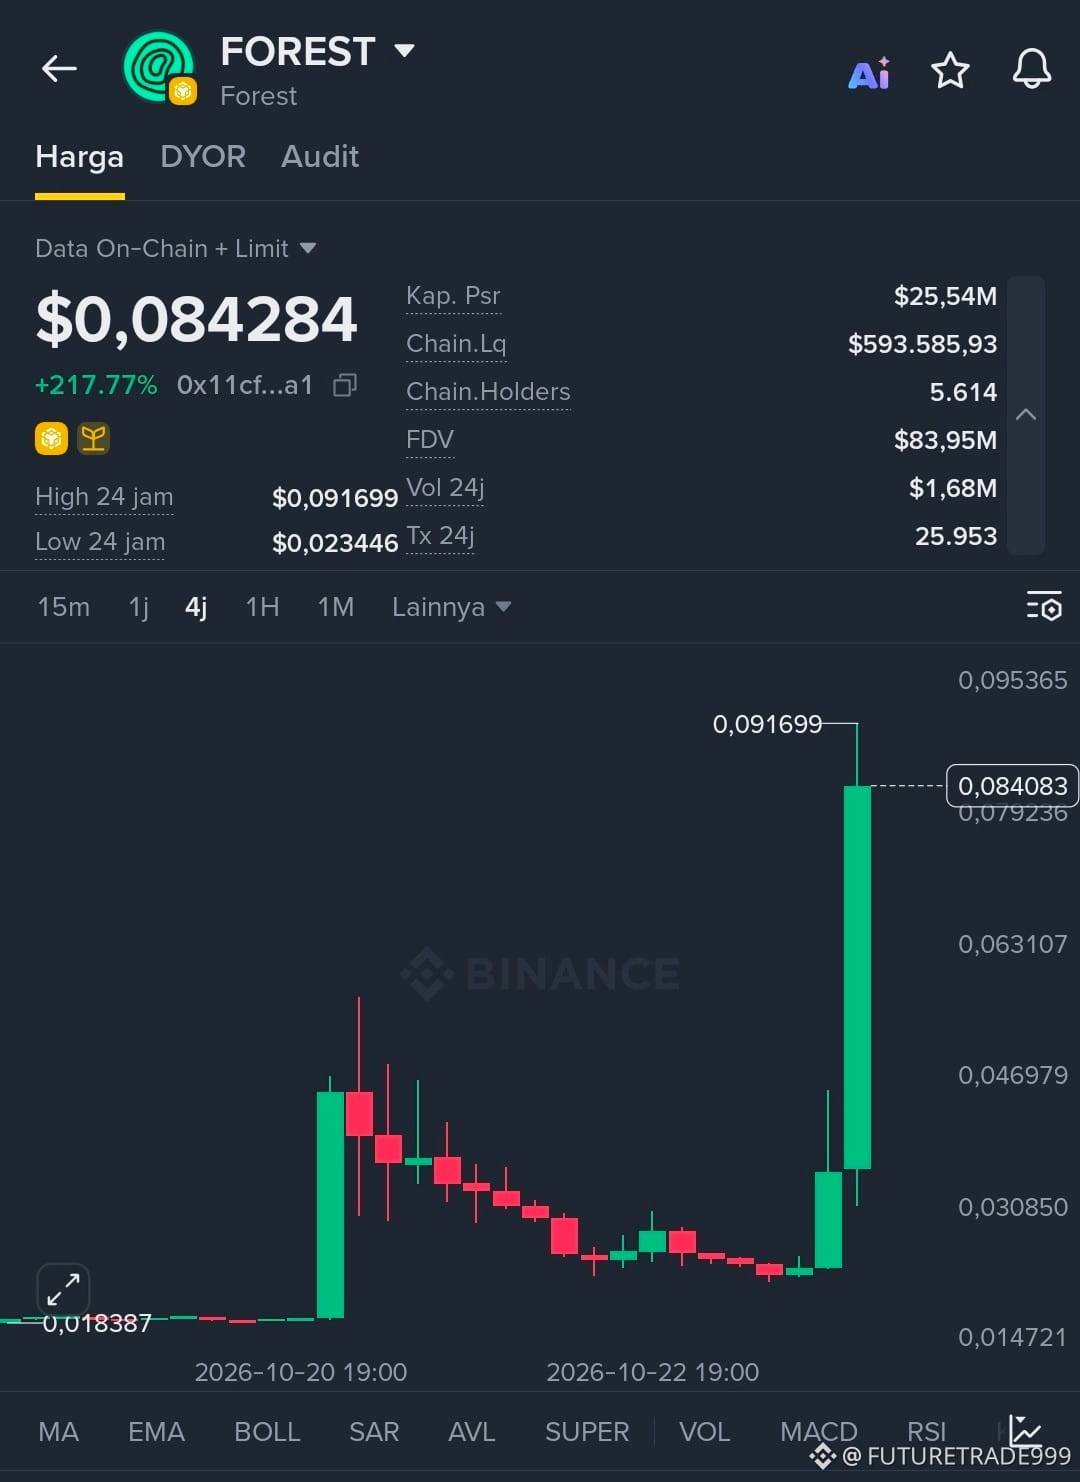
- Current Price: $0.084284 | +217.77% in 24 hours 🚀
- 24h High: $0.091699 | 24h Low: $0.023446
- Market Cap: $25.54M | FDV: $83.95M
- 24h Volume: $1.68M — a significant surge in buyer activity
📈 Price Movement Analysis
- ✅ Extreme Bounce: Price surged from a low of $0.018387 to a peak of $0.091699 — more than 4x in a very short time
- ✅ Massive Green Candle: A long candlestick formed, signaling strongly dominant buying pressure
- ⚠️ Slightly Down from the Peak: Price is now slightly below the daily high of $0.091699 → consolidation/profit-taking after a sharp surge is normal
- ⚠️ Nearest Resistance: $0.091699 is the main hurdle right now — if it breaks through, the rally could continue
🎯 Key Levels & Strategy
Price Position Description
⏳ WAIT FOR A PULLBACK — Price has already risen significantly — don't FOMO in at a high price
✅ Safer Entry Zone $0.05500 – $0.06500 Wait for a 30–40% correction from the peak for lower risk
🎯 Target 1 $0.09170 24h high — nearest resistance
🎯 Target 2 $0.10000 Next psychological level
🛑 Stop-Loss $0.04500 Below the nearest support area
💡 Key Takeaways
- ✅ Buying momentum is very strong, with the rise accompanied by increasing volume
- ✅ Market cap is still relatively small → there may still be room for growth
- ⚠️ A gain of over 200% in a day = extreme volatility; a correction could happen at any time
- ⚠️ DON'T CHASE THE PRICE AT THE TOP — there will always be another opportunity. Better to be late than get caught at the peak
⚠️ Risk Warning: This is not financial advice. Small-cap coins that surge dramatically carry a high risk of a rapid decline. Only use funds you can afford to lose. DYOR — Do your own research!
🏷️ Hashtags & Cashtags
#FOREST #MomentumBullish #Altcoins! #KoinPotensial #AnalisisKripto
$FOREST $USDT
1
43

WILL IT GO UP 10X? 🚀🔥 TODAY’S ANALYSIS OF NEAR & NEARLY TOKENS!
Many people are wondering whether this ecosystem has the potential for an extreme bullish run and could surge 10x in the near future. Let’s briefly and clearly break down the facts! 👇
🌐 Getting to Know the Main Ecosystem: NEAR Protocol (NEAR)
• Strong Fundamentals: NEAR Protocol is a leading Layer-1 blockchain that uses Nightshade sharding technology. It’s super fast, affordable, and one of the key foundations for Web3 projects and artificial intelligence (AI) technology today.
• Primary Fuel: The NEAR coin serves as the main asset for transaction fees (gas fees), staking, and securing the entire ecosystem network.
⚡ Community/Ecosystem Token: NEARLY
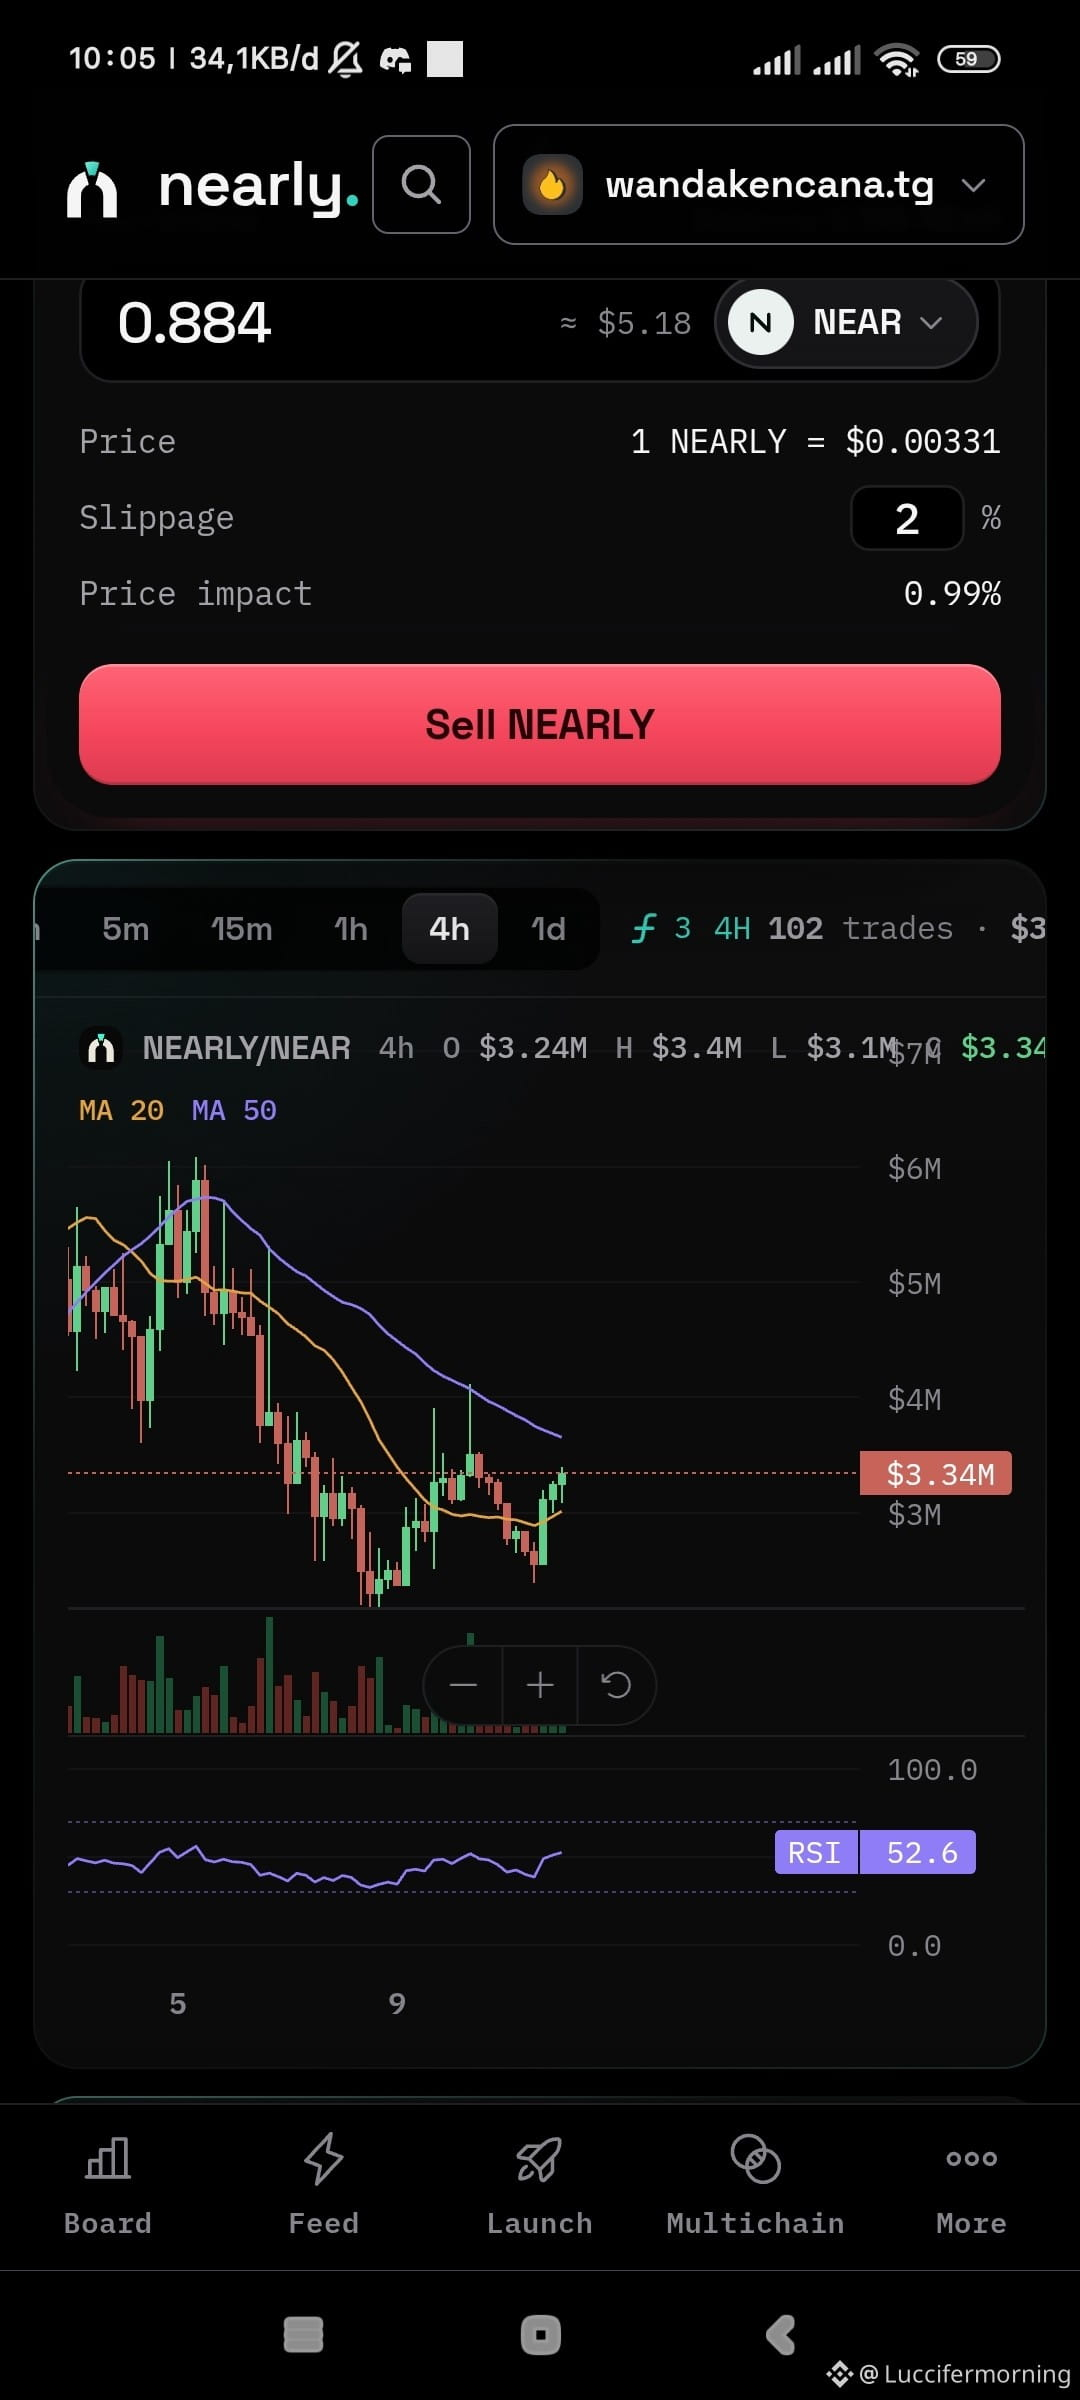
• Current Market Conditions: According to the latest dApp market data, 1 NEARLY is priced at around $0.00331, with a healthy liquidity ratio (very low Price Impact of under 1% for retail trades).
• Technical Chart Analysis (4-Hour): The NEARLY token appears to be building a strong support base in the $3M–$3.34M market cap range after correcting from its peak.
• RSI Indicator: At 52.6 (Neutral Zone). This means selling pressure in the market is starting to fade and buying strength is gradually stabilizing, while the market awaits a potential reversal.
💡 Conclusion: Could It Go Up 10x?
With NEARLY’s price near the support floor, combined with the global adoption of its parent coin NEAR, the potential for a massive price surge is wide open when momentum in the crypto market picks up again. However, always remember to manage your trading risk!
What about you, loyal holders? Are you getting ready to buy in this support zone, or choosing to wait and see? Let us know in the comments! 💸👇
#CryptoIndonesia #NEARProtocol #NearlyToken #CryptoTrading #Web3 #PromisingAltcoins #AnalisisKripto $NEAR $RHEA
142

Why are so many eyes on $SUI while the market is correcting? 👀
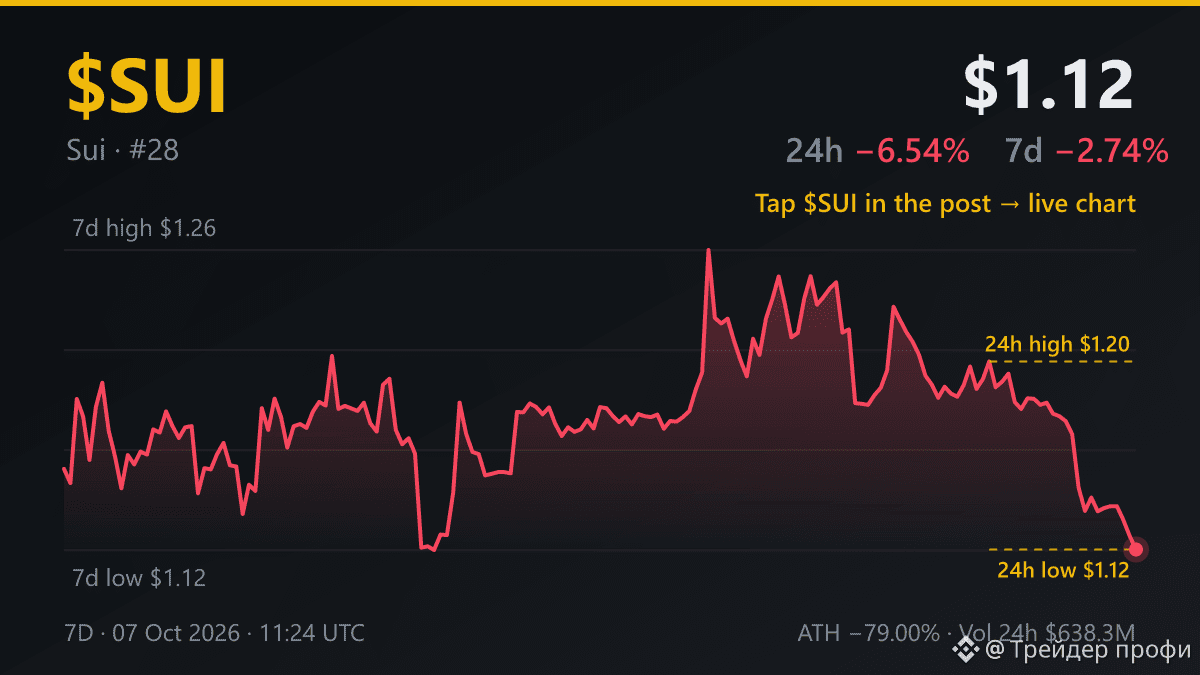
The global crypto market cap has shrunk by 5.45% over the past 24 hours. Amid this situation, $SUI has made the trending assets list despite its price correcting by 6.08%. 📉
Skepticism is essential here. Trending doesn’t guarantee that the price will soon reverse direction; it signals high trading activity and liquidity.
Watch the live chart for $SUI to see whether the current support level can hold. 📊
Do you think this correction is normal, or is it a sign of further declines?
Not financial advice. DYOR.
#SUI #KriptoIndonesia #CryptoAnalysis
558

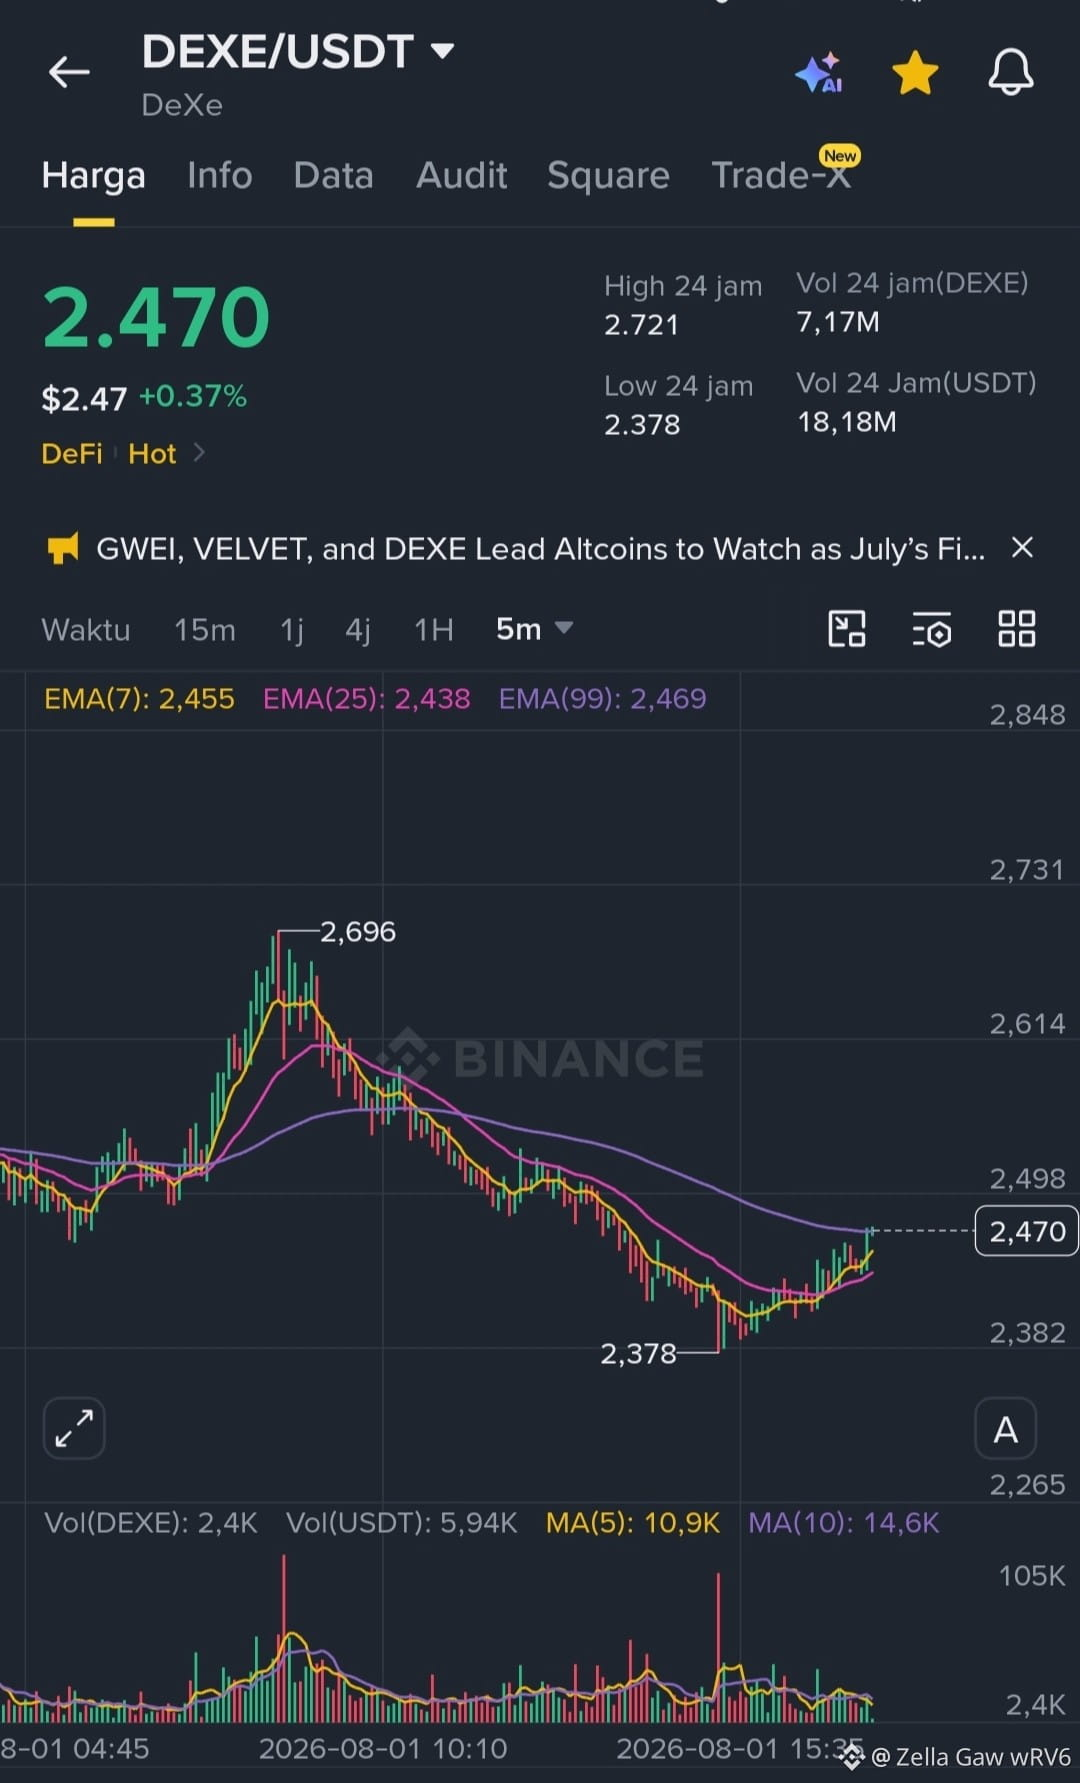
At the moment, the price of $DEXE is at $2,470, after previously touching the 24-hour low at $2,378 and the high at $2,721.
From the 5-minute timeframe chart, we can see an interesting signal:
✅ The current price is moving above the EMA 7 ($2,455) and EMA 25 ($2,438) — a sign that selling pressure is starting to ease
✅ It is trying to break through the EMA 99 at $2,469 as the first recovery hurdle
✅ Trading volume is beginning to pick back up after a sharp drop previously
✅ The buy order ratio reached 68.65%, indicating that accumulation interest is starting to increase
In the short term, if it manages to break through and hold above $2.47–2.48, the next target is to retest the $2.60 range upward. Conversely, if it gets rejected, strong support is at the $2.38 area.
Keep in mind, this asset is still in a recovery phase from a long decline, so manage risk well, okay. In your opinion, is $DEXE already ready to continue rising, or does it still need more consolidation?
#DEXE #AnalisisKripto #DeFi #BinanceSquare
405
$SOL
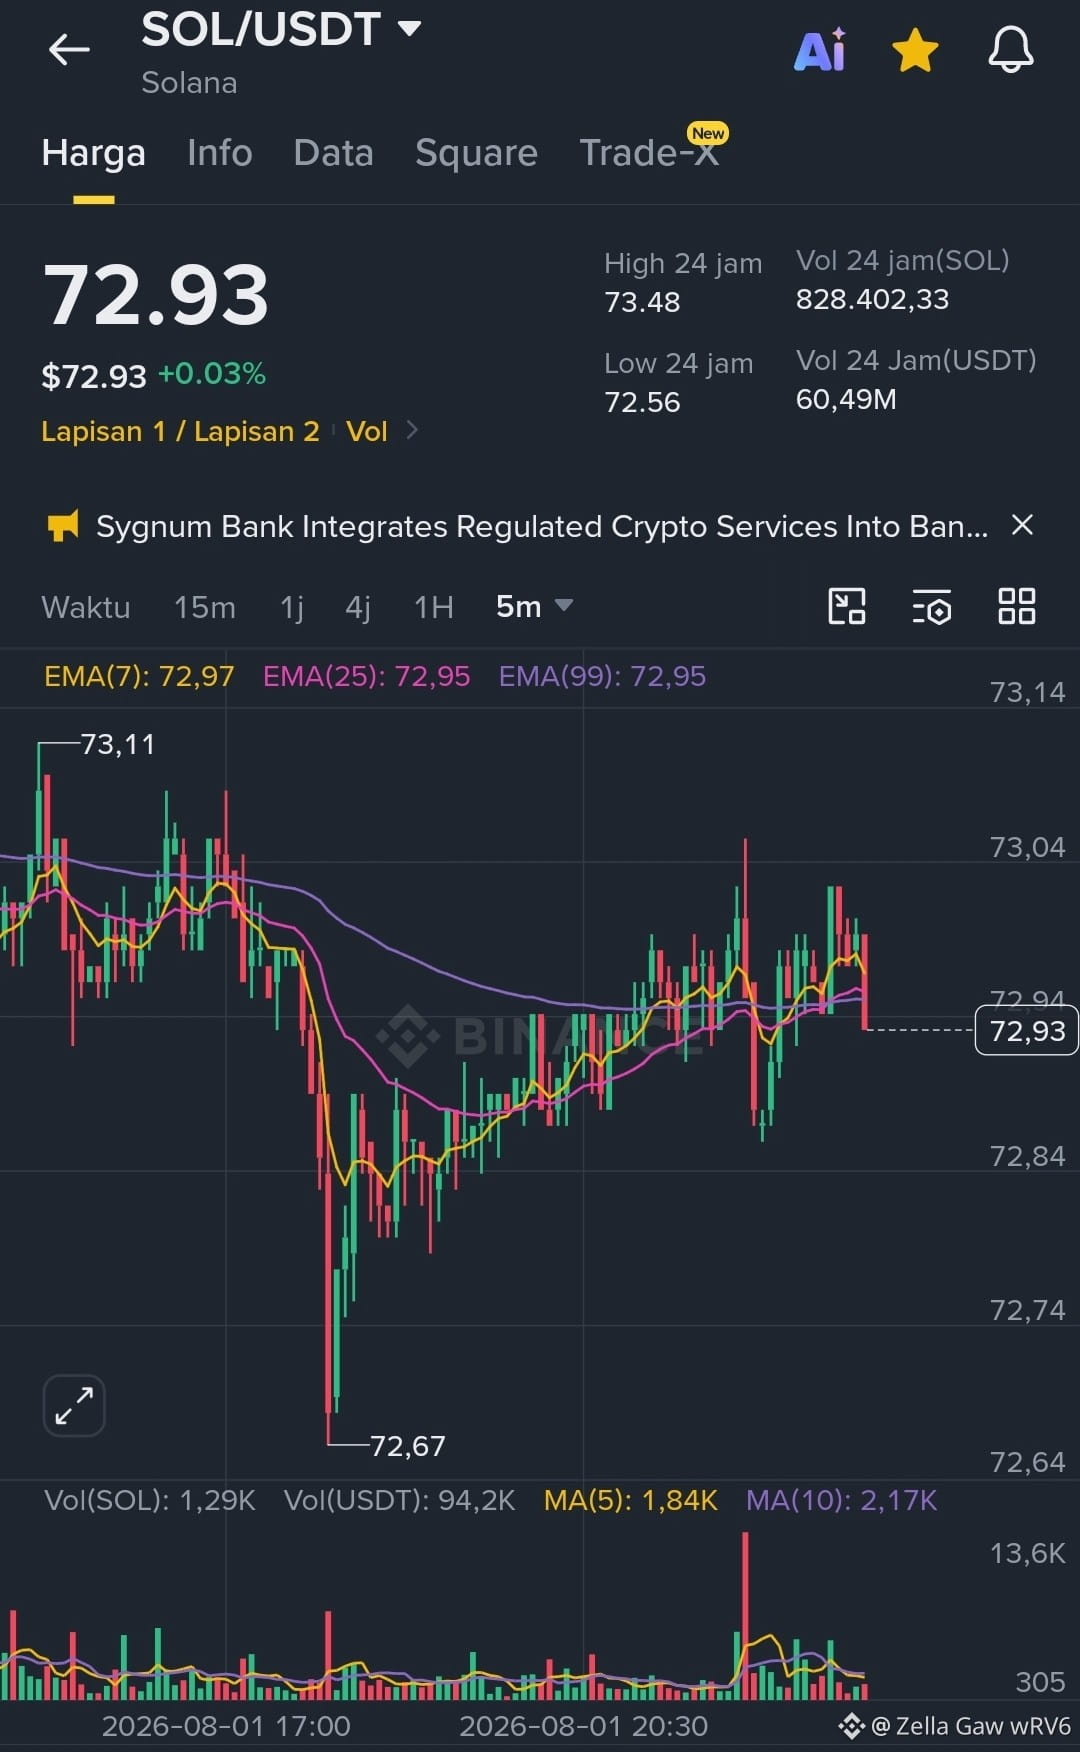
✨The current price of $SOL is $72.93, and there’s something really interesting in the chart:👇
🔹 EMA7, EMA25, up to EMA99 are almost meeting at one point! This means the market is fiercely debating which direction to take
🔹 In the last 24 hours, it’s been moving very narrowly: between $72.56 and $73.48—no big move yet
🔹 Just bounced off the lowest point at $72.67, but there hasn’t been a strong buying push visible yet
📌 So, what do you think will happen next?
✅ If it manages to break above $73.00: will it immediately fly to $73.50?
❌ Or will it get stuck and reverse to test support again at $72.60?
Personally, I’m still waiting for confirmation before taking action. Are you on the bullish team expecting a rise or the cautious team watching for a drop? Share your thoughts in the comments! 👇
#SOL #Solana #AnalisisKripto
{spot}(SOLUSDT)
{spot}(BNBUSDT)
{spot}(BTCUSDT)
$SOL
✨The current price of $SOL is $72.93, and there’s something really interesting in the chart:👇
🔹 EMA7, EMA25, up to EMA99 are almost meeting at one point! This means the market is fiercely debating which direction to take
🔹 In the last 24 hours, it’s been moving very narrowly: between $72.56 and $73.48—no big move yet
🔹 Just bounced off the lowest point at $72.67, but there hasn’t been a strong buying push visible yet
📌 So, what do you think will happen next?
✅ If it manages to break above $73.00: will it immediately fly to $73.50?
❌ Or will it get stuck and reverse to test support again at $72.60?
Personally, I’m still waiting for confirmation before taking action. Are you on the bullish team expecting a rise or the cautious team watching for a drop? Share your thoughts in the comments! 👇
#SOL #Solana #AnalisisKripto
317
·
--
Bullish
🚀 $APR (aPriori): Strong Bounce +49% from the Bottom — Recovery Signal Begins!
📊 Key Data
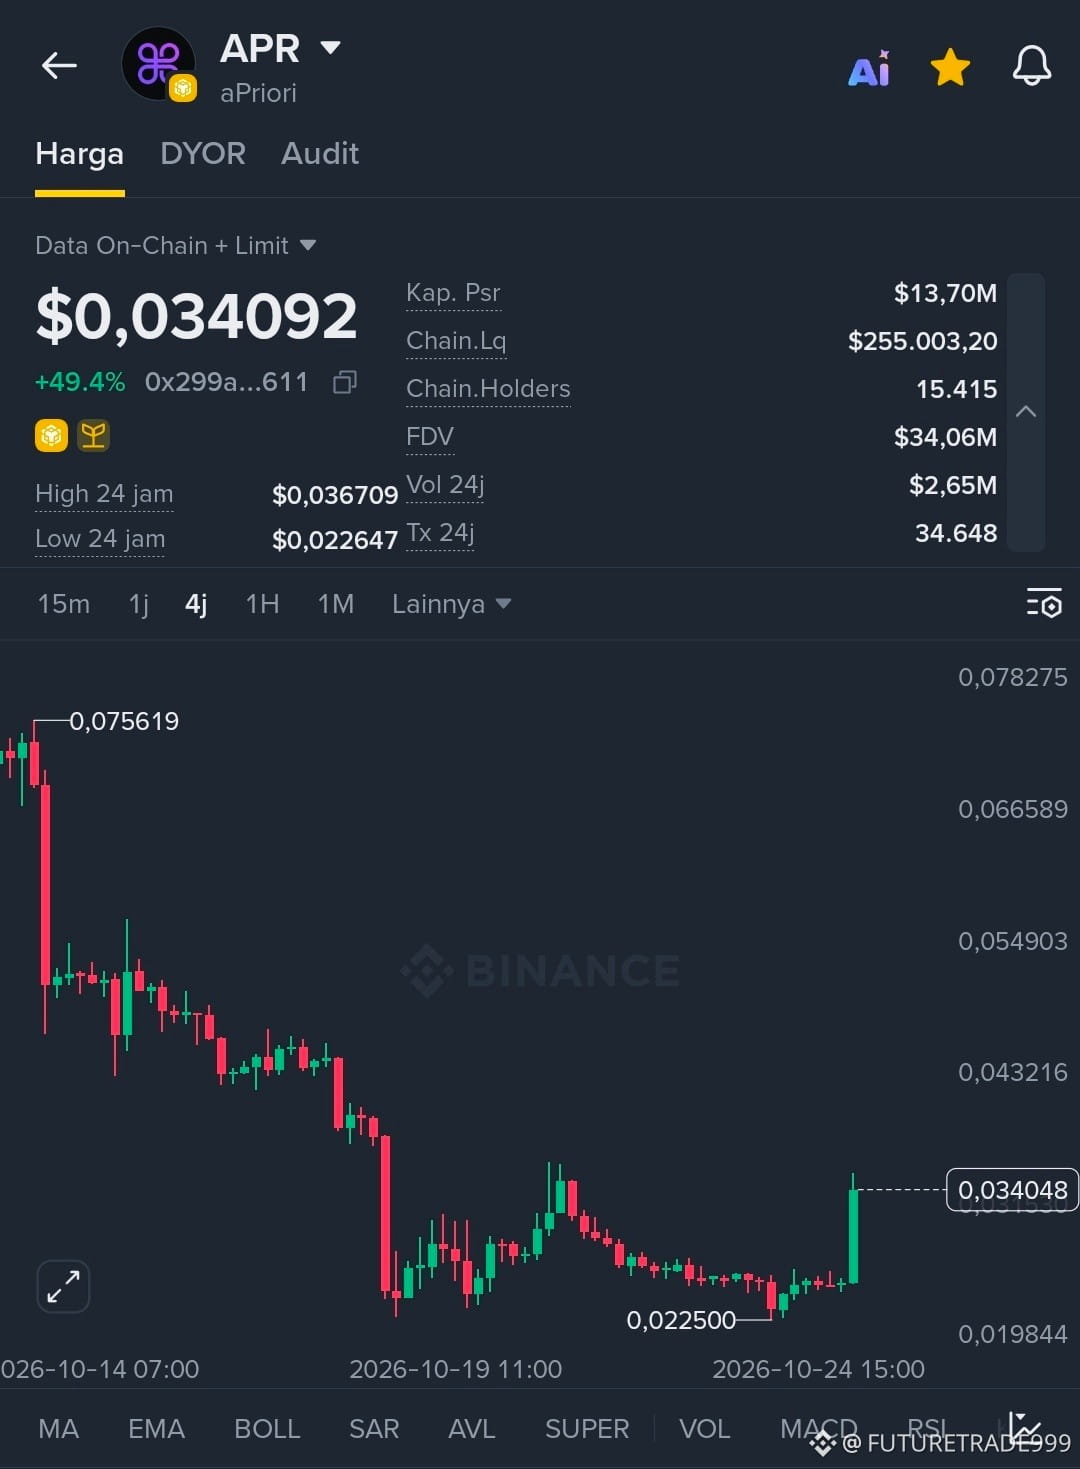
- Current Price: $0.034092 | +49.4% in 24 hours ✅
- 24-Hour High: $0.036709 | 24-Hour Low: $0.022647
- Market Cap: $13.70M | FDV: $34.06M
- 24-Hour Volume: $2.65M — significant increase = buyer interest is returning
📈 Price Movement Analysis
- ✅ Strong Bounce: Price rebounded sharply from the short-term bottom of $0.022500 to $0.0340 = up around +51% in a short time
- ✅ Forming a Higher Low: After a prolonged downtrend, the price has finally stopped falling and started rising = selling pressure has run out
- ⚠️ Nearest Resistance: $0.0367 is the first hurdle — if it breaks through, the rally could continue to $0.0430
- ⚠️ Still Far from the Peak: It is still down more than 55% from the peak of $0.0756 — this is just the early recovery phase, not yet a full uptrend
🎯 Key Levels & Strategy
Price Position Notes
⏳ Safe Entry Zone $0.02900 – $0.03100 Wait for a 30–40% pullback from the daily peak
✅ Aggressive Entry $0.03300 – $0.03400 Current price — keep the position small
🎯 Target 1 $0.03670 24-hour high — nearest resistance
🎯 Target 2 $0.04300 Previous consolidation zone
🛑 Stop-Loss $0.02250 Below the latest bottom — safety limit
💡 Key Points
- ✅ The bounce is accompanied by rising volume = accumulation is taking place
- ✅ The bottom is higher than the previous one = a positive sign
- ⚠️ This is the first significant rise after a prolonged decline — it doesn't necessarily mean the trend has fully reversed
- ⚠️ Don't FOMO — wait for confirmation of a resistance breakout or a safe pullback
⚠️ Risk Warning: This is not financial advice. Coins that have just recovered from a prolonged decline are high-risk if resistance is not broken. Only use funds you can afford to lose, always set a stop-loss, and DYOR!
#APR #aPriori #PemulihanPasar #PantulanHarga #AnalisisKripto
$APR $USDT
1
136
·
--
Bullish
⚡ $LIGHT (Bitlight Labs): Strong Uptrend Forming — +26% in 24 Hours!
📊 Key Data
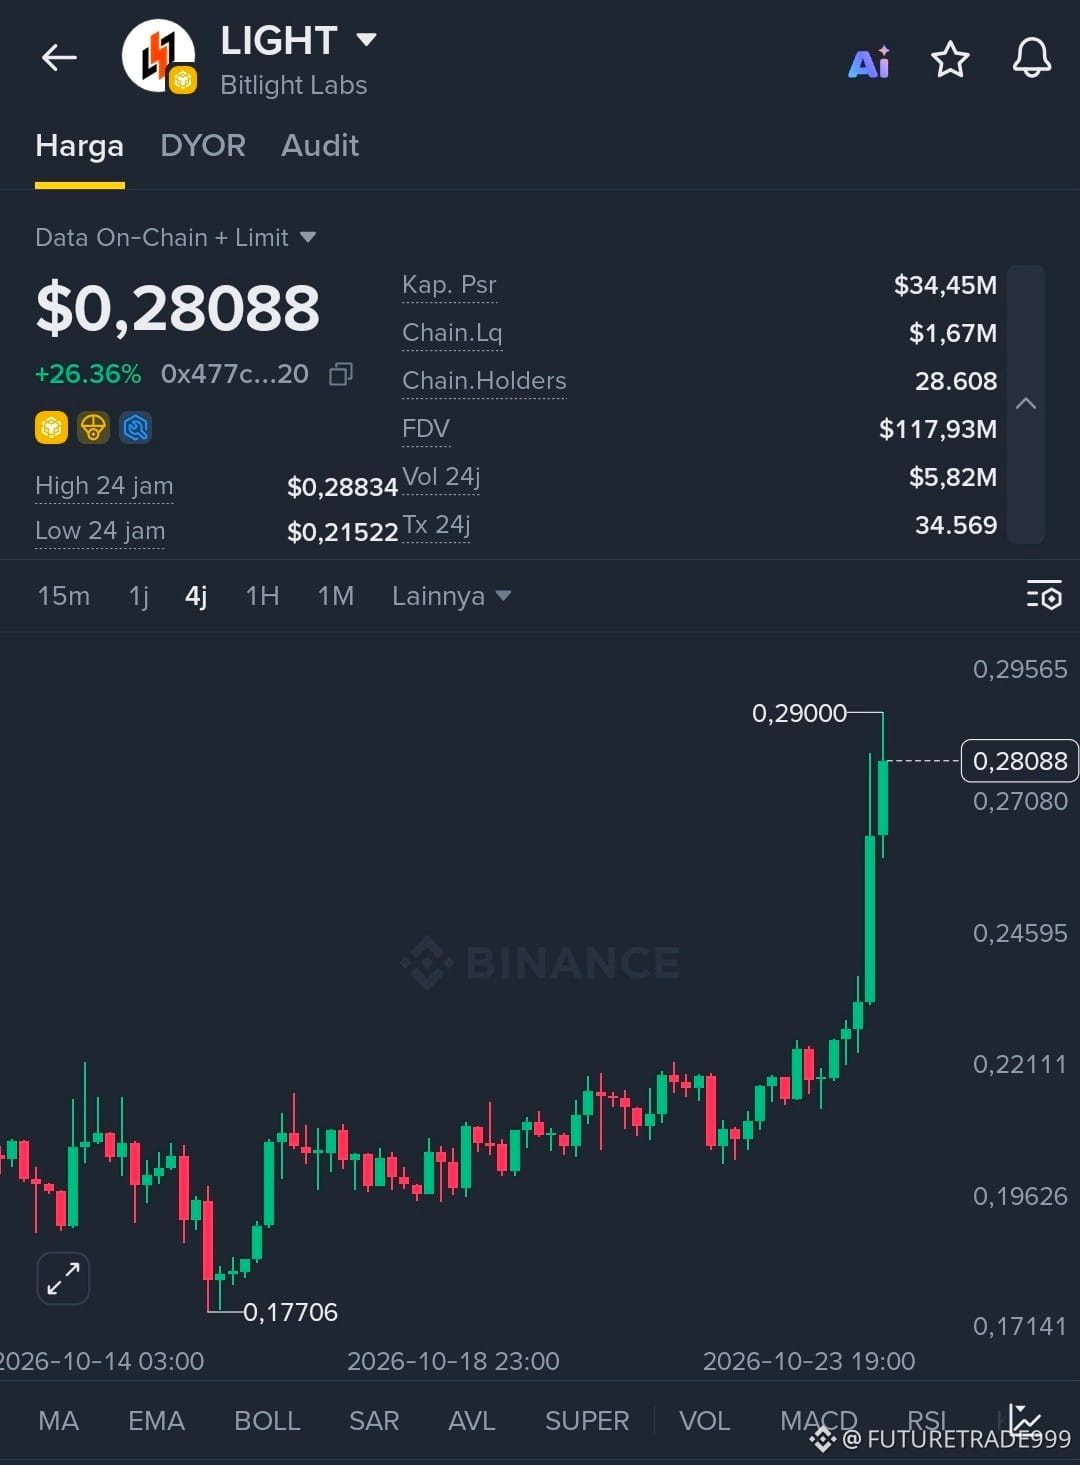
- Current Price: $0,28088 | +26.36% in 24 hours ✅
- 24-hour High: $0,28834 | 24-hour Low: $0,21522
- Market Cap: $34,45M | FDV: $117,93M
- 24-hour Volume: $5,82M — significant increase = genuine buyer interest
📈 Price Action Analysis
- ✅ Higher Highs & Higher Lows: Price continues to form increasingly higher peaks and lows = confirmed bullish trend
- ✅ Steady Recovery: From a low of $0,17706 to $0,28088 = up ~58% in around 10 days — a gradual, healthy move
- ⚠️ Approaching Resistance: Current price is near the daily high of $0,28834 → consolidation/pullback before a move higher would be normal
- ✅ No Extreme Spike: A measured rise = more sustainable than an instant pump that quickly crashes
🎯 Key Levels & Strategy
Price Position Notes
⏳ Safer Entry Zone $0,25000 – $0,26500 Wait for a slight pullback for lower risk
✅ Aggressive Entry $0,27500 – $0,28000 Current price — use a small position & tight SL
🎯 Target 1 $0,29000 Nearby high — take partial profits
🎯 Target 2 $0,32000 Next psychological level if resistance is broken
🛑 Stop-Loss $0,24000 Below the nearest support — safety limit
💡 Important Notes
- ✅ A clear uptrend is visible, with measured price action and no excessive FOMO
- ✅ Mid-range market cap → potential remains, but volatility is contained
- ⚠️ Already up +26% in a day → don't chase the price at its high; it's better to wait for a pullback
- ⚠️ Always set a Stop-Loss — the trend can change at any time
⚠️ Risk Warning: This is not financial advice. Crypto is high-risk. Prices can fall as quickly as they rise. Only use funds you can afford to lose. DYOR — Do your own research before entering!
#LIGHT #BitlightLabs #TrenBullish #Altcoin #AnalisisKripto
$LIGHT $USDT
{future}(LIGHTUSDT)
Keep it up and may the profits keep coming ⚡🚀😊
⚡ $LIGHT (Bitlight Labs): Strong Uptrend Forming — +26% in 24 Hours!
📊 Key Data
- Current Price: $0,28088 | +26.36% in 24 hours ✅
- 24-hour High: $0,28834 | 24-hour Low: $0,21522
- Market Cap: $34,45M | FDV: $117,93M
- 24-hour Volume: $5,82M — significant increase = genuine buyer interest
📈 Price Action Analysis
- ✅ Higher Highs & Higher Lows: Price continues to form increasingly higher peaks and lows = confirmed bullish trend
- ✅ Steady Recovery: From a low of $0,17706 to $0,28088 = up ~58% in around 10 days — a gradual, healthy move
- ⚠️ Approaching Resistance: Current price is near the daily high of $0,28834 → consolidation/pullback before a move higher would be normal
- ✅ No Extreme Spike: A measured rise = more sustainable than an instant pump that quickly crashes
🎯 Key Levels & Strategy
Price Position Notes
⏳ Safer Entry Zone $0,25000 – $0,26500 Wait for a slight pullback for lower risk
✅ Aggressive Entry $0,27500 – $0,28000 Current price — use a small position & tight SL
🎯 Target 1 $0,29000 Nearby high — take partial profits
🎯 Target 2 $0,32000 Next psychological level if resistance is broken
🛑 Stop-Loss $0,24000 Below the nearest support — safety limit
💡 Important Notes
- ✅ A clear uptrend is visible, with measured price action and no excessive FOMO
- ✅ Mid-range market cap → potential remains, but volatility is contained
- ⚠️ Already up +26% in a day → don't chase the price at its high; it's better to wait for a pullback
- ⚠️ Always set a Stop-Loss — the trend can change at any time
⚠️ Risk Warning: This is not financial advice. Crypto is high-risk. Prices can fall as quickly as they rise. Only use funds you can afford to lose. DYOR — Do your own research before entering!
#LIGHT #BitlightLabs #TrenBullish #Altcoin #AnalisisKripto
$LIGHT $USDT
Keep it up and may the profits keep coming ⚡🚀😊
1
284

·
--
Bullish
Brief Analysis of SOL/USDT: Solana Starts to "Breathe" Again!
After experiencing downward pressure (bearish), Solana (SOL) is currently showing signs of short-term recovery. Here are the key points:
1. Current Price Condition
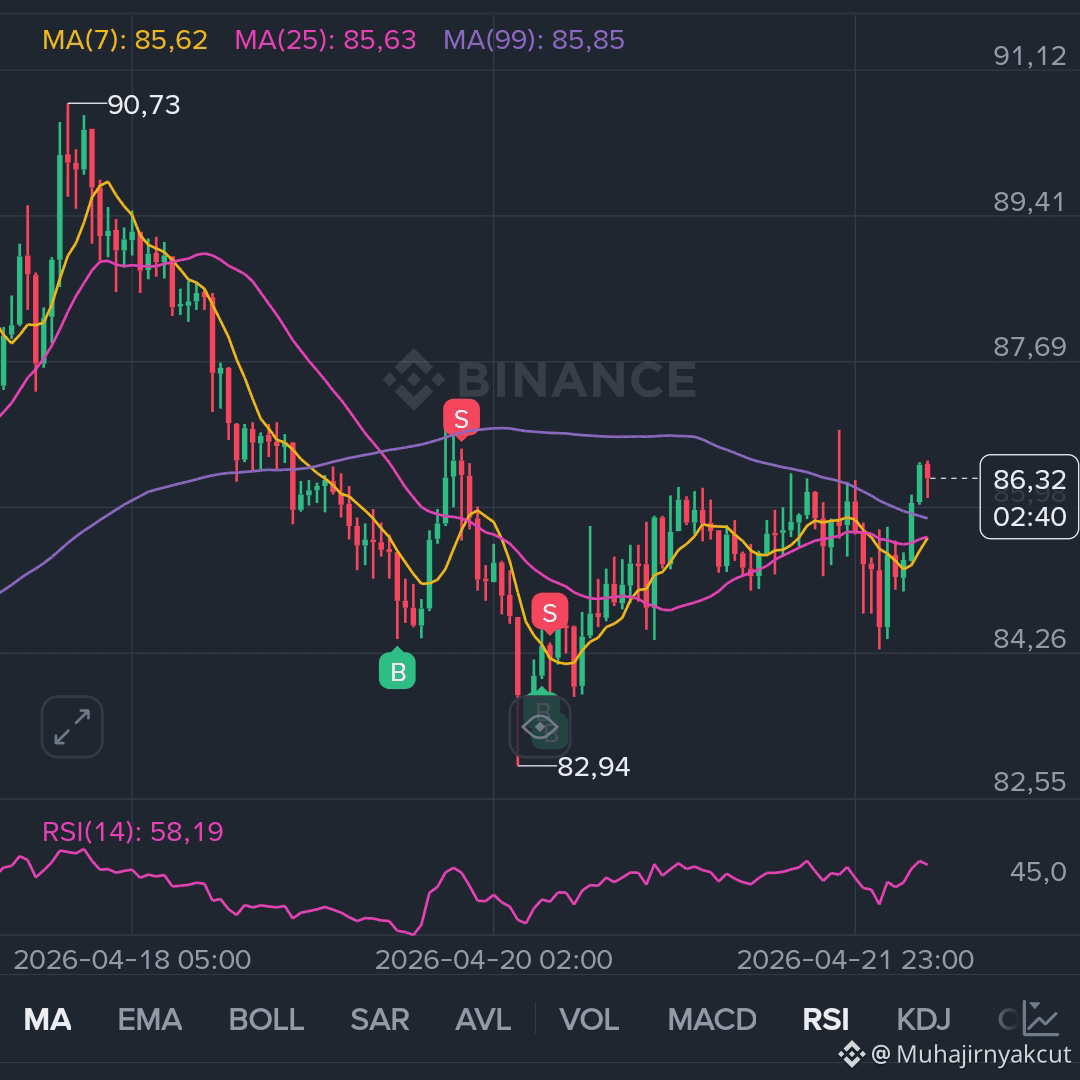
• Price: Around 86.32 USDT.
• Trend: Trying to break out of the consolidation zone (sideways) after hitting a low around 82.94.
2. Technical Indicators
• Moving Average (MA): The current price is above the yellow line (MA7) and the pink line (MA25). This is a positive signal that there is buying momentum in the short term.
• RSI (14): At 58.19. This means the upward momentum is still healthy and not in the "overbought" zone. There is still room to rise again!
• Order Book: The buy side (Bid) appears more dominant (59.57%) compared to the sell side (Ask). Buyers are more aggressive at this time.
3. Next Direction?
• Bullish Scenario (Up): If the price can hold above 86.00, the nearest target is to test the area of 88.00 to 90.00.
• Bearish Scenario (Down): If it fails to hold, it may retest the strong support at around 84.00.
Solana is currently in a recovery phase. As long as it doesn't break below 84 USDT, the chance to continue rising to the area of 90 USDT is still wide open! 🚀
Disclaimer: This is a technical analysis, not financial advice. Always use disposable income and do your own research (DYOR)!
#Solana #SOL #cryptouniverseofficial #tradingview $BNB
{spot}(BNBUSDT)
$SOL
{spot}(SOLUSDT)
#AnalisisKripto
Brief Analysis of SOL/USDT: Solana Starts to "Breathe" Again!
After experiencing downward pressure (bearish), Solana (SOL) is currently showing signs of short-term recovery. Here are the key points:
1. Current Price Condition
• Price: Around 86.32 USDT.
• Trend: Trying to break out of the consolidation zone (sideways) after hitting a low around 82.94.
2. Technical Indicators
• Moving Average (MA): The current price is above the yellow line (MA7) and the pink line (MA25). This is a positive signal that there is buying momentum in the short term.
• RSI (14): At 58.19. This means the upward momentum is still healthy and not in the "overbought" zone. There is still room to rise again!
• Order Book: The buy side (Bid) appears more dominant (59.57%) compared to the sell side (Ask). Buyers are more aggressive at this time.
3. Next Direction?
• Bullish Scenario (Up): If the price can hold above 86.00, the nearest target is to test the area of 88.00 to 90.00.
• Bearish Scenario (Down): If it fails to hold, it may retest the strong support at around 84.00.
Solana is currently in a recovery phase. As long as it doesn't break below 84 USDT, the chance to continue rising to the area of 90 USDT is still wide open! 🚀
Disclaimer: This is a technical analysis, not financial advice. Always use disposable income and do your own research (DYOR)!
#Solana #SOL #cryptouniverseofficial #tradingview $BNB
$SOL
#AnalisisKripto
1
107
Log in to explore more content
Join global crypto users on Binance Square
⚡️ Get latest and useful information about crypto.
💬 Trusted by the world’s largest crypto exchange.
👍 Discover real insights from verified creators.
Email / Phone number
Trending Topics
1
#BinancePick
3.3M views
160,753 Discussing
2
#EarningsSeason
5.4M views
26,482 Discussing
3
#StrategySkipsBitcoinPurchasesSpends$205MOnSTRCBuybacks
6 views
4 Discussing
4
#BitmineAdds10452ETH
3,338 views
84 Discussing
5
#SouthKoreaConsidersEducationTaxOnCryptoExchanges
3,139 views
87 Discussing
6
#OCCUrgesCommunityBanksToEnterStablecoinPayments
2,335 views
57 Discussing
7
#RippleWinsFullApprovalAsNationalTrustBank
2,020 views
54 Discussing
8
#AkashSelectsSolanaAsMigrationTarget
1,037 views
18 Discussing
9
#OndoToOpenSubscriptionsForOpenAIPreIPOTokenizedNotes
83 views
6 Discussing
10
#AnthropicTTMRevenueGrewAbout1200%
50,110 views
532 Discussing