
#afterthepump
afterthepump
730 views
4 Discussing
Hot
Latest

·
--
After the Pump: how it works, plus the live scorecard.
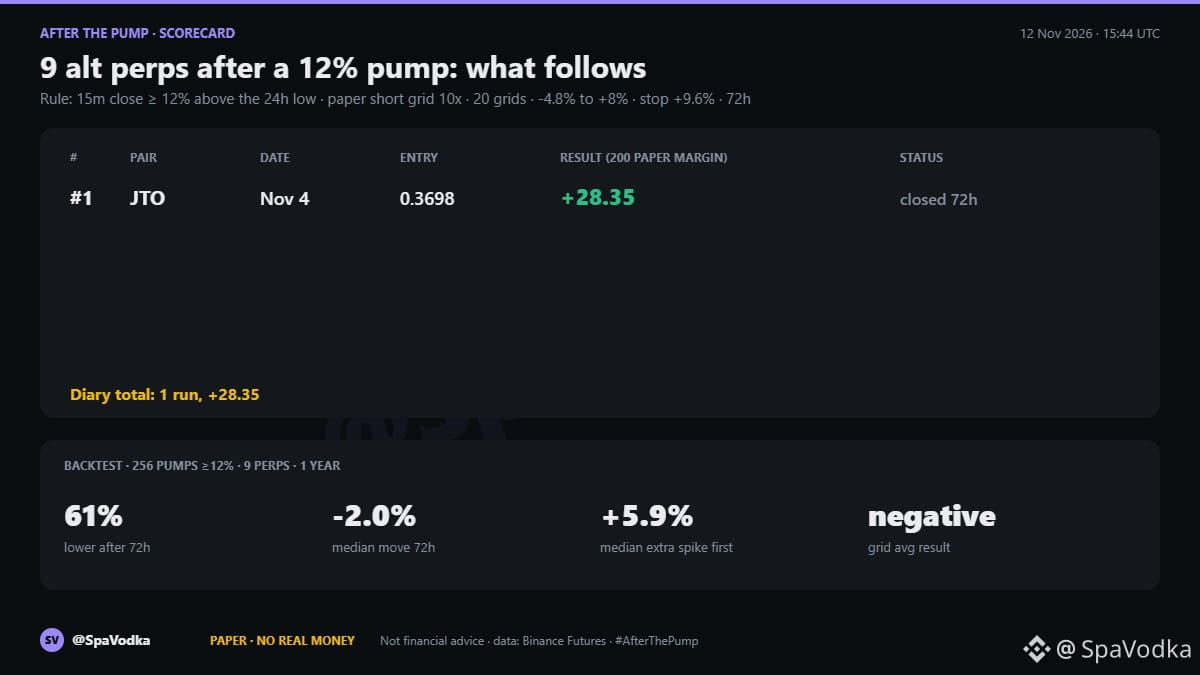
When one of 9 perps I track (JTO, SOL, JUP, WIF, BONK, DRIFT, TNSR, RENDER, ONDO) closes a 15m candle 12% or more above its 24h low, I post the scenario: what usually follows, odds for two levels, and the exact paper bot I run on it.
My paper bot: short grid, 10x, 20 grids, range from 4.8% below to 8% above entry, stop 9.6% above entry, auto-close after 72h. Paper, no real money.
Honest baseline from my backtest of 256 such pumps over a year: 61% traded lower 72h later, and the grid wins 55 to 74% of runs. But its average result is negative, because a stop-out eats most of the margin.
Scorecard so far: #1 $JTO on Nov 4, +28.35 on 200 paper margin, 34 trades.
Every run gets a result comment after 72h, wins and losses. All posts live under the tag below.
Not financial advice. Would you fade a 12% pump or ride it?
#AfterThePump #papertrading #CryptoMarket
After the Pump: how it works, plus the live scorecard.
When one of 9 perps I track (JTO, SOL, JUP, WIF, BONK, DRIFT, TNSR, RENDER, ONDO) closes a 15m candle 12% or more above its 24h low, I post the scenario: what usually follows, odds for two levels, and the exact paper bot I run on it.
My paper bot: short grid, 10x, 20 grids, range from 4.8% below to 8% above entry, stop 9.6% above entry, auto-close after 72h. Paper, no real money.
Honest baseline from my backtest of 256 such pumps over a year: 61% traded lower 72h later, and the grid wins 55 to 74% of runs. But its average result is negative, because a stop-out eats most of the margin.
Scorecard so far: #1 $JTO on Nov 4, +28.35 on 200 paper margin, 34 trades.
Every run gets a result comment after 72h, wins and losses. All posts live under the tag below.
Not financial advice. Would you fade a 12% pump or ride it?
#AfterThePump #papertrading #CryptoMarket
When one of 9 perps I track (JTO, SOL, JUP, WIF, BONK, DRIFT, TNSR, RENDER, ONDO) closes a 15m candle 12% or more above its 24h low, I post the scenario: what usually follows, odds for two levels, and the exact paper bot I run on it.
My paper bot: short grid, 10x, 20 grids, range from 4.8% below to 8% above entry, stop 9.6% above entry, auto-close after 72h. Paper, no real money.
Honest baseline from my backtest of 256 such pumps over a year: 61% traded lower 72h later, and the grid wins 55 to 74% of runs. But its average result is negative, because a stop-out eats most of the margin.
Scorecard so far: #1 $JTO on Nov 4, +28.35 on 200 paper margin, 34 trades.
Every run gets a result comment after 72h, wins and losses. All posts live under the tag below.
Not financial advice. Would you fade a 12% pump or ride it?
#AfterThePump #papertrading #CryptoMarket
3
415

$IRYS
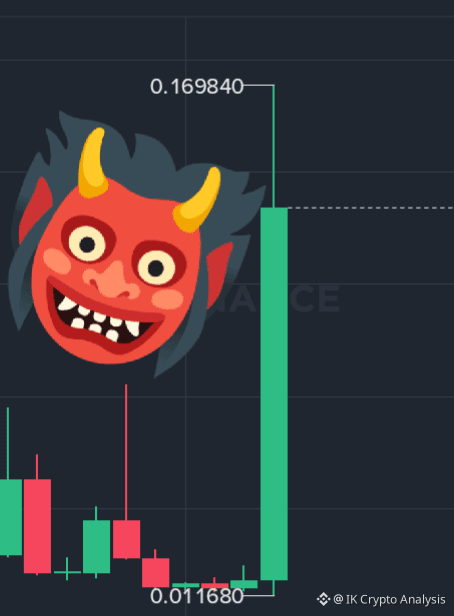
🚨🔥 IRYSUSDT AFTER THE MEGA PUMP — WHAT HAPPENS NEXT? 🚀
🤯 FROM $0.01168 TO $0.16984!
$IRYS has delivered an extraordinary move, and now traders are watching closely as price pulls back from its recent high. 📉📈
📊 LATEST MARKET SNAPSHOT
💰 Current Price: 0.13252 USDT
🚀 24H Change: +504.01%
🎯 Recent High: 0.16984 USDT
📈 24H Volume: 1.41 BILLION USDT
🐂 BULLISH SCENARIO
If buyers regain momentum and price breaks above 0.16984, a fresh breakout could follow.
🐻 BEARISH SCENARIO
After such a massive rally, profit-taking could continue. Watch how price reacts around 0.13000 and the 0.10800–0.11000 zone.
⚠️ THE SMART MOVE
✅ Don't chase a vertical candle.
✅ Wait for confirmation and volume.
✅ Protect your capital—especially in futures.
❌ No guaranteed targets. Volatility is extremely high.
🔥 $IRYS IS STILL UP MASSIVELY, BUT CAN THE BULLS RETURN?
🚀 New all-time momentum?
📉 Or a deeper correction first?
💬 Comment your view: BULLISH 🐂 or BEARISH 🐻?
#IRYSUSDT #IRYS #EarningsSeason #BinancePick
{future}(IRYSUSDT)
#AfterThePump
$IRYS
🚨🔥 IRYSUSDT AFTER THE MEGA PUMP — WHAT HAPPENS NEXT? 🚀
🤯 FROM $0.01168 TO $0.16984!
$IRYS has delivered an extraordinary move, and now traders are watching closely as price pulls back from its recent high. 📉📈
📊 LATEST MARKET SNAPSHOT
💰 Current Price: 0.13252 USDT
🚀 24H Change: +504.01%
🎯 Recent High: 0.16984 USDT
📈 24H Volume: 1.41 BILLION USDT
🐂 BULLISH SCENARIO
If buyers regain momentum and price breaks above 0.16984, a fresh breakout could follow.
🐻 BEARISH SCENARIO
After such a massive rally, profit-taking could continue. Watch how price reacts around 0.13000 and the 0.10800–0.11000 zone.
⚠️ THE SMART MOVE
✅ Don't chase a vertical candle.
✅ Wait for confirmation and volume.
✅ Protect your capital—especially in futures.
❌ No guaranteed targets. Volatility is extremely high.
🔥 $IRYS IS STILL UP MASSIVELY, BUT CAN THE BULLS RETURN?
🚀 New all-time momentum?
📉 Or a deeper correction first?
💬 Comment your view: BULLISH 🐂 or BEARISH 🐻?
#IRYSUSDT #IRYS #EarningsSeason #BinancePick
#AfterThePump
🚨🔥 IRYSUSDT AFTER THE MEGA PUMP — WHAT HAPPENS NEXT? 🚀
🤯 FROM $0.01168 TO $0.16984!
$IRYS has delivered an extraordinary move, and now traders are watching closely as price pulls back from its recent high. 📉📈
📊 LATEST MARKET SNAPSHOT
💰 Current Price: 0.13252 USDT
🚀 24H Change: +504.01%
🎯 Recent High: 0.16984 USDT
📈 24H Volume: 1.41 BILLION USDT
🐂 BULLISH SCENARIO
If buyers regain momentum and price breaks above 0.16984, a fresh breakout could follow.
🐻 BEARISH SCENARIO
After such a massive rally, profit-taking could continue. Watch how price reacts around 0.13000 and the 0.10800–0.11000 zone.
⚠️ THE SMART MOVE
✅ Don't chase a vertical candle.
✅ Wait for confirmation and volume.
✅ Protect your capital—especially in futures.
❌ No guaranteed targets. Volatility is extremely high.
🔥 $IRYS IS STILL UP MASSIVELY, BUT CAN THE BULLS RETURN?
🚀 New all-time momentum?
📉 Or a deeper correction first?
💬 Comment your view: BULLISH 🐂 or BEARISH 🐻?
#IRYSUSDT #IRYS #EarningsSeason #BinancePick
#AfterThePump
461

·
--
Bullish
$JCT $BTC $BNB
After a 214% Rally: Three Possible Scenarios for JCT
A 214.92% gain is difficult to ignore.
JCTUSDT recorded that increase in the Binance USDⓈ-M Futures snapshot checked on November 9, 2026, at 14:00 WIB.
But after an explosive move, the next phase can be just as interesting as the rally itself.
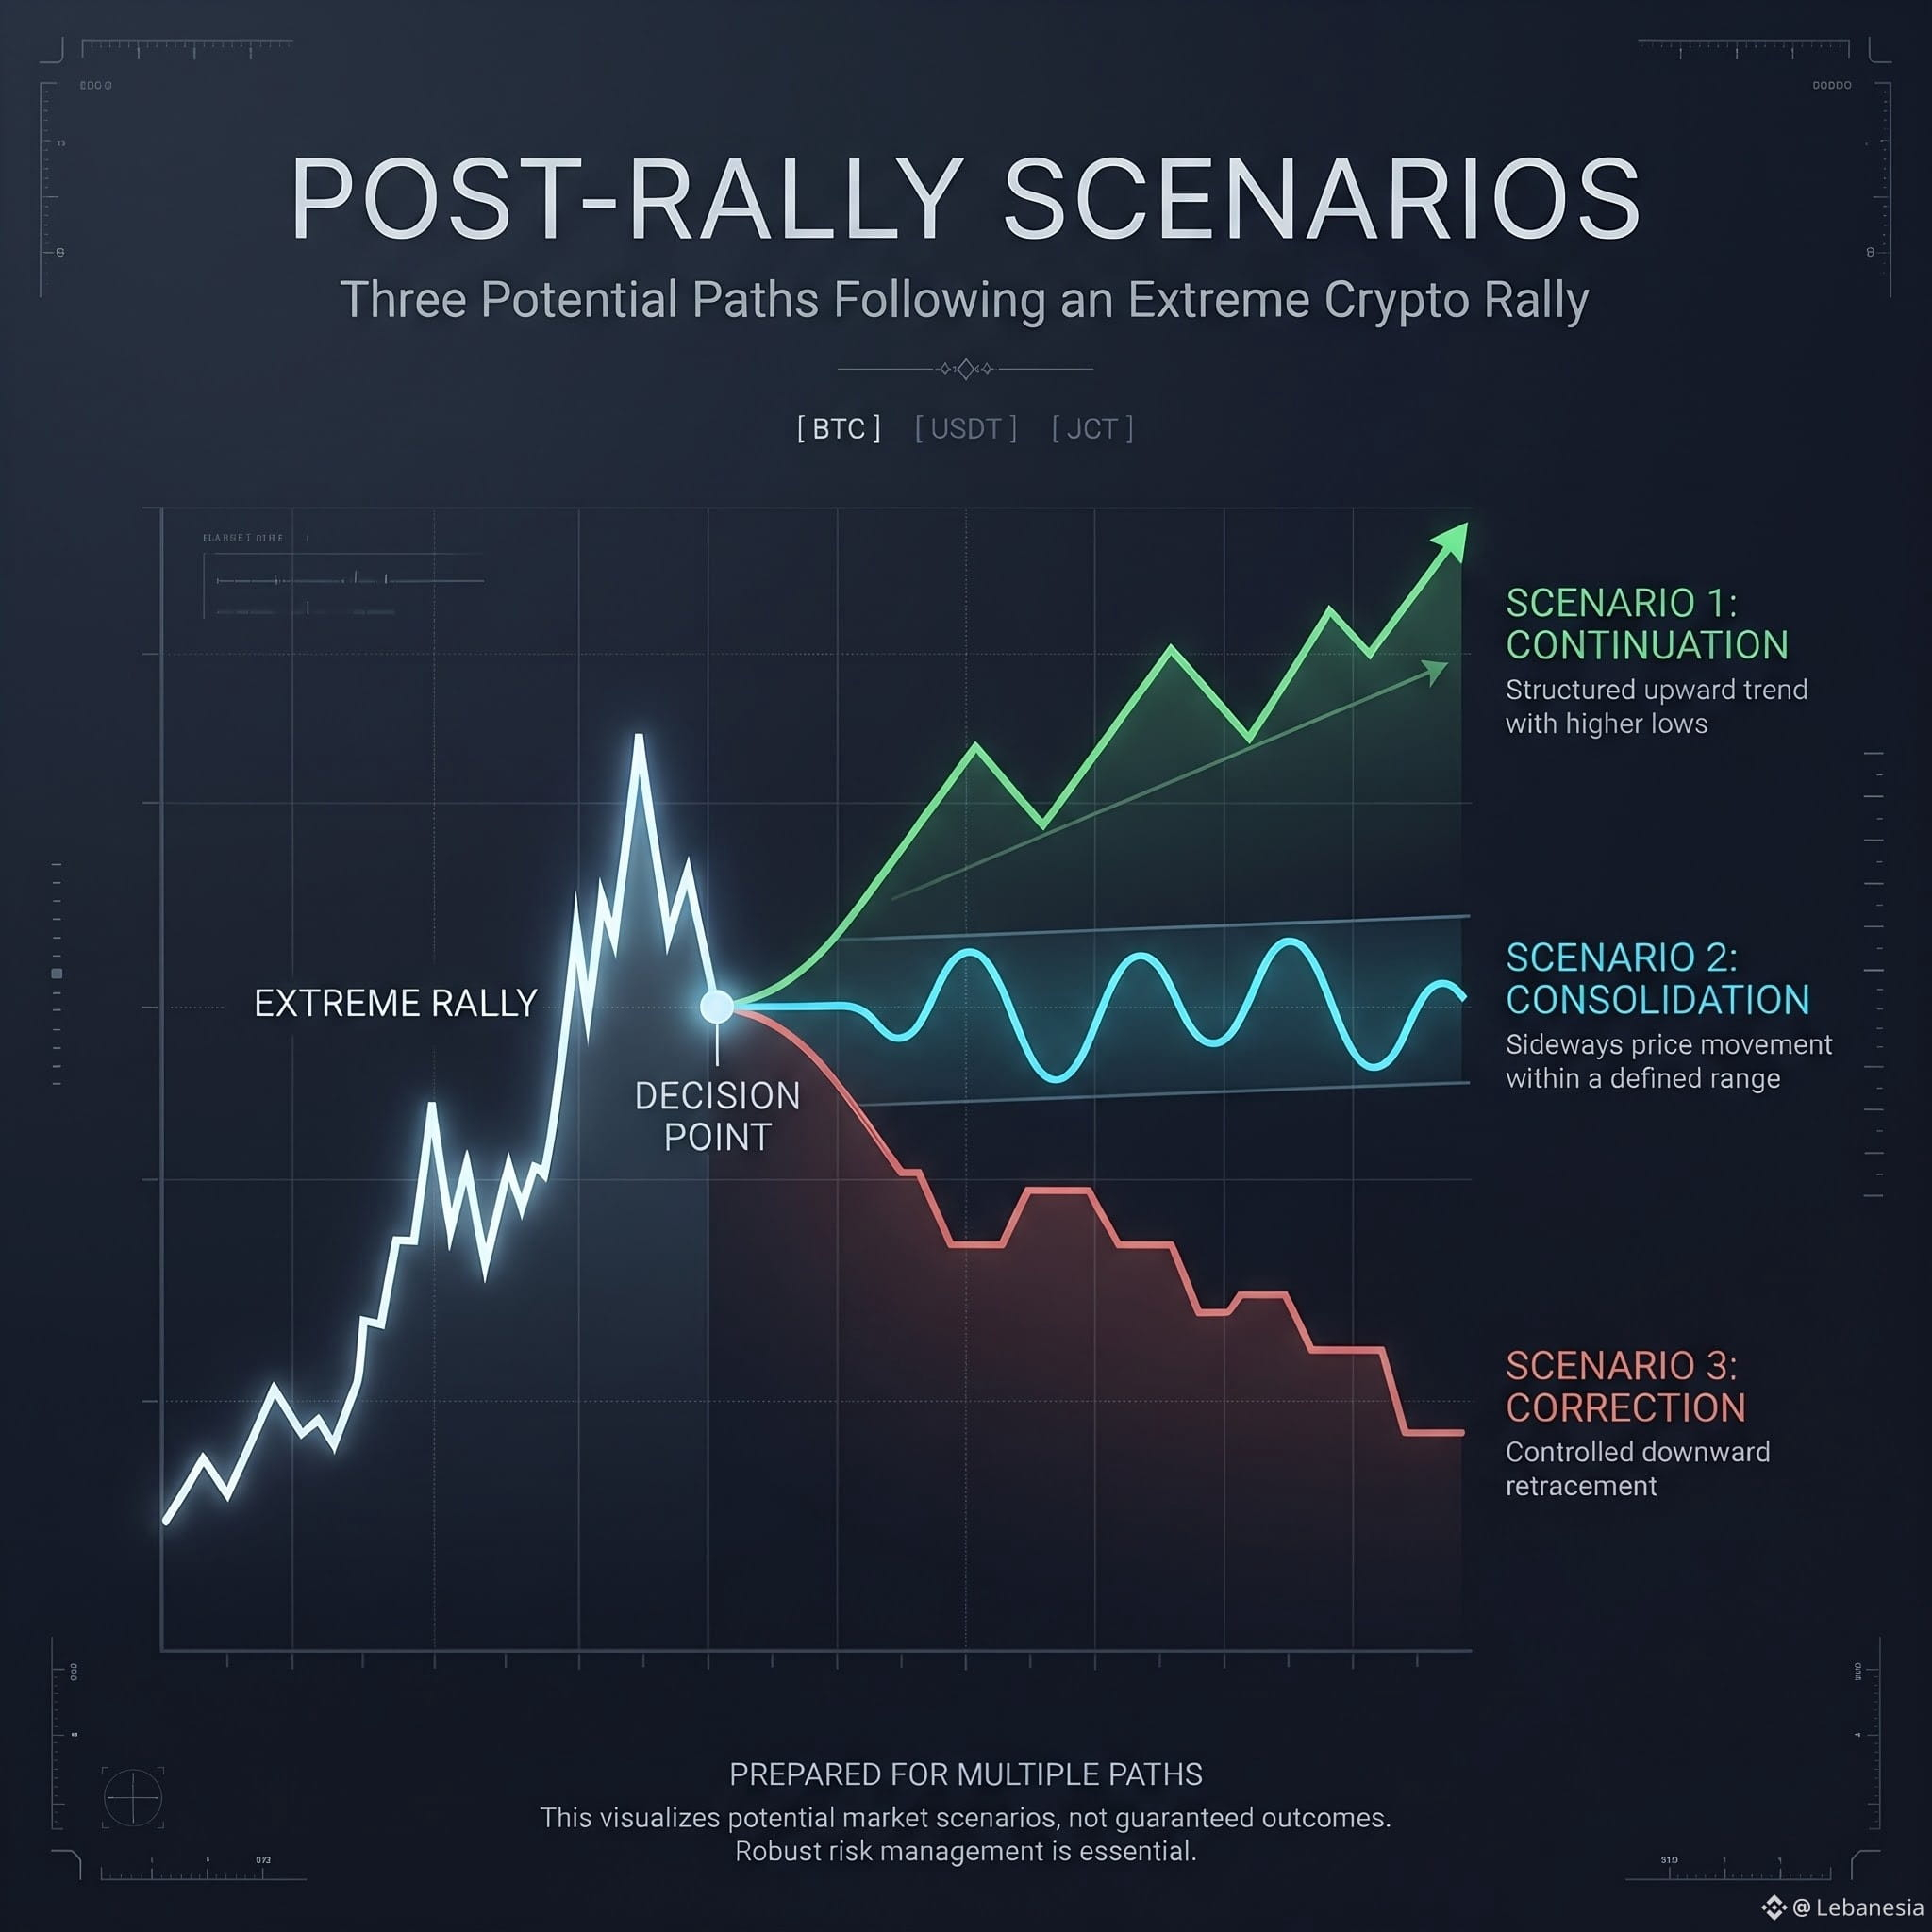
Here are three scenarios worth understanding.
SCENARIO 1 — Momentum Continues
Price maintains its higher-low structure and eventually attempts to break its previous swing high.
If trading activity supports the move, this could indicate that buyers are still participating.
The important detail is confirmation, not anticipation.
SCENARIO 2 — The Market Consolidates
After a rapid increase, price begins moving sideways.
Buyers and sellers establish a temporary balance, while volatility may gradually decrease.
Consolidation is not automatically bearish. It can simply represent a pause after an aggressive move.
SCENARIO 3 — A Deeper Correction
Price fails to maintain its previous structure.
Lower highs begin forming, previous support areas fail, and selling pressure becomes more visible.
In this situation, some of the earlier gains could be retraced.
The psychological factor matters too.
After seeing a coin rise more than 200%, traders may feel pressured to enter immediately.
But the fear of missing out can lead to poor risk management.
There is no obligation to participate in every rally.
Sometimes observing the market without opening a position is the more disciplined decision.
My perspective: I would rather understand how price behaves after an extreme move than assume that the next candle must continue in the same direction.
Disclaimer: These are hypothetical market scenarios, not price predictions or financial advice. Futures trading carries substantial volatility and liquidation risk.
#JCT #AfterThePump #MarketStructure #TradingPsychology #RiskManagement
$JCT $BTC $BNB
After a 214% Rally: Three Possible Scenarios for JCT
A 214.92% gain is difficult to ignore.
JCTUSDT recorded that increase in the Binance USDⓈ-M Futures snapshot checked on November 9, 2026, at 14:00 WIB.
But after an explosive move, the next phase can be just as interesting as the rally itself.
Here are three scenarios worth understanding.
SCENARIO 1 — Momentum Continues
Price maintains its higher-low structure and eventually attempts to break its previous swing high.
If trading activity supports the move, this could indicate that buyers are still participating.
The important detail is confirmation, not anticipation.
SCENARIO 2 — The Market Consolidates
After a rapid increase, price begins moving sideways.
Buyers and sellers establish a temporary balance, while volatility may gradually decrease.
Consolidation is not automatically bearish. It can simply represent a pause after an aggressive move.
SCENARIO 3 — A Deeper Correction
Price fails to maintain its previous structure.
Lower highs begin forming, previous support areas fail, and selling pressure becomes more visible.
In this situation, some of the earlier gains could be retraced.
The psychological factor matters too.
After seeing a coin rise more than 200%, traders may feel pressured to enter immediately.
But the fear of missing out can lead to poor risk management.
There is no obligation to participate in every rally.
Sometimes observing the market without opening a position is the more disciplined decision.
My perspective: I would rather understand how price behaves after an extreme move than assume that the next candle must continue in the same direction.
Disclaimer: These are hypothetical market scenarios, not price predictions or financial advice. Futures trading carries substantial volatility and liquidation risk.
#JCT #AfterThePump #MarketStructure #TradingPsychology #RiskManagement
After a 214% Rally: Three Possible Scenarios for JCT
A 214.92% gain is difficult to ignore.
JCTUSDT recorded that increase in the Binance USDⓈ-M Futures snapshot checked on November 9, 2026, at 14:00 WIB.
But after an explosive move, the next phase can be just as interesting as the rally itself.
Here are three scenarios worth understanding.
SCENARIO 1 — Momentum Continues
Price maintains its higher-low structure and eventually attempts to break its previous swing high.
If trading activity supports the move, this could indicate that buyers are still participating.
The important detail is confirmation, not anticipation.
SCENARIO 2 — The Market Consolidates
After a rapid increase, price begins moving sideways.
Buyers and sellers establish a temporary balance, while volatility may gradually decrease.
Consolidation is not automatically bearish. It can simply represent a pause after an aggressive move.
SCENARIO 3 — A Deeper Correction
Price fails to maintain its previous structure.
Lower highs begin forming, previous support areas fail, and selling pressure becomes more visible.
In this situation, some of the earlier gains could be retraced.
The psychological factor matters too.
After seeing a coin rise more than 200%, traders may feel pressured to enter immediately.
But the fear of missing out can lead to poor risk management.
There is no obligation to participate in every rally.
Sometimes observing the market without opening a position is the more disciplined decision.
My perspective: I would rather understand how price behaves after an extreme move than assume that the next candle must continue in the same direction.
Disclaimer: These are hypothetical market scenarios, not price predictions or financial advice. Futures trading carries substantial volatility and liquidation risk.
#JCT #AfterThePump #MarketStructure #TradingPsychology #RiskManagement
1
525
Log in to explore more content
Join global crypto users on Binance Square
⚡️ Get latest and useful information about crypto.
💬 Trusted by the world’s largest crypto exchange.
👍 Discover real insights from verified creators.
Email / Phone number
Trending Topics
1
#CryptoSelloffTriggersMultipleWhaleLiquidations
178,434 views
1,776 Discussing
2
#USSpotXRPETFsSeeLargestWeeklyOutflowIn8Months
158,536 views
1,550 Discussing
3
#WillFOMCMinutesReinforceRateHikeExpectations?
46,504 views
737 Discussing
4
#BitcoinActiveSupplyInProfitDropsBelow45%
234,874 views
1,810 Discussing
5
#TONStrategyReports$23.97MQ3NetLoss
20,515 views
150 Discussing
6
#KavaSaysAbnormalActivityLimitedToKavaLend
156,140 views
1,026 Discussing
7
#WORPTLetsTouristsConvertCryptoToThaiBaht
56,614 views
413 Discussing
8
#WhoWillSucceedJensenHuangatNvidia?
359,488 views
2,163 Discussing
9
#WhatWillDriveCryptoandStocks’NextRebound?
888,027 views
3,975 Discussing
10
#TradFiForBeginners
852,020 views
4,987 Discussing