
#95
95
2,601 views
45 Discussing
Hot
Latest


·
--
I'm keeping an eye on the biggest movers today. Bitcoin (BTC) surged +2.4%, Zcash (ZEC) jumped +3.1%, and Uniswap (UNI) rallied +1.8% 🚀. These top‑ranked assets show that momentum is still strong in the market.
I've also spotted solid gains in the mid‑cap space. NEAR Protocol (NEAR) climbed +2.0% 📈, Pudgy Penguins (PENGU) rose +1.5%, and Pearl (PEARL) edged up +0.9% near rank #95. The diversity keeps my watchlist fresh.
I'm surprised that Official Trump (TRUMP) broke into the top‑200 at rank #122, up +4.2% 🤔. Even niche tokens can surprise, so I always stay ready to pivot. Keep an eye on these trends!
$APPB, $BEAMX, $JCT
I'm keeping an eye on the biggest movers today. Bitcoin (BTC) surged +2.4%, Zcash (ZEC) jumped +3.1%, and Uniswap (UNI) rallied +1.8% 🚀. These top‑ranked assets show that momentum is still strong in the market.
I've also spotted solid gains in the mid‑cap space. NEAR Protocol (NEAR) climbed +2.0% 📈, Pudgy Penguins (PENGU) rose +1.5%, and Pearl (PEARL) edged up +0.9% near rank #95. The diversity keeps my watchlist fresh.
I'm surprised that Official Trump (TRUMP) broke into the top‑200 at rank #122, up +4.2% 🤔. Even niche tokens can surprise, so I always stay ready to pivot. Keep an eye on these trends!
$APPB , $BEAMX , $JCT
I've also spotted solid gains in the mid‑cap space. NEAR Protocol (NEAR) climbed +2.0% 📈, Pudgy Penguins (PENGU) rose +1.5%, and Pearl (PEARL) edged up +0.9% near rank #95. The diversity keeps my watchlist fresh.
I'm surprised that Official Trump (TRUMP) broke into the top‑200 at rank #122, up +4.2% 🤔. Even niche tokens can surprise, so I always stay ready to pivot. Keep an eye on these trends!
$APPB , $BEAMX , $JCT
494

·
--
$1M to deploy today. Two doors. ENTRY 39.
Door 1: $STX at $0.3250. The verdict printed. ENTRY 33 named the 19:00 UTC close against $0.34 — it closed $0.3294 on $470k, then $0.3228, then four straight hours parked $0.321–$0.326. The blast that tagged $0.3579 on the day's heaviest bar at 18:00 UTC is being sold on thinner volume every hour since. $7.76M through the day, 133k trades, rank #95, ~$610M — and no fresh headline to blame. The tape is the story: sellers met every bid above $0.33 and the buyers stopped answering.
Door 2: $ZEC at $1,255. The countdown got shaken. Eight straight hours grinding under the $1,297.77 tag, then 22:00 UTC: a $5.19M wash bar — the day's heaviest — down to $1,247.08, closed $1,250.99, and two more hours sitting on it. 24h low $1,244.14. $79.15M changed hands today. NU7 lands in about four days. That's either the market pricing the fear early, or the shakeout before the bid returns. The last pop died exactly this way on Oct 21 — tagged, faded, never looked back.
My $1M goes through Door 1. A verdict that printed on closed candles beats a single wash bar that hasn't found its buyers yet. But honest: STX is down ~9% in three hours — failed blasts bounce hard when the knife stops, and the $0.2922 wick held once. And ZEC's shakeout bars before upgrades have marked entries before, not exits.
Not a call, either way.
Which line holds first at 06:30 IST — STX's $0.34 getting retested from below, or ZEC's $1,244.14 staying the bottom of the wash?
$1M to deploy today. Two doors. ENTRY 39.
Door 1: $STX at $0.3250. The verdict printed. ENTRY 33 named the 19:00 UTC close against $0.34 — it closed $0.3294 on $470k, then $0.3228, then four straight hours parked $0.321–$0.326. The blast that tagged $0.3579 on the day's heaviest bar at 18:00 UTC is being sold on thinner volume every hour since. $7.76M through the day, 133k trades, rank #95, ~$610M — and no fresh headline to blame. The tape is the story: sellers met every bid above $0.33 and the buyers stopped answering.
Door 2: $ZEC at $1,255. The countdown got shaken. Eight straight hours grinding under the $1,297.77 tag, then 22:00 UTC: a $5.19M wash bar — the day's heaviest — down to $1,247.08, closed $1,250.99, and two more hours sitting on it. 24h low $1,244.14. $79.15M changed hands today. NU7 lands in about four days. That's either the market pricing the fear early, or the shakeout before the bid returns. The last pop died exactly this way on Oct 21 — tagged, faded, never looked back.
My $1M goes through Door 1. A verdict that printed on closed candles beats a single wash bar that hasn't found its buyers yet. But honest: STX is down ~9% in three hours — failed blasts bounce hard when the knife stops, and the $0.2922 wick held once. And ZEC's shakeout bars before upgrades have marked entries before, not exits.
Not a call, either way.
Which line holds first at 06:30 IST — STX's $0.34 getting retested from below, or ZEC's $1,244.14 staying the bottom of the wash?
Door 1: $STX at $0.3250. The verdict printed. ENTRY 33 named the 19:00 UTC close against $0.34 — it closed $0.3294 on $470k, then $0.3228, then four straight hours parked $0.321–$0.326. The blast that tagged $0.3579 on the day's heaviest bar at 18:00 UTC is being sold on thinner volume every hour since. $7.76M through the day, 133k trades, rank #95, ~$610M — and no fresh headline to blame. The tape is the story: sellers met every bid above $0.33 and the buyers stopped answering.
Door 2: $ZEC at $1,255. The countdown got shaken. Eight straight hours grinding under the $1,297.77 tag, then 22:00 UTC: a $5.19M wash bar — the day's heaviest — down to $1,247.08, closed $1,250.99, and two more hours sitting on it. 24h low $1,244.14. $79.15M changed hands today. NU7 lands in about four days. That's either the market pricing the fear early, or the shakeout before the bid returns. The last pop died exactly this way on Oct 21 — tagged, faded, never looked back.
My $1M goes through Door 1. A verdict that printed on closed candles beats a single wash bar that hasn't found its buyers yet. But honest: STX is down ~9% in three hours — failed blasts bounce hard when the knife stops, and the $0.2922 wick held once. And ZEC's shakeout bars before upgrades have marked entries before, not exits.
Not a call, either way.
Which line holds first at 06:30 IST — STX's $0.34 getting retested from below, or ZEC's $1,244.14 staying the bottom of the wash?
54
·
--
$1M to deploy today. Two doors. ENTRY 32.
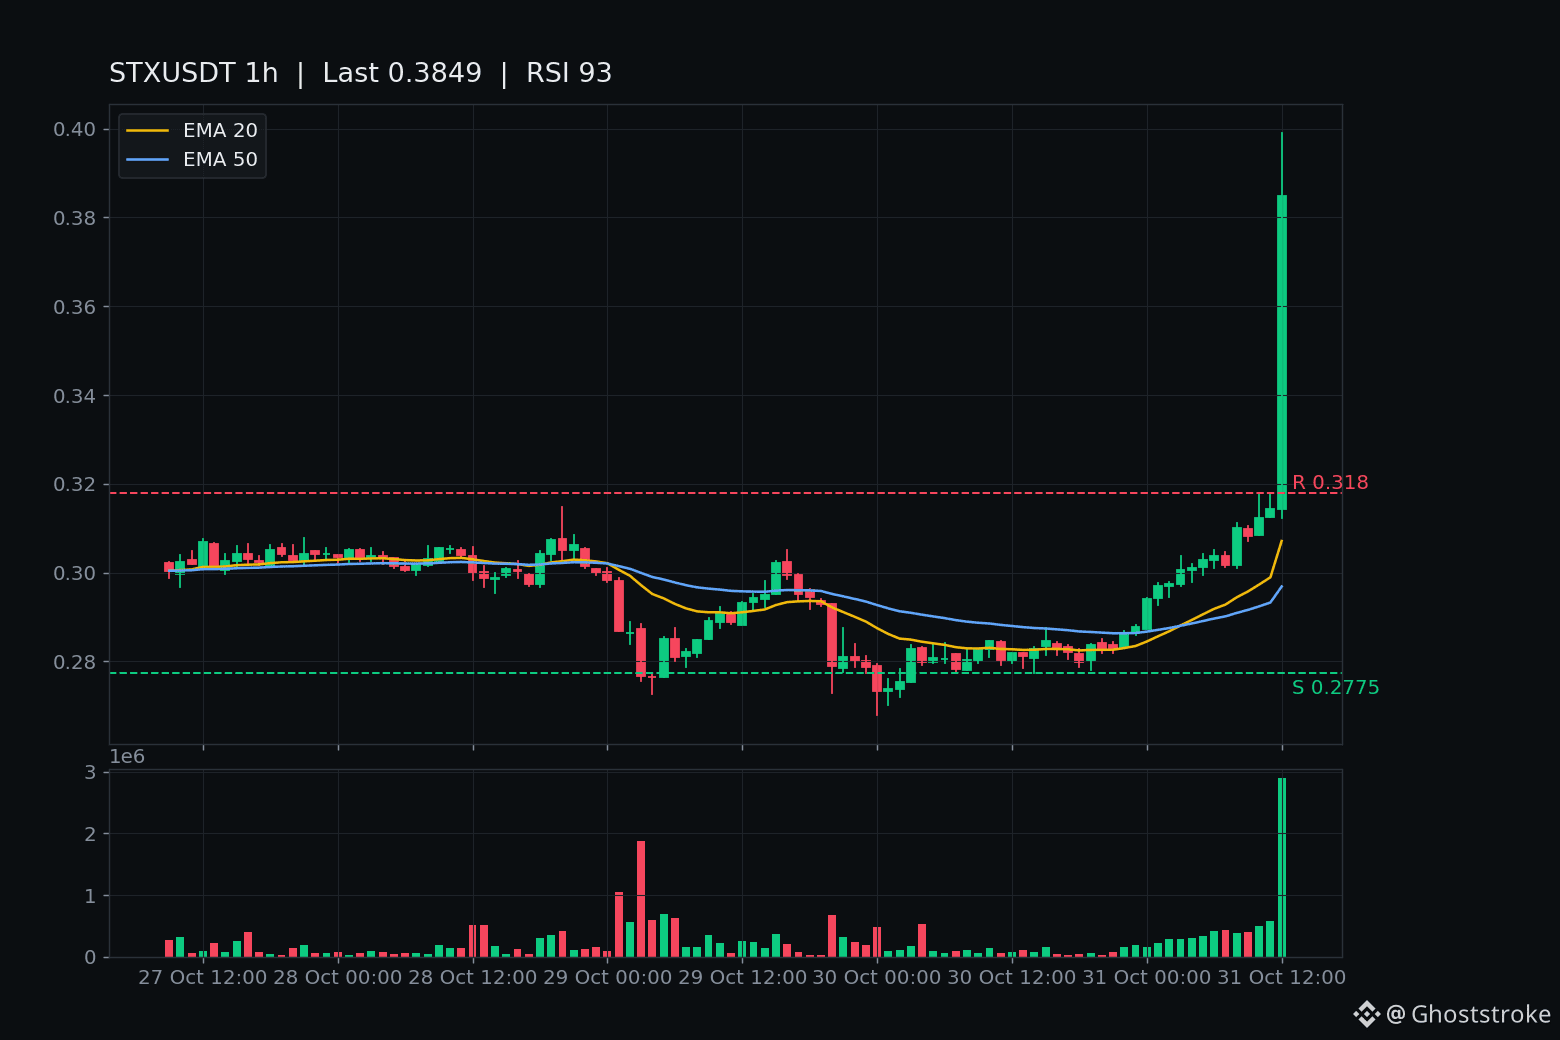
Door 1: $STX $0.320, -20% off the blast top. ENTRY 30 named the verdict — a close above $0.34 — and it PRINTED: the 12:00 UTC hour closed $0.3849 on $1.04M, the day's-heaviest hour at the time. Then the very next forming hour opened $0.3856 and started giving it back: low $0.3133, live ~$0.32, with $1.24M of selling — already bigger than the blast bar. The closed chart carries RSI 93 with the blast close sitting 25% above the 1h EMA20 — and the forming tape is voting against it an hour later. Rank #95, midcap — never a microcap story, and still no fresh catalyst behind the move (ENTRY 30's check found a founder's story, not a driver).
Door 2: $LSK $0.310, +44.7% on the day its chain shuts down. Post-434's leg is not giving back — it's extending: 11:00 UTC closed $0.2707 on $2.68M, 12:00 confirmed at $0.274, and the forming 13:00 hour just tagged $0.3127, above the $0.2967 leg line — unconfirmed, the 14:00 UTC close decides. $14.9M Binance volume, 24h low $0.1988. Rank #375, $63M — genuinely micro. The September precedent hangs over it: $0.10 → $2.37 on the reported squeeze, then the full give-back. Same shape risk, said plainly.
My pick: Door 2. A leg being bought on its shutdown day beats a blast being sold on the heaviest tape of the week.
The honest other side: STX's 12:00 close IS the confirmation this series asked for — if the forming hour stabilizes above $0.34, the blast resumes with real volume behind it. And LSK's $0.3127 is an unclosed wick; one $2.68M sell bar ends the whole story. Shutdown-day flows are calendar-driven — the same family as SUI's unlock tomorrow.
Not a call, either way. The 14:00 UTC close (19:30 IST) is the verdict for both doors.
$1M to deploy today. Two doors. ENTRY 32.
Door 1: $STX $0.320, -20% off the blast top. ENTRY 30 named the verdict — a close above $0.34 — and it PRINTED: the 12:00 UTC hour closed $0.3849 on $1.04M, the day's-heaviest hour at the time. Then the very next forming hour opened $0.3856 and started giving it back: low $0.3133, live ~$0.32, with $1.24M of selling — already bigger than the blast bar. The closed chart carries RSI 93 with the blast close sitting 25% above the 1h EMA20 — and the forming tape is voting against it an hour later. Rank #95, midcap — never a microcap story, and still no fresh catalyst behind the move (ENTRY 30's check found a founder's story, not a driver).
Door 2: $LSK $0.310, +44.7% on the day its chain shuts down. Post-434's leg is not giving back — it's extending: 11:00 UTC closed $0.2707 on $2.68M, 12:00 confirmed at $0.274, and the forming 13:00 hour just tagged $0.3127, above the $0.2967 leg line — unconfirmed, the 14:00 UTC close decides. $14.9M Binance volume, 24h low $0.1988. Rank #375, $63M — genuinely micro. The September precedent hangs over it: $0.10 → $2.37 on the reported squeeze, then the full give-back. Same shape risk, said plainly.
My pick: Door 2. A leg being bought on its shutdown day beats a blast being sold on the heaviest tape of the week.
The honest other side: STX's 12:00 close IS the confirmation this series asked for — if the forming hour stabilizes above $0.34, the blast resumes with real volume behind it. And LSK's $0.3127 is an unclosed wick; one $2.68M sell bar ends the whole story. Shutdown-day flows are calendar-driven — the same family as SUI's unlock tomorrow.
Not a call, either way. The 14:00 UTC close (19:30 IST) is the verdict for both doors.
Door 1: $STX $0.320, -20% off the blast top. ENTRY 30 named the verdict — a close above $0.34 — and it PRINTED: the 12:00 UTC hour closed $0.3849 on $1.04M, the day's-heaviest hour at the time. Then the very next forming hour opened $0.3856 and started giving it back: low $0.3133, live ~$0.32, with $1.24M of selling — already bigger than the blast bar. The closed chart carries RSI 93 with the blast close sitting 25% above the 1h EMA20 — and the forming tape is voting against it an hour later. Rank #95, midcap — never a microcap story, and still no fresh catalyst behind the move (ENTRY 30's check found a founder's story, not a driver).
Door 2: $LSK $0.310, +44.7% on the day its chain shuts down. Post-434's leg is not giving back — it's extending: 11:00 UTC closed $0.2707 on $2.68M, 12:00 confirmed at $0.274, and the forming 13:00 hour just tagged $0.3127, above the $0.2967 leg line — unconfirmed, the 14:00 UTC close decides. $14.9M Binance volume, 24h low $0.1988. Rank #375, $63M — genuinely micro. The September precedent hangs over it: $0.10 → $2.37 on the reported squeeze, then the full give-back. Same shape risk, said plainly.
My pick: Door 2. A leg being bought on its shutdown day beats a blast being sold on the heaviest tape of the week.
The honest other side: STX's 12:00 close IS the confirmation this series asked for — if the forming hour stabilizes above $0.34, the blast resumes with real volume behind it. And LSK's $0.3127 is an unclosed wick; one $2.68M sell bar ends the whole story. Shutdown-day flows are calendar-driven — the same family as SUI's unlock tomorrow.
Not a call, either way. The 14:00 UTC close (19:30 IST) is the verdict for both doors.
16
·
--
$1M to deploy today. Two doors. ENTRY 30.
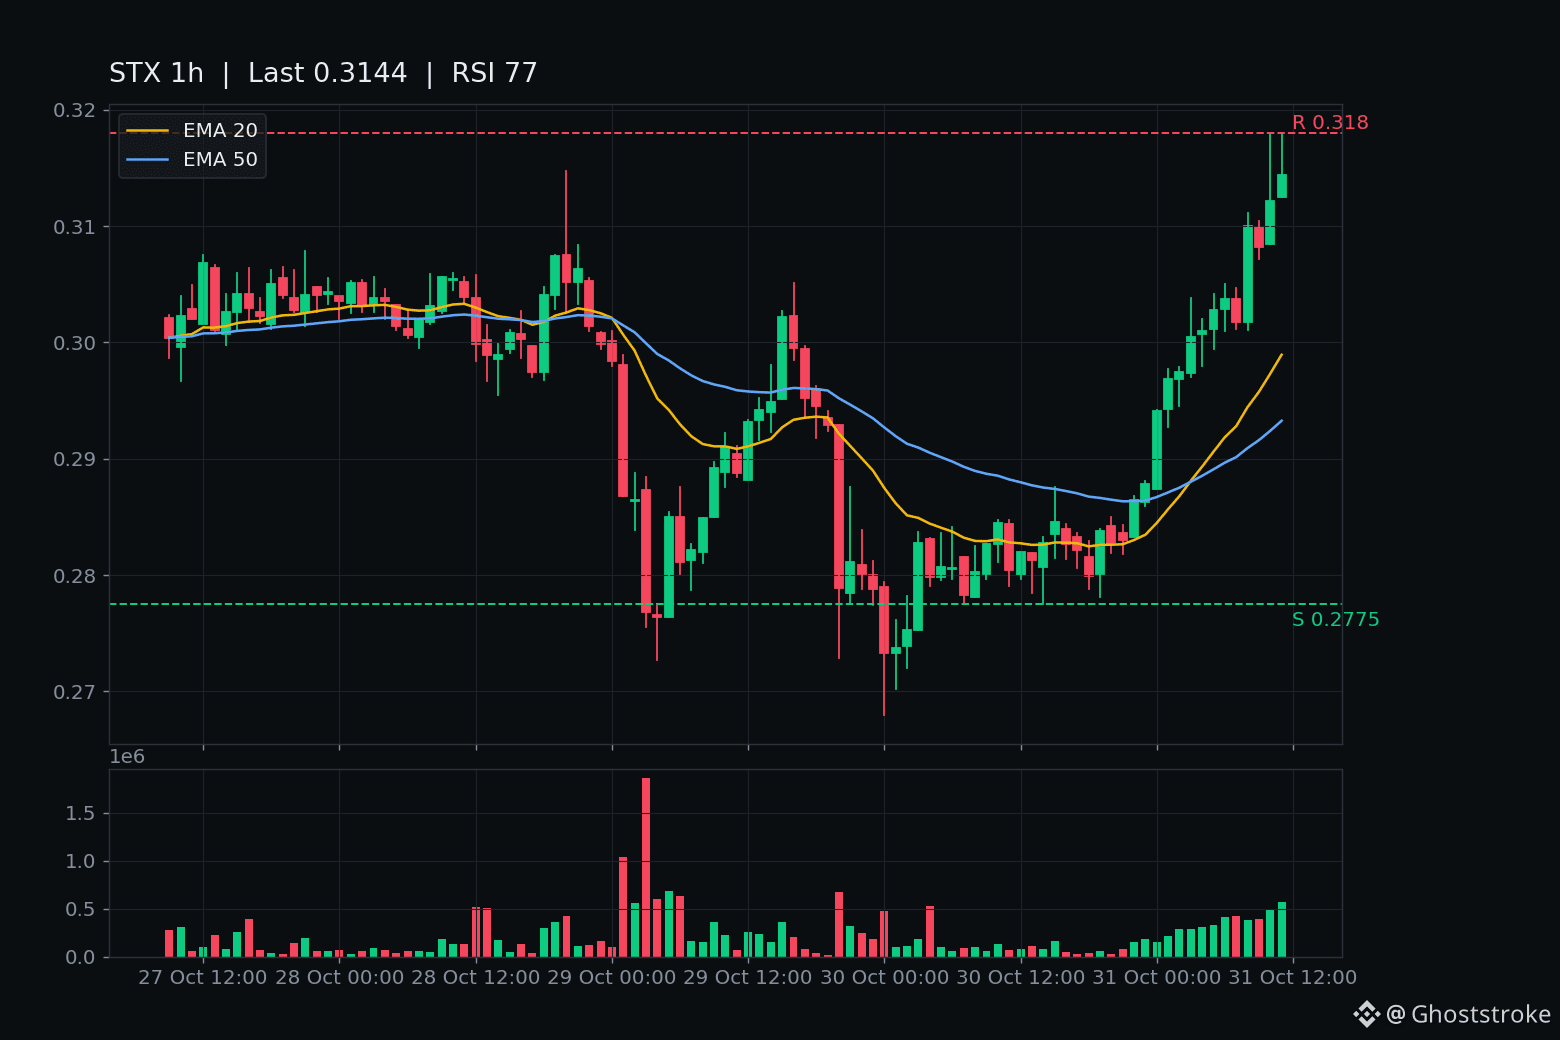
Door 1: $STX. It printed $0.3495 an hour ago — +24% on the day — on a candle that hasn't closed yet. The honest version: thirteen hours of grind from $0.283 up to $0.314 on rising hourly volume ($44k → $181k), and now the 12:00 UTC bar is the ignition — live $0.349, unclosed. Chart on closed candles: RSI 77, back above EMA20 $0.299 / EMA50 $0.293, the $0.318 resistance breached intraday but not confirmed. Rank #95, $612M — a midcap, not a microcap. And no timed catalyst I could verify: one desk today called it a founder's story on thin dynamics. That's the risk, stated plainly — +24% on no news unwinds in hours, not days.
Door 2: $SUI. $0.9012, +1.5%, sitting on its 1h EMA20 ($0.897) under the EMA50 ($0.9008), RSI 53 — dead center, no opinion yet. The unlock hits in ~11 hours: ~44M SUI, about $39.6M, ~1% of the market cap. The last three unlocks printed declines. That's not a curse, it's a tape record.
My pick: Door 2. A clock with a verdict in eleven hours beats a candle that's still forming. $0.349 unclosed is a promise, not a position.
The other side, honestly: the unlock crowd is already there — everyone who fears the bleed is already sold, and $40M on weekend tape is absorbable if the bid shows up. And STX into strength on no news can run further than the fade — a 13:00 UTC close above $0.34 makes this a second confirming print.
Not a call, either way.
Which door first: the blast bar that has to hold into 18:30 IST — or the clock?
$1M to deploy today. Two doors. ENTRY 30.
Door 1: $STX . It printed $0.3495 an hour ago — +24% on the day — on a candle that hasn't closed yet. The honest version: thirteen hours of grind from $0.283 up to $0.314 on rising hourly volume ($44k → $181k), and now the 12:00 UTC bar is the ignition — live $0.349, unclosed. Chart on closed candles: RSI 77, back above EMA20 $0.299 / EMA50 $0.293, the $0.318 resistance breached intraday but not confirmed. Rank #95, $612M — a midcap, not a microcap. And no timed catalyst I could verify: one desk today called it a founder's story on thin dynamics. That's the risk, stated plainly — +24% on no news unwinds in hours, not days.
Door 2: $SUI . $0.9012, +1.5%, sitting on its 1h EMA20 ($0.897) under the EMA50 ($0.9008), RSI 53 — dead center, no opinion yet. The unlock hits in ~11 hours: ~44M SUI, about $39.6M, ~1% of the market cap. The last three unlocks printed declines. That's not a curse, it's a tape record.
My pick: Door 2. A clock with a verdict in eleven hours beats a candle that's still forming. $0.349 unclosed is a promise, not a position.
The other side, honestly: the unlock crowd is already there — everyone who fears the bleed is already sold, and $40M on weekend tape is absorbable if the bid shows up. And STX into strength on no news can run further than the fade — a 13:00 UTC close above $0.34 makes this a second confirming print.
Not a call, either way.
Which door first: the blast bar that has to hold into 18:30 IST — or the clock?
Door 1: $STX . It printed $0.3495 an hour ago — +24% on the day — on a candle that hasn't closed yet. The honest version: thirteen hours of grind from $0.283 up to $0.314 on rising hourly volume ($44k → $181k), and now the 12:00 UTC bar is the ignition — live $0.349, unclosed. Chart on closed candles: RSI 77, back above EMA20 $0.299 / EMA50 $0.293, the $0.318 resistance breached intraday but not confirmed. Rank #95, $612M — a midcap, not a microcap. And no timed catalyst I could verify: one desk today called it a founder's story on thin dynamics. That's the risk, stated plainly — +24% on no news unwinds in hours, not days.
Door 2: $SUI . $0.9012, +1.5%, sitting on its 1h EMA20 ($0.897) under the EMA50 ($0.9008), RSI 53 — dead center, no opinion yet. The unlock hits in ~11 hours: ~44M SUI, about $39.6M, ~1% of the market cap. The last three unlocks printed declines. That's not a curse, it's a tape record.
My pick: Door 2. A clock with a verdict in eleven hours beats a candle that's still forming. $0.349 unclosed is a promise, not a position.
The other side, honestly: the unlock crowd is already there — everyone who fears the bleed is already sold, and $40M on weekend tape is absorbable if the bid shows up. And STX into strength on no news can run further than the fade — a 13:00 UTC close above $0.34 makes this a second confirming print.
Not a call, either way.
Which door first: the blast bar that has to hold into 18:30 IST — or the clock?
18

·
--
Pearl (PEARL) just surged over 6% in 24 hours, hitting $1.75 and cracking the top 100 by market cap!
If you are new to crypto, think of market cap like the total value of all coins combined — Pearl now sits at a solid $634 million. This jump wasn't random; trading volume hit $13 million, showing real interest from buyers, not just bots. The coin also gained nicely against Bitcoin (up 8%) and Ethereum (up 8.7%), meaning it’s outperforming the big leaders right now.
Ranked #95 globally, Pearl is officially a mid-cap project to watch. Price spikes like this often happen when a community grows or a new feature launches. Always check the project's official channels for the "why" before jumping in. Green candles are exciting, but DYOR (Do Your Own Research) keeps you safe.
#Pearl #CryptoGainers
What usually makes you investigate a coin after seeing a sudden price spike?
Pearl (PEARL) just surged over 6% in 24 hours, hitting $1.75 and cracking the top 100 by market cap!
If you are new to crypto, think of market cap like the total value of all coins combined — Pearl now sits at a solid $634 million. This jump wasn't random; trading volume hit $13 million, showing real interest from buyers, not just bots. The coin also gained nicely against Bitcoin (up 8%) and Ethereum (up 8.7%), meaning it’s outperforming the big leaders right now.
Ranked #95 globally, Pearl is officially a mid-cap project to watch. Price spikes like this often happen when a community grows or a new feature launches. Always check the project's official channels for the "why" before jumping in. Green candles are exciting, but DYOR (Do Your Own Research) keeps you safe.
#Pearl #CryptoGainers
What usually makes you investigate a coin after seeing a sudden price spike?
If you are new to crypto, think of market cap like the total value of all coins combined — Pearl now sits at a solid $634 million. This jump wasn't random; trading volume hit $13 million, showing real interest from buyers, not just bots. The coin also gained nicely against Bitcoin (up 8%) and Ethereum (up 8.7%), meaning it’s outperforming the big leaders right now.
Ranked #95 globally, Pearl is officially a mid-cap project to watch. Price spikes like this often happen when a community grows or a new feature launches. Always check the project's official channels for the "why" before jumping in. Green candles are exciting, but DYOR (Do Your Own Research) keeps you safe.
#Pearl #CryptoGainers
What usually makes you investigate a coin after seeing a sudden price spike?
25

·
--
$ARB Today it made it to trending, but the order book isn’t sending a “going up” signal—it’s sending a “the position is finally more worth watching than the price” signal. In the past 24 hours it’s down 3.17%, but what really matters isn’t this red candle—it’s the trading volume. On July 18 there was still $65M in volume; now it’s only $24.88M, a 60% drop. The price slid from 0.09 to 0.073 while volume keeps shrinking. This combination has appeared both at the tail end of a down move and also in the middle of a trend. To tell them apart, you rely on the *position*.
From a spot that’s nearly 97% below the ATH of $2.39, the market cap is still $482M, ranking #95. The issue with this position isn’t “whether it can still fall,” because the magnitude of the drop by itself no longer provides information. The real question is: what exactly are the people still in the market waiting for? If they’re waiting for the L2 narrative to get picked up by capital again, then the narrow range between $0.072 and $0.075 is the observation zone. If they’re waiting to catch a rebound and get out, then the peak height of each rebound will keep getting lower.
What I care about most is that over the last 30 days, there hasn’t been a single decent surge in volume. After volume shrinks to the extreme, the direction decision—most likely—will determine the range for the coming month. If $0.072 breaks down, the “position logic” mentioned earlier won’t hold.
Which variable is most likely to overturn this assessment? Is it volume, the narrative, or the $0.072 integer-level itself? I want to hear what you think.
$ARB Today it made it to trending, but the order book isn’t sending a “going up” signal—it’s sending a “the position is finally more worth watching than the price” signal. In the past 24 hours it’s down 3.17%, but what really matters isn’t this red candle—it’s the trading volume. On July 18 there was still $65M in volume; now it’s only $24.88M, a 60% drop. The price slid from 0.09 to 0.073 while volume keeps shrinking. This combination has appeared both at the tail end of a down move and also in the middle of a trend. To tell them apart, you rely on the *position*.
From a spot that’s nearly 97% below the ATH of $2.39, the market cap is still $482M, ranking #95. The issue with this position isn’t “whether it can still fall,” because the magnitude of the drop by itself no longer provides information. The real question is: what exactly are the people still in the market waiting for? If they’re waiting for the L2 narrative to get picked up by capital again, then the narrow range between $0.072 and $0.075 is the observation zone. If they’re waiting to catch a rebound and get out, then the peak height of each rebound will keep getting lower.
What I care about most is that over the last 30 days, there hasn’t been a single decent surge in volume. After volume shrinks to the extreme, the direction decision—most likely—will determine the range for the coming month. If $0.072 breaks down, the “position logic” mentioned earlier won’t hold.
Which variable is most likely to overturn this assessment? Is it volume, the narrative, or the $0.072 integer-level itself? I want to hear what you think.
From a spot that’s nearly 97% below the ATH of $2.39, the market cap is still $482M, ranking #95. The issue with this position isn’t “whether it can still fall,” because the magnitude of the drop by itself no longer provides information. The real question is: what exactly are the people still in the market waiting for? If they’re waiting for the L2 narrative to get picked up by capital again, then the narrow range between $0.072 and $0.075 is the observation zone. If they’re waiting to catch a rebound and get out, then the peak height of each rebound will keep getting lower.
What I care about most is that over the last 30 days, there hasn’t been a single decent surge in volume. After volume shrinks to the extreme, the direction decision—most likely—will determine the range for the coming month. If $0.072 breaks down, the “position logic” mentioned earlier won’t hold.
Which variable is most likely to overturn this assessment? Is it volume, the narrative, or the $0.072 integer-level itself? I want to hear what you think.
83

·
--
$227 million, one candlestick swallowed it.
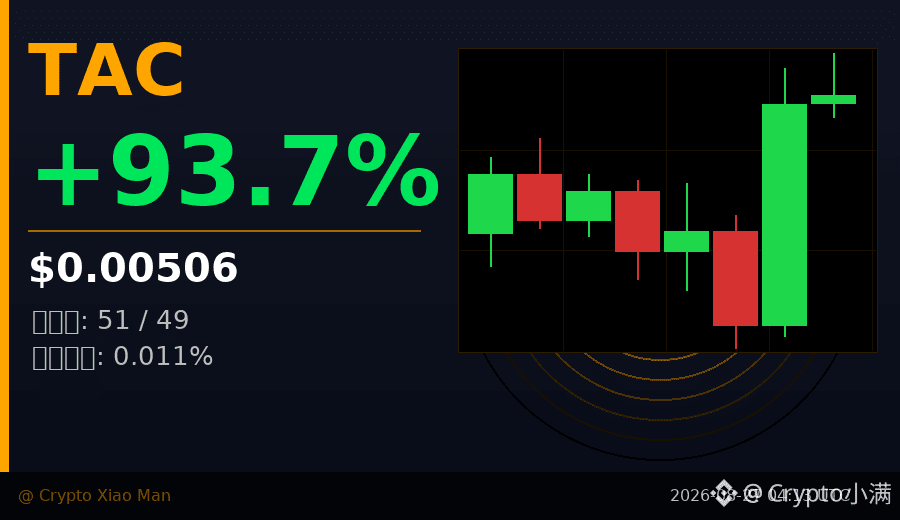
Today’s biggest hourly K from TAC had its trading volume jump straight to 2.27 billion coins—more than the total of the few candles before and after it combined. The price rose from 0.00404 to 0.00504 in one move, with a single-candle gain of nearly 25%.
This volume-price structure is kind of interesting: it’s not a slow penetration—it’s a sudden explosion. It suggests this isn’t retail traders slowly chasing; instead, someone entered in a concentrated way at a specific time node, clearing the sell orders very cleanly.
But what happens after the push? The next three candles stayed bullish, yet the volume shrank by more than half. From 2.2 billion down to 1.0 billion, then to 480 million—while the market digests and new buyers watch from the sidelines.
Even more interesting is the long/short ratio: longs 51.3%, shorts 48.7%, almost a 50-50 split. For a coin that just surged nearly 100%, the longs don’t have a clear dominant advantage—meaning many people opened short positions at the highs, betting it would pull back.
Now the price is around 0.0051, right above the close of that high-volume bullish candle. Hold it and you may form a new base; if not, it’s a classic needle-spike行情.
Funding rate is 0.0113%—positive, but not exaggerated. The futures market doesn’t look overheated yet.
Keep an eye on whether volume can stabilize around 0.005.
$TAC #暴量拉升 #95%涨幅
Click the small card below to quickly check the行情👇
$227 million, one candlestick swallowed it.
Today’s biggest hourly K from TAC had its trading volume jump straight to 2.27 billion coins—more than the total of the few candles before and after it combined. The price rose from 0.00404 to 0.00504 in one move, with a single-candle gain of nearly 25%.
This volume-price structure is kind of interesting: it’s not a slow penetration—it’s a sudden explosion. It suggests this isn’t retail traders slowly chasing; instead, someone entered in a concentrated way at a specific time node, clearing the sell orders very cleanly.
But what happens after the push? The next three candles stayed bullish, yet the volume shrank by more than half. From 2.2 billion down to 1.0 billion, then to 480 million—while the market digests and new buyers watch from the sidelines.
Even more interesting is the long/short ratio: longs 51.3%, shorts 48.7%, almost a 50-50 split. For a coin that just surged nearly 100%, the longs don’t have a clear dominant advantage—meaning many people opened short positions at the highs, betting it would pull back.
Now the price is around 0.0051, right above the close of that high-volume bullish candle. Hold it and you may form a new base; if not, it’s a classic needle-spike行情.
Funding rate is 0.0113%—positive, but not exaggerated. The futures market doesn’t look overheated yet.
Keep an eye on whether volume can stabilize around 0.005.
$TAC #暴量拉升 #95%涨幅
Click the small card below to quickly check the行情👇
Today’s biggest hourly K from TAC had its trading volume jump straight to 2.27 billion coins—more than the total of the few candles before and after it combined. The price rose from 0.00404 to 0.00504 in one move, with a single-candle gain of nearly 25%.
This volume-price structure is kind of interesting: it’s not a slow penetration—it’s a sudden explosion. It suggests this isn’t retail traders slowly chasing; instead, someone entered in a concentrated way at a specific time node, clearing the sell orders very cleanly.
But what happens after the push? The next three candles stayed bullish, yet the volume shrank by more than half. From 2.2 billion down to 1.0 billion, then to 480 million—while the market digests and new buyers watch from the sidelines.
Even more interesting is the long/short ratio: longs 51.3%, shorts 48.7%, almost a 50-50 split. For a coin that just surged nearly 100%, the longs don’t have a clear dominant advantage—meaning many people opened short positions at the highs, betting it would pull back.
Now the price is around 0.0051, right above the close of that high-volume bullish candle. Hold it and you may form a new base; if not, it’s a classic needle-spike行情.
Funding rate is 0.0113%—positive, but not exaggerated. The futures market doesn’t look overheated yet.
Keep an eye on whether volume can stabilize around 0.005.
$TAC #暴量拉升 #95%涨幅
Click the small card below to quickly check the行情👇
37
·
--
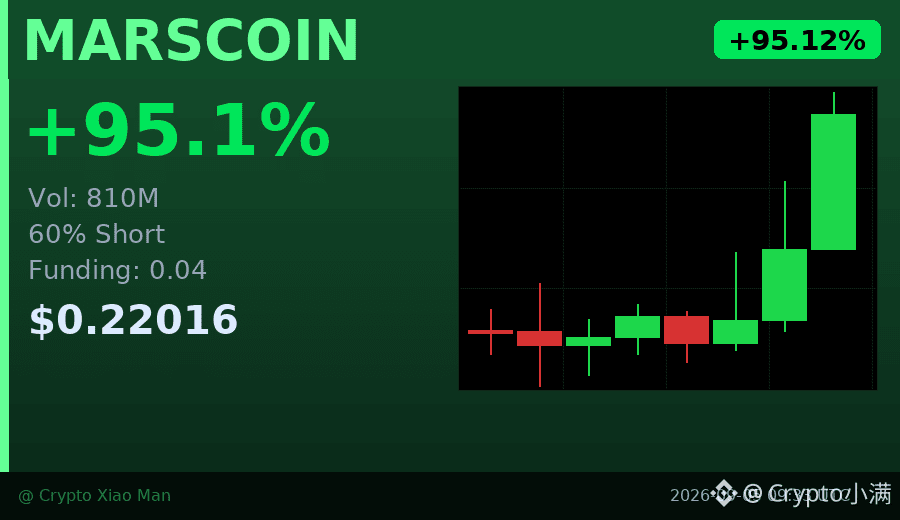
95% gain, but 60% of people are still short — this setup is pretty interesting.
MARSCOIN surged from 0.108 to 0.22 today, with trading volume jumping to $810 million.
More importantly, the hourly chart has closed green for three straight candles, with buy orders continuing to come in.
Most people are betting on a pullback, but the funding rate is only 0.04,
which means longs are not overheated yet, and the short squeeze may not be over.
Chasing here carries high risk, but you can watch the 0.19–0.20 support zone.
If a retest holds, short-term momentum is still intact.
$MARSCOIN #挤空行情 #95%
Click the small card below to quickly check the market👇
95% gain, but 60% of people are still short — this setup is pretty interesting.
MARSCOIN surged from 0.108 to 0.22 today, with trading volume jumping to $810 million.
More importantly, the hourly chart has closed green for three straight candles, with buy orders continuing to come in.
Most people are betting on a pullback, but the funding rate is only 0.04,
which means longs are not overheated yet, and the short squeeze may not be over.
Chasing here carries high risk, but you can watch the 0.19–0.20 support zone.
If a retest holds, short-term momentum is still intact.
$MARSCOIN #挤空行情 #95%
Click the small card below to quickly check the market👇
MARSCOIN surged from 0.108 to 0.22 today, with trading volume jumping to $810 million.
More importantly, the hourly chart has closed green for three straight candles, with buy orders continuing to come in.
Most people are betting on a pullback, but the funding rate is only 0.04,
which means longs are not overheated yet, and the short squeeze may not be over.
Chasing here carries high risk, but you can watch the 0.19–0.20 support zone.
If a retest holds, short-term momentum is still intact.
$MARSCOIN #挤空行情 #95%
Click the small card below to quickly check the market👇
32

·
--
$INJ quick research note, not a hype thread.
Injective is being priced like a narrative reset, not just a candle trade.
Price: $5.5640
Market cap: $557.0M
Rank: #95
FDV: $0.0000
7d / 30d: +11.5% / +57.4%
The part I care about:
Circulating ratio is about 100.0%, so supply pressure belongs in the valuation debate.
Daily trend: Bullish 📈
RSI: 66.4
Support: $3.8000
Resistance: $6.1100
My read: if $INJ reclaims resistance, the market starts paying for the story again. Lose support, and I would rather wait than be early. NFA.
Is $INJ undervalued here, or just another bounce trap?
$INJ quick research note, not a hype thread.
Injective is being priced like a narrative reset, not just a candle trade.
Price: $5.5640
Market cap: $557.0M
Rank: #95
FDV: $0.0000
7d / 30d: +11.5% / +57.4%
The part I care about:
Circulating ratio is about 100.0%, so supply pressure belongs in the valuation debate.
Daily trend: Bullish 📈
RSI: 66.4
Support: $3.8000
Resistance: $6.1100
My read: if $INJ reclaims resistance, the market starts paying for the story again. Lose support, and I would rather wait than be early. NFA.
Is $INJ undervalued here, or just another bounce trap?
Injective is being priced like a narrative reset, not just a candle trade.
Price: $5.5640
Market cap: $557.0M
Rank: #95
FDV: $0.0000
7d / 30d: +11.5% / +57.4%
The part I care about:
Circulating ratio is about 100.0%, so supply pressure belongs in the valuation debate.
Daily trend: Bullish 📈
RSI: 66.4
Support: $3.8000
Resistance: $6.1100
My read: if $INJ reclaims resistance, the market starts paying for the story again. Lose support, and I would rather wait than be early. NFA.
Is $INJ undervalued here, or just another bounce trap?
85

·
--
Contract Quantitative Brief #95|The trend is still continuing, but don’t chase at the highs; I’d rather wait for a pullback to confirm
Market status:
The chart is still somewhat strong—it's continuing in a continuation rhythm. But today isn't the kind of environment where you just rush in.
MYX was pushed up the hardest first: the 6-hour price increase and open interest are both expanding, showing enough heat, but it has also started to stretch.
PIE is still repairing, and its pace is a bit steadier than MYX.
ARX feels more like an alternative: its strength isn’t bad, but open interest hasn’t continued to expand very nicely.
Top candidates
1)MYXUSDT
I’ll watch it first, but I won’t hard-chase at the high.
- Why it’s selected: a slight dip on the 1h timeframe, while on 6h it keeps lifting; OI on 1h increases by nearly 20%; market sentiment is clearly quite hot.
- Observation level: around 0.106—that is, near the 20-day line during the pullback.
- Trigger condition: after the pullback doesn’t break 0.106, it regains and closes back above 0.112; then see whether it continues to expand volume.
- Invalidation condition: it drops straight back below 0.106 and can’t reclaim it—this suggests the strong momentum has turned weak.
- Risk note: coins that have already stretched are the ones most likely to look very strong, and then you chase in and end up getting pulled back.
2)PIEVERSEUSDT
For this one, I’d rather wait for it to give me a pullback—I'm not interested in chasing momentum.
- Why it’s selected: it’s still relatively strong intraday; 1h has turned positive; OI continues to rise; the funding rate is also fairly moderate—this looks like a repair-type continuation.
- Observation level: around 0.78~0.80.
- Trigger condition: after pulling back, it can hold above 0.78, then it regains and stands back near 0.808.
- Invalidation condition: if it breaks below 0.78 and keeps weakening, it means the repair has failed.
- Risk note: if it’s only a rebound without follow-through, it easily turns into a back-and-forth chop.
Alternative to watch / Not chasing yet
- ARXUSDT: the position isn’t as aggressive, but OI on 1h is heading downward. I’m only treating it as an alternative to watch, not a formal follow target.
One-sentence summary:
The market is still somewhat strong today, but it’s more suitable to wait for confirmation than to rush in just because you see a surge; for MYX, watch the pullback strength, and for PIE, watch whether the repair can connect.
Contract Quantitative Brief #95|The trend is still continuing, but don’t chase at the highs; I’d rather wait for a pullback to confirm
Market status:
The chart is still somewhat strong—it's continuing in a continuation rhythm. But today isn't the kind of environment where you just rush in.
MYX was pushed up the hardest first: the 6-hour price increase and open interest are both expanding, showing enough heat, but it has also started to stretch.
PIE is still repairing, and its pace is a bit steadier than MYX.
ARX feels more like an alternative: its strength isn’t bad, but open interest hasn’t continued to expand very nicely.
Top candidates
1)MYXUSDT
I’ll watch it first, but I won’t hard-chase at the high.
- Why it’s selected: a slight dip on the 1h timeframe, while on 6h it keeps lifting; OI on 1h increases by nearly 20%; market sentiment is clearly quite hot.
- Observation level: around 0.106—that is, near the 20-day line during the pullback.
- Trigger condition: after the pullback doesn’t break 0.106, it regains and closes back above 0.112; then see whether it continues to expand volume.
- Invalidation condition: it drops straight back below 0.106 and can’t reclaim it—this suggests the strong momentum has turned weak.
- Risk note: coins that have already stretched are the ones most likely to look very strong, and then you chase in and end up getting pulled back.
2)PIEVERSEUSDT
For this one, I’d rather wait for it to give me a pullback—I'm not interested in chasing momentum.
- Why it’s selected: it’s still relatively strong intraday; 1h has turned positive; OI continues to rise; the funding rate is also fairly moderate—this looks like a repair-type continuation.
- Observation level: around 0.78~0.80.
- Trigger condition: after pulling back, it can hold above 0.78, then it regains and stands back near 0.808.
- Invalidation condition: if it breaks below 0.78 and keeps weakening, it means the repair has failed.
- Risk note: if it’s only a rebound without follow-through, it easily turns into a back-and-forth chop.
Alternative to watch / Not chasing yet
- ARXUSDT: the position isn’t as aggressive, but OI on 1h is heading downward. I’m only treating it as an alternative to watch, not a formal follow target.
One-sentence summary:
The market is still somewhat strong today, but it’s more suitable to wait for confirmation than to rush in just because you see a surge; for MYX, watch the pullback strength, and for PIE, watch whether the repair can connect.
Market status:
The chart is still somewhat strong—it's continuing in a continuation rhythm. But today isn't the kind of environment where you just rush in.
MYX was pushed up the hardest first: the 6-hour price increase and open interest are both expanding, showing enough heat, but it has also started to stretch.
PIE is still repairing, and its pace is a bit steadier than MYX.
ARX feels more like an alternative: its strength isn’t bad, but open interest hasn’t continued to expand very nicely.
Top candidates
1)MYXUSDT
I’ll watch it first, but I won’t hard-chase at the high.
- Why it’s selected: a slight dip on the 1h timeframe, while on 6h it keeps lifting; OI on 1h increases by nearly 20%; market sentiment is clearly quite hot.
- Observation level: around 0.106—that is, near the 20-day line during the pullback.
- Trigger condition: after the pullback doesn’t break 0.106, it regains and closes back above 0.112; then see whether it continues to expand volume.
- Invalidation condition: it drops straight back below 0.106 and can’t reclaim it—this suggests the strong momentum has turned weak.
- Risk note: coins that have already stretched are the ones most likely to look very strong, and then you chase in and end up getting pulled back.
2)PIEVERSEUSDT
For this one, I’d rather wait for it to give me a pullback—I'm not interested in chasing momentum.
- Why it’s selected: it’s still relatively strong intraday; 1h has turned positive; OI continues to rise; the funding rate is also fairly moderate—this looks like a repair-type continuation.
- Observation level: around 0.78~0.80.
- Trigger condition: after pulling back, it can hold above 0.78, then it regains and stands back near 0.808.
- Invalidation condition: if it breaks below 0.78 and keeps weakening, it means the repair has failed.
- Risk note: if it’s only a rebound without follow-through, it easily turns into a back-and-forth chop.
Alternative to watch / Not chasing yet
- ARXUSDT: the position isn’t as aggressive, but OI on 1h is heading downward. I’m only treating it as an alternative to watch, not a formal follow target.
One-sentence summary:
The market is still somewhat strong today, but it’s more suitable to wait for confirmation than to rush in just because you see a surge; for MYX, watch the pullback strength, and for PIE, watch whether the repair can connect.
1
808

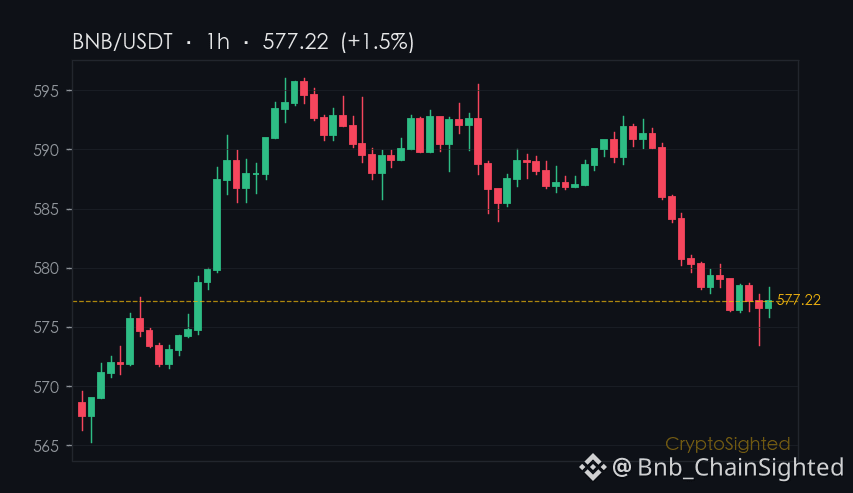
$BNB’s collateral expansion is seismic.
Binance is adding 10 bStocks tokenized securities as collateral assets - a move that’s reshaping how institutional funds interact with crypto.
This isn’t just about diversification; it’s about trust.
Will Binance’s tokenized securities become the bridge or the barrier for TradFi?
—
Not financial advice. DYOR.
📌 News Take · #95 · #CryptoNews #CryptoSighted $BNB
$BNB ’s collateral expansion is seismic.
Binance is adding 10 bStocks tokenized securities as collateral assets - a move that’s reshaping how institutional funds interact with crypto.
This isn’t just about diversification; it’s about trust.
Will Binance’s tokenized securities become the bridge or the barrier for TradFi?
—
Not financial advice. DYOR.
📌 News Take · #95 · #CryptoNews #CryptoSighted $BNB
Binance is adding 10 bStocks tokenized securities as collateral assets - a move that’s reshaping how institutional funds interact with crypto.
This isn’t just about diversification; it’s about trust.
Will Binance’s tokenized securities become the bridge or the barrier for TradFi?
—
Not financial advice. DYOR.
📌 News Take · #95 · #CryptoNews #CryptoSighted $BNB
1
200

·
--
🏆 FLIPPENING
💰 Ethereum just flipped PetroChina!
$ETH $228.82B · now #95 of all assets
Passed PetroChina ($228.80B)
🍳 Crypto vs the whole world. Not financial advice.
#CookingBNB #Crypto #Bitcoin #BTC
🏆 FLIPPENING
💰 Ethereum just flipped PetroChina!
$ETH $228.82B · now #95 of all assets
Passed PetroChina ($228.80B)
🍳 Crypto vs the whole world. Not financial advice.
#CookingBNB #Crypto #Bitcoin #BTC
💰 Ethereum just flipped PetroChina!
$ETH $228.82B · now #95 of all assets
Passed PetroChina ($228.80B)
🍳 Crypto vs the whole world. Not financial advice.
#CookingBNB #Crypto #Bitcoin #BTC

10

·
--
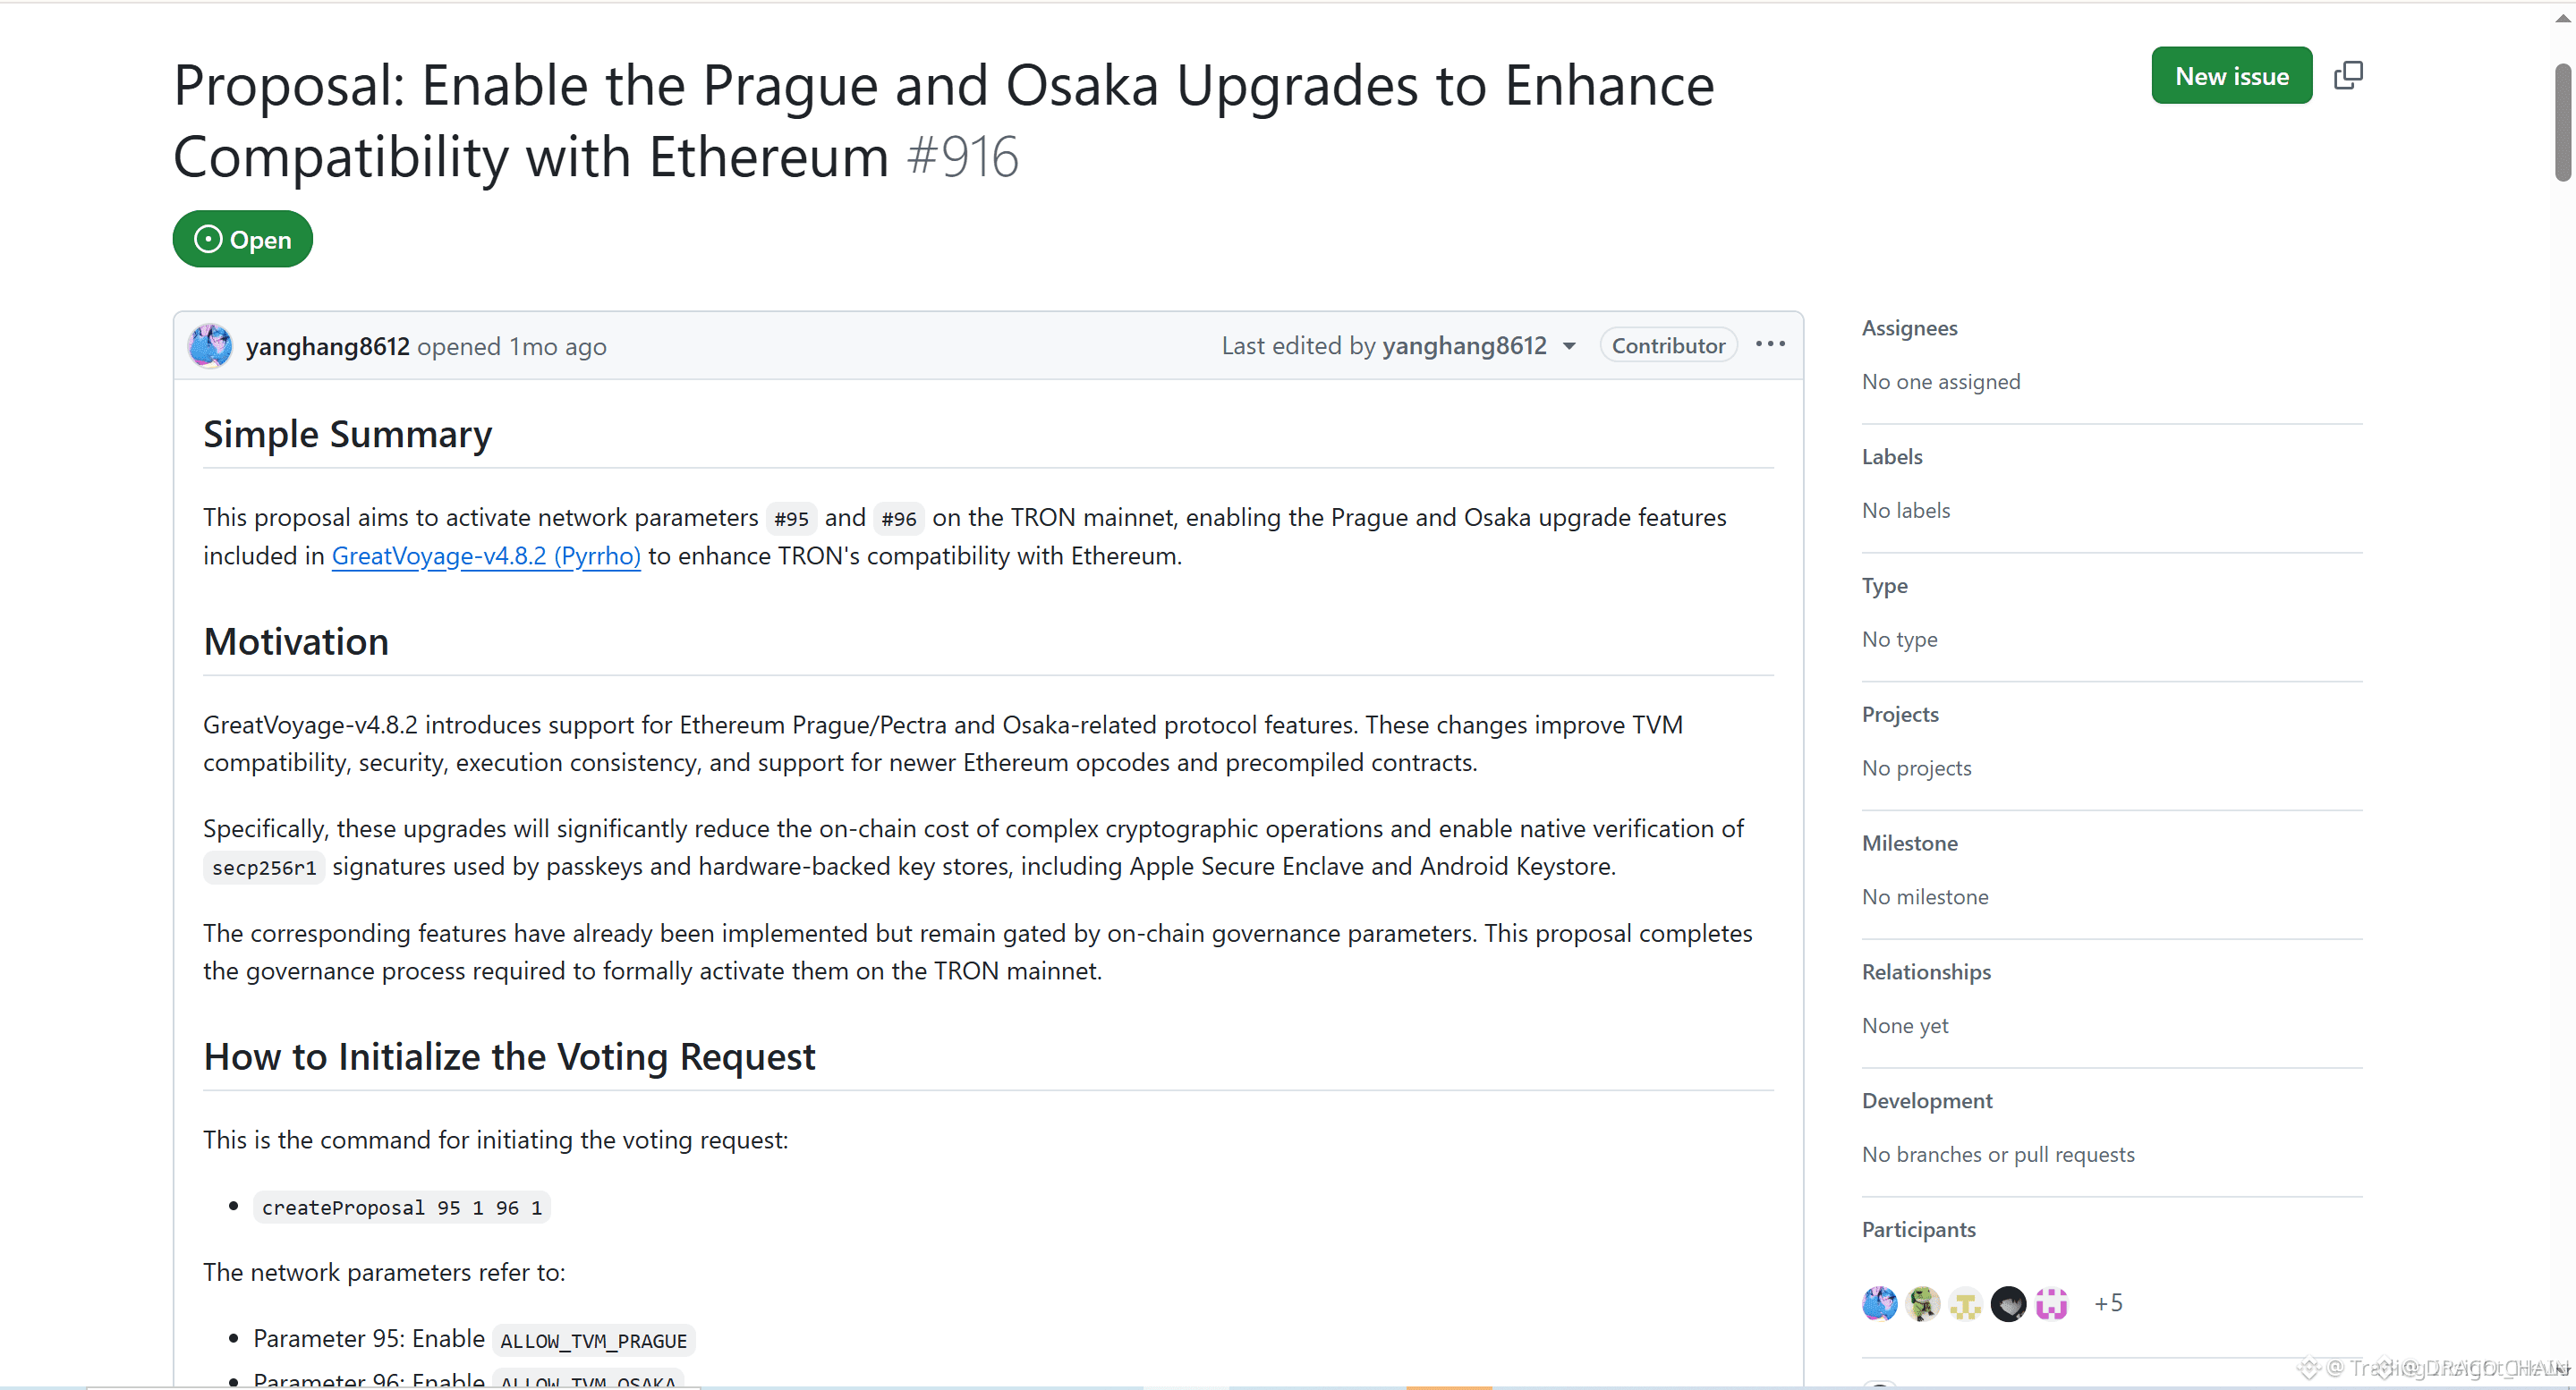
🚨 $TRX ALIGNS WITH ETHEREUM EVM STANDARDS IN MAJOR UPGRADE PROPOSAL! ⚡
The TRON community is voting on parameters #95 and #96 to activate Prague and Osaka execution features on August 25. 📊 By bridging the architectural gap with the Ethereum Virtual Machine, $TRX is systematically lowering structural friction for cross-chain capital and dApp deployments.
This upgrade enhances TVM infrastructure while maintaining high-throughput efficiency, reinforcing long-term network utility. 💡 As institutional liquidity seeks multi-chain expansion, aligning execution environments creates a powerful foundation for ecosystem order flow. 💬 Will EVM parity accelerate developer migration toward $TRX or remain a neutral structural pivot? 👇
⚠️ Not financial advice. Always manage your risk. 🛡️
🏷️ #TRX #TRON #Ethereum #Layer1 #Crypto
🎯 ⚡
🚨 $TRX ALIGNS WITH ETHEREUM EVM STANDARDS IN MAJOR UPGRADE PROPOSAL! ⚡
The TRON community is voting on parameters #95 and #96 to activate Prague and Osaka execution features on August 25. 📊 By bridging the architectural gap with the Ethereum Virtual Machine, $TRX is systematically lowering structural friction for cross-chain capital and dApp deployments.
This upgrade enhances TVM infrastructure while maintaining high-throughput efficiency, reinforcing long-term network utility. 💡 As institutional liquidity seeks multi-chain expansion, aligning execution environments creates a powerful foundation for ecosystem order flow. 💬 Will EVM parity accelerate developer migration toward $TRX or remain a neutral structural pivot? 👇
⚠️ Not financial advice. Always manage your risk. 🛡️
🏷️ #TRX #TRON #Ethereum #Layer1 #Crypto
🎯 ⚡
The TRON community is voting on parameters #95 and #96 to activate Prague and Osaka execution features on August 25. 📊 By bridging the architectural gap with the Ethereum Virtual Machine, $TRX is systematically lowering structural friction for cross-chain capital and dApp deployments.
This upgrade enhances TVM infrastructure while maintaining high-throughput efficiency, reinforcing long-term network utility. 💡 As institutional liquidity seeks multi-chain expansion, aligning execution environments creates a powerful foundation for ecosystem order flow. 💬 Will EVM parity accelerate developer migration toward $TRX or remain a neutral structural pivot? 👇
⚠️ Not financial advice. Always manage your risk. 🛡️
🏷️ #TRX #TRON #Ethereum #Layer1 #Crypto
🎯 ⚡
34

·
--
Pudgy Penguins: A Community-Driven NFT Sensation
Pudgy Penguins ($PENGU) is surging in the NFT and DeFi space, thanks to its strong community and unique utility. 🔥 Despite a slight 2.84% drop in the last 24 hours, $PENGU's $77.6M volume and #95 market cap rank highlight its growing influence. The project’s ongoing partnerships and community events are driving engagement and adoption. Traders should keep an eye on this vibrant ecosystem for potential breakout moments. 👀
Follow for more setups like this.
#HahaProfit #PudgyPenguins
Pudgy Penguins: A Community-Driven NFT Sensation
Pudgy Penguins ($PENGU ) is surging in the NFT and DeFi space, thanks to its strong community and unique utility. 🔥 Despite a slight 2.84% drop in the last 24 hours, $PENGU 's $77.6M volume and #95 market cap rank highlight its growing influence. The project’s ongoing partnerships and community events are driving engagement and adoption. Traders should keep an eye on this vibrant ecosystem for potential breakout moments. 👀
Follow for more setups like this.
#HahaProfit #PudgyPenguins
Pudgy Penguins ($PENGU ) is surging in the NFT and DeFi space, thanks to its strong community and unique utility. 🔥 Despite a slight 2.84% drop in the last 24 hours, $PENGU 's $77.6M volume and #95 market cap rank highlight its growing influence. The project’s ongoing partnerships and community events are driving engagement and adoption. Traders should keep an eye on this vibrant ecosystem for potential breakout moments. 👀
Follow for more setups like this.
#HahaProfit #PudgyPenguins

8
·
--
$LIT Now, this trading chart is in an awkward phase of “rising and then consolidating on shrinking volume.” At the beginning of July, it climbed from 2.07 to 2.68, producing a heavy-volume bullish candle. But it couldn’t hold that level—after half a month, it slid back to 2.09, and in the last 24 hours alone it’s down 7.35%. From the all-time high, it’s fallen 73%, which looks pretty grim at first glance. However, within the past 30 days, it’s only down 3.46%, suggesting it isn’t a free-fall; rather, it’s a natural pullback after the momentum from the long side has been released.
What I care about more is volume. On July 7 and July 11, during those two surges, the daily trading volume was over 150 million and 76 million respectively. In the past few days, it has already shrunk to around 20 million—only a fraction of what it was at the peak. The market cap rank is #95, and the market is about 520 million. If, going forward, no new capital comes in to support and absorb this range, low-volume consolidation is most likely to turn into a slow bleed—less like a sudden crash, and more like grinding lower day by day, making it increasingly difficult for holders to make decisions.
Those watching are waiting to see whether it breaks down or confirms the bottom on rising volume. Those holding need to figure out clearly whether this low-volume range is bottom-building with follow-through—or the prelude to a fade in momentum.
$LIT Now, this trading chart is in an awkward phase of “rising and then consolidating on shrinking volume.” At the beginning of July, it climbed from 2.07 to 2.68, producing a heavy-volume bullish candle. But it couldn’t hold that level—after half a month, it slid back to 2.09, and in the last 24 hours alone it’s down 7.35%. From the all-time high, it’s fallen 73%, which looks pretty grim at first glance. However, within the past 30 days, it’s only down 3.46%, suggesting it isn’t a free-fall; rather, it’s a natural pullback after the momentum from the long side has been released.
What I care about more is volume. On July 7 and July 11, during those two surges, the daily trading volume was over 150 million and 76 million respectively. In the past few days, it has already shrunk to around 20 million—only a fraction of what it was at the peak. The market cap rank is #95, and the market is about 520 million. If, going forward, no new capital comes in to support and absorb this range, low-volume consolidation is most likely to turn into a slow bleed—less like a sudden crash, and more like grinding lower day by day, making it increasingly difficult for holders to make decisions.
Those watching are waiting to see whether it breaks down or confirms the bottom on rising volume. Those holding need to figure out clearly whether this low-volume range is bottom-building with follow-through—or the prelude to a fade in momentum.
What I care about more is volume. On July 7 and July 11, during those two surges, the daily trading volume was over 150 million and 76 million respectively. In the past few days, it has already shrunk to around 20 million—only a fraction of what it was at the peak. The market cap rank is #95, and the market is about 520 million. If, going forward, no new capital comes in to support and absorb this range, low-volume consolidation is most likely to turn into a slow bleed—less like a sudden crash, and more like grinding lower day by day, making it increasingly difficult for holders to make decisions.
Those watching are waiting to see whether it breaks down or confirms the bottom on rising volume. Those holding need to figure out clearly whether this low-volume range is bottom-building with follow-through—or the prelude to a fade in momentum.
72

$VET -6.7% over 24h — the worst in the top 100📉 $VET -6.7% over 24h — the worst in the top 100
Summary: the move is going AGAINST the broader trend (7d/30d in the opposite direction) — it looks like a short-term rebound/correction rather than a trend reversal; volume is low — the move may be unstable.
Market context: out of 70 large coins with notable movement in the last 24h — 57 rose, 13 fell
$VET -6.7% over 24h — the worst in the top 100
📉 $VET -6.7% over 24h — the worst in the top 100
Summary: the move is going AGAINST the broader trend (7d/30d in the opposite direction) — it looks like a short-term rebound/correction rather than a trend reversal; volume is low — the move may be unstable.
Market context: out of 70 large coins with notable movement in the last 24h — 57 rose, 13 fell
Summary: the move is going AGAINST the broader trend (7d/30d in the opposite direction) — it looks like a short-term rebound/correction rather than a trend reversal; volume is low — the move may be unstable.
Market context: out of 70 large coins with notable movement in the last 24h — 57 rose, 13 fell
250
·
--
We're tracking the latest trends in the crypto market, and our community is excited about the current developments 🚀. We're seeing a shift in market capitalization ranks, with some tokens gaining traction.
Our analysis shows that tokens like NEAR Protocol and Solana are performing well, with market cap ranks of #35 and #7, respectively. Other notable tokens include Hyperliquid, ranked #11, and Pudgy Penguins, ranked #95, with changes in their market cap ranks.
We're looking forward to seeing how these trends play out, and our community is ready to adapt to the changing landscape 💡. With the crypto market constantly evolving, we're staying up-to-date on the latest developments, and we're excited about the potential for growth and innovation 📈.
$NIL, $SUPER, $AGT
We're tracking the latest trends in the crypto market, and our community is excited about the current developments 🚀. We're seeing a shift in market capitalization ranks, with some tokens gaining traction.
Our analysis shows that tokens like NEAR Protocol and Solana are performing well, with market cap ranks of #35 and #7, respectively. Other notable tokens include Hyperliquid, ranked #11, and Pudgy Penguins, ranked #95, with changes in their market cap ranks.
We're looking forward to seeing how these trends play out, and our community is ready to adapt to the changing landscape 💡. With the crypto market constantly evolving, we're staying up-to-date on the latest developments, and we're excited about the potential for growth and innovation 📈.
$NIL , $SUPER , $AGT
Our analysis shows that tokens like NEAR Protocol and Solana are performing well, with market cap ranks of #35 and #7, respectively. Other notable tokens include Hyperliquid, ranked #11, and Pudgy Penguins, ranked #95, with changes in their market cap ranks.
We're looking forward to seeing how these trends play out, and our community is ready to adapt to the changing landscape 💡. With the crypto market constantly evolving, we're staying up-to-date on the latest developments, and we're excited about the potential for growth and innovation 📈.
$NIL , $SUPER , $AGT
1
407

·
--
$LUNC
{spot}(LUNCUSDT)
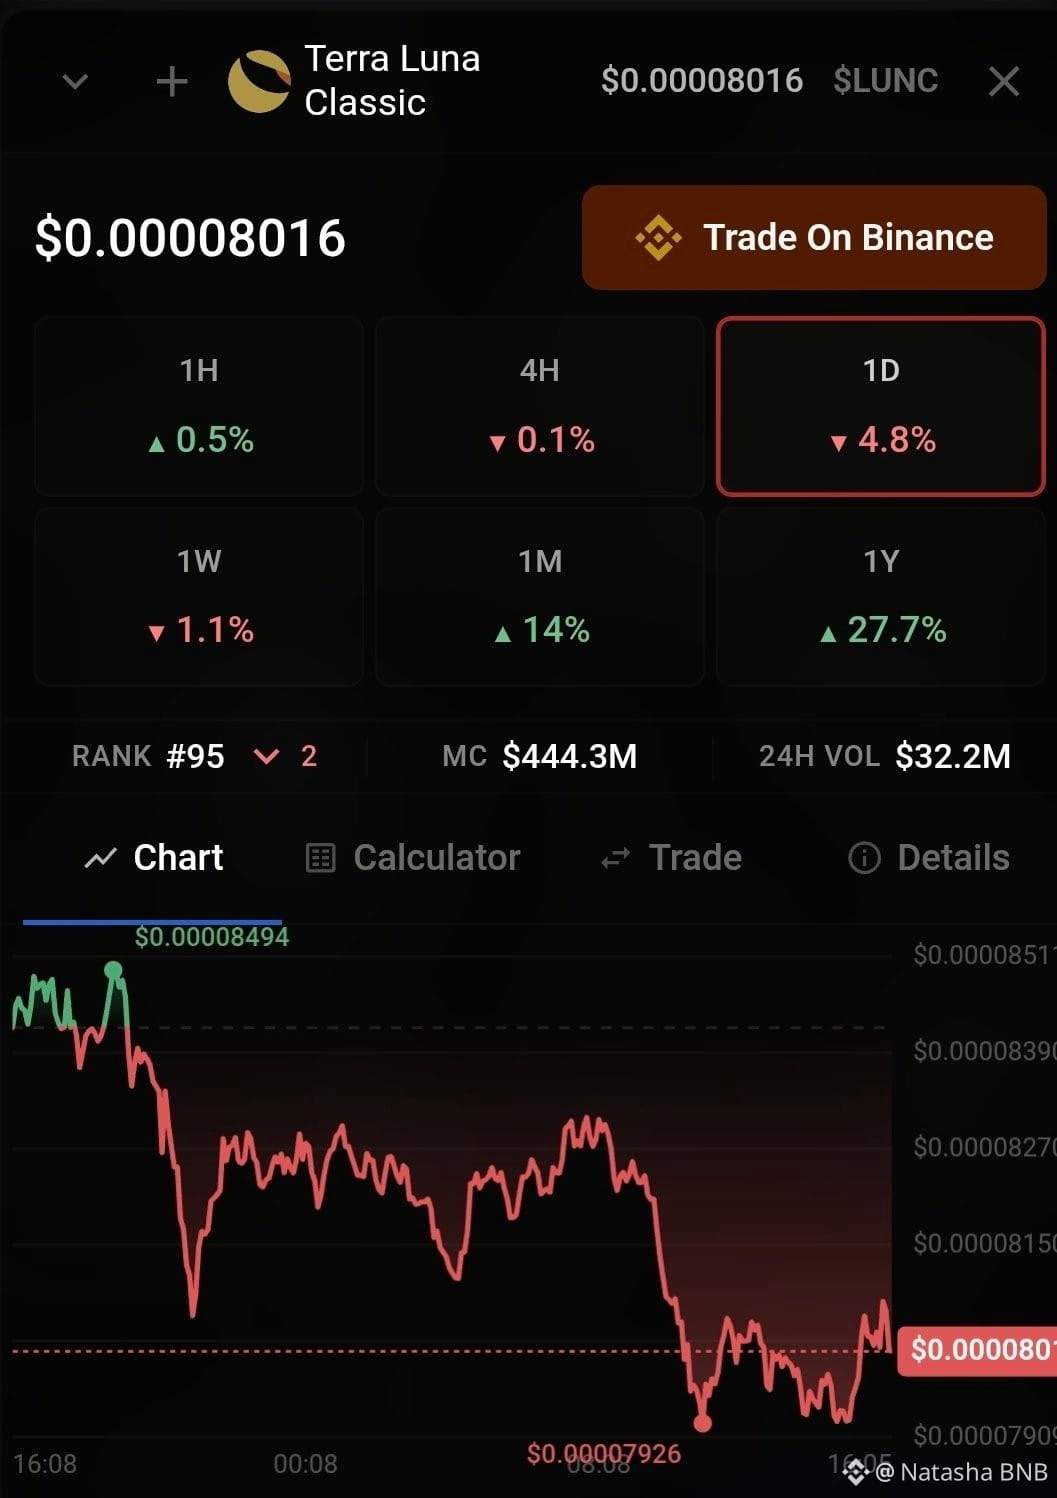
trades at $0.00008016, down 4.8% daily, ranking #95 The 24H chart shows a clear downtrend, fluctuating between $0.00007926 and $0.00008494 Despite the daily drop its market cap holds at $444.3M and its monthly performance remains up by 14%.
$LUNC
trades at $0.00008016, down 4.8% daily, ranking #95 The 24H chart shows a clear downtrend, fluctuating between $0.00007926 and $0.00008494 Despite the daily drop its market cap holds at $444.3M and its monthly performance remains up by 14%.
trades at $0.00008016, down 4.8% daily, ranking #95 The 24H chart shows a clear downtrend, fluctuating between $0.00007926 and $0.00008494 Despite the daily drop its market cap holds at $444.3M and its monthly performance remains up by 14%.
1
186
·
--
$ARB is up 4.67% today, reaching Trending—but I don’t think this is the “rebound” people are calling for. It feels more like a technical correction after liquidity has been drained. During the volume spike from July 10 to 12 (daily trading volume briefly broke 170M), the price touched $0.095. After that, the volume continued to fade steadily—today it’s only $38M, and the price has slid back toward around $0.08. The pattern is a downtrend channel with a low slope: the bounce came on reduced volume, and the pullback came with expanded volume.
What really concerns me is this: the 30-day return is +3.48%, but the 7-day performance is -1.34%, and over one year it’s down 78%. It’s still 96.58% away from ATH. That means most mid-term holders are basically sitting on deep unrealized losses, while turnover over the last month has concentrated in the $0.077–$0.095 range—and the effective cost basis of the chips has not shifted downward meaningfully. If this is really a bottom, you need to see higher and sustained volume to confirm incoming capital interest, not a thin bounce off Trending driven by only a small number of buyers pushing price upward today.
The easiest risk to overlook is that $ARB’s unlock pressure has been ongoing. With a current market cap of $540M and ranking #95, liquidity is extremely low. If any unfavorable news hits (for example, a governance proposal fails to pass or the layer2 narrative cools down), this price range could be broken through instantly.
Do you think it’s more likely to overturn the view that “this is only a rebound, not a reversal”—when trading volume ramps back up above $100M, or when the Arbitrum ecosystem sees an application that’s actually real and deployable?
$ARB is up 4.67% today, reaching Trending—but I don’t think this is the “rebound” people are calling for. It feels more like a technical correction after liquidity has been drained. During the volume spike from July 10 to 12 (daily trading volume briefly broke 170M), the price touched $0.095. After that, the volume continued to fade steadily—today it’s only $38M, and the price has slid back toward around $0.08. The pattern is a downtrend channel with a low slope: the bounce came on reduced volume, and the pullback came with expanded volume.
What really concerns me is this: the 30-day return is +3.48%, but the 7-day performance is -1.34%, and over one year it’s down 78%. It’s still 96.58% away from ATH. That means most mid-term holders are basically sitting on deep unrealized losses, while turnover over the last month has concentrated in the $0.077–$0.095 range—and the effective cost basis of the chips has not shifted downward meaningfully. If this is really a bottom, you need to see higher and sustained volume to confirm incoming capital interest, not a thin bounce off Trending driven by only a small number of buyers pushing price upward today.
The easiest risk to overlook is that $ARB ’s unlock pressure has been ongoing. With a current market cap of $540M and ranking #95, liquidity is extremely low. If any unfavorable news hits (for example, a governance proposal fails to pass or the layer2 narrative cools down), this price range could be broken through instantly.
Do you think it’s more likely to overturn the view that “this is only a rebound, not a reversal”—when trading volume ramps back up above $100M, or when the Arbitrum ecosystem sees an application that’s actually real and deployable?
What really concerns me is this: the 30-day return is +3.48%, but the 7-day performance is -1.34%, and over one year it’s down 78%. It’s still 96.58% away from ATH. That means most mid-term holders are basically sitting on deep unrealized losses, while turnover over the last month has concentrated in the $0.077–$0.095 range—and the effective cost basis of the chips has not shifted downward meaningfully. If this is really a bottom, you need to see higher and sustained volume to confirm incoming capital interest, not a thin bounce off Trending driven by only a small number of buyers pushing price upward today.
The easiest risk to overlook is that $ARB ’s unlock pressure has been ongoing. With a current market cap of $540M and ranking #95, liquidity is extremely low. If any unfavorable news hits (for example, a governance proposal fails to pass or the layer2 narrative cools down), this price range could be broken through instantly.
Do you think it’s more likely to overturn the view that “this is only a rebound, not a reversal”—when trading volume ramps back up above $100M, or when the Arbitrum ecosystem sees an application that’s actually real and deployable?
33

Log in to explore more content
Join global crypto users on Binance Square
⚡️ Get latest and useful information about crypto.
💬 Trusted by the world’s largest crypto exchange.
👍 Discover real insights from verified creators.
Email / Phone number
Trending Topics
1
#BitcoinFiveWeeklyLosses
28,248 views
618 Discussing
2
#AIChipSlumpNasdaq
14,822 views
352 Discussing
3
#NvidiaInvestigatesAfterHuang’sAffairApology
14,329 views
193 Discussing
4
#EthereumSpotETFsPost$365MWeeklyOutflow
313 views
20 Discussing
5
#TradFiForBeginners
252,727 views
2,243 Discussing
6
#SouthKoreaDraftLawTargets15To20%ShareholderCap
180,247 views
930 Discussing
7
#KeplrAdvisesSocialLoginUsersToTransferAssets
84,786 views
639 Discussing
8
#TetherPlans€28.8MForJuventusCapitalIncrease
59,256 views
470 Discussing
9
#JobsReportRaisesHikeOdds
1M views
4,654 Discussing
10
#CPITestsDecemberRateOutlook
472,944 views
2,039 Discussing