
#40
40
28,912 views
91 Discussing
Hot
Latest

·
--
$UAI On this side, I just saw a relatively breakout—on the 15m timeframe it pulled up 1.91%. Volume surged to 1.92x, with aggressive buy-side orders showing a +10.3% imbalance; buy/sell ratio is 1.23. The closing price directly pushed through the upper bound of the last 20-odd 5m candles.
What’s even more interesting is the OI: 15m is +0.07%, 1h is +0.04%. Nominals are being lifted slightly, the percentile is 79.4%, and the overall pool’s nominal change ranks at #40. Price is rising and positions are rising along with it—this structure is more like fresh leveraged long entries rather than shorts covering on hype.
In the last 24h, turnover is 51.65M, and the order book depth is sufficient—not the kind of move where you just poke in and leave. Right now it remains to see whether it can hold above the top of this range. If it can hold, there may be another leg. If volume shrinks and it falls back, then just treat it as if you didn’t see it.
$UAI On this side, I just saw a relatively breakout—on the 15m timeframe it pulled up 1.91%. Volume surged to 1.92x, with aggressive buy-side orders showing a +10.3% imbalance; buy/sell ratio is 1.23. The closing price directly pushed through the upper bound of the last 20-odd 5m candles.
What’s even more interesting is the OI: 15m is +0.07%, 1h is +0.04%. Nominals are being lifted slightly, the percentile is 79.4%, and the overall pool’s nominal change ranks at #40. Price is rising and positions are rising along with it—this structure is more like fresh leveraged long entries rather than shorts covering on hype.
In the last 24h, turnover is 51.65M, and the order book depth is sufficient—not the kind of move where you just poke in and leave. Right now it remains to see whether it can hold above the top of this range. If it can hold, there may be another leg. If volume shrinks and it falls back, then just treat it as if you didn’t see it.
What’s even more interesting is the OI: 15m is +0.07%, 1h is +0.04%. Nominals are being lifted slightly, the percentile is 79.4%, and the overall pool’s nominal change ranks at #40. Price is rising and positions are rising along with it—this structure is more like fresh leveraged long entries rather than shorts covering on hype.
In the last 24h, turnover is 51.65M, and the order book depth is sufficient—not the kind of move where you just poke in and leave. Right now it remains to see whether it can hold above the top of this range. If it can hold, there may be another leg. If volume shrinks and it falls back, then just treat it as if you didn’t see it.
3

Article
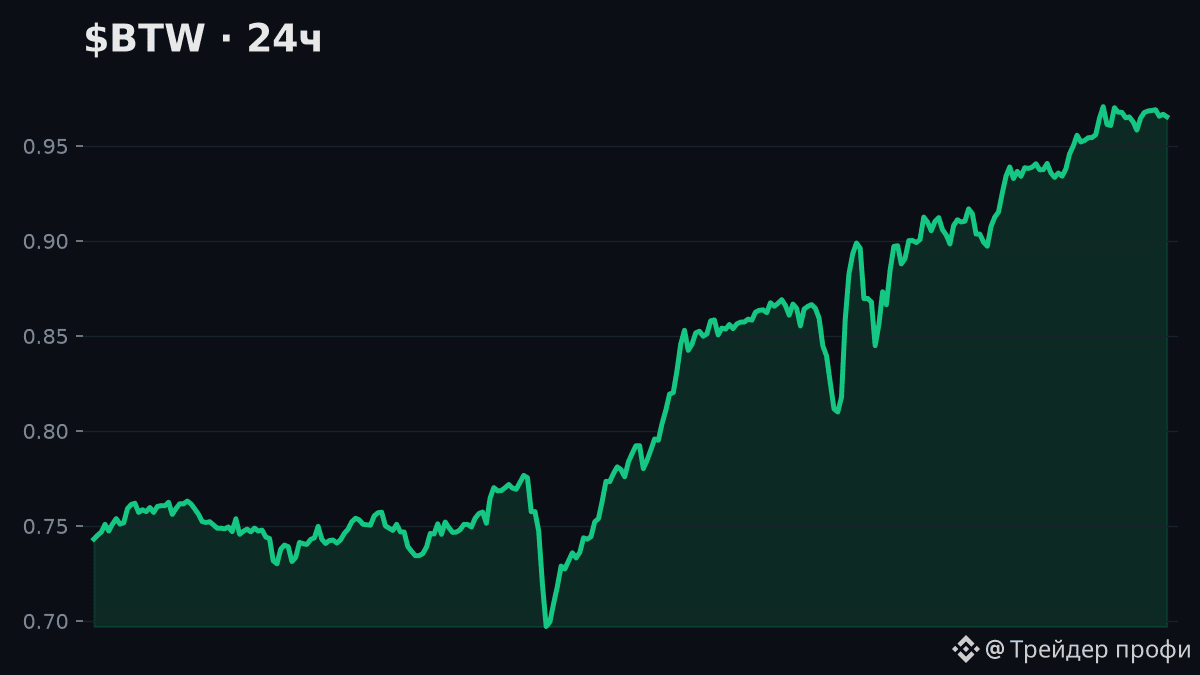
$BTW +30.1% in 24h — hit the maximum gain among the top 100!⚡ $BTW +30.1% in 24h — I hit the maximum gain among the top 100!
We collected the hottest picks for you in the last 24 hours. 🔥
🧭 Summary: the move is following a broader trend — 7D and 30D are pointing in the same direction; volume is low — the price action may be unstable.
🌍 Market context: out of 70 major coins with noticeable movement in the last 24h — 🔼 58 increased, 🔽 12 fell
$BTW +30.1% in 24h — hit the maximum gain among the top 100!
⚡ $BTW +30.1% in 24h — I hit the maximum gain among the top 100!
We collected the hottest picks for you in the last 24 hours. 🔥
🧭 Summary: the move is following a broader trend — 7D and 30D are pointing in the same direction; volume is low — the price action may be unstable.
🌍 Market context: out of 70 major coins with noticeable movement in the last 24h — 🔼 58 increased, 🔽 12 fell
We collected the hottest picks for you in the last 24 hours. 🔥
🧭 Summary: the move is following a broader trend — 7D and 30D are pointing in the same direction; volume is low — the price action may be unstable.
🌍 Market context: out of 70 major coins with noticeable movement in the last 24h — 🔼 58 increased, 🔽 12 fell
69

24h Check #40 · SOL
Direction: HIT; Conditions: confirmed. Return +12.06%; MFE 13.08%; MAE 0.33%.
Original read: upside continuation. Move evidence: +3.52% over the latest 24h window. Volume evidence: 0.72x prior 20 closed 60m candles.
Confirmation required acceptance above 100.98. Invalidation: a 1h close below 100.98.
This is a direction-only result. Conditions: confirmed. MFE/MAE show maximum favorable/adverse moves.
Lesson: confirmation held across the observed full hourly closes.
$SOL {spot}(SOLUSDT)
24h Check #40 · SOL
Direction: HIT; Conditions: confirmed. Return +12.06%; MFE 13.08%; MAE 0.33%.
Original read: upside continuation. Move evidence: +3.52% over the latest 24h window. Volume evidence: 0.72x prior 20 closed 60m candles.
Confirmation required acceptance above 100.98. Invalidation: a 1h close below 100.98.
This is a direction-only result. Conditions: confirmed. MFE/MAE show maximum favorable/adverse moves.
Lesson: confirmation held across the observed full hourly closes.
$SOL
Direction: HIT; Conditions: confirmed. Return +12.06%; MFE 13.08%; MAE 0.33%.
Original read: upside continuation. Move evidence: +3.52% over the latest 24h window. Volume evidence: 0.72x prior 20 closed 60m candles.
Confirmation required acceptance above 100.98. Invalidation: a 1h close below 100.98.
This is a direction-only result. Conditions: confirmed. MFE/MAE show maximum favorable/adverse moves.
Lesson: confirmation held across the observed full hourly closes.
$SOL
108
·
--
$RENDER has something.
On the 15m, it directly topped up to about 20 of the 5m band’s upper edge, with volume at 2.55x, and the aggressive buy/sell ratio at 2.06—this isn’t a retail trader casually pushing it.
The key is OI—15m +1.19%, 1h +1.28%, an anomalous percentile of 98.4%, and the nominal change across the whole pool is #40. Price is rising along with open interest; new leveraged longs are entering—this isn’t a fake move from short covering.
If it continues across several cycles, the whole pool is anomalous #6. At this position, it’s either pre-launch buildup or a trap set for people chasing. The 24h trading value is only 21M, liquidity isn’t very thick. One big bullish candle can push it up, and one big bearish candle can also smash it.
I’m watching—no rush to act.
$RENDER has something.
On the 15m, it directly topped up to about 20 of the 5m band’s upper edge, with volume at 2.55x, and the aggressive buy/sell ratio at 2.06—this isn’t a retail trader casually pushing it.
The key is OI—15m +1.19%, 1h +1.28%, an anomalous percentile of 98.4%, and the nominal change across the whole pool is #40. Price is rising along with open interest; new leveraged longs are entering—this isn’t a fake move from short covering.
If it continues across several cycles, the whole pool is anomalous #6. At this position, it’s either pre-launch buildup or a trap set for people chasing. The 24h trading value is only 21M, liquidity isn’t very thick. One big bullish candle can push it up, and one big bearish candle can also smash it.
I’m watching—no rush to act.
On the 15m, it directly topped up to about 20 of the 5m band’s upper edge, with volume at 2.55x, and the aggressive buy/sell ratio at 2.06—this isn’t a retail trader casually pushing it.
The key is OI—15m +1.19%, 1h +1.28%, an anomalous percentile of 98.4%, and the nominal change across the whole pool is #40. Price is rising along with open interest; new leveraged longs are entering—this isn’t a fake move from short covering.
If it continues across several cycles, the whole pool is anomalous #6. At this position, it’s either pre-launch buildup or a trap set for people chasing. The 24h trading value is only 21M, liquidity isn’t very thick. One big bullish candle can push it up, and one big bearish candle can also smash it.
I’m watching—no rush to act.
2
Radar #40 · SOL
Level first: the upside continuation read needs acceptance above 100.98; a brief wick is not enough.
Move evidence: +3.52% over the latest 24h window. Volume evidence: 0.72x prior 20 closed 60m candles. Invalidation: a 1h close below 100.98.
Confirmation needs one full 1h close; invalidation takes priority. The 24h review separates direction from these conditions. Market observation, not a certainty.
The next full hourly close is the test; a wick alone does not confirm this read.
$SOL {spot}(SOLUSDT)
Radar #40 · SOL
Level first: the upside continuation read needs acceptance above 100.98; a brief wick is not enough.
Move evidence: +3.52% over the latest 24h window. Volume evidence: 0.72x prior 20 closed 60m candles. Invalidation: a 1h close below 100.98.
Confirmation needs one full 1h close; invalidation takes priority. The 24h review separates direction from these conditions. Market observation, not a certainty.
The next full hourly close is the test; a wick alone does not confirm this read.
$SOL
Level first: the upside continuation read needs acceptance above 100.98; a brief wick is not enough.
Move evidence: +3.52% over the latest 24h window. Volume evidence: 0.72x prior 20 closed 60m candles. Invalidation: a 1h close below 100.98.
Confirmation needs one full 1h close; invalidation takes priority. The 24h review separates direction from these conditions. Market observation, not a certainty.
The next full hourly close is the test; a wick alone does not confirm this read.
$SOL
102
·
--
$CAKE I just scanned a somewhat interesting structure over here.
On the 15m timeframe it dropped 0.53%. It doesn’t look like much, but the closing price directly broke below the lower edge of the recent ~20 5m ranges. The key isn’t the size of the drop—it’s the trading volume: 2.24x the usual level, with a buy/sell ratio of 0.61 and an aggressive trade difference of -24.6%. This suggests that this move was truly being hit by real sell orders, not some fake breakout created by thin liquidity.
What’s even more interesting is the OI direction. As price fell, OI also went down. Over the 1h contracts, the notional decreased by roughly 95K U. This doesn’t look like fresh shorts entering; it looks more like longs are deleveraging, sweeping stops, or someone is quietly reducing positions. The abnormal percentile is 84.7%, placing it in Pool #11—not the most eye-catching—but the notional change ranks around #40. That means the overall position reduction is more pronounced than what the surface price action alone suggests.
The 24h trading value is only a bit over 15M, and the pool was never very deep. With volume like this to expand and then break through the boundary, the question is how strong the bid/support is on the short side overhead. For now, I’m watching just two things: after the breakdown, whether there’s a pullback to confirm the range low as resistance, and whether OI keeps declining. If price starts moving sideways but OI keeps shrinking, then basically it’s position drawdown—not just churn.
For now, note it down. No rush.
$CAKE I just scanned a somewhat interesting structure over here.
On the 15m timeframe it dropped 0.53%. It doesn’t look like much, but the closing price directly broke below the lower edge of the recent ~20 5m ranges. The key isn’t the size of the drop—it’s the trading volume: 2.24x the usual level, with a buy/sell ratio of 0.61 and an aggressive trade difference of -24.6%. This suggests that this move was truly being hit by real sell orders, not some fake breakout created by thin liquidity.
What’s even more interesting is the OI direction. As price fell, OI also went down. Over the 1h contracts, the notional decreased by roughly 95K U. This doesn’t look like fresh shorts entering; it looks more like longs are deleveraging, sweeping stops, or someone is quietly reducing positions. The abnormal percentile is 84.7%, placing it in Pool #11—not the most eye-catching—but the notional change ranks around #40. That means the overall position reduction is more pronounced than what the surface price action alone suggests.
The 24h trading value is only a bit over 15M, and the pool was never very deep. With volume like this to expand and then break through the boundary, the question is how strong the bid/support is on the short side overhead. For now, I’m watching just two things: after the breakdown, whether there’s a pullback to confirm the range low as resistance, and whether OI keeps declining. If price starts moving sideways but OI keeps shrinking, then basically it’s position drawdown—not just churn.
For now, note it down. No rush.
On the 15m timeframe it dropped 0.53%. It doesn’t look like much, but the closing price directly broke below the lower edge of the recent ~20 5m ranges. The key isn’t the size of the drop—it’s the trading volume: 2.24x the usual level, with a buy/sell ratio of 0.61 and an aggressive trade difference of -24.6%. This suggests that this move was truly being hit by real sell orders, not some fake breakout created by thin liquidity.
What’s even more interesting is the OI direction. As price fell, OI also went down. Over the 1h contracts, the notional decreased by roughly 95K U. This doesn’t look like fresh shorts entering; it looks more like longs are deleveraging, sweeping stops, or someone is quietly reducing positions. The abnormal percentile is 84.7%, placing it in Pool #11—not the most eye-catching—but the notional change ranks around #40. That means the overall position reduction is more pronounced than what the surface price action alone suggests.
The 24h trading value is only a bit over 15M, and the pool was never very deep. With volume like this to expand and then break through the boundary, the question is how strong the bid/support is on the short side overhead. For now, I’m watching just two things: after the breakdown, whether there’s a pullback to confirm the range low as resistance, and whether OI keeps declining. If price starts moving sideways but OI keeps shrinking, then basically it’s position drawdown—not just churn.
For now, note it down. No rush.
6

·
--
$ARK These 15 minutes are kind of interesting. The price moved up by 2 points, and trading volume went straight to 1.9x. The buy-sell ratio is 1.17, and the aggressive buy orders are relatively strong.
The key is the OI—15m contract +1.5%, notional +3.42%, yet the 1h trend is still barely down. This combination doesn’t really look like a short-covering bounce. It looks more like new long positions are adding leverage at this level.
The anomaly percentile is 77%, and it’s pool #40. The data does show money moving. 24h trading volume is 138 million, and the order book depth is also sufficient—this isn’t the kind of market that slips right away after you push it up.
But what this structure fears most is this: leverage increases fast, and withdrawals happen just as fast. I’ll watch it for now—I’m not in a hurry to chase.
$ARK These 15 minutes are kind of interesting. The price moved up by 2 points, and trading volume went straight to 1.9x. The buy-sell ratio is 1.17, and the aggressive buy orders are relatively strong.
The key is the OI—15m contract +1.5%, notional +3.42%, yet the 1h trend is still barely down. This combination doesn’t really look like a short-covering bounce. It looks more like new long positions are adding leverage at this level.
The anomaly percentile is 77%, and it’s pool #40. The data does show money moving. 24h trading volume is 138 million, and the order book depth is also sufficient—this isn’t the kind of market that slips right away after you push it up.
But what this structure fears most is this: leverage increases fast, and withdrawals happen just as fast. I’ll watch it for now—I’m not in a hurry to chase.
The key is the OI—15m contract +1.5%, notional +3.42%, yet the 1h trend is still barely down. This combination doesn’t really look like a short-covering bounce. It looks more like new long positions are adding leverage at this level.
The anomaly percentile is 77%, and it’s pool #40. The data does show money moving. 24h trading volume is 138 million, and the order book depth is also sufficient—this isn’t the kind of market that slips right away after you push it up.
But what this structure fears most is this: leverage increases fast, and withdrawals happen just as fast. I’ll watch it for now—I’m not in a hurry to chase.
6
·
--
$MORPHO This 15m move is kind of brutal.
The price broke below the lower bound of the prior 20 five-minute range, and the volume directly surged to 4.34x normal. Passive/active volume imbalance is -50.3%, and the buy-sell ratio is 0.33—sell orders are basically hammering down on bids. But interestingly, OI didn’t spike dramatically: the 15m contract -0.21%, 1h -0.30%, and nominal changes aren’t much either, around -133K/-223K.
What does that mean? It’s not that new shorts came in to smash the market; it’s more like longs are shrinking their positions. Deleveraging, stop-losses, or actively reducing exposure—price falls and OI drops. This is the typical long capitulation structure, not one dominated by shorting.
However, pay attention to one detail: the OI abnormal percentile is 93.3%, the whole-pool abnormal is #8, and the nominal change is #40. With price near an extreme range plus an amplified abnormal increase in volume, this combination usually isn’t a quiet bottom-building pattern. 24h turnover is only 6.77M and the pool isn’t deep—just a few large orders can push the price through. On the flip side, if support/acceptance comes in, it can also be pulled back relatively easily.
The key now isn’t just the price—it’s where OI goes next. If OI keeps dropping and price stabilizes, that’s a signal that the clearing is over. If OI starts to rise while price continues to weaken, then that’s when real shorting pressure is showing up.
Just watch for now, no rush. With this liquidity depth, wick spikes and snapbacks are both very normal.
$MORPHO This 15m move is kind of brutal.
The price broke below the lower bound of the prior 20 five-minute range, and the volume directly surged to 4.34x normal. Passive/active volume imbalance is -50.3%, and the buy-sell ratio is 0.33—sell orders are basically hammering down on bids. But interestingly, OI didn’t spike dramatically: the 15m contract -0.21%, 1h -0.30%, and nominal changes aren’t much either, around -133K/-223K.
What does that mean? It’s not that new shorts came in to smash the market; it’s more like longs are shrinking their positions. Deleveraging, stop-losses, or actively reducing exposure—price falls and OI drops. This is the typical long capitulation structure, not one dominated by shorting.
However, pay attention to one detail: the OI abnormal percentile is 93.3%, the whole-pool abnormal is #8, and the nominal change is #40. With price near an extreme range plus an amplified abnormal increase in volume, this combination usually isn’t a quiet bottom-building pattern. 24h turnover is only 6.77M and the pool isn’t deep—just a few large orders can push the price through. On the flip side, if support/acceptance comes in, it can also be pulled back relatively easily.
The key now isn’t just the price—it’s where OI goes next. If OI keeps dropping and price stabilizes, that’s a signal that the clearing is over. If OI starts to rise while price continues to weaken, then that’s when real shorting pressure is showing up.
Just watch for now, no rush. With this liquidity depth, wick spikes and snapbacks are both very normal.
The price broke below the lower bound of the prior 20 five-minute range, and the volume directly surged to 4.34x normal. Passive/active volume imbalance is -50.3%, and the buy-sell ratio is 0.33—sell orders are basically hammering down on bids. But interestingly, OI didn’t spike dramatically: the 15m contract -0.21%, 1h -0.30%, and nominal changes aren’t much either, around -133K/-223K.
What does that mean? It’s not that new shorts came in to smash the market; it’s more like longs are shrinking their positions. Deleveraging, stop-losses, or actively reducing exposure—price falls and OI drops. This is the typical long capitulation structure, not one dominated by shorting.
However, pay attention to one detail: the OI abnormal percentile is 93.3%, the whole-pool abnormal is #8, and the nominal change is #40. With price near an extreme range plus an amplified abnormal increase in volume, this combination usually isn’t a quiet bottom-building pattern. 24h turnover is only 6.77M and the pool isn’t deep—just a few large orders can push the price through. On the flip side, if support/acceptance comes in, it can also be pulled back relatively easily.
The key now isn’t just the price—it’s where OI goes next. If OI keeps dropping and price stabilizes, that’s a signal that the clearing is over. If OI starts to rise while price continues to weaken, then that’s when real shorting pressure is showing up.
Just watch for now, no rush. With this liquidity depth, wick spikes and snapbacks are both very normal.
1
20

·
--
$ORCA This side has a bit of interest.
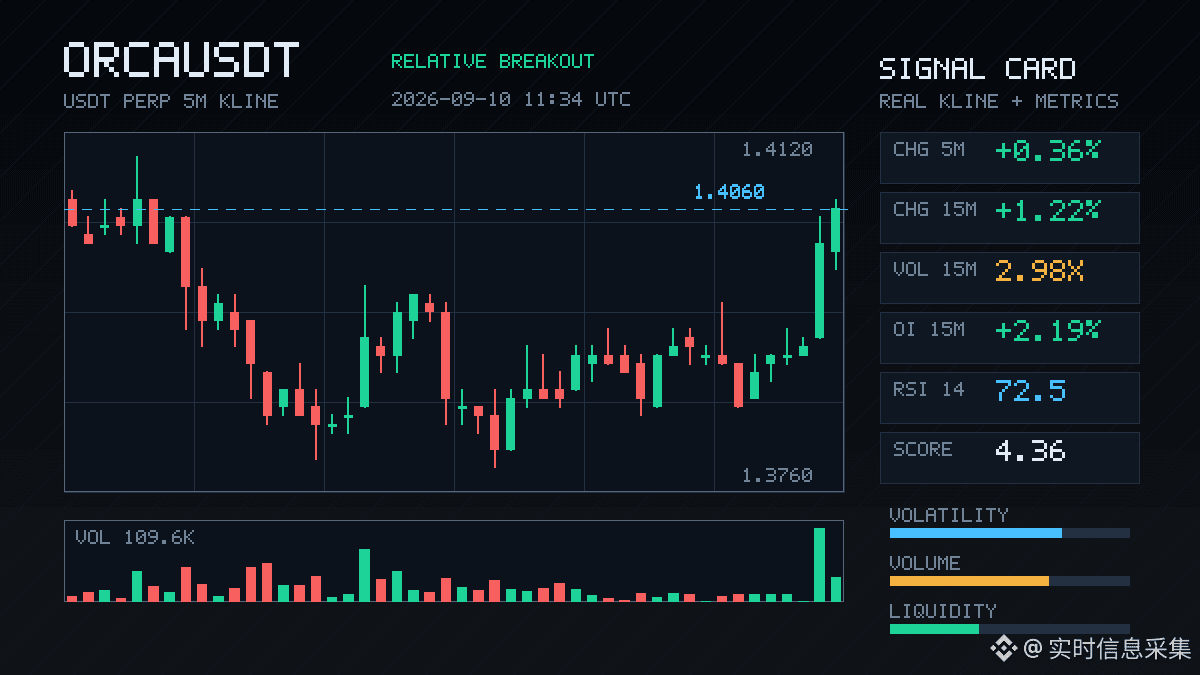
In 15m, it directly pulled up 1.22%. Volume reached 2.98x, Z value is 2.86, and the closing price broke above the upper edge of roughly the last 20 five-minute bars—so this is a short-term structural breakdown. But the aggressive trade difference is -7.6%, and the buy/sell ratio is only 0.86, which suggests that the aggressive buy orders during this upswing didn’t really keep up; it was more like price was pushed along passively.
What’s strange is the OI. Both the 15m and 1h are around +2%, with nominal OI up by 122K, and the abnormal percentile reached 97.6%. It ranks #1 in the abnormal list across the whole pool, yet the nominal change ranks only #40. This combination feels split—meaning “sentiment concentration is high, but the capital size isn’t that big.”
Price is up + OI is up, which is a typical sign of new leveraged long positions entering. But now it’s getting stuck near its own historical extreme range. With multiple consecutive cycles extending and depth also confirming, at times like this there are usually two outcomes: either it keeps accelerating and squeezes again, or it turns into the prelude to many more liquidations—sell kills sell.
In the last 24h, trading value is only 12.72M, so the pool isn’t deep. Watch out for slippage. I’m watching it—no action yet—just see if it can hold its ground at the boundary.
$ORCA This side has a bit of interest.
In 15m, it directly pulled up 1.22%. Volume reached 2.98x, Z value is 2.86, and the closing price broke above the upper edge of roughly the last 20 five-minute bars—so this is a short-term structural breakdown. But the aggressive trade difference is -7.6%, and the buy/sell ratio is only 0.86, which suggests that the aggressive buy orders during this upswing didn’t really keep up; it was more like price was pushed along passively.
What’s strange is the OI. Both the 15m and 1h are around +2%, with nominal OI up by 122K, and the abnormal percentile reached 97.6%. It ranks #1 in the abnormal list across the whole pool, yet the nominal change ranks only #40. This combination feels split—meaning “sentiment concentration is high, but the capital size isn’t that big.”
Price is up + OI is up, which is a typical sign of new leveraged long positions entering. But now it’s getting stuck near its own historical extreme range. With multiple consecutive cycles extending and depth also confirming, at times like this there are usually two outcomes: either it keeps accelerating and squeezes again, or it turns into the prelude to many more liquidations—sell kills sell.
In the last 24h, trading value is only 12.72M, so the pool isn’t deep. Watch out for slippage. I’m watching it—no action yet—just see if it can hold its ground at the boundary.
In 15m, it directly pulled up 1.22%. Volume reached 2.98x, Z value is 2.86, and the closing price broke above the upper edge of roughly the last 20 five-minute bars—so this is a short-term structural breakdown. But the aggressive trade difference is -7.6%, and the buy/sell ratio is only 0.86, which suggests that the aggressive buy orders during this upswing didn’t really keep up; it was more like price was pushed along passively.
What’s strange is the OI. Both the 15m and 1h are around +2%, with nominal OI up by 122K, and the abnormal percentile reached 97.6%. It ranks #1 in the abnormal list across the whole pool, yet the nominal change ranks only #40. This combination feels split—meaning “sentiment concentration is high, but the capital size isn’t that big.”
Price is up + OI is up, which is a typical sign of new leveraged long positions entering. But now it’s getting stuck near its own historical extreme range. With multiple consecutive cycles extending and depth also confirming, at times like this there are usually two outcomes: either it keeps accelerating and squeezes again, or it turns into the prelude to many more liquidations—sell kills sell.
In the last 24h, trading value is only 12.72M, so the pool isn’t deep. Watch out for slippage. I’m watching it—no action yet—just see if it can hold its ground at the boundary.
12

·
--
40% surge, but the long/short ratio is actually 50/50?
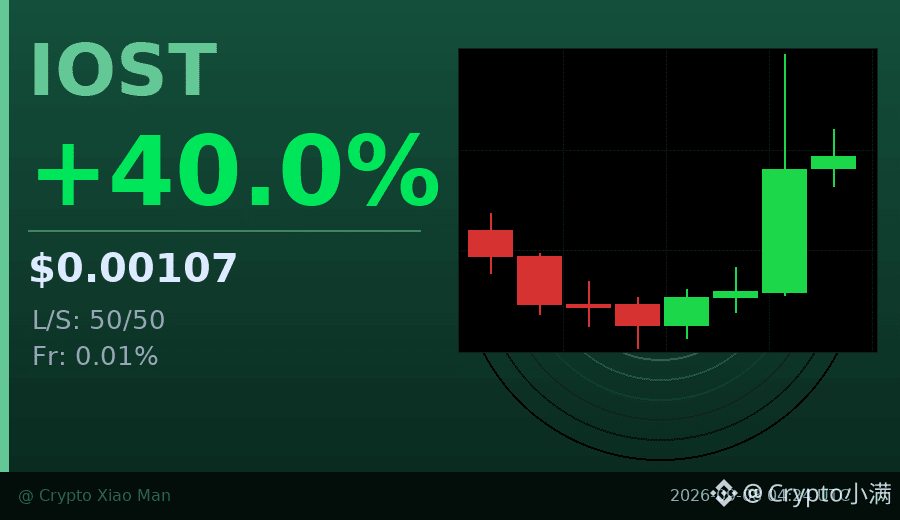
IOST is up 0.0010686 today. The 24-hour increase is over 40%, with trading volume of 219 million USDT.
Usually, such a big move comes with one-sided long positions. But now the long/short ratio is balanced at 50% to 50%. What does this mean? It suggests this breakout surge isn’t being driven by leverage—instead, spot buyers are in control.
The hourly chart has already printed three consecutive bullish candles, and the funding rate is only 0.01%, meaning there’s almost no pressure from leverage costs. If trading volume can hold up going forward, this kind of “healthy” rally is actually more sustainable.
$IOST #异动币种 #40%涨幅
Click the small card below to quickly view the market👇
40% surge, but the long/short ratio is actually 50/50?
IOST is up 0.0010686 today. The 24-hour increase is over 40%, with trading volume of 219 million USDT.
Usually, such a big move comes with one-sided long positions. But now the long/short ratio is balanced at 50% to 50%. What does this mean? It suggests this breakout surge isn’t being driven by leverage—instead, spot buyers are in control.
The hourly chart has already printed three consecutive bullish candles, and the funding rate is only 0.01%, meaning there’s almost no pressure from leverage costs. If trading volume can hold up going forward, this kind of “healthy” rally is actually more sustainable.
$IOST #异动币种 #40%涨幅
Click the small card below to quickly view the market👇
IOST is up 0.0010686 today. The 24-hour increase is over 40%, with trading volume of 219 million USDT.
Usually, such a big move comes with one-sided long positions. But now the long/short ratio is balanced at 50% to 50%. What does this mean? It suggests this breakout surge isn’t being driven by leverage—instead, spot buyers are in control.
The hourly chart has already printed three consecutive bullish candles, and the funding rate is only 0.01%, meaning there’s almost no pressure from leverage costs. If trading volume can hold up going forward, this kind of “healthy” rally is actually more sustainable.
$IOST #异动币种 #40%涨幅
Click the small card below to quickly view the market👇
89
·
--
$RAYSOL This 15-minute move is kind of interesting—+1.77% straight up breaks through the upper boundary of the recent range of nearly 20 five-minute K-bars. Volume also spiked to 3.76 times the usual level. Even more worth noticing is that OI is rising: the 15-minute notional change is +2.06%. This is new leveraged long capital entering, not that kind of “false uptick” caused by short covering.
The overall abnormality for the whole pool ranks #40, and the notional change is also within the top 34. The market structure is a bullish convergence where price and OI are both resonating upward. In a setup like this, the proportion of aggressive buy orders is 1.36, and the direction is very clear.
That said, don’t forget that on the 1-hour scale, OI is actually shrinking: -0.55% suggests some older positions are taking the opportunity to unload at higher prices. In the short run, incremental capital is pushing the move—just weigh whether this level’s momentum is sustainable before chasing higher. $RAYSOL
$RAYSOL This 15-minute move is kind of interesting—+1.77% straight up breaks through the upper boundary of the recent range of nearly 20 five-minute K-bars. Volume also spiked to 3.76 times the usual level. Even more worth noticing is that OI is rising: the 15-minute notional change is +2.06%. This is new leveraged long capital entering, not that kind of “false uptick” caused by short covering.
The overall abnormality for the whole pool ranks #40, and the notional change is also within the top 34. The market structure is a bullish convergence where price and OI are both resonating upward. In a setup like this, the proportion of aggressive buy orders is 1.36, and the direction is very clear.
That said, don’t forget that on the 1-hour scale, OI is actually shrinking: -0.55% suggests some older positions are taking the opportunity to unload at higher prices. In the short run, incremental capital is pushing the move—just weigh whether this level’s momentum is sustainable before chasing higher. $RAYSOL
The overall abnormality for the whole pool ranks #40, and the notional change is also within the top 34. The market structure is a bullish convergence where price and OI are both resonating upward. In a setup like this, the proportion of aggressive buy orders is 1.36, and the direction is very clear.
That said, don’t forget that on the 1-hour scale, OI is actually shrinking: -0.55% suggests some older positions are taking the opportunity to unload at higher prices. In the short run, incremental capital is pushing the move—just weigh whether this level’s momentum is sustainable before chasing higher. $RAYSOL
132

·
--
** "But Why Is It Still Below Its Value at 78K?"Bittensor (TAOUSDT) is trending right now!
Rank: #40
** I think that in these days when ' has reached $78,901.99, everyone’s asking the same question: "Has the bull market started?" But personally, I believe ' is still below its true value. Even though '’s market cap currently looks quite high, the daily trading volume is at the level of $24.45 billion. This figure shows the market is still active. However, what catches my attention is that ' has settled around the $2,475.24 mark. It usually follows '’s trends, but right now it isn’t showing too much movement. In the short term, ' may be expected to break above $80,000, but in the long run, the market needs to become even more stable. My prediction is that ' could reach the $90,000 range by the end of the year. What do you think—will it go past 80K?
** "But Why Is It Still Below Its Value at 78K?"
Bittensor (TAOUSDT) is trending right now!
Rank: #40
** I think that in these days when ' has reached $78,901.99, everyone’s asking the same question: "Has the bull market started?" But personally, I believe ' is still below its true value. Even though '’s market cap currently looks quite high, the daily trading volume is at the level of $24.45 billion. This figure shows the market is still active. However, what catches my attention is that ' has settled around the $2,475.24 mark. It usually follows '’s trends, but right now it isn’t showing too much movement. In the short term, ' may be expected to break above $80,000, but in the long run, the market needs to become even more stable. My prediction is that ' could reach the $90,000 range by the end of the year. What do you think—will it go past 80K?
Rank: #40
** I think that in these days when ' has reached $78,901.99, everyone’s asking the same question: "Has the bull market started?" But personally, I believe ' is still below its true value. Even though '’s market cap currently looks quite high, the daily trading volume is at the level of $24.45 billion. This figure shows the market is still active. However, what catches my attention is that ' has settled around the $2,475.24 mark. It usually follows '’s trends, but right now it isn’t showing too much movement. In the short term, ' may be expected to break above $80,000, but in the long run, the market needs to become even more stable. My prediction is that ' could reach the $90,000 range by the end of the year. What do you think—will it go past 80K?
2

🚨 Trade Setup | TAO
Direction: Bullish
📊 Why this trade:
- Multi-timeframe momentum aligned: 7d +15%, 30d +34%, 60d +28%
- 24h +11.7% on volume = 18.4% of market cap (real absorption)
- AI + DePIN + Layer-1 narrative, $2.53B market cap (rank #40)
🔥 Key insight:
This is NOT a slow move — momentum phase just started.
🎯 Trade Plan:
Entry: $263.6 (current zone)
Target: $279.4
Stop: $257.0
⚖️ Risk/Reward: ~2.4:1
⚠️ Risk: Medium-high
If price loses $257.0, momentum likely invalidated.
(Not financial advice)
🚨 Trade Setup | TAO
Direction: Bullish
📊 Why this trade:
- Multi-timeframe momentum aligned: 7d +15%, 30d +34%, 60d +28%
- 24h +11.7% on volume = 18.4% of market cap (real absorption)
- AI + DePIN + Layer-1 narrative, $2.53B market cap (rank #40)
🔥 Key insight:
This is NOT a slow move — momentum phase just started.
🎯 Trade Plan:
Entry: $263.6 (current zone)
Target: $279.4
Stop: $257.0
⚖️ Risk/Reward: ~2.4:1
⚠️ Risk: Medium-high
If price loses $257.0, momentum likely invalidated.
(Not financial advice)
Direction: Bullish
📊 Why this trade:
- Multi-timeframe momentum aligned: 7d +15%, 30d +34%, 60d +28%
- 24h +11.7% on volume = 18.4% of market cap (real absorption)
- AI + DePIN + Layer-1 narrative, $2.53B market cap (rank #40)
🔥 Key insight:
This is NOT a slow move — momentum phase just started.
🎯 Trade Plan:
Entry: $263.6 (current zone)
Target: $279.4
Stop: $257.0
⚖️ Risk/Reward: ~2.4:1
⚠️ Risk: Medium-high
If price loses $257.0, momentum likely invalidated.
(Not financial advice)
277


·
--
I’ve checked CoinGecko’s trending list: SHRUB +12%, FIRO +8%, PONS +15%—all climbing despite modest ranks. I’m optimistic about their growth potential.
ZEC +4% holds rank #9, JUP +9% rises in DeFi, and ZCAT +7% spikes after a new partnership. These gains signal strong community support. 🔥
TAO +10% at rank #40 caught my eye; I’m tweaking my portfolio to ride this momentum. I’m already reallocating a slice of my holdings to capture upside. 🚀
$RAY, $METIS, $RAYSOL
I’ve checked CoinGecko’s trending list: SHRUB +12%, FIRO +8%, PONS +15%—all climbing despite modest ranks. I’m optimistic about their growth potential.
ZEC +4% holds rank #9, JUP +9% rises in DeFi, and ZCAT +7% spikes after a new partnership. These gains signal strong community support. 🔥
TAO +10% at rank #40 caught my eye; I’m tweaking my portfolio to ride this momentum. I’m already reallocating a slice of my holdings to capture upside. 🚀
$RAY , $METIS , $RAYSOL
ZEC +4% holds rank #9, JUP +9% rises in DeFi, and ZCAT +7% spikes after a new partnership. These gains signal strong community support. 🔥
TAO +10% at rank #40 caught my eye; I’m tweaking my portfolio to ride this momentum. I’m already reallocating a slice of my holdings to capture upside. 🚀
$RAY , $METIS , $RAYSOL
1.2k
·
--
40% increase, but the funding rate is only 0.01%?
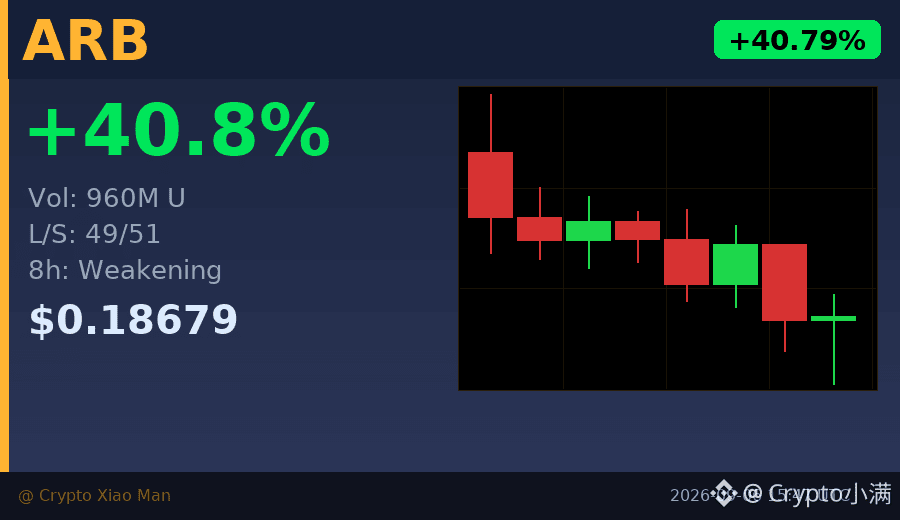
ARB surged 40.79% today, with trading volume jumping to 960 million U, yet longs and shorts are almost evenly matched — 49% long vs 51% short. This kind of sharp rally without overcrowding is rare.
However, over the past 8 hours, the candlestick trend has been weakening, pulling back from the high of 0.206 to around 0.186. Buyers are retreating, but bears have not entered aggressively either.
My take: this rally looks more like a push driven by short-term funds and has not yet formed true consensus. Chasing the move is risky; wait until the direction becomes clear.
$ARB #ARB #40.79%
Click the card below to quickly check the market👇
40% increase, but the funding rate is only 0.01%?
ARB surged 40.79% today, with trading volume jumping to 960 million U, yet longs and shorts are almost evenly matched — 49% long vs 51% short. This kind of sharp rally without overcrowding is rare.
However, over the past 8 hours, the candlestick trend has been weakening, pulling back from the high of 0.206 to around 0.186. Buyers are retreating, but bears have not entered aggressively either.
My take: this rally looks more like a push driven by short-term funds and has not yet formed true consensus. Chasing the move is risky; wait until the direction becomes clear.
$ARB #ARB #40.79%
Click the card below to quickly check the market👇
ARB surged 40.79% today, with trading volume jumping to 960 million U, yet longs and shorts are almost evenly matched — 49% long vs 51% short. This kind of sharp rally without overcrowding is rare.
However, over the past 8 hours, the candlestick trend has been weakening, pulling back from the high of 0.206 to around 0.186. Buyers are retreating, but bears have not entered aggressively either.
My take: this rally looks more like a push driven by short-term funds and has not yet formed true consensus. Chasing the move is risky; wait until the direction becomes clear.
$ARB #ARB #40.79%
Click the card below to quickly check the market👇
11
·
--
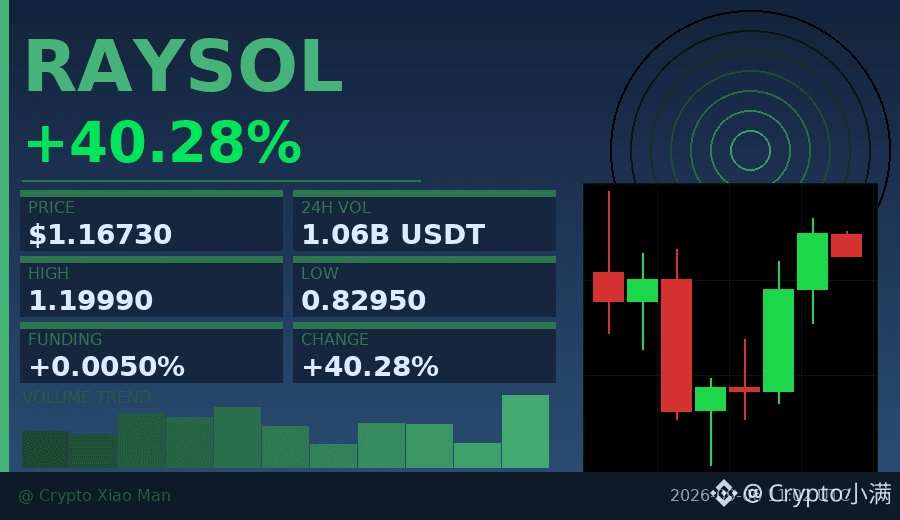
40% increase, $106 million in trading volume—RAYSOL moved too fast today.
Price was pulled up from 0.83 all the way to 1.1999, with bulls accounting for 58%, and market sentiment clearly leaning bullish.
But funding is only 0.005%, which means leverage is not yet overheated.
In the short term, it’s consolidating in the 1.12-1.17 range, waiting for a directional choice.
After such a sharp rally followed by sideways movement, it will either continue breaking out or pull back to confirm support.
$RAYSOL #强势突破 #40% increase
Click the small card below to quickly view the market 👇
40% increase, $106 million in trading volume—RAYSOL moved too fast today.
Price was pulled up from 0.83 all the way to 1.1999, with bulls accounting for 58%, and market sentiment clearly leaning bullish.
But funding is only 0.005%, which means leverage is not yet overheated.
In the short term, it’s consolidating in the 1.12-1.17 range, waiting for a directional choice.
After such a sharp rally followed by sideways movement, it will either continue breaking out or pull back to confirm support.
$RAYSOL #强势突破 #40% increase
Click the small card below to quickly view the market 👇
Price was pulled up from 0.83 all the way to 1.1999, with bulls accounting for 58%, and market sentiment clearly leaning bullish.
But funding is only 0.005%, which means leverage is not yet overheated.
In the short term, it’s consolidating in the 1.12-1.17 range, waiting for a directional choice.
After such a sharp rally followed by sideways movement, it will either continue breaking out or pull back to confirm support.
$RAYSOL #强势突破 #40% increase
Click the small card below to quickly view the market 👇
70

·
--
Bearish
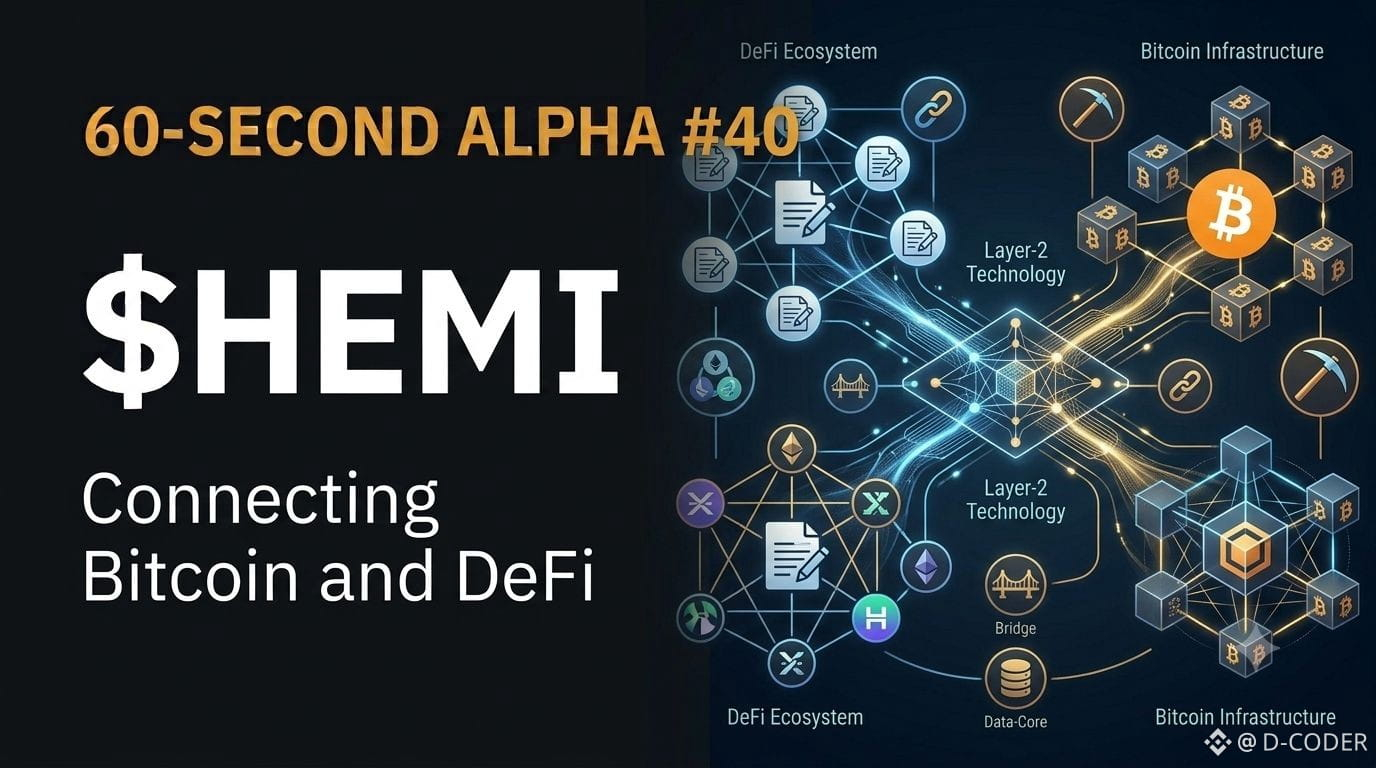
60-SECOND ALPHA #40 | $HEMI
$HEMI is a useful example of the growing focus on Bitcoin interoperability and Layer-2 infrastructure. Instead of treating Bitcoin only as an asset to hold, projects like Hemi explore ways to build more functionality around it.
Alpha: The next stage of blockchain adoption may be about connecting existing networks, not replacing them.
{future}(HEMIUSDT)
60-SECOND ALPHA #40 | $HEMI
$HEMI is a useful example of the growing focus on Bitcoin interoperability and Layer-2 infrastructure. Instead of treating Bitcoin only as an asset to hold, projects like Hemi explore ways to build more functionality around it.
Alpha: The next stage of blockchain adoption may be about connecting existing networks, not replacing them.
$HEMI is a useful example of the growing focus on Bitcoin interoperability and Layer-2 infrastructure. Instead of treating Bitcoin only as an asset to hold, projects like Hemi explore ways to build more functionality around it.
Alpha: The next stage of blockchain adoption may be about connecting existing networks, not replacing them.
237

·
--
VVV This move is kind of interesting. On the 15m it pumped 0.99%, but OI actually kept shrinking, with contracts -0.09% and -0.26% over the past hour.
This kind of price-up-while-open-interest-down move doesn’t look like fresh money forcefully pushing it higher. It looks more like shorts getting squeezed, with short-term covering driving the momentum. The order book buy/sell ratio is 1.11, and active trade imbalance is 5.3%, so funds are leaning toward active buying, but there’s no sign of incremental positions following through.
Volume expanded to 1.38x, and price directly broke above the upper range of the last 20 five-minute candles. Volatility Z-score is 2.84, so the short-term move is definitely a bit “aggressive.” The anomaly percentile reached 88.3%, and it ranks near the top of the overall pool. The notional change is even at the #40 level, which suggests this is a focal name in the current pool.
But if OI isn’t cooperating, the quality of this breakout has to be questioned. Either it’s just an inertia spike after weak hands got stopped out, or the big players are still probing the market and waiting for a real increase in positions to confirm. 24h volume is 21.88M, and the float isn’t large, so if it really starts to trade heavily, the direction could get extreme.
For now, just watch it and don’t rush to chase. If price isn’t moving and positions aren’t increasing, it’s better not to trade than to be the last one in.
VVV This move is kind of interesting. On the 15m it pumped 0.99%, but OI actually kept shrinking, with contracts -0.09% and -0.26% over the past hour.
This kind of price-up-while-open-interest-down move doesn’t look like fresh money forcefully pushing it higher. It looks more like shorts getting squeezed, with short-term covering driving the momentum. The order book buy/sell ratio is 1.11, and active trade imbalance is 5.3%, so funds are leaning toward active buying, but there’s no sign of incremental positions following through.
Volume expanded to 1.38x, and price directly broke above the upper range of the last 20 five-minute candles. Volatility Z-score is 2.84, so the short-term move is definitely a bit “aggressive.” The anomaly percentile reached 88.3%, and it ranks near the top of the overall pool. The notional change is even at the #40 level, which suggests this is a focal name in the current pool.
But if OI isn’t cooperating, the quality of this breakout has to be questioned. Either it’s just an inertia spike after weak hands got stopped out, or the big players are still probing the market and waiting for a real increase in positions to confirm. 24h volume is 21.88M, and the float isn’t large, so if it really starts to trade heavily, the direction could get extreme.
For now, just watch it and don’t rush to chase. If price isn’t moving and positions aren’t increasing, it’s better not to trade than to be the last one in.
This kind of price-up-while-open-interest-down move doesn’t look like fresh money forcefully pushing it higher. It looks more like shorts getting squeezed, with short-term covering driving the momentum. The order book buy/sell ratio is 1.11, and active trade imbalance is 5.3%, so funds are leaning toward active buying, but there’s no sign of incremental positions following through.
Volume expanded to 1.38x, and price directly broke above the upper range of the last 20 five-minute candles. Volatility Z-score is 2.84, so the short-term move is definitely a bit “aggressive.” The anomaly percentile reached 88.3%, and it ranks near the top of the overall pool. The notional change is even at the #40 level, which suggests this is a focal name in the current pool.
But if OI isn’t cooperating, the quality of this breakout has to be questioned. Either it’s just an inertia spike after weak hands got stopped out, or the big players are still probing the market and waiting for a real increase in positions to confirm. 24h volume is 21.88M, and the float isn’t large, so if it really starts to trade heavily, the direction could get extreme.
For now, just watch it and don’t rush to chase. If price isn’t moving and positions aren’t increasing, it’s better not to trade than to be the last one in.
2
·
--
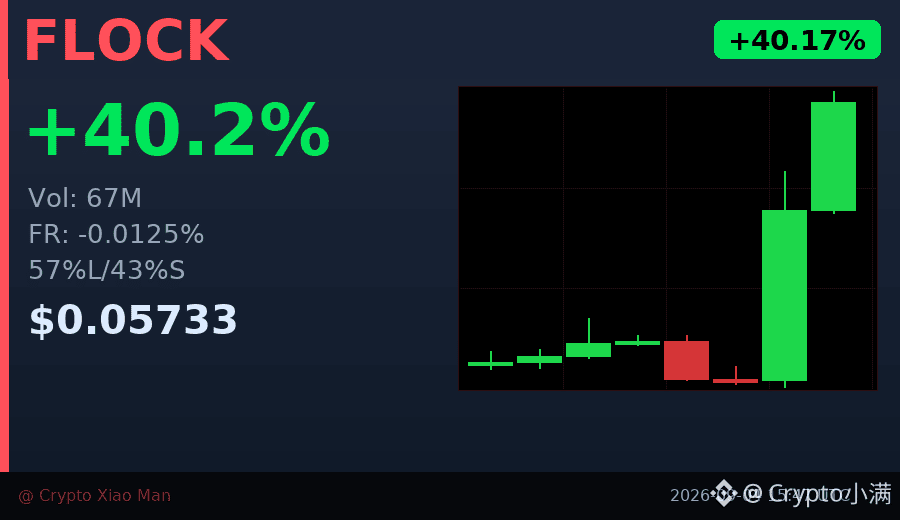
Behind the 40% surge, funds are quietly flowing out—FLOCK’s current negative funding rate of -0.0125% shows that while longs are pushing the price up, the number of traders actually willing to pay to hold long positions is decreasing.
After three consecutive hours of bullish candles, trading volume jumped from the 10-million range to 440 million. This kind of volume-driven rally is usually accompanied by short-term profit taking.
Longs account for 57%, but the funding rate turning negative is a warning sign: when price hits new highs, crowded longs are often vulnerable.
I’ll watch for support in the 0.052-0.055 range; if it breaks below that, it may retest 0.048.
$FLOCK #资金费率背离 #40%
Click the small card below to quickly view the market👇
Behind the 40% surge, funds are quietly flowing out—FLOCK’s current negative funding rate of -0.0125% shows that while longs are pushing the price up, the number of traders actually willing to pay to hold long positions is decreasing.
After three consecutive hours of bullish candles, trading volume jumped from the 10-million range to 440 million. This kind of volume-driven rally is usually accompanied by short-term profit taking.
Longs account for 57%, but the funding rate turning negative is a warning sign: when price hits new highs, crowded longs are often vulnerable.
I’ll watch for support in the 0.052-0.055 range; if it breaks below that, it may retest 0.048.
$FLOCK #资金费率背离 #40%
Click the small card below to quickly view the market👇
After three consecutive hours of bullish candles, trading volume jumped from the 10-million range to 440 million. This kind of volume-driven rally is usually accompanied by short-term profit taking.
Longs account for 57%, but the funding rate turning negative is a warning sign: when price hits new highs, crowded longs are often vulnerable.
I’ll watch for support in the 0.052-0.055 range; if it breaks below that, it may retest 0.048.
$FLOCK #资金费率背离 #40%
Click the small card below to quickly view the market👇
236
·
--
$LIGHT Now this trend has got something going on 🚨
In 15 minutes it surged 1.85%, and the volume picked up to more than 2.5x. The volatility Z-score is almost at 4—this isn’t the kind of move retail traders with their small amounts can knock out.
Most importantly, the OI is rising in sync. In the 15-minute window, the notional change is +84K; in the 1-hour window, it’s also +97K. This combination of “price up + open interest increasing” is basically new leveraged longs putting real money in—this isn’t the kind of pseudo-rally caused by short covering. And notice the active trade imbalance: the difference is 22.6%, and the buy/sell ratio is 1.58. Direction is extremely clear.
Price has already broken above the upper boundary of the range formed by the last ~20 five-minute candlesticks, plus the whole-pool abnormal ranking is #15 and notional change ranking is #40. This move really does have the flavor of abnormal capital.
But then again, with LIGHT’s liquidity level, the total float over 24 hours is only 9.68M. If it’s pushed up, it can also be dropped quickly. Right now, what’s being tested isn’t nerve, it’s discipline. Keep an eye on OI—once it turns, the story is over.
$LIGHT Now this trend has got something going on 🚨
In 15 minutes it surged 1.85%, and the volume picked up to more than 2.5x. The volatility Z-score is almost at 4—this isn’t the kind of move retail traders with their small amounts can knock out.
Most importantly, the OI is rising in sync. In the 15-minute window, the notional change is +84K; in the 1-hour window, it’s also +97K. This combination of “price up + open interest increasing” is basically new leveraged longs putting real money in—this isn’t the kind of pseudo-rally caused by short covering. And notice the active trade imbalance: the difference is 22.6%, and the buy/sell ratio is 1.58. Direction is extremely clear.
Price has already broken above the upper boundary of the range formed by the last ~20 five-minute candlesticks, plus the whole-pool abnormal ranking is #15 and notional change ranking is #40. This move really does have the flavor of abnormal capital.
But then again, with LIGHT’s liquidity level, the total float over 24 hours is only 9.68M. If it’s pushed up, it can also be dropped quickly. Right now, what’s being tested isn’t nerve, it’s discipline. Keep an eye on OI—once it turns, the story is over.
In 15 minutes it surged 1.85%, and the volume picked up to more than 2.5x. The volatility Z-score is almost at 4—this isn’t the kind of move retail traders with their small amounts can knock out.
Most importantly, the OI is rising in sync. In the 15-minute window, the notional change is +84K; in the 1-hour window, it’s also +97K. This combination of “price up + open interest increasing” is basically new leveraged longs putting real money in—this isn’t the kind of pseudo-rally caused by short covering. And notice the active trade imbalance: the difference is 22.6%, and the buy/sell ratio is 1.58. Direction is extremely clear.
Price has already broken above the upper boundary of the range formed by the last ~20 five-minute candlesticks, plus the whole-pool abnormal ranking is #15 and notional change ranking is #40. This move really does have the flavor of abnormal capital.
But then again, with LIGHT’s liquidity level, the total float over 24 hours is only 9.68M. If it’s pushed up, it can also be dropped quickly. Right now, what’s being tested isn’t nerve, it’s discipline. Keep an eye on OI—once it turns, the story is over.
196
Log in to explore more content
Join global crypto users on Binance Square
⚡️ Get latest and useful information about crypto.
💬 Trusted by the world’s largest crypto exchange.
👍 Discover real insights from verified creators.
Email / Phone number
Trending Topics
1
#AIStocksWhatNext
1.1M views
7,230 Discussing
2
#SpotBitcoinETFsInflow$2.31BInFourDays
10 views
3 Discussing
3
#BitcoinRejectedAt$87,300Twice
0 views
0 Discussing
4
#BCHJumps28%OnCMEFuturesListing
31,946 views
762 Discussing
5
#WallStreetEarningsRevisionsTurnBearish
22,955 views
559 Discussing
6
#DollarIndexReclaims101
19,157 views
491 Discussing
7
#21SharesLaunchesEuropesFirstZcashETP
61,242 views
1,255 Discussing
8
#CardanoJoinsX402PaymentStandard
37,448 views
888 Discussing
9
#BitcoinTops$87KAtEightMonthHigh
15,371 views
136 Discussing
10
#ZECBreaksAbove$1600AtRecordHigh
10,934 views
112 Discussing